 Miao Wang1†
 Menglin Shi1†
 Yiming Ding1Zishanbai Zhang1Yuze Ge2Zhixin Li3
 Yixin Jing1Honglian Hu1
 Xiaohong Chen1*‡
- 1Department of Otolaryngology-Head and Neck Surgery, Beijing Tongren Hospital, Capital Medical University, Beijing, China
- 2Department of Biochemistry and Molecular Biology, Capital Medical University, Beijing, China
- 3Department of Oncology Center, Beijing Tongren Hospital, Capital Medical University, Beijing, China
Purpose: Neoadjuvant chemo-immunotherapy (NACI) has demonstrated significant clinical advantages in head and neck squamous cell carcinomas (HNSCC), while clinical responses vary in different patients. This study investigated the correlation between the cyclic GMP-AMP synthase (cGAS, CGAS) and the stimulator of interferon genes (STING, STING1) expressions and the efficacy of NACI in HNSCC.
Methods: The correlation between CGAS and STING1 expressions and chemotherapy/immunotherapy drug sensitivity was analyzed using the GDSC and TCIA dataset. The study enrolled 38 HNSCC patients receiving NACI, with protein expressions of cGAS and STING evaluated via immunohistochemistry. The T cell abundance and tumor-T cell interactions in different CGAS and STING1 expression groups were analyzed using bulk RNA-seq and scRNA-seq data from open databases.
Results: The mRNA expressions of CGAS and STING1 were negatively correlated with the IC50 of docetaxel and positively correlated with the efficacy of anti-PD-1 treatment (p<0.05). In the real-world cohort, cGAS and STING expressions were both positively related to NACI efficacy (p<0.05). The mRNA expressions of CGAS and STING1 were positively correlated with the abundance of Act-CD4 (CGAS: rho=0.416, p<2.21e-16; STING1: rho=0.26, p=1.82e-09), Act-CD8 (CGAS: rho=0.089, p=0.0425; STING1: rho=0.303, p=1.98e-12), NKT cell (CGAS: rho=0.255, p=0.3.78e-09; STING1: rho=0.375, p=2.2e-6). Tumor cells with increased expression of CGAS or STING1 showed enhanced interactions with T cells.
Conclusion: This study confirms the positive correlation between cGAS and STING expressions and NACI efficacy, suggesting their role in immune activation and potential as biomarkers for predicting NACI efficacy in HNSCC.
1 Introduction
Head and neck cancer ranks as the eighth most prevalent malignancy globally, with an estimated 890,000 new cases and 450,000 deaths annually in 2022. Among these, head and neck squamous cell carcinomas (HNSCC) are the most common type (1). The combination of surgery, chemotherapy, and radiation therapy maximizes treatment efficacy, yet the 5-year overall survival (OS) remains only 50%. Once the disease has recurred, the 1-year OS rate is approximately 15%, with a median OS of 10 to 14 months (2). In recent years, the rise of immunotherapy has significantly improved patient outcomes. KEYNOTE 040, CheckMate 141, and KEYNOTE 048 trials have shown that immunotherapy demonstrates encouraging efficacy in metastatic/recurrent (R/M) HNSCC, with response rates ranging from 15% to 23% (3–5). Previous preclinical studies suggest that immunotherapy is more effective in the neoadjuvant setting than the adjuvant setting (6). Multiple trials on NACI can achieve a pathological complete response rate of approximately 33.3% to 55.6% in HNSCC patients (7–9). Therefore, identifying predictive biomarkers for therapeutic efficacy to select patient subgroups amenable to precision treatments has become a critical priority in NACI.
The stimulator of interferon genes (STING, STING1) pathway, activated by the cyclic GMP-AMP synthase (cGAS, CGAS) detection of aberrant double-stranded DNA (dsDNA), leading to a type-I interferon (IFN) response (10). The most effective regimen for neoadjuvant treatment of locally advanced HNSCC is confirmed as chemotherapy combined with immunotherapy (11). Chemotherapeutic agents, such as cisplatin, can activate the STING pathway, enhance cytotoxic T cell infiltration and increasing sensitivity to immunotherapy (12, 13). However, STING knockout has been demonstrated to significantly enhance resistance to cisplatin in HNSCC (14). Moreover, deletion of cGAS and STING reverses the anti-tumor effects of chemo-immunotherapy in small cell lung cancer (15). These findings suggest that the expression levels of cGAS and STING may serve as predictive biomarkers for response to chemo-immunotherapy.
This study evaluates the association between cGAS-STING expression and NACI efficacy in HNSCC. It also explores the immunological function of cGAS-STING and its potential as a predictive biomarker for therapeutic response.
2 Materials and methods
2.1 Open-database sources
CGAS and STING1 expression levels in HNSCC from The Cancer Genome Atlas database (TCGA, http://portal.gdc.cancer.gov/) were analyzed. Regarding the high/low grouping, we dichotomized samples into high-expression and low-expression groups using the median value. The correlation between CGAS and STING expression and IC50 values for common chemotherapeutic drugs (cisplatin, docetaxel, and 5-Fluorouracil) was analyzed using the Genomics of Drug Sensitivity in Cancer (GDSC, http://www.cancerrxgene.org/) and processed with the R package ‘oncoPredict. Additionally, immunotherapy data from The Cancer Immunome Atlas (TCIA, http://tcia.at/) was analyzed to assess the effectiveness of immunotherapy between the cGAS-STING high and low expression groups within the TCGA-HNSC cohort. The correlation between cGAS and STING expression and the abundance of immune cells was analyzed by TISIDB (http://cis.hku.hk/TISIDB/). Tumor-T cell interactions were explored using scRNA-seq data from the GEO database.
2.2 Clinical patients
This study enrolled HNSCC patients who received NACI at Beijing Tongren Hospital, Capital Medical University. Between June 2019 and April 2024, 38 patients received NACI. Eligibility criteria were as follows: (1) age ≥18 years, (2) pathologically confirmed squamous cell carcinoma, (3) no prior treatments before neoadjuvant therapy, and (4) at least one measurable or evaluable lesion according to Response Evaluation Criteria in Solid Tumors 1.1 (RECIST 1.1) (16).
2.3 Data collection
Clinicopathological characteristics, including age, gender, anatomical subsite, TNM staging (according to the 8th edition of the American Joint Committee on Cancer Staging Manual), histological classification (poorly, moderately, well differentiated), smoking history, and alcohol consumption, were retrieved from the medical records system at Beijing Tongren Hospital, Capital Medical University.
2.4 Treatment regimes
The NACI group received pembrolizumab or tislelizumab in combination with the TP, PF, or TPF regimens. The TP regimen comprised paclitaxel 135 mg/m² and cisplatin 100 mg/m² on day 1, while the TPF regimen incorporated 5-fluorouracil 1000 mg/m² from days 1 to 5. The PF regimen consisted of cisplatin 100 mg/m² on day 1 and 5-fluorouracil 1000 mg/m² from days 1 to 5.
2.5 Efficacy assessment
The efficacy of NACI was evaluated based on the clinical and pathological responses. Clinical responses were evaluated based on radiologic evaluation of tumor size by magnetic resonance imaging (MRI) before and after neoadjuvant therapy according to RECIST, version 1.1 (16). Patients were classified as responders (complete response (CR) plus partial response (PR)) or non-responders (stable disease (SD)), and progressive disease (PD). Pathological responses were evaluated based on the percentage of residual viable tumor (RVT). We classified patients into major pathologic response (MPR) (defined as ≤10% RVT in the resected tumor specimen, including pathological complete response (pCR) (no RVT)), or incomplete pathologic response (IPR; defined as >10% RVT in the resected tumor specimens.
2.6 IHC analysis
Fixed tissue samples were deparaffinized with xylene and graded ethanol, followed by antigen retrieval using EDTA (pH 9.0) or sodium citrate buffer (pH 6.0). Samples were then treated with 30% hydrogen peroxide for 10 minutes at room temperature, blocked with goat serum for 1 hour at 37°C, and incubated overnight at 4°C with primary antibodies: cGAS (Cell Signaling Technology, 79978S, 1:100), STING (ProteinTech, 19851-1-AP, 1:2000). Horseradish peroxidase activity was detected using a PV two-step IHC kit. Negative controls used rabbit or mouse IgG. Staining intensity was analyzed using ImageJ software, and images were captured using a Leica microscope.
2.7 Statistical analysis
Data are presented as mean ± SD or mean ± SEM unless otherwise stated. To assess the predictive performance of cGAS and STING, receiver operating characteristic (ROC) curves were constructed, and the areas under the curves (AUCs) were calculated. ROC curves were plotted using the ‘pROC’ package. Group comparisons were performed using a two-tailed unpaired Student’s t-test. A p-value of less than 0.05 was considered statistically significant. All analyses were conducted using GraphPad Prism 8.3.0 or R 4.2.3 software.
3 Results
3.1 cGAS-STING expressions were positively related to chemotherapy and immunotherapy efficacy in TCGA-HNSC cohort
Sensitivity differences of cisplatin, docetaxel, and 5-fluorouracil in the TCGA-HNSC cohort was conducted. Higher IC50 values indicate worse chemotherapy efficacy. The results showed that the CGAS high-expression group had lower IC50 values of cisplatin and docetaxel, suggesting increased sensitivity to these chemotherapy treatments (Figure 1A). No significant difference in 5-fluorouracil treatment response was observed between high- and low-expression groups (Figure 1A). Additionally, elevated STING1 expression was related to higher docetaxel sensitivity, and was not associated with the efficacy of cisplatin and 5-fluorouracil (Figure 1B).
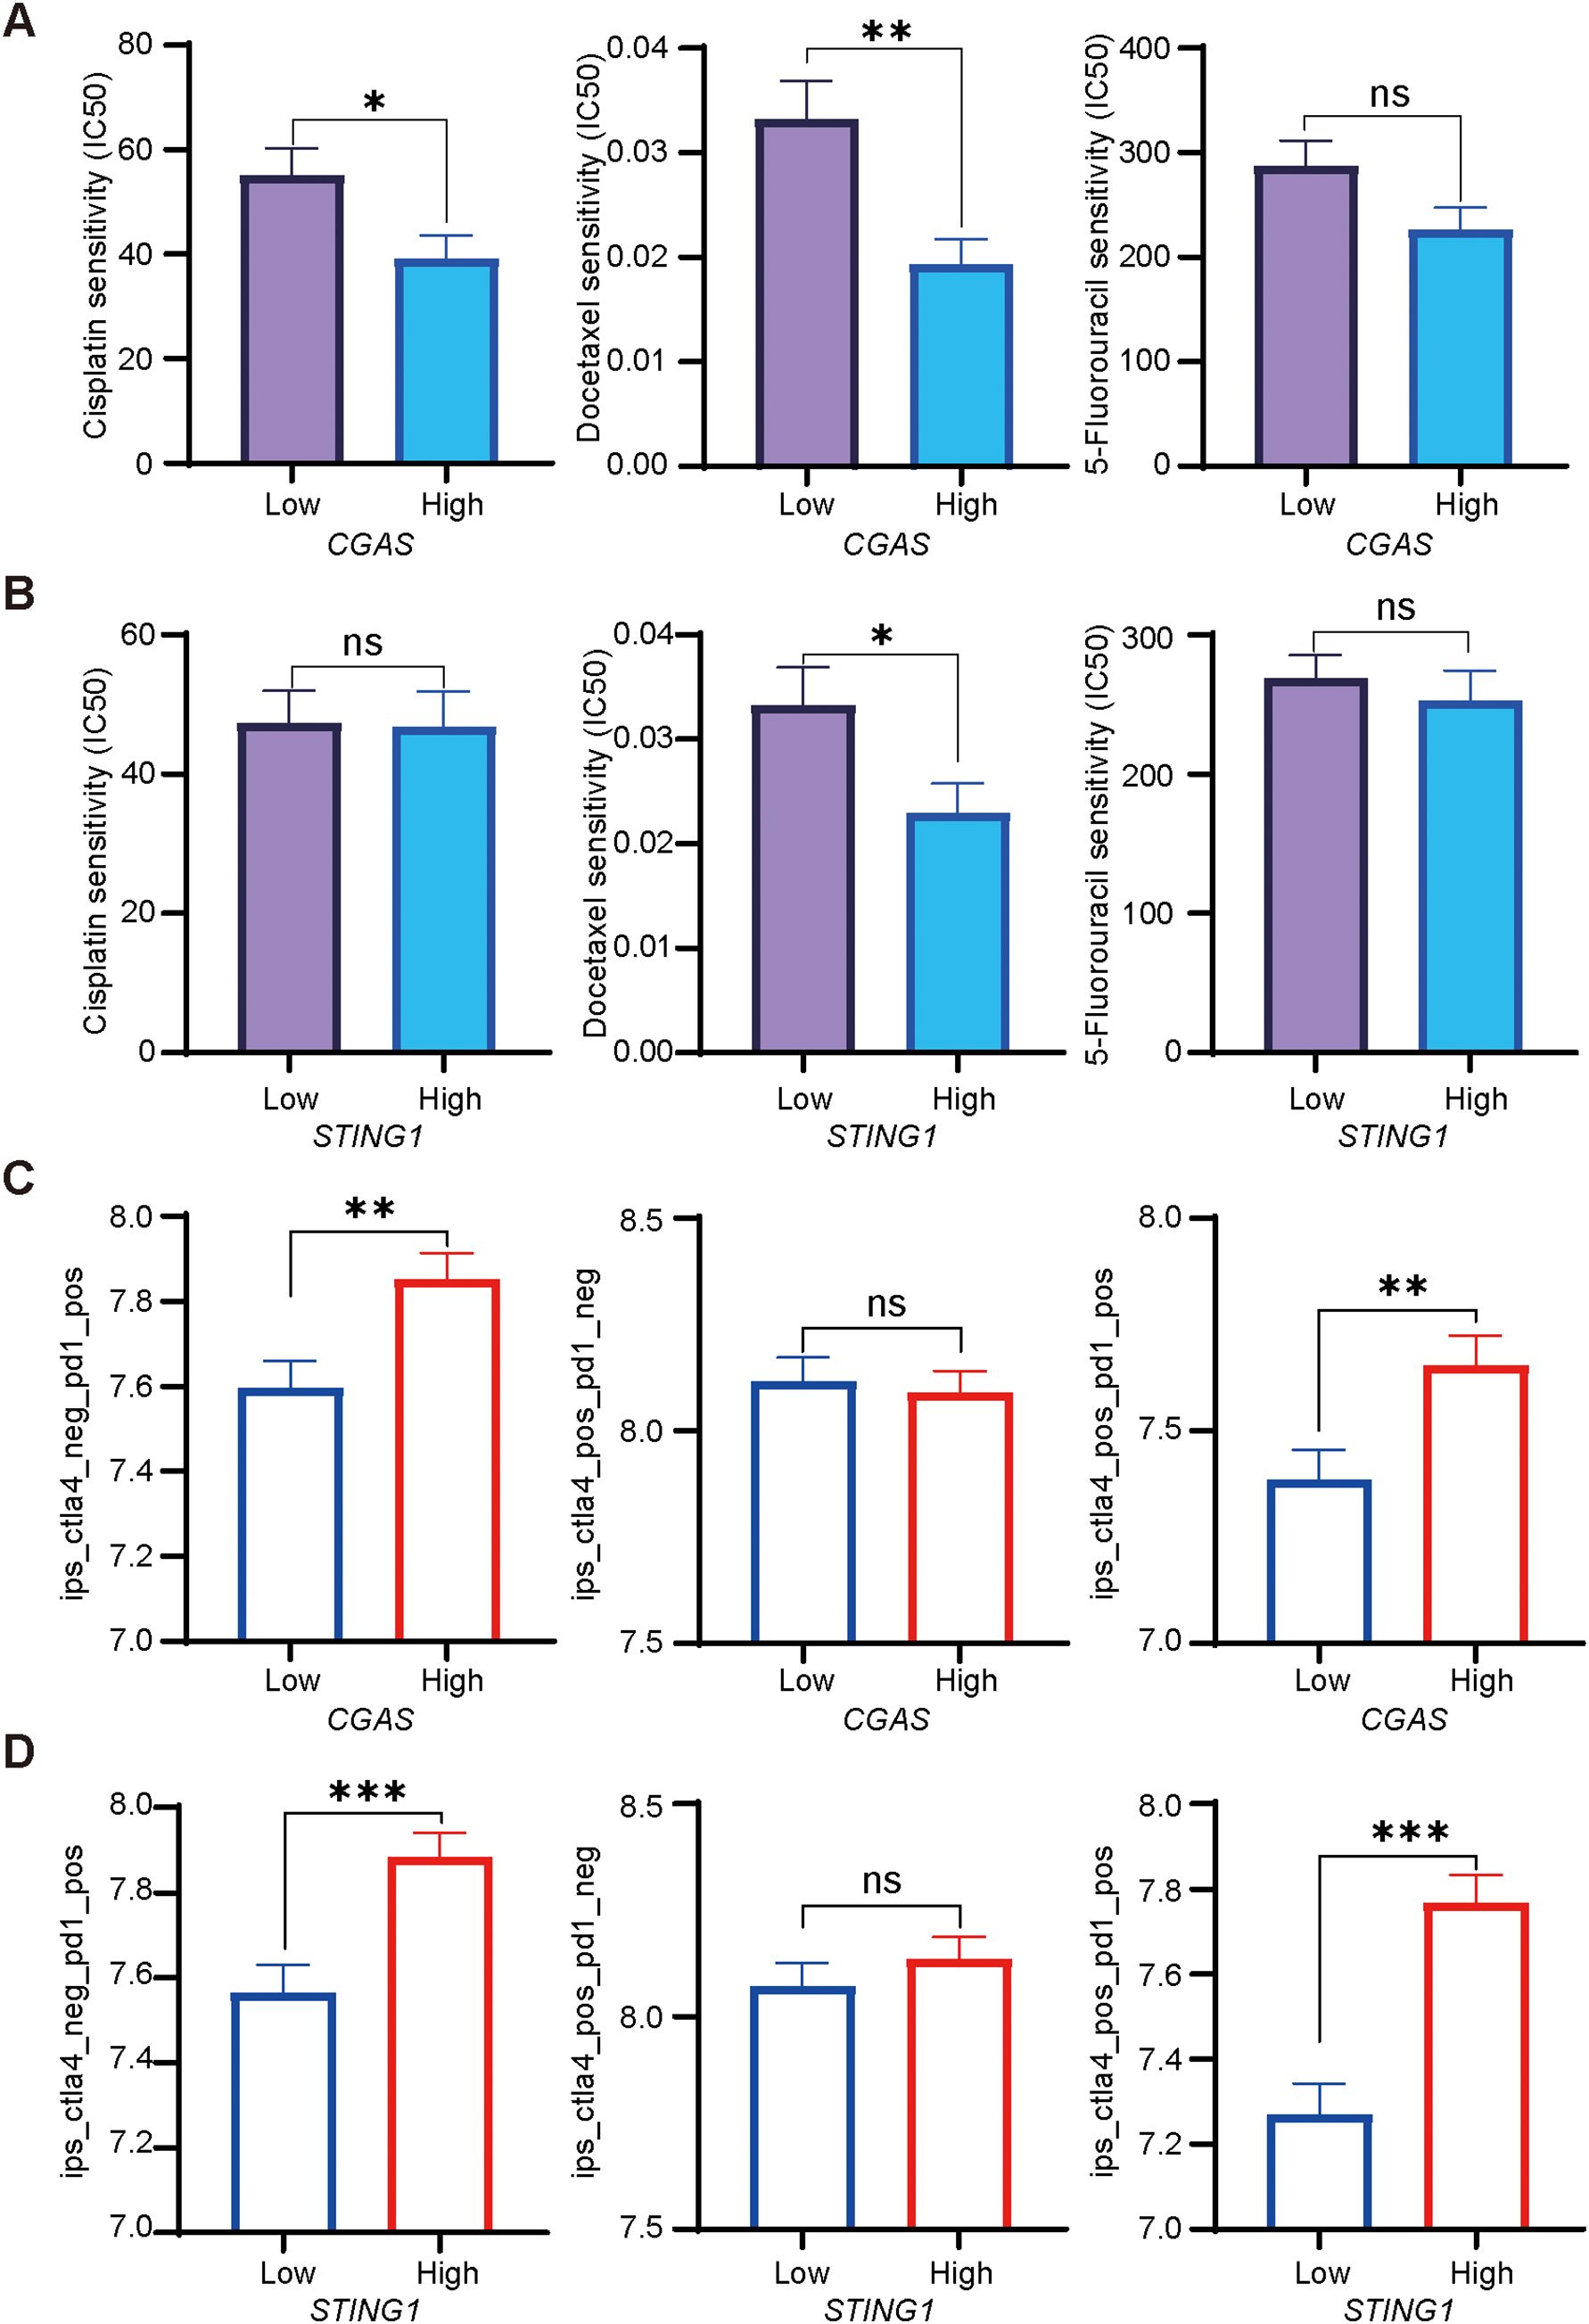
Figure 1. Chemotherapeutic and immunotherapy responses based on cGAS-STING expression in HNSCC. (A, B). Relationships between high and low CGAS or STING1 expression groups and IC50 of cisplatin, docetaxel, and 5-fluorouracil. (C, D). The IPS assessment of anti-PD-1, anti-CTLA-4, and their combination therapies, analyzing the differences between patients with high and low CGAS and STING1 expression groups. PD-1, programmed cell death protein 1; CTLA-4, cytotoxic T lymphocyte antigen 4. *p<0.05, **p<0.01, ***p<0.001.
To assess the predictive value of cGAS-STING pathway expression for immunotherapy, we evaluated the IPS scores for anti-programmed cell death protein 1 (PD-1) and anti-cytotoxic T lymphocyte antigen 4 (CTLA-4) therapies. Higher scores indicate better outcomes. Individuals with elevated CGAS expression showed higher IPS scores for anti-PD-1 monotherapy alone or combined with anti-CTLA-4 treatment, suggesting a stronger response (Figure 1C). High STING1 expression was associated with increased IPS for anti-PD-1 alone or combined with anti-CTLA-4 treatment (Figure 1D).
3.2 cGAS and STING expression levels were positively correlated with NACI response in HNSCC patients
Based on our analysis suggesting that cGAS and STING may influence chemotherapy and immunotherapy efficacy, we established a retrospective cohort of HNSCC patients treated with NACI to further investigate our findings. Baseline characteristics are presented in Table 1. A total of 38 patients were enrolled and received NACI therapy, 31 of whom proceeded to surgical resection, while 7 received non-surgical therapy. Among the 19 responders, 10 achieved pathological complete response (pCR). Over 75% had a history of smoking or alcohol use. The most common primary tumor sites were the hypopharynx (50.00%), followed by oropharynx (23.68%), larynx (21.05%), and nasal cavity and sinus (5.26%). Histological classification included poorly differentiated (44.74%), moderately differentiated (31.58%), and well differentiated (7.89%). A significant majority (86.84%) had advanced disease (stages III and IV).
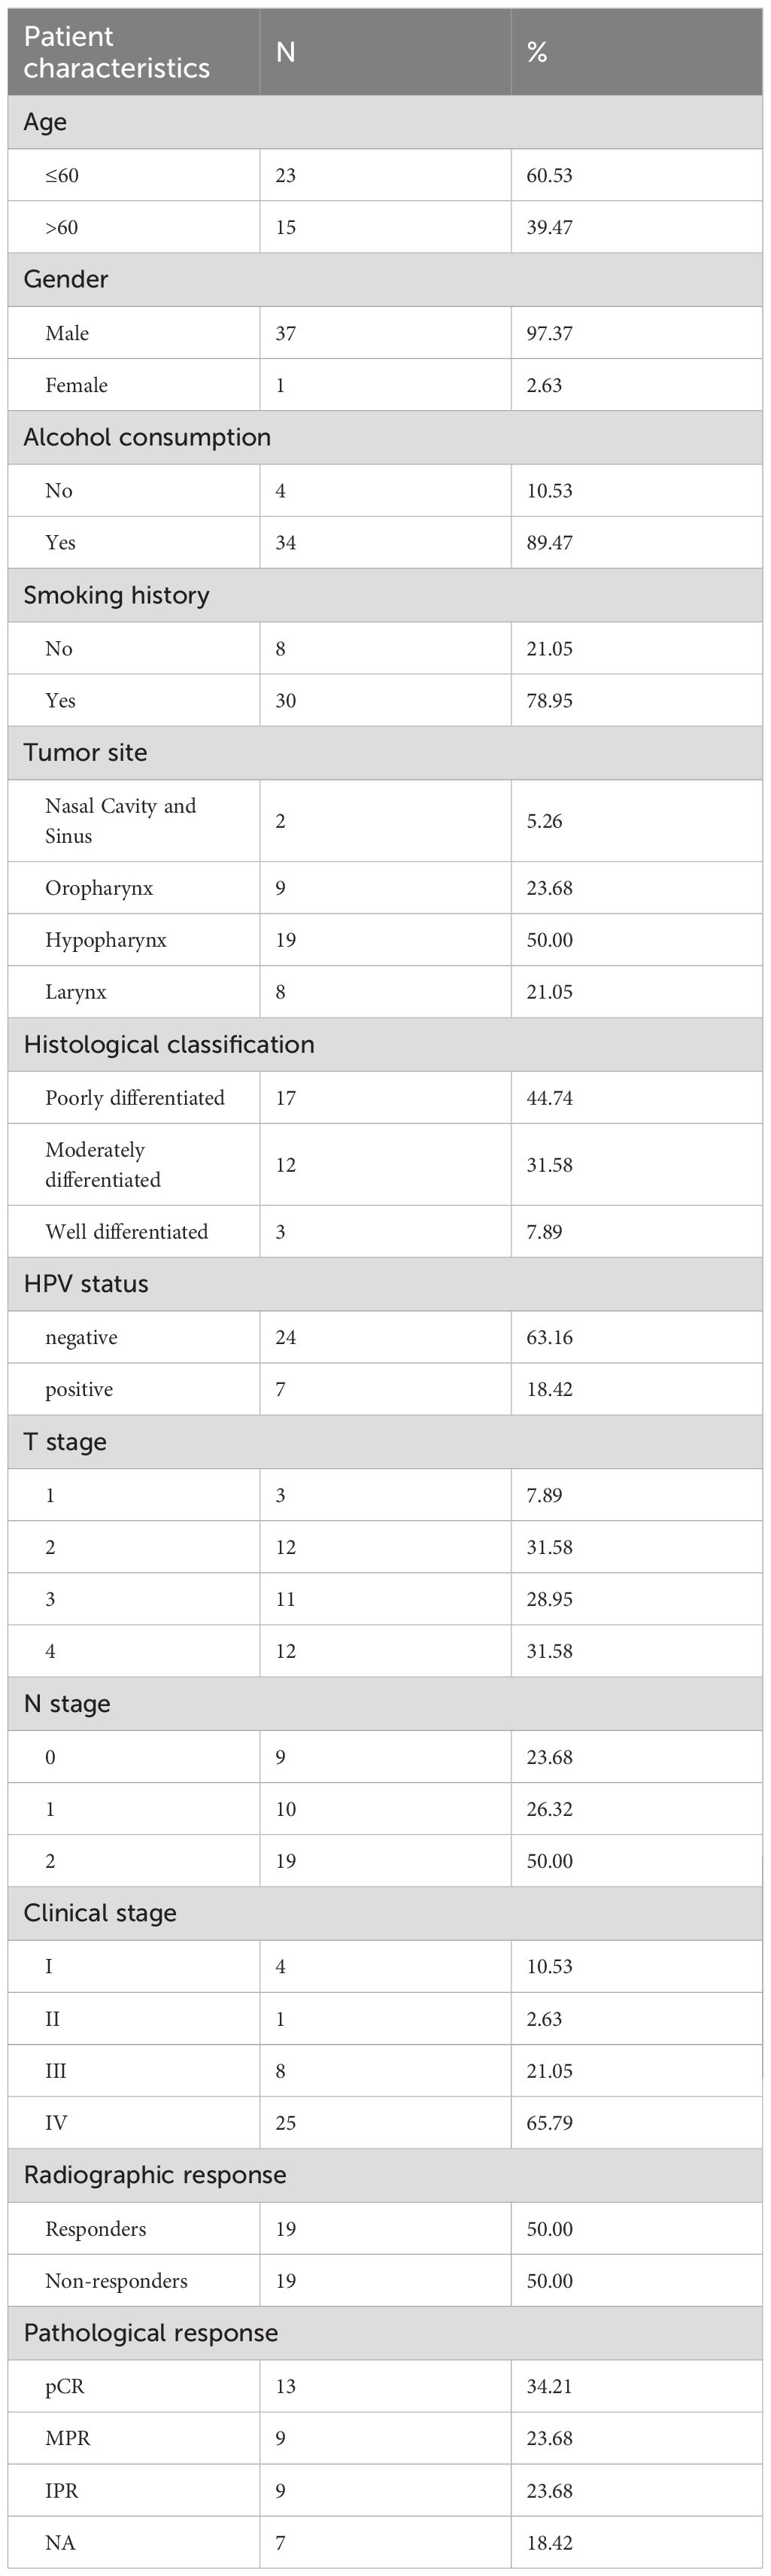
Table 1. Baseline characteristics of patients treated with neoadjuvant chemo-immunotherapy.
Tumor samples were collected from the patients before receiving NACI treatment, and expression levels of cGAS and STING in tumor cells were evaluated by performing immunohistochemistry. The protein levels of cGAS and STING were not associated with clinical characteristics including HPV status (Supplementary Table S1). Notably, we found that cGAS and STING expression levels were significantly higher in responders than in non-responders (Figures 2A–C). To better assess the contribution of cGAS and STING to the efficacy of NACI, we evaluated the pathological responses based on the percentage of RVT cells. As anticipated, the expression of cGAS or STING had a higher level in the patients with MPR than in those with IPR (Figures 2A, B). Additionally, clinical characteristics of these patients has no relationship with the response to NACI (Supplementary Table S2). To date, the CPS score has been developed to predict the response to anti-PD-1 therapy in cancer patients (4), while our results demonstrated the expression levels of PD-L1 CPS expression did not significantly correlate (Figure 2D).
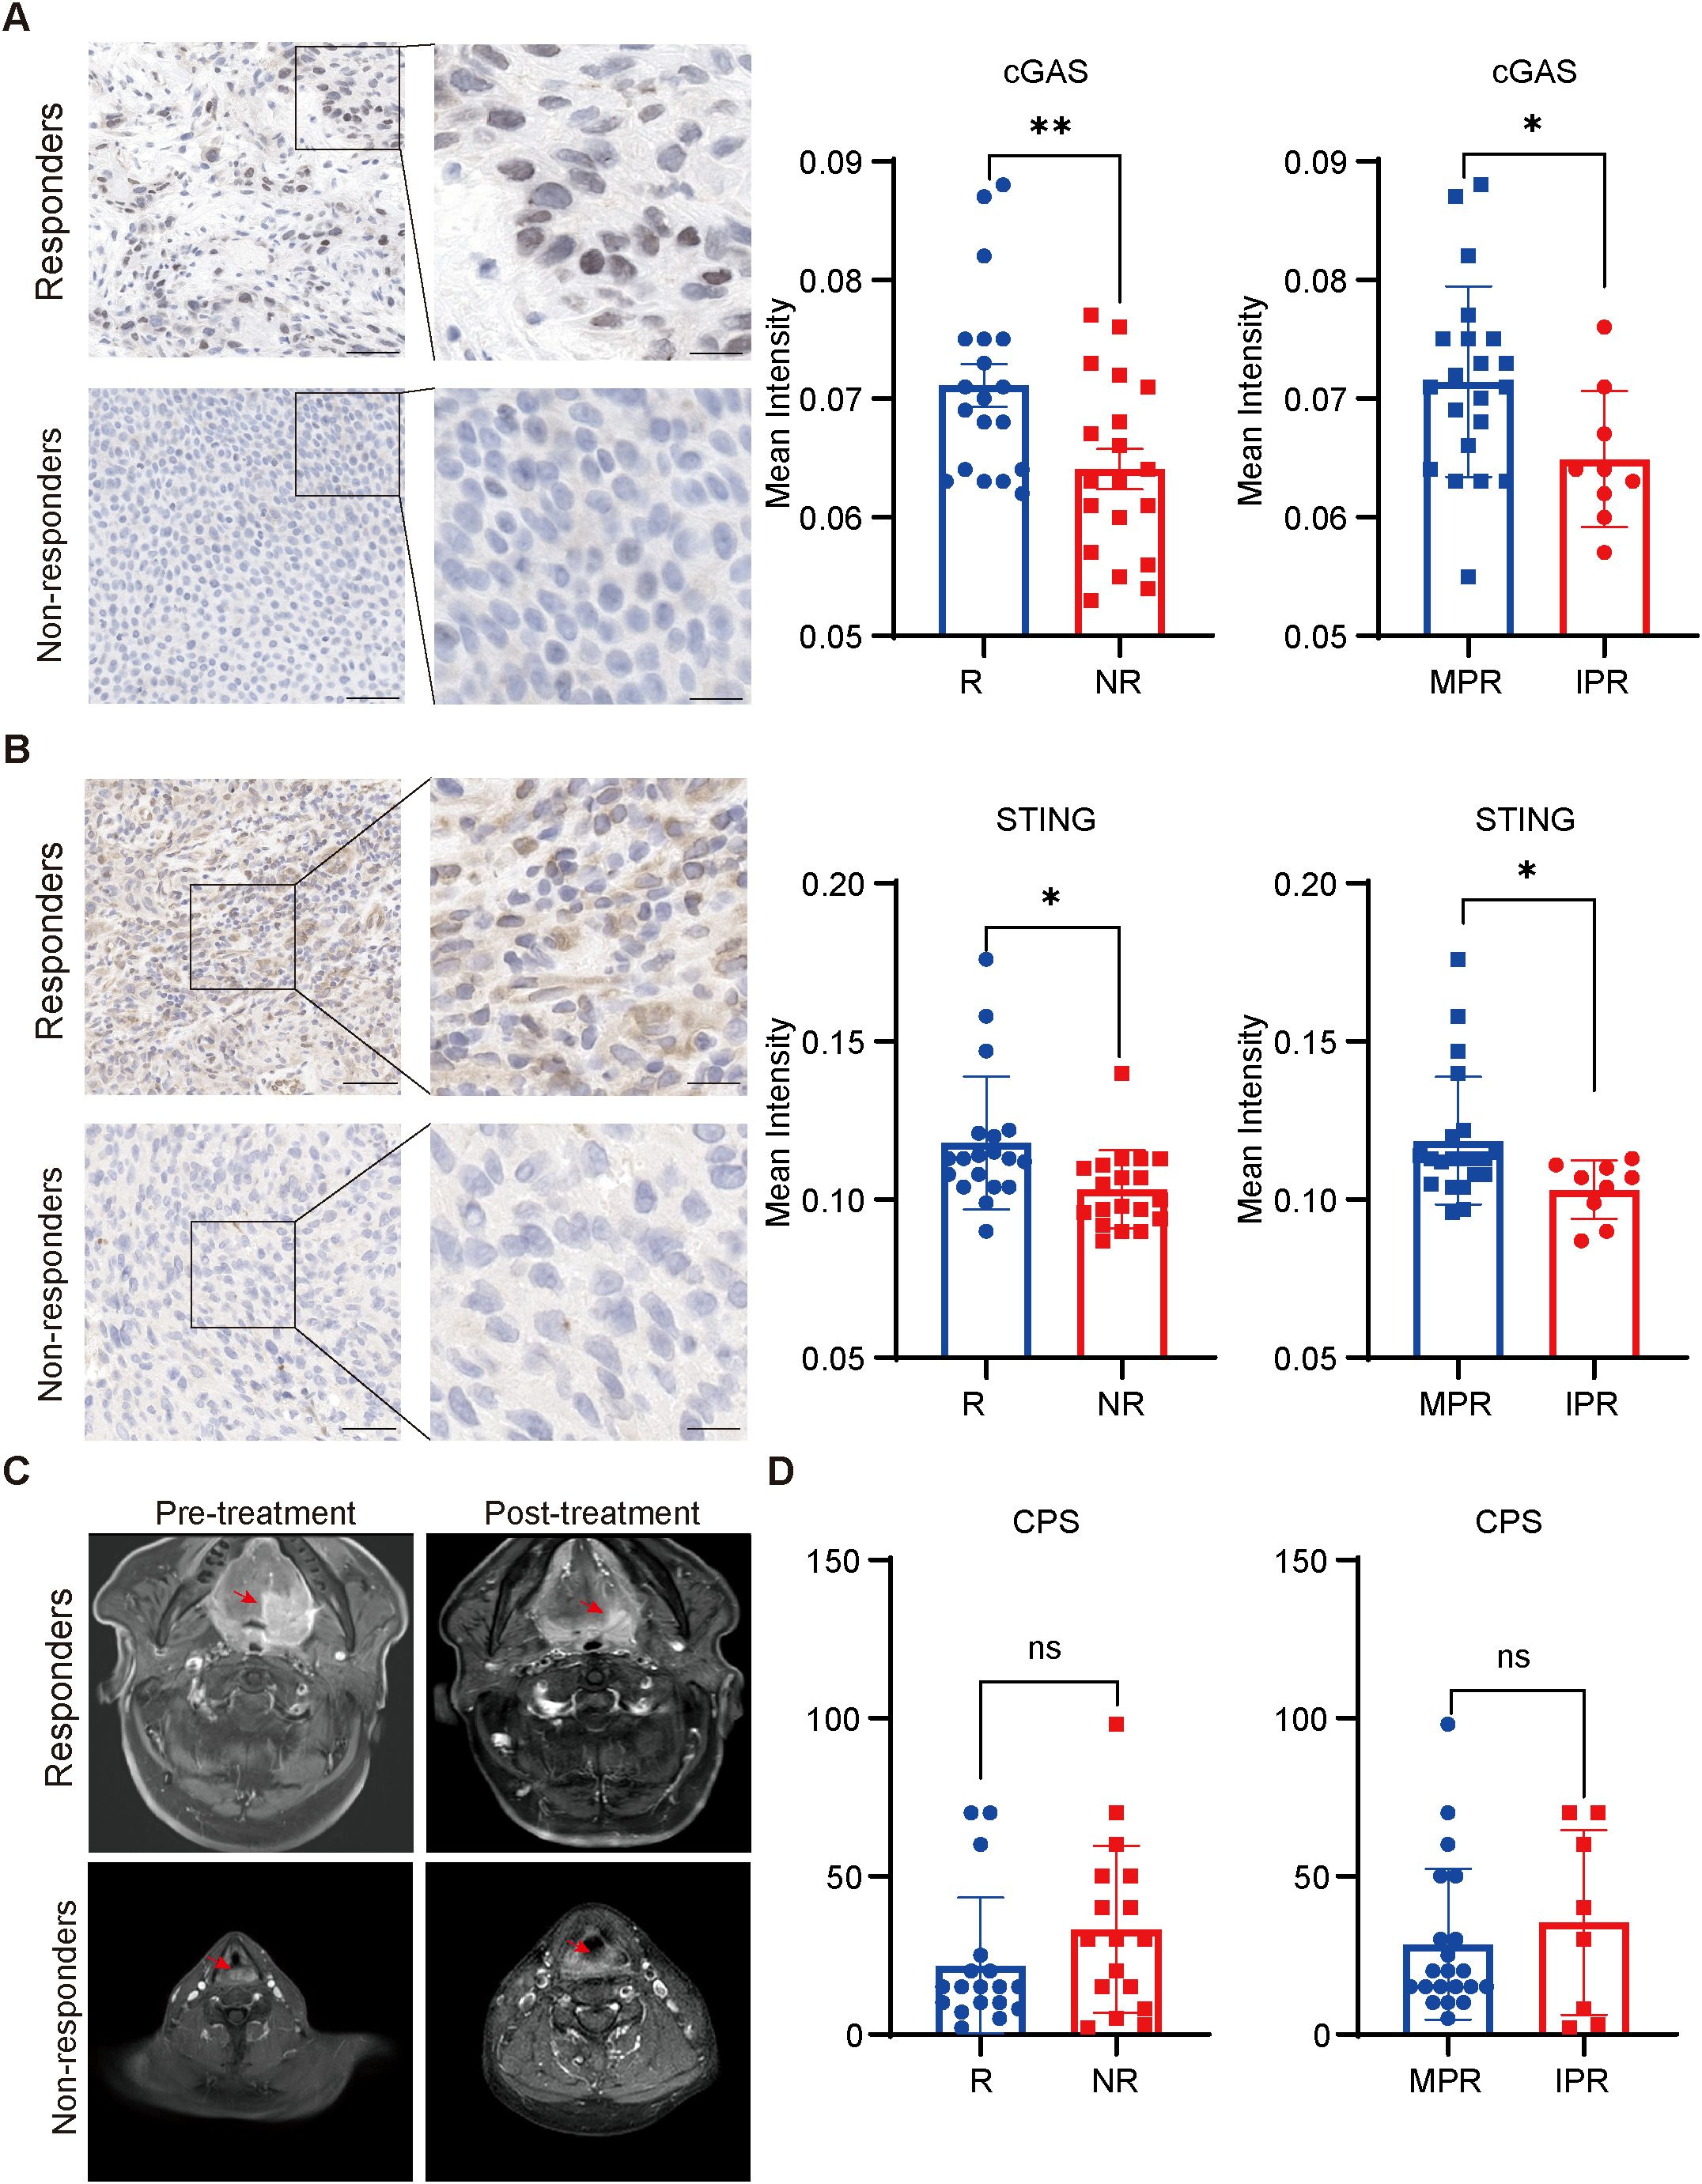
Figure 2. Correlation between cGAS-STING pathway levels and the response to NACI (A, B). Immunohistochemical staining for cGAS and STING in the responders (R; n=19) and non-responders (NR; n=19) patients to NACI. expression of cGAS and STING in tumors was assessed in the MPR group (n = 22) and IPR group (n = 9). Scale bar: left panel, 50um; right panel, 25um. (C). Representative images showing the tumor size in responders and non-responders before and after NACI treatment, respectively. (D). CPS scores were assessed in the responders (R; n = 19) and non-responders (NR; n = 19) with NACI. CPS was assessed in the MPR group (n = 22) and IPR group (n = 9). MPR: major pathologic response; IPR: incomplete pathologic response. *p<0.05, **p<0.01.
To evaluate the correlation between the expression of cGAS and STING and various clinicopathological factors in our cohort, the waterfall plot of radiological responses for individual patients is shown in Figure 3A. cGAS and STING expressions showed no correlation with common clinical characteristics, including age, gender, alcohol consumption, and smoking history (Supplementary Table S1). Our results indicated that 68.42% (13/19) of responders exhibited high cGAS expression, compared to 31.58% (6/19) of non-responders, suggesting that elevated cGAS expression is associated with a positive therapeutic response. Similarly, 68.18% (15/22) of patients in the MPR group had high cGAS expression, whereas only 22.22% (2/9) of patients in the IPR group displayed high expression, further supporting its correlation with favorable treatment outcomes. Likewise, 68.42% (13/19) of responders displayed high STING expression, compared to 31.58% (6/19) of non-responders, indicating that higher STING expression correlates with a better response to treatment. A similar trend was observed in the MPR group, where 68.18% (15/22) exhibited high STING expression, compared to 33.33% (3/9) in the IPR group (Figure 3B). Next, we assessed the predictive value of cGAS and STING in distinguishing responders from non-responders and MPR from IPR groups. Notably, both cGAS and STING expression levels could effectively differentiate potential NACI responders from non-responders (AUC = 0.733 for cGAS and AUC = 0.771 for STING) (Figure 3C), as well as MPR from IPR groups (AUC = 0.725 for cGAS and AUC = 0.765 for STING) (Figure 3D).
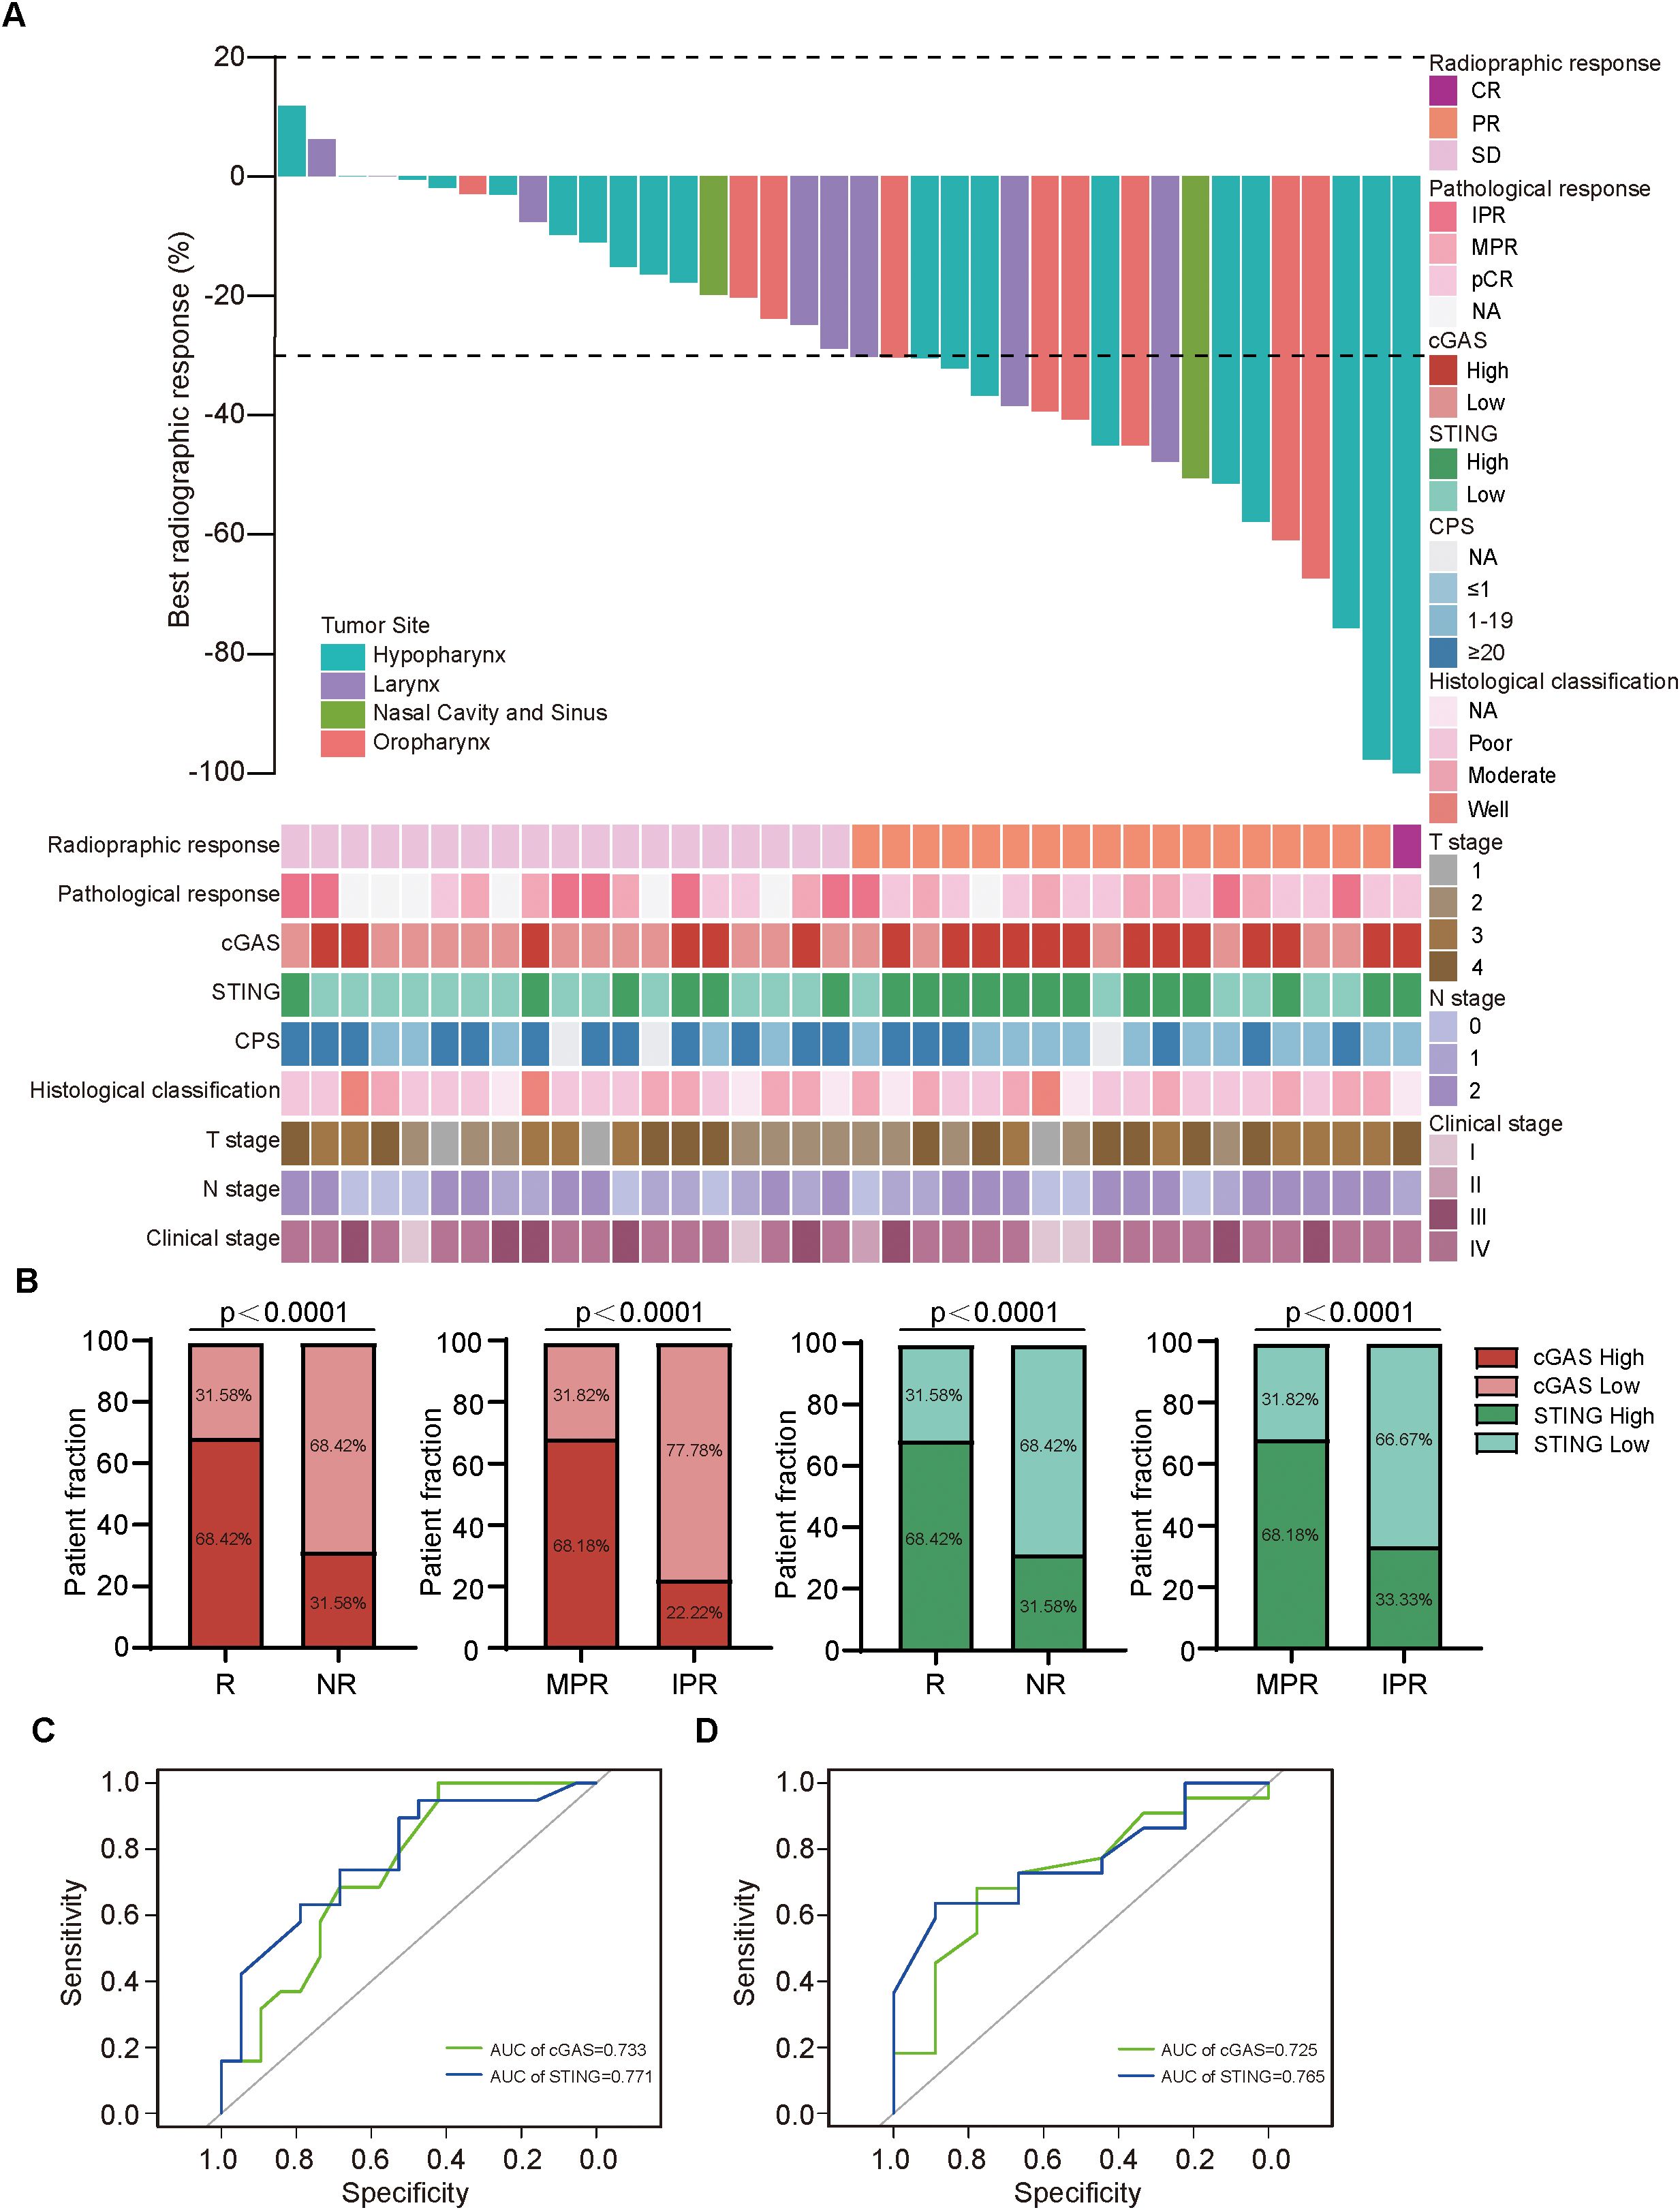
Figure 3. cGAS and STING expressions were positively related to responses to NACI in HNSCC patients (A). Waterfall plots depicting the maximum percentage change in target lesion size during neoadjuvant chemo-immunotherapy of HNSCC patients (n = 38). (B) Distribution of cGAS and STING expression between responders (R; n=19) and non-responders (NR; n=19), patients with MPR (n = 22) and IPR (n = 9). (C) Predictive value of cGAS and STING in discriminating responders and non-responders via ROC analysis. (D) Predictive value of cGAS and STING in discriminating MPR and IPR groups via ROC analysis. MPR, major pathologic response; IPR, incomplete pathologic response.
3.3 Tumor cells with higher cGAS and STING expression exhibited stronger receptor-ligand interactions with T cells
To further investigate the functional characterization of cGAS and STING in the tumor microenvironment, we utilized the TISIDB database to explore the correlation between CGAS and STING1 expressions and immune cell abundances. Both cGAS and STING1 expressions were positively correlated with Act-CD4 (CGAS: rho=0.416, p<2.21e-16; STING1: rho=0.26, p=1.82e-09), Act-CD8 (CGAS: rho=0.089, p=0.0425; STING1: rho=0.303, p=1.98e-12), NKT cell (CGAS: rho=0.255, p=0.3.78e-09; STING1: rho=0.375, p=2.2e-6) abundance, which are critical for immunotherapy (Figure 4A). Additionally, we performed scRNA-seq data analysis in primary tumor tissues of HNSC-GSE234933. Using uniform manifold approximation and projection (UMAP), we identified 14 cellular clusters, including tumor and T cells (Figures 4B, C). We then a cell-cell interaction analysis was conducted to further investigate the predictive value of cGAS and STING. Based on the expression levels of CGAS or STING1 in tumor cell clusters, the samples were divided into high- and low-expression groups. We found that tumor cell clusters with higher CGAS or STING1 expression exhibited stronger receptor-ligand interactions with T cells (Figure 4D). These findings suggest that cGAS and STING are strongly associated with T cell activity and enhance the response to NACI in HNSCC.
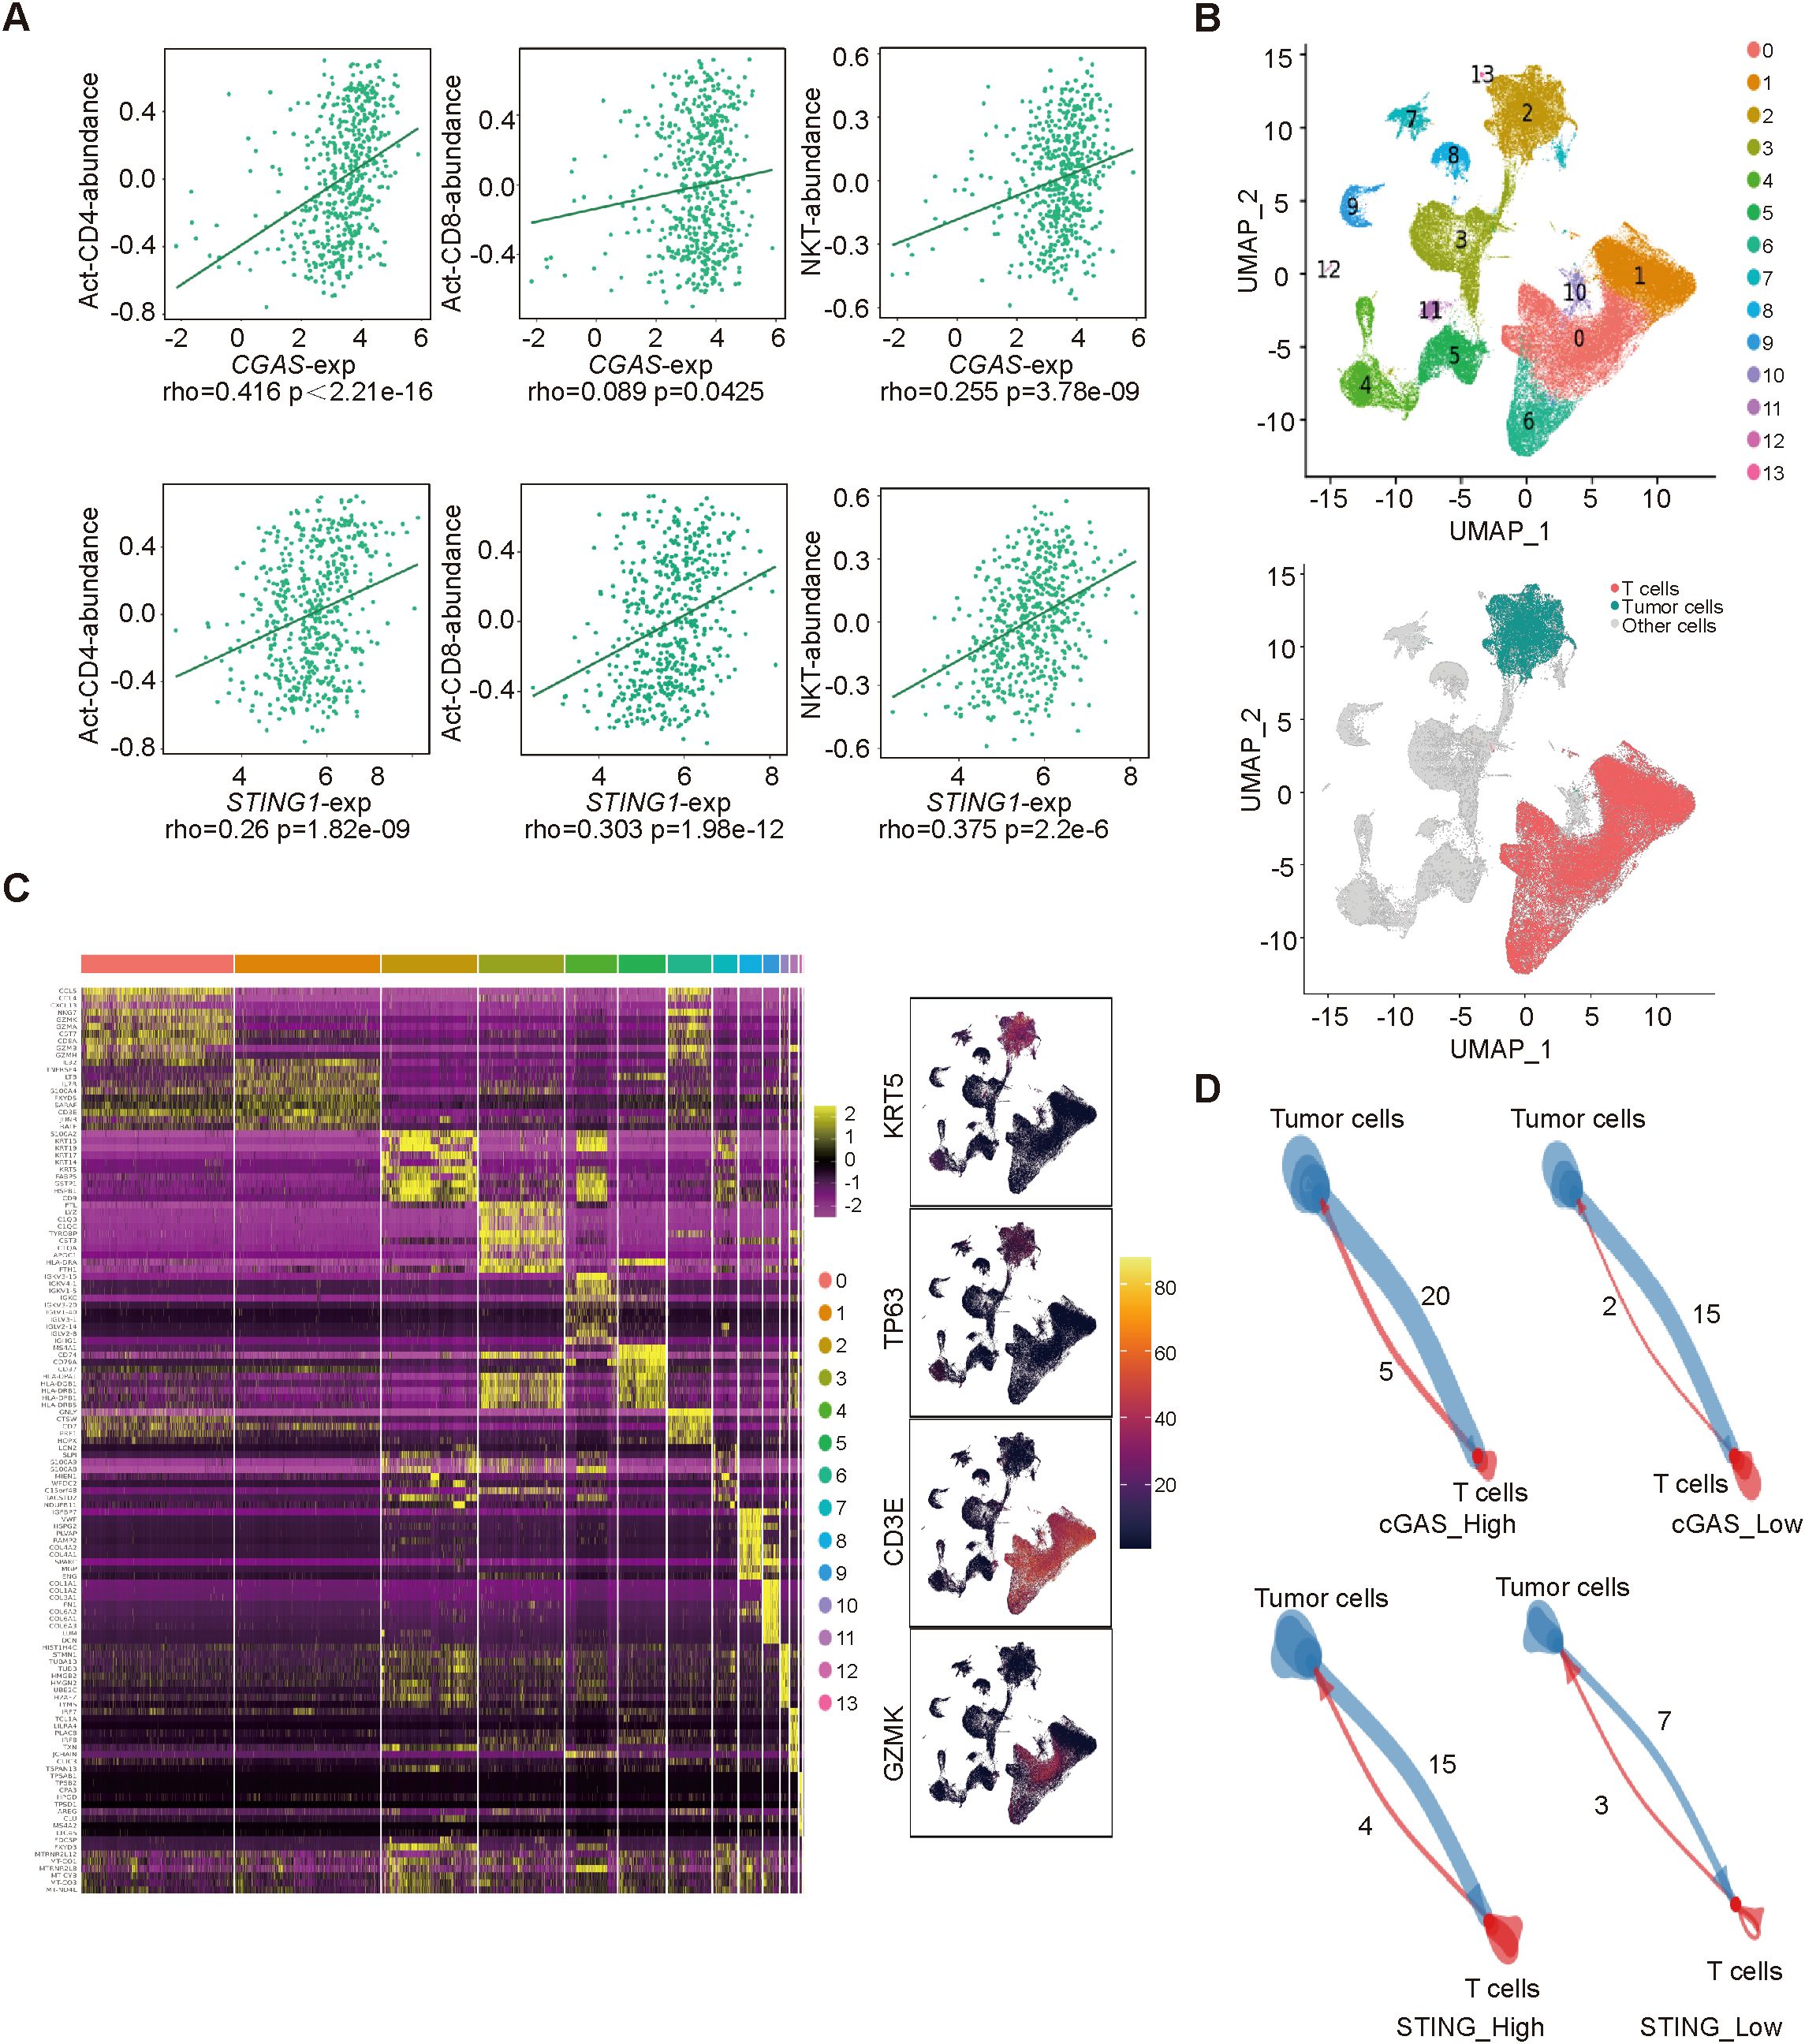
Figure 4. The correlation between cGAS/STING expressions and immune cells (A). the relationship between cGAS/STING expressions and Act-CD4, Act-CD8, NKT cell abundance. (B) Uniform manifold approximation and projection (UMAP) visualization of single-cell transcriptomic profiles combined from all 24 samples. (C) Identification of genes that are dominantly expressed in each major cell type. (D) The cell-cell interactions between high- and low- cGAS/STING tumor cells and T cells.
4 Discussion
Immune checkpoint inhibitors have emerged as a promising approach for the treatment of HNSCC. The KEYNOTE-048 trial demonstrated that pembrolizumab, when combined with chemotherapy, improved overall survival (OS) compared to the EXTREME regimen in patients with recurrent or metastatic (R/M) HNSCC, with an OS of 13.0 months versus 10.7 months (HR 0.77 [95% CI 0.63–0.93], p=0.0034) in the overall population (3, 4). Furthermore, several studies have reported that NACI can achieve pCR rates exceeding 50% in HNSCC patients (7, 8). However, patients who exhibit poor responses to NACI may experience treatment-related complications, potentially delaying radical surgery or concurrent chemoradiotherapy, without resulting in any improvement in prognosis (17). Therefore, identifying clinical biomarkers that can accurately predict the therapeutic response to NACI in HNSCC is of significant clinical importance. In this study, HNSCC patients with elevated levels of cGAS and STING demonstrated a higher response rate to NACI, as evidenced by both open-access database and real-world data.
Currently, CPS is the primary biomarker for predicting tumor immunotherapy efficacy, with higher CPS values associated with better responses to PD-1 therapy (4). In the KEYNOTE-012 study, the response rate was 21% in PD-L1+ patients compared to 6% in PD-L1− patients, as assessed by CPS (18). However, clinical trial data on its predictive value are inconsistent, and the long-term analysis of CheckMate-141 indicated that PD-L1− patients may also benefit from immunotherapy treatment (19, 20). Moreover, the CPS score did not correlate with NACI efficacy in the present cohort, with a substantial proportion of non-responders exhibiting CPS ≥20. This undermines the predictive accuracy of PD-L1 expression and highlights the limited predictive value of CPS. Immunotherapy efficacy is largely influenced by tumor antigen levels and inflammation, making these factors essential for optimizing treatment strategies (21, 22). Recent studies demonstrated that activation of the cGAS-STING pathway enhances antigen presentation by dendritic cells and stimulates the secretion of chemokines, such as CXCL9 and CXCL10, which recruit CD8+ T cells and NK cells to the tumor microenvironment, thereby enhancing the efficacy of immunotherapy (23–26). In this study, we assessed the mRNA expression of cGAS and STING1 and found a positive correlation between their expression levels and the efficacy of chemotherapy and immunotherapy. Furthermore, the protein levels of cGAS and STING were significantly higher in responders to NACI treatment compared to non-responders. Additionally, patients with MPR had higher protein levels of cGAS and STING than those with IPR.
The tumor microenvironment plays a pivotal role in malignancy progression and significantly impacts the response to immunotherapy (27). Three primary immune profiles are associated with immunotherapy response: immune‐inflamed phenotype, the immune‐excluded phenotype and the immune‐desert phenotype (28). Notably, the immune-inflamed phenotype, characterized by abundant immune cell infiltration, generally correlates with better responses to immunotherapy in cancer patients (29, 30). In our study, we observed that the mRNA expressions of CGAS and STING1 were positively correlated with the abundance of activated CD4+ T cells, activated CD8+ T cells, and NKT cells. Furthermore, elevated expression levels of CGAS and STING1 in tumor cells promoted their interaction with T cells, which is crucial for enhancing the efficacy of immunotherapy.
In conclusion, we conducted a systematic and comprehensive analysis of the role of cGAS-STING pathway expression in predicting the efficacy of NACI in HNSCC. However, several limitations should be noted. First, our study is a single-center retrospective analysis, and the limited sample size may affect the statistical power of subgroup analyses, requiring validation in larger cohorts. Second, although the correlation analysis indicates that the cGAS-STING pathway may enhance therapeutic efficacy through the modulation of T cell infiltration, further studies involving gene knockout or overexpression models are required to establish a causal relationship.
5 Conclusion
In summary, our study demonstrated that cGAS and STING expression levels are positively correlated with the efficacy of NACI in HNSCC, playing crucial roles in immune activation. These findings highlight potential strategies that could guide the development of personalized precision medicine for NACI in HNSCC.
Data availability statement
Publicly available datasets were analyzed in this study. This data can be found here: https://www.ncbi.nlm.nih.gov/geo/query/acc.cgi?acc=GSE229289.
Ethics statement
The studies involving humans were approved by the Medical Ethics Committee of Beijing Tongren Hospital. The studies were conducted in accordance with the local legislation and institutional requirements. The participants provided their written informed consent to participate in this study.
Author contributions
MW: Data curation, Investigation, Methodology, Writing – original draft, Writing – review & editing. MS: Data curation, Methodology, Writing – review & editing. YD: Investigation, Supervision, Writing – review & editing. ZZ: Methodology, Writing – review & editing. YG: Methodology, Writing – review & editing. ZL: Writing – review & editing, Investigation. YJ: Writing – review & editing. HH: Writing – review & editing. XC: Conceptualization, Funding acquisition, Supervision, Writing – review & editing.
Funding
The author(s) declare that financial support was received for the research and/or publication of this article. Talent Cultivation plan of ‘Climbing the peak’ of Beijing Municipal Hospital Administration (DFL20220201).
Acknowledgments
We would like to express our gratitude to the individuals and institutions that contributed to the development of open databases and shared resources. Additionally, we thank all the authors for their dedication and hard work in completing this article.
Conflict of interest
The authors declare that the research was conducted in the absence of any commercial or financial relationships that could be construed as a potential conflict of interest.
Generative AI statement
The author(s) declare that no Generative AI was used in the creation of this manuscript.
Publisher’s note
All claims expressed in this article are solely those of the authors and do not necessarily represent those of their affiliated organizations, or those of the publisher, the editors and the reviewers. Any product that may be evaluated in this article, or claim that may be made by its manufacturer, is not guaranteed or endorsed by the publisher.
Supplementary material
The Supplementary Material for this article can be found online at: https://www.frontiersin.org/articles/10.3389/fonc.2025.1584061/full#supplementary-material
References
1. Bray F, Laversanne M, Sung H, Ferlay J, Siegel RL, Soerjomataram I, et al. Global cancer statistics 2022: Globocan estimates of incidence and mortality worldwide for 36 cancers in 185 countries. CA Cancer J Clin. (2024) 74:229–63. doi: 10.3322/caac.21834
2. Smussi D, Mattavelli D, Paderno A, Gurizzan C, Lorini L, Romani C, et al. Revisiting the concept of neoadjuvant and induction therapy in head and neck cancer with the advent of immunotherapy. Cancer Treat Rev. (2023) 121:102644. doi: 10.1016/j.ctrv.2023.102644
3. Cohen EEW, Soulières D, Le Tourneau C, Dinis J, Licitra L, Ahn M-J, et al. Pembrolizumab versus methotrexate, docetaxel, or cetuximab for recurrent or metastatic head-and-neck squamous cell carcinoma (keynote-040): A randomised, open-label, phase 3 study. Lancet. (2019) 393:156–67. doi: 10.1016/S0140-6736(18)31999-8
4. Burtness B, Harrington KJ, Greil R, Soulières D, Tahara M, de Castro G Jr., et al. Pembrolizumab alone or with chemotherapy versus cetuximab with chemotherapy for recurrent or metastatic squamous cell carcinoma of the head and neck (keynote-048): A randomised, open-label, phase 3 study. Lancet. (2019) 394:1915–28. doi: 10.1016/s0140-6736(19)32591-7
5. Ferris RL, Blumenschein G Jr., Fayette J, Guigay J, Colevas AD, Licitra L, et al. Nivolumab for recurrent squamous-cell carcinoma of the head and neck. N Engl J Med. (2016) 375:1856–67. doi: 10.1056/NEJMoa1602252
6. Liu J, Blake SJ, Yong MCR, Harjunpää H, Ngiow SF, Takeda K, et al. Improved efficacy of neoadjuvant compared to adjuvant immunotherapy to eradicate metastatic disease. Cancer Discov. (2016) 6:1382–99. doi: 10.1158/2159-8290.CD-16-0577
7. Yan S, Liu L, Zhang X, Wei L, Jiang W, Gao X, et al. Neoadjuvant chemoimmunotherapy shows major pathological response and low recurrence in head and neck squamous cell carcinoma. Clin Transl Oncol. (2024) 26:1192–202. doi: 10.1007/s12094-023-03342-y
8. Wu D, Li Y, Xu P, Fang Q, Cao F, Lin H, et al. Neoadjuvant chemo-immunotherapy with camrelizumab plus nab-paclitaxel and cisplatin in resectable locally advanced squamous cell carcinoma of the head and neck: A pilot phase ii trial. Nat Commun. (2024) 15:2177. doi: 10.1038/s41467-024-46444-z
9. Wu WJ, Liu Q, An PG, Wang L, Zhang JY, Chen Y, et al. Neoadjuvant tislelizumab combined with chemotherapy in locally advanced oral or oropharyngeal squamous cell carcinoma: A real-world retrospective study. Front Immunol. (2023) 14:1282629. doi: 10.3389/fimmu.2023.1282629
10. Wang R, Hussain A, Guo Q, and Ma M. Cgas-sting at the crossroads in cancer therapy. Crit Rev Oncol Hematol. (2024) 193:104194. doi: 10.1016/j.critrevonc.2023.104194
11. Wang K, Gui L, Lu H, He X, Li D, Liu C, et al. Efficacy and safety of pembrolizumab with preoperative neoadjuvant chemotherapy in patients with resectable locally advanced head and neck squamous cell carcinomas. Front Immunol. (2023) 14:1189752. doi: 10.3389/fimmu.2023.1189752
12. Lv J, Wei Y, Yin JH, Chen YP, Zhou GQ, Wei C, et al. The tumor immune microenvironment of nasopharyngeal carcinoma after gemcitabine plus cisplatin treatment. Nat Med. (2023) 29:1424–36. doi: 10.1038/s41591-023-02369-6
13. Liu X, Cen X, Wu R, Chen Z, Xie Y, Wang F, et al. Arih1 activates sting-mediated t-cell activation and sensitizes tumors to immune checkpoint blockade. Nat Commun. (2023) 14:4066. doi: 10.1038/s41467-023-39920-5
14. Hayman TJ, Baro M, MacNeil T, Phoomak C, Aung TN, Cui W, et al. Sting enhances cell death through regulation of reactive oxygen species and DNA damage. Nat Commun. (2021) 12:2327. doi: 10.1038/s41467-021-22572-8
15. Sen T, Rodriguez BL, Chen L, Corte CMD, Morikawa N, Fujimoto J, et al. Targeting DNA damage response promotes antitumor immunity through sting-mediated t-cell activation in small cell lung cancer. Cancer Discov. (2019) 9:646–61. doi: 10.1158/2159-8290.CD-18-1020
16. Eisenhauer EA, Therasse P, Bogaerts J, Schwartz LH, Sargent D, Ford R, et al. New response evaluation criteria in solid tumours: Revised recist guideline (version 1.1). Eur J Cancer (Oxford England: 1990). (2009) 45:228–47. doi: 10.1016/j.ejca.2008.10.026
17. Tang AL, O'Neil T, McDermott S, Tripathi S, Tikhtman R, Mark JR, et al. Association of neoadjuvant pembrolizumab for oral cavity squamous cell carcinoma with adverse events after surgery in treatment-naive patients. JAMA Otolaryngology– Head Neck Surg. (2022) 148:935–9. doi: 10.1001/jamaoto.2022.2291
18. Seiwert TY, Burtness B, Mehra R, Weiss J, Berger R, Eder JP, et al. Safety and clinical activity of pembrolizumab for treatment of recurrent or metastatic squamous cell carcinoma of the head and neck (keynote-012): An open-label, multicentre, phase 1b trial. Lancet Oncol. (2016) 17:956–65. doi: 10.1016/S1470-2045(16)30066-3
19. Bauml J, Seiwert TY, Pfister DG, Worden F, Liu SV, Gilbert J, et al. Pembrolizumab for platinum- and cetuximab-refractory head and neck cancer: Results from a single-arm, phase ii study. J Clin Oncol. (2017) 35:1542–9. doi: 10.1200/JCO.2016.70.1524
20. Ferris RL, Blumenschein G, Fayette J, Guigay J, Colevas AD, Licitra L, et al. Nivolumab vs investigator's choice in recurrent or metastatic squamous cell carcinoma of the head and neck: 2-year long-term survival update of checkmate 141 with analyses by tumor pd-l1 expression. Oral Oncol. (2018) 81:45–51. doi: 10.1016/j.oraloncology.2018.04.008
21. Karasarides M, Cogdill AP, Robbins PB, Bowden M, Burton EM, Butterfield LH, et al. Hallmarks of resistance to immune-checkpoint inhibitors. Cancer Immunol Res. (2022) 10:372–83. doi: 10.1158/2326-6066.Cir-20-0586
22. Dall'Olio FG, Marabelle A, Caramella C, Garcia C, Aldea M, Chaput N, et al. Tumour burden and efficacy of immune-checkpoint inhibitors. Nat Rev Clin Oncol. (2022) 19:75–90. doi: 10.1038/s41571-021-00564-3
23. Della Corte CM, Sen T, Gay CM, Ramkumar K, Diao L, Cardnell RJ, et al. Sting pathway expression identifies nsclc with an immune-responsive phenotype. J Thorac Oncol. (2020) 15:777–91. doi: 10.1016/j.jtho.2020.01.009
24. Deng L, Liang H, Xu M, Yang X, Burnette B, Arina A, et al. Sting-dependent cytosolic DNA sensing promotes radiation-induced type i interferon-dependent antitumor immunity in immunogenic tumors. Immunity. (2014) 41:843–52. doi: 10.1016/j.immuni.2014.10.019
25. Cousin C, Oberkampf M, Felix T, Rosenbaum P, Weil R, Fabrega S, et al. Persistence of integrase-deficient lentiviral vectors correlates with the induction of sting-independent cd8+ t cell responses. Cell Rep. (2019) 26:1242–57.e7. doi: 10.1016/j.celrep.2019.01.025
26. Liu Y, Pagacz J, Wolfgeher DJ, Bromerg KD, Gorman JV, and Kron SJ. Senescent cancer cell vaccines induce cytotoxic t cell responses targeting primary tumors and disseminated tumor cells. J Immunother Cancer. (2023) 11(2):e005862. doi: 10.1136/jitc-2022-005862
27. Adegoke NA, Gide TN, Mao Y, Quek C, Patrick E, Carlino MS, et al. Classification of the tumor immune microenvironment and associations with outcomes in patients with metastatic melanoma treated with immunotherapies. J Immunother Cancer. (2023) 11(10):e007144. doi: 10.1136/jitc-2023-007144
28. Kandalaft LE, Dangaj Laniti D, and Coukos G. Immunobiology of high-grade serous ovarian cancer: Lessons for clinical translation. Nat Rev Cancer. (2022) 22:640–56. doi: 10.1038/s41568-022-00503-z
29. Salmon H, Remark R, Gnjatic S, and Merad M. Host tissue determinants of tumour immunity. Nat Rev Cancer. (2019) 19:215–27. doi: 10.1038/s41568-019-0125-9
Keywords: head and neck squamous cell carcinoma, neoadjuvant chemoimmunotherapy, cGAS-STING, predictive markers, T cells
Citation: Wang M, Shi M, Ding Y, Zhang Z, Ge Y, Li Z, Jing Y, Hu H and Chen X (2025) High cGAS-STING expression associates with improved efficacy of neoadjuvant chemo-immunotherapy in head and neck squamous cell carcinoma. Front. Oncol. 15:1584061. doi: 10.3389/fonc.2025.1584061
Received: 26 February 2025; Accepted: 19 June 2025;
Published: 15 July 2025.
Edited by:
Luis Abel Quiñones, University of Chile, ChileReviewed by:
Seetha Harilal, Kerala University of Health Sciences, IndiaLuccas Lavareze, State University of Campinas, Brazil
Copyright © 2025 Wang, Shi, Ding, Zhang, Ge, Li, Jing, Hu and Chen. This is an open-access article distributed under the terms of the Creative Commons Attribution License (CC BY). The use, distribution or reproduction in other forums is permitted, provided the original author(s) and the copyright owner(s) are credited and that the original publication in this journal is cited, in accordance with accepted academic practice. No use, distribution or reproduction is permitted which does not comply with these terms.
*Correspondence: Xiaohong Chen, dHJjaHhoQDE2My5jb20=
†These authors have contributed equally to this work and share first authorship
‡ORCID: Xiaohong Chen, orcid.org/0000-0002-3825-2647