 Lan Yang
 Yanqiu Han*
- Department of Hematology, Affiliated Hospital of Inner Mongolia Medical University, Hohhot, Inner Mongolia, China
Background: Chronic myeloid leukemia (CML) is a myeloproliferative neoplasm characterized by the presence of the Philadelphia chromosome (chromosome 22). This cytogenetic abnormality gives rise to the BCR::ABL1 fusion gene, which encodes the constitutively active BCR-ABL1 protein tyrosine kinase, driving uncontrolled proliferation and impaired apoptosis of hematopoietic stem and progenitor cells, leading to leukemogenesis. Imatinib mesylate (IM), a first-generation tyrosine kinase inhibitor (TKI) specifically targeting the BCR-ABL1 oncoprotein, represents the standard first-line therapy for patients with CML. However, imatinib resistance remains a major therapeutic challenge.
Objective: This study aims to elucidate the role of the ZFAS1/STAT3 signaling axis in mediating imatinib resistance in CML by promoting metabolic reprogramming, with a particular focus on alterations in glucose metabolism.
Methods: Imatinib-resistant (IM-R) K562 cells were used to investigate the functional role of ZFAS1gene. Following ZFAS1 knockdown, assessments of cell viability, apoptosis, and glucose metabolism were performed. The interaction between ZFAS1 and IGF2BP2, as well as its regulatory effect on STAT3 expression and glycolysis-related genes (including HIF1α, LDHA, and PDK1) were examined using qRT-PCR and western blotting. Additionally, the impact of STAT3 overexpression and glycolysis inhibition (2-DG) on IM sensitivity were examined.
Results: Our findings revealed that ZFAS1 expression was significantly upregulated in IM-R CML patient samples and IM-R K562 cells. Silencing of ZFAS1 enhanced cellular sensitivity to IM, inhibited glucose metabolism reprogramming, and promoted apoptosis. Mechanistically, ZFAS1 was found to interact with IGF2BP2, facilitating the stabilization of STAT3 mRNA and leading to increased STAT3 expression. This, in turn, resulted in the upregulation of key glycolytic genes. Overexpression of STAT3 reversed the effects of ZFAS1 knockdown by restoring glycolytic activity and re-establishing IM resistance. Additionally, 2-DG treatment effectively reversed STAT3-induced IM resistance by inhibiting glycolysis.
Conclusion: These findings demonstrate that the ZFAS1/STAT3 signaling axis contributes to imatinib resistance in CML through the modulation of glucose metabolism. Targeting this regulatory pathway may represent a novel therapeutic strategy to overcome TKI resistance in CML.
1 Introduction
Chronic myeloid leukemia (CML) is a clonal hematopoietic stem cell malignancy characterized by the presence of the Philadelphia chromosome. This chromosomal abnormality facilitates the production of the BCR::ABL1 fusion gene (1, 2). This genetic alteration results in the production of an oncoprotein, BCR-ABL1, with abnormally high tyrosine kinase activity, promoting the uncontrolled growth of white blood cells (2). Tyrosine kinase inhibitors (TKIs), represented by imatinib mesylate (IM), are the first-line drugs for the treatment of CML, which specifically block the binding site of ATP on Abl kinase. Despite considerable progress in the treatment of CML, resistance to these targeted therapies continues to pose a significant obstacle (3, 4). Compared with traditional treatment drugs, such as interferon, busulfan, hydroxyurea and so on, IM notably enhances treatment efficacy and early survival rates in patients with CML (5). Nonetheless, imatinib does not provide a definitive cure for CML, and resistance to imatinib may develop over time. In patients with advanced-stage CML, the therapeutic efficacy of imatinib is often limited, and it frequently fails to prevent disease relapse or progression. Moreover, the emergence of imatinib resistance represents a major clinical challenge, significantly undermining the long-term effectiveness of this targeted therapy.
The mechanisms underlying imatinib resistance in CML are complex as two categories: BCR-ABL1-dependent and BCR-ABL1-independent (6). The emerging mechanisms of imatinib resistance in CML is the dysregulation of long non-coding RNAs (lncRNAs) (7). LncRNAs have emerged as critical modulators of gene expression and cellular signaling. Among these, ZFAS1, a well-characterized oncogenic lncRNA, plays a crucial role in the progression and resistance of various cancerous types, but its mechanistic role in CML remains underexplored (8, 9). In parallel, the signal transducer and activator of transcription 3 (STAT3) signaling pathway has been implicated in the emergence of drug resistance in CML due to its regulatory influence on various cellular processes, including proliferation, survival, and metabolism (10, 11). Previous study has shown that BCR-ABL1, a hallmark of CML, activates STAT3 via both the Janus Kinase (JAK) and mitogen-activated protein kinase/extracellular signal-regulated kinase (MEK/ERK) pathways (12). Specifically, BCR-ABL1 phosphorylation of STAT3 is implicated in promoting CML progression and resistance to treatment. Also, ZFAS1 inhibits the progression of triple-negative breast cancer by negatively regulating the STAT3 gene (13). This inhibitory effect of ZFAS1 on STAT3 has also been observed in gastric and non-small cell lung cancers (14, 15). Furthermore, STAT3 mediated regulation of glucose metabolism in types of cancer (16–19).
Recent evidence indicates that glucose metabolism reprogramming, a hallmark of cancer, has also been associated with the development of treatment resistance in CML and other malignancies (20, 21). Compared to other metabolic pathways such as lipid or amino acid metabolism, glucose metabolism is more directly implicated in supporting the high energy demands of CML cells and their resistance to tyrosine kinase inhibitors (22–25). However, the upstream lncRNA-based regulatory mechanisms governing this glycolytic shift in CML remain poorly defined. This gap in knowledge prompts further investigation into the potential link between ZFAS1, STAT3, and glucose metabolism, with the goal of elucidating novel mechanisms of metabolic reprogramming in CML. Given the central role of STAT3 in regulating metabolic pathways in various cancers and its role with ZFAS1 mentioned above, we hypothesize that ZFAS1 may modulate STAT3 activation or function, thereby contributing to imatinib resistance in CML through the reprogramming of glucose metabolism. In this study, we aim to investigate the role of the ZFAS1/STAT3 axis in promoting imatinib resistance in CML through the regulation of glucose metabolism pathway. Elucidating these mechanisms may provide valuable insights into the pathogenesis of drug resistance in CML and aid in the development of novel therapeutic strategies to enhance treatment efficacy.
By elucidating the mechanisms by which ZFAS1 and STAT3 contribute to imatinib resistance, our study offers new insights into the metabolic adaptations of CML cells. These findings advance our understanding of CML pathophysiology and establish a foundation for the development of innovative therapeutic approaches targeting the ZFAS1/STAT3 axis. Such strategies hold promise for overcoming imatinib resistance and ultimately improving clinical outcomes in patients with CML.
2 Methods
2.1 Ethics approval and consent to participate
This study was approved by the Ethics Committee of Inner Mongolia Medical University (Inner Mongolia, China; Approval number: No. YKD202302030). All patients provided written informed consent to participate in the study. The clinical samples were collected between June 2023 and January 2024, and all patient data were anonymized to ensure confidentiality. Ethical approval for the study was obtained in accordance with the Declaration of Helsinki. Chinese patients with chronic-phase CML (Philadelphia chromosome-positive), who had been receiving imatinib (400 mg/day) as first-line therapy, were selected for this study. Molecular responses were monitored at 3, 6, and 12 months post-treatment using quantitative PCR for the BCR::ABL1 fusion gene. Patients who failed to achieve a major molecular response (MMR) or complete molecular response (CM-R, n = 30), which defined as a BCR::ABL1/ABL1 ratio ≥1%—by 12 months were considered imatinib-resistant (IM-R) and subsequently switched to second-generation tyrosine kinase inhibitors (dasatinib or nilotinib). Patients who achieved CMR or MMR were categorized as imatinib-sensitive (IM-S, n = 30).
2.2 Bioinformatics analysis
LncATLAS database (https://lncatlas.crg.eu/?tdsourcetag=s_pcqq_aiomsg) was used to predict ZFAS1 location in cells. Using StarBase database (https://rnasysu.com/encori/index.php), we investigated the potential regulatory relationship between ZFAS1 and STAT3 expression through IGF2BP2. To identify potential RNA-binding proteins (RBPs) mediating the interaction between ZFAS1 and STAT3, the StarBase database was utilized. First, the “RBP-Target” module was accessed, and the RBP–lncRNA analysis function was employed by inputting “ZFAS1” to screen for RBPs predicted to interact with this lncRNA. Subsequently, the RBP–RNA module was queried using “STAT3” to identify RBPs that bind to the STAT3 transcript. IGF2BP2 emerged as a common interacting protein for both ZFAS1 and STAT3. IGF2BP2 was selected for further investigation based on existing literature indicating its regulatory role in glycolysis within myeloid leukemia cells (26).
2.3 Cell culture
Human leukemic cell line K562 cells were procured from ATCC in Manassas, VA, USA, and maintained in RMPI 1640 medium supplemented with 10% heat-inactivated FBS, 100 U/ml penicillin, and 100 μg/ml streptomycin. Cultures were incubated at 37°C in a humidified atmosphere containing 5% CO2. IM, sourced from Sigma (MO, USA), was generated imatinib-resistant K562 cells, employing a previously described method (27, 28).
2.4 Transfection and treatment
The siRNA targeting ZFAS1 (si-ZFAS1) and the negative control siRNA (si-NC) were purchased from Thermo Fisher Scientific Co., Ltd. (USA). The ZFAS1 reference sequence (accession number: NR_003604.3) was retrieved from the NCBI. The sequences of ZFAS1 siRNA were as follows: forward, 5’-GAUGAUCUAUGGAAUUUCATT-3’ and antisense: 5’-UGAAAUUCCAUAGAUCAUCTT-3′. The sequence of the negative control siRNA (si-NC) used in this study is: Forward, 5’-UUCUUCCGAACGUGUCACGUTT-3’ and antisense: 5’-ACGUGACACGUUCGGAGAATT -3′. Using Lipofectamine® 2000 (Invitrogen) in accordance with the manufacturer’s protocol, siRNA was transfected into the K562 cell lines. To study the function of STAT3, we transfected the STAT3 plasmid into IM-R CML cells using Lipofectamine 2000 reagent (Thermo Fisher Scientific, USA). Empty plasmid serves as negative control (NC). First, cells were seeded in culture plates at a density of 2×10⁵ cells/mL and cultured for 24 hours in antibiotic-free medium to allow recovery prior to transfection. Subsequently, Lipofectamine 2000 was used to prepare the transfection complex according to the manufacturer’s instructions. The STAT3 plasmid (2 µg) was mixed with the transfection reagent in 200 µL of Opti-MEM medium, left to stand for 20 minutes, and then added to the cell culture medium. After transfection, the cells were further cultured for 48 hours in a 37°C, 5% CO2 incubator. After a 48-hour transfection period, the cells were harvested and utilized in subsequent assays. The transfection efficiency was assessed by detecting the expression level using qRT-PCR.
2.5 Cytotoxicity assay
Cell counting kit-8 (CCK-8) kit was used to assess cytotoxicity under various treatment conditions. To detect drug sensitivity, imatinib-resistant K562 (IM-R K562) cells, with or without treatment with 2 mM of the glycolysis inhibitor 2-Deoxy-D-glucose (2-DG; 154-17-6, Ann Arbor, MI, USA), and imatinib-resistant K562 cells transfected with si-NC, si-ZFAS1, NC, or STAT3 plasmid, were seeded in a 96-well plate at a density of 2,000 cells per well, with medium containing different concentrations of IM. A concentration of 2 mM 2-DG was used in this study based on previous report indicating effective glycolysis inhibition in leukemia cells (22). Each concentration was tested in triplicate. After 48 hours of incubation, 10 μL of CCK-8 solution (Boster Bio, Wuhan) was added to each well. Two hours later, optical density (OD) measurements for cells in each group were then performed using a microplate reader at a wavelength of 450 nm. Drug resistance was assessed by comparing the IC50 values (the drug concentration required to inhibit cell growth by 50%) derived from the growth inhibition curves.
2.6 Colony formation assay
A colony formation assay was conducted to evaluate the ability of IM-R K562 cells, transfected with either si-NC or si-ZFAS1, to form colonies after a 14-day IM treatment. IM-R K562 cells were transfected with si-NC and si-ZFAS1 as needed. Single-cell suspensions were prepared and quantified. The cells were cultured in medium containing 2 μM IM, with fresh IM-supplemented medium replacing the existing medium every 3–4 days. After 14 days, colony formation was assessed, with a colony defined as a cluster of at least 50 cells. The number of colonies per well was counted manually or using an automated colony counter. Colony formation efficiencies of the si-NC and si-ZFAS1 transfected groups under IM treatment were compared. Efficiency was calculated by dividing the number of colonies by the initial cell inoculation number and multiplying by 100. The impact of ZFAS1 knockdown on the colony-forming ability of IM-R K562 cells under imatinib treatment was subsequently analyzed.
2.7 Flow cytometry analysis for apoptosis detection
Cells were incubated in a 5% CO2 incubator at 37°C for 48 hours. After 48 h, cells were collected by centrifugation at 300 g for 5 min. Cells were washed twice with cold PBS and re-suspended at a concentration of 1 × 10⁶ cells/mL in 1X binding buffer. A total of 100 μL of cell suspension (1 × 10⁵ cells) was divided into 5 mL culture tubes. Each tube was supplemented with 5 µL of Annexin V-FITC and 5 µL of propidium iodide (PI). Following incubation, 400 µL of 1 × binding buffer was added to each tube. Proper compensatory controls and gating strategies were implemented to accurately distinguish between viable cells. Detection of si-NC group and si-ZFAS1 apoptosis cell percentage (Annexin V positive). The effect of ZFAS1 knockdown on IM-R K562 cell apoptosis induced by imatinib was evaluated by comparing the apoptosis rate of the two group. Flow cytometry was performed using a BD FACSCalibur system (BD Biosciences). At least 10,000 events were acquired per sample. Data were analyzed using FlowJo v10 software. Viable cells were gated using forward scatter (FSC) and side scatter (SSC), and apoptotic cells were defined as Annexin V-FITC positive.
2.8 Quantitative real-time polymerase chain reaction assay
Total RNA was isolated from peripheral blood samples from CML patients or cultured K562 cells following treatment with IM. The RNA samples were dissolved in RNase-free distilled water. Subsequently, 2 μg of total RNA was reverse transcribed into cDNA using the High-Capacity RNA to cDNA Kit (ThermoFisher Scientific, Shanghai, China). Quantitative PCR analysis of gene expression was conducted in 96-well plates, with each well containing a 20 µl reaction mixture consisting of 2 × SYBR green master mix (NZYtech, Portugal), diluted gene-specific primers, and cDNA. qPCR data were analyzed using QuantStudio Design & Analysis software v1.5. The primers were sourced from OriGene Technologies, Inc., and their sequences are detailed in Table 1. Relative gene expression was calculated using the 2-ΔΔCt method with GAPDH or U6 as the internal control.
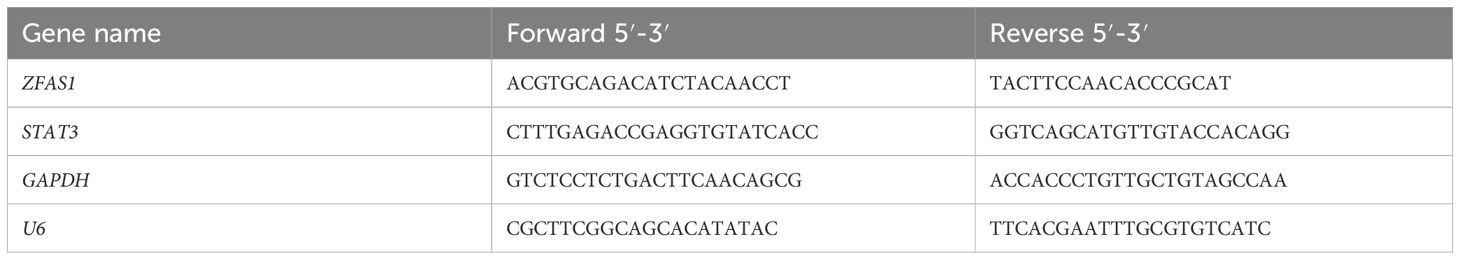
Table 1. The primer sequences used in quantitative PCR assay.
2.9 Cytoplasmic/nuclear fractionation
For the cytoplasmic/nuclear separation experiment, cells were cultured, harvested, and were lysed to separate the cytoplasmic and nuclear fractions by Nuclear and Cytoplasmic Extraction Reagents (78833, Thermo Fisher) according to the manufacturer’s instructions. The cytoplasmic and nuclear RNA was then isolated according to the recommended protocols, followed by reverse transcription and qRT-PCR.
2.10 RNA fluorescence in situ hybridization
RNA FISH was conducted using the Fluorescent in situ Hybridization Kit (lnc1CM001, RiboBio) following the manufacturer’s protocol. Cy3-labeled probes targeting ZFAS1 were synthesized by RiboBio (Guangzhou, China). Fluorescent signals were captured using a confocal laser scanning microscope (FV3000, Olympus).
2.11 Western blot assay
For Western blot assays, K562 cells were seeded at a density of 1 × 10⁶ cells/mL in T25 flasks and incubated for 48 hours after transfection or treatment. Approximately 5 × 10⁶ cells per sample were harvested, lysed in RIPA buffer supplemented with protease and phosphatase inhibitors. The Bradford Protein Assay Kit (Boster Bio, Wuhan, China) was employed to determine protein concentration. Afterward, PVDF membranes post-incubation with primary antibodies were exposed to goat anti-rabbit IgG (1:2000, PR30011, Proteintech) as a secondary antibody. Protein bands were visualized using an enhanced chemiluminescence (ECL) system (Millipore), and band intensities were quantified using Image Lab software (BioRad, US). The primary antibodies, which included LDHA (1:500, Cat No. # PA5-27406), HIF-1α (1:2000, Cat No. #MA1-516), PDK1 (1:5000, Cat No. #MA5-32702), STAT3 (1:500, Cat No. #MA5-157126) and GAPDH (1:1000, Cat No. #MA5-15738), were acquired from Thermo Fisher ® (Shanghai, China).
2.12 RNA immunoprecipitation assay
To examine the interaction between ZFAS1 and IGF2BP2 in the context of gene silencing, IM-R K562 cells were first transfected with si-NC or si-ZFAS1 using Lipofectamine 2000 according to the manufacturer’s protocol. After 48 hours of transfection, approximately 1 × 10⁷ cells per sample were harvested and lysed for RIP assays. RIP was performed using the Magna RIP RNA-Binding Protein Immunoprecipitation Kit (Millipore, USA). Antibodies targeting IGF2BP2 (Proteintech, Cat No.11601-1-AP) were conjugated to protein A/G magnetic beads to capture complexes involving IGF2BP2. Subsequently, the cell lysate was mixed with magnetic beads conjugated with specific antibodies, promoting the formation of complexes between IGF2BP2 and its interacting partners. Thorough washing of the beads was performed to eliminate non-specifically bound proteins and contaminants, ensuring the specificity of the captured interactions. The complexes bound to the beads were then eluted, releasing the proteins associated with IGF2BP2, including any enriched STAT3 molecules. The data obtained from the RIP assay were analyzed to evaluate the extent of STAT3 enrichment by IGF2BP2, shedding light on their potential interaction and functional significance.
2.13 mRNA stability assay
CML cells were treated with actinomycin D (5 μg/mL) to inhibit transcription. RNA was harvested at 0, 2, 4, 8, 12 and 16 hours post-treatment. STAT3 mRNA levels were quantified using qRT-PCR and normalized to GAPDH. The relative remaining mRNA percentage was calculated against the 0 h time point.
2.14 Oxygen consumption rate measurement and ECAR
The OCR was measured using the Oxygen Consumption Rate Assay Kit from Cayman Chemical (US). Prior to commencing the experiment, the existing culture medium was replaced with 160 µL of fresh medium supplemented with 10 µL of a phosphorescent oxygen probe solution. To prevent evaporation, 100μL of mineral oil was gently added to each well. Fluorescence signals were detected using a plate reader configured with excitation and emission wavelengths of 380 nm and 650 nm, respectively, and maintained at 37 °C for a duration of two hours. OCR values were normalized to the total cell count. The ECAR was simultaneously measured using the Seahorse XF Analyzer (Agilent Technologies). To ensure adherence of K562 suspension cells to the Seahorse XF96 plate, wells were pre-coated with Cell-Tak cell adhesive (Corning) according to the manufacturer’s protocol. Cells were then seeded and gently centrifuged at 200g for 1 minute to promote attachment before measurement. The ECAR measurements were carried out, and data were normalized to cell numbers to account for any variations in cell density.
2.15 Statistical analysis
Statistical analyses were performed using GraphPad Prism 9.0 (GraphPad Software Inc., San Diego, CA, USA). Normality of data was assessed using the Shapiro–Wilk test. For comparisons between two groups, unpaired two-tailed Student’s t-tests were used. For comparisons among multiple groups, one-way ANOVA followed by Tukey’s post hoc test was applied. All experiments were independently repeated at least three times, and data are presented as mean ± standard deviation (SD). A p-value of <0.05 was considered statistically significant.
3 Results
3.1 Elevated expression of LncRNA ZFAS1 and STAT3 in IM-R CML and K562 cells
We first assessed the expression levels of ZFAS1 and STAT3 in peripheral blood cells from CML patients. The IM-R group exhibited a significantly elevated expression of ZFAS1 (2.14 ± 0.25) and STAT3 (1.43 ± 0.05) compared to ZFAS1 (1.00 ± 0.23) and STAT3 (1.00 ± 0.09) in the imatinib-sensitive group (p < 0.001; Figures 1A, B). Further correlation analysis revealed a positive correlation between ZFAS1 and STAT3 in CML patients (r=0.4, p=0.02, Figure 1C). We then evaluated the expression of ZFAS1 and STAT3 in IM-R and IM-S K562 cell lines, and similarly observed significantly elevated levels in the IM-R K562 cells (2.47 ± 0.16) as compared to IM-S K562 cells (1.00 ± 0.05, p < 0.001; Figures 1D, E). These findings support the involvement of the ZFAS1/STAT3 axis in both patient samples and in vitro models of imatinib resistance.
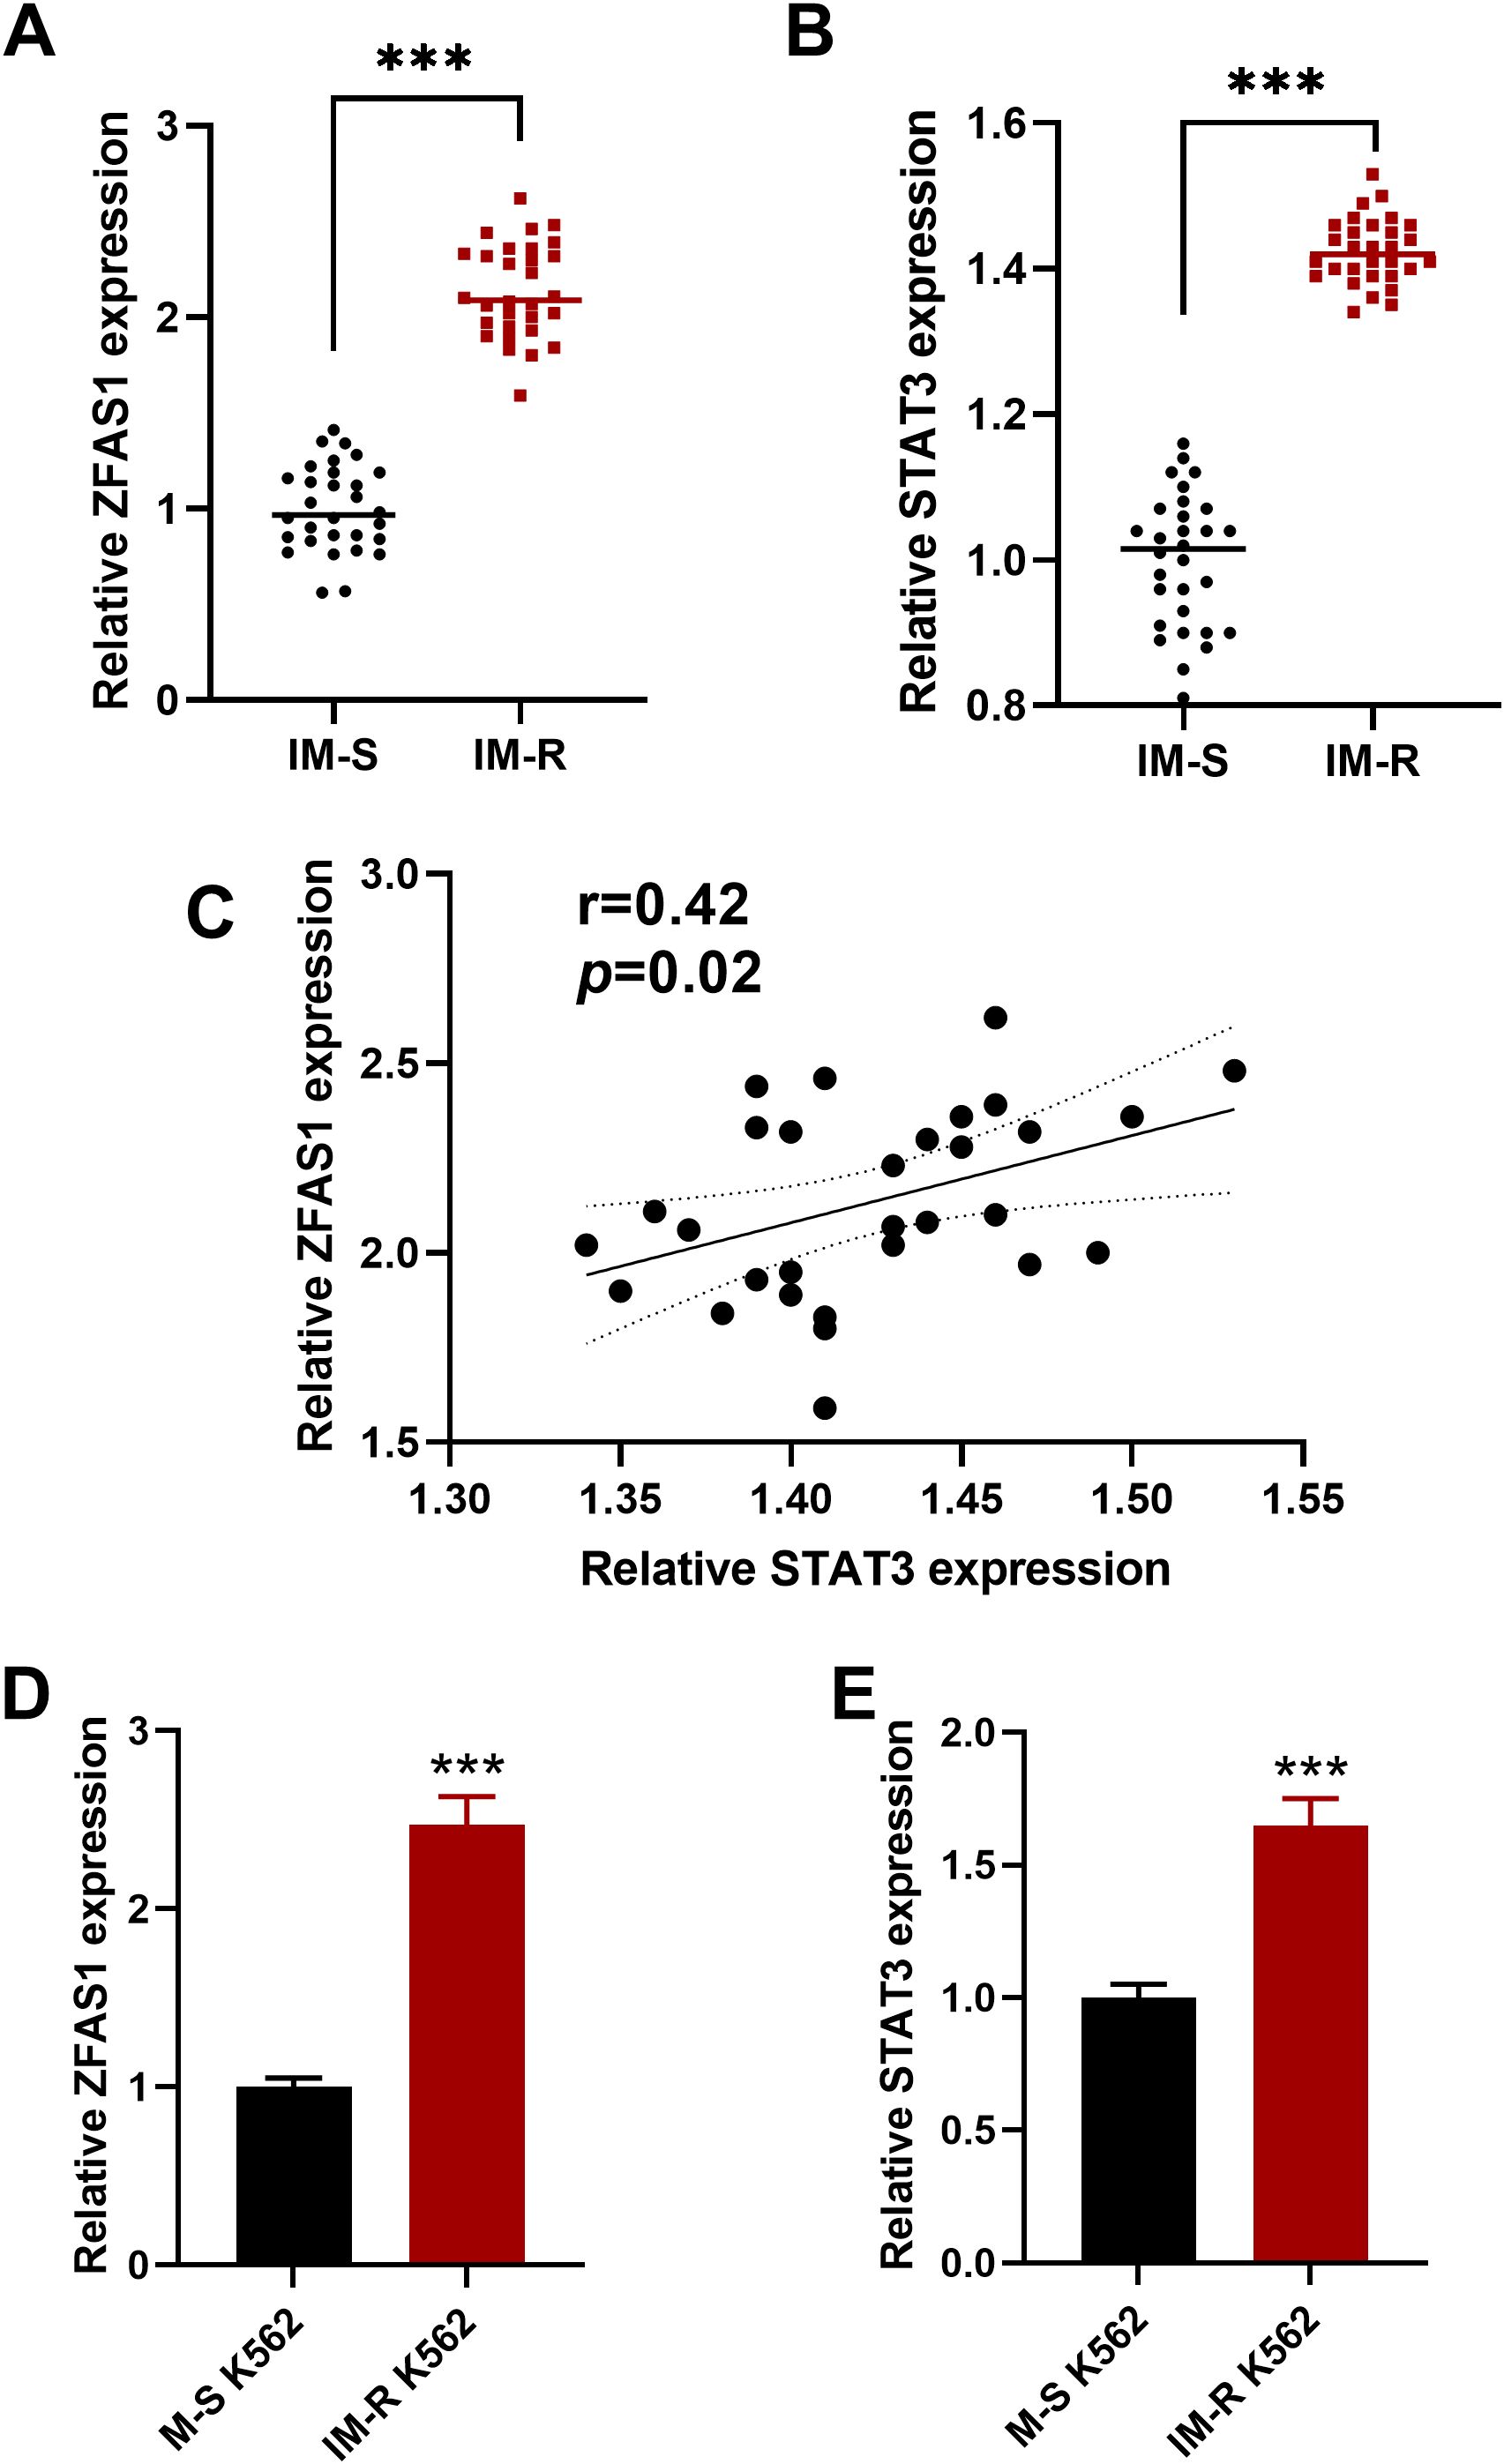
Figure 1. Elevated expression of lncRNA ZFAS1 and STAT3 in imatinib-resistant (IM-R) CML patient samples and IM-R K562 cell line. (A, B) Relative expressions of ZFAS1 and STAT3 in peripheral blood cells from imatinib-resistant (IM-R, n=30) and imatinib-sensitive (IM-S, n=30) CML patients. (C) Correlation analysis between ZFAS1 and STAT3 in CML patients samples. (D, E) Expression levels of lncRNA ZFAS1 and STAT3 in IM-R and IM-S K562 cells. Data are presented as mean ± SD. ***p<0.001 vs. IM-S.
3.2 ZFAS1 knockdown increases sensitivity to imatinib and inhibits glucose metabolism reprogramming in IM-R K562 cells
After ZFAS1 knockdown, its expression level significantly decreased in IM-R K562 cells (0.29 ± 0.02) compared with the si-NC group (1.00 ± 0.05, p <0.001, Figure 2A). Drug sensitivity assays utilizing CCK-8 demonstrated that ZFAS1 silencing significantly reduced cell viability and decreased the IC50 value of imatinib from 8.691 µM to 4.785 µM, indicating enhanced drug sensitivity in the si-ZFAS1 group compared to the si-NC group (Figures 2B, C). Colony formation assays further showed that ZFAS1 knockdown impaired the proliferative capacity of K562 cells, independent of imatinib treatment. In the absence of imatinib, ZFAS1-silenced cells formed significantly fewer colonies (15.87 ± 1.00) were than the si-NC group (38.93 ± 3.00, p <0.001, Figure 2D), indicating that ZFAS1 contributes to baseline cell proliferation. This inhibitory effect was further amplified upon treatment with 2 µM imatinib, with colony numbers reduced to 8.27 ± 0.80 in the si-ZFAS1 group compared to 26.73 ± 2.00 in the si-NC group (p <0.001, Figure 2D). Although the IM+si-NC group also exhibited a reduction in colony formation, this was attributed to the additive effect of imatinib and control siRNA transfection, rather than the transfection process itself. Therefore, the increased IM sensitivity is primarily attributable to the ZFAS1 knockdown (Figure 2D). Knockdown of ZFAS1 elevated the apoptosis rate in IM-treated (2 µM) imatinib-resistant K562 (IM-R K562) cells from 6.13% in the control group to 13.6% in ZFAS1-silenced cells (p <0.001, Figure 2E). Collectively, these findings suggest that ZFAS1 knockdown enhances the sensitivity of IM-R K562 cells to imatinib, inhibits their proliferation, and promotes apoptosis.
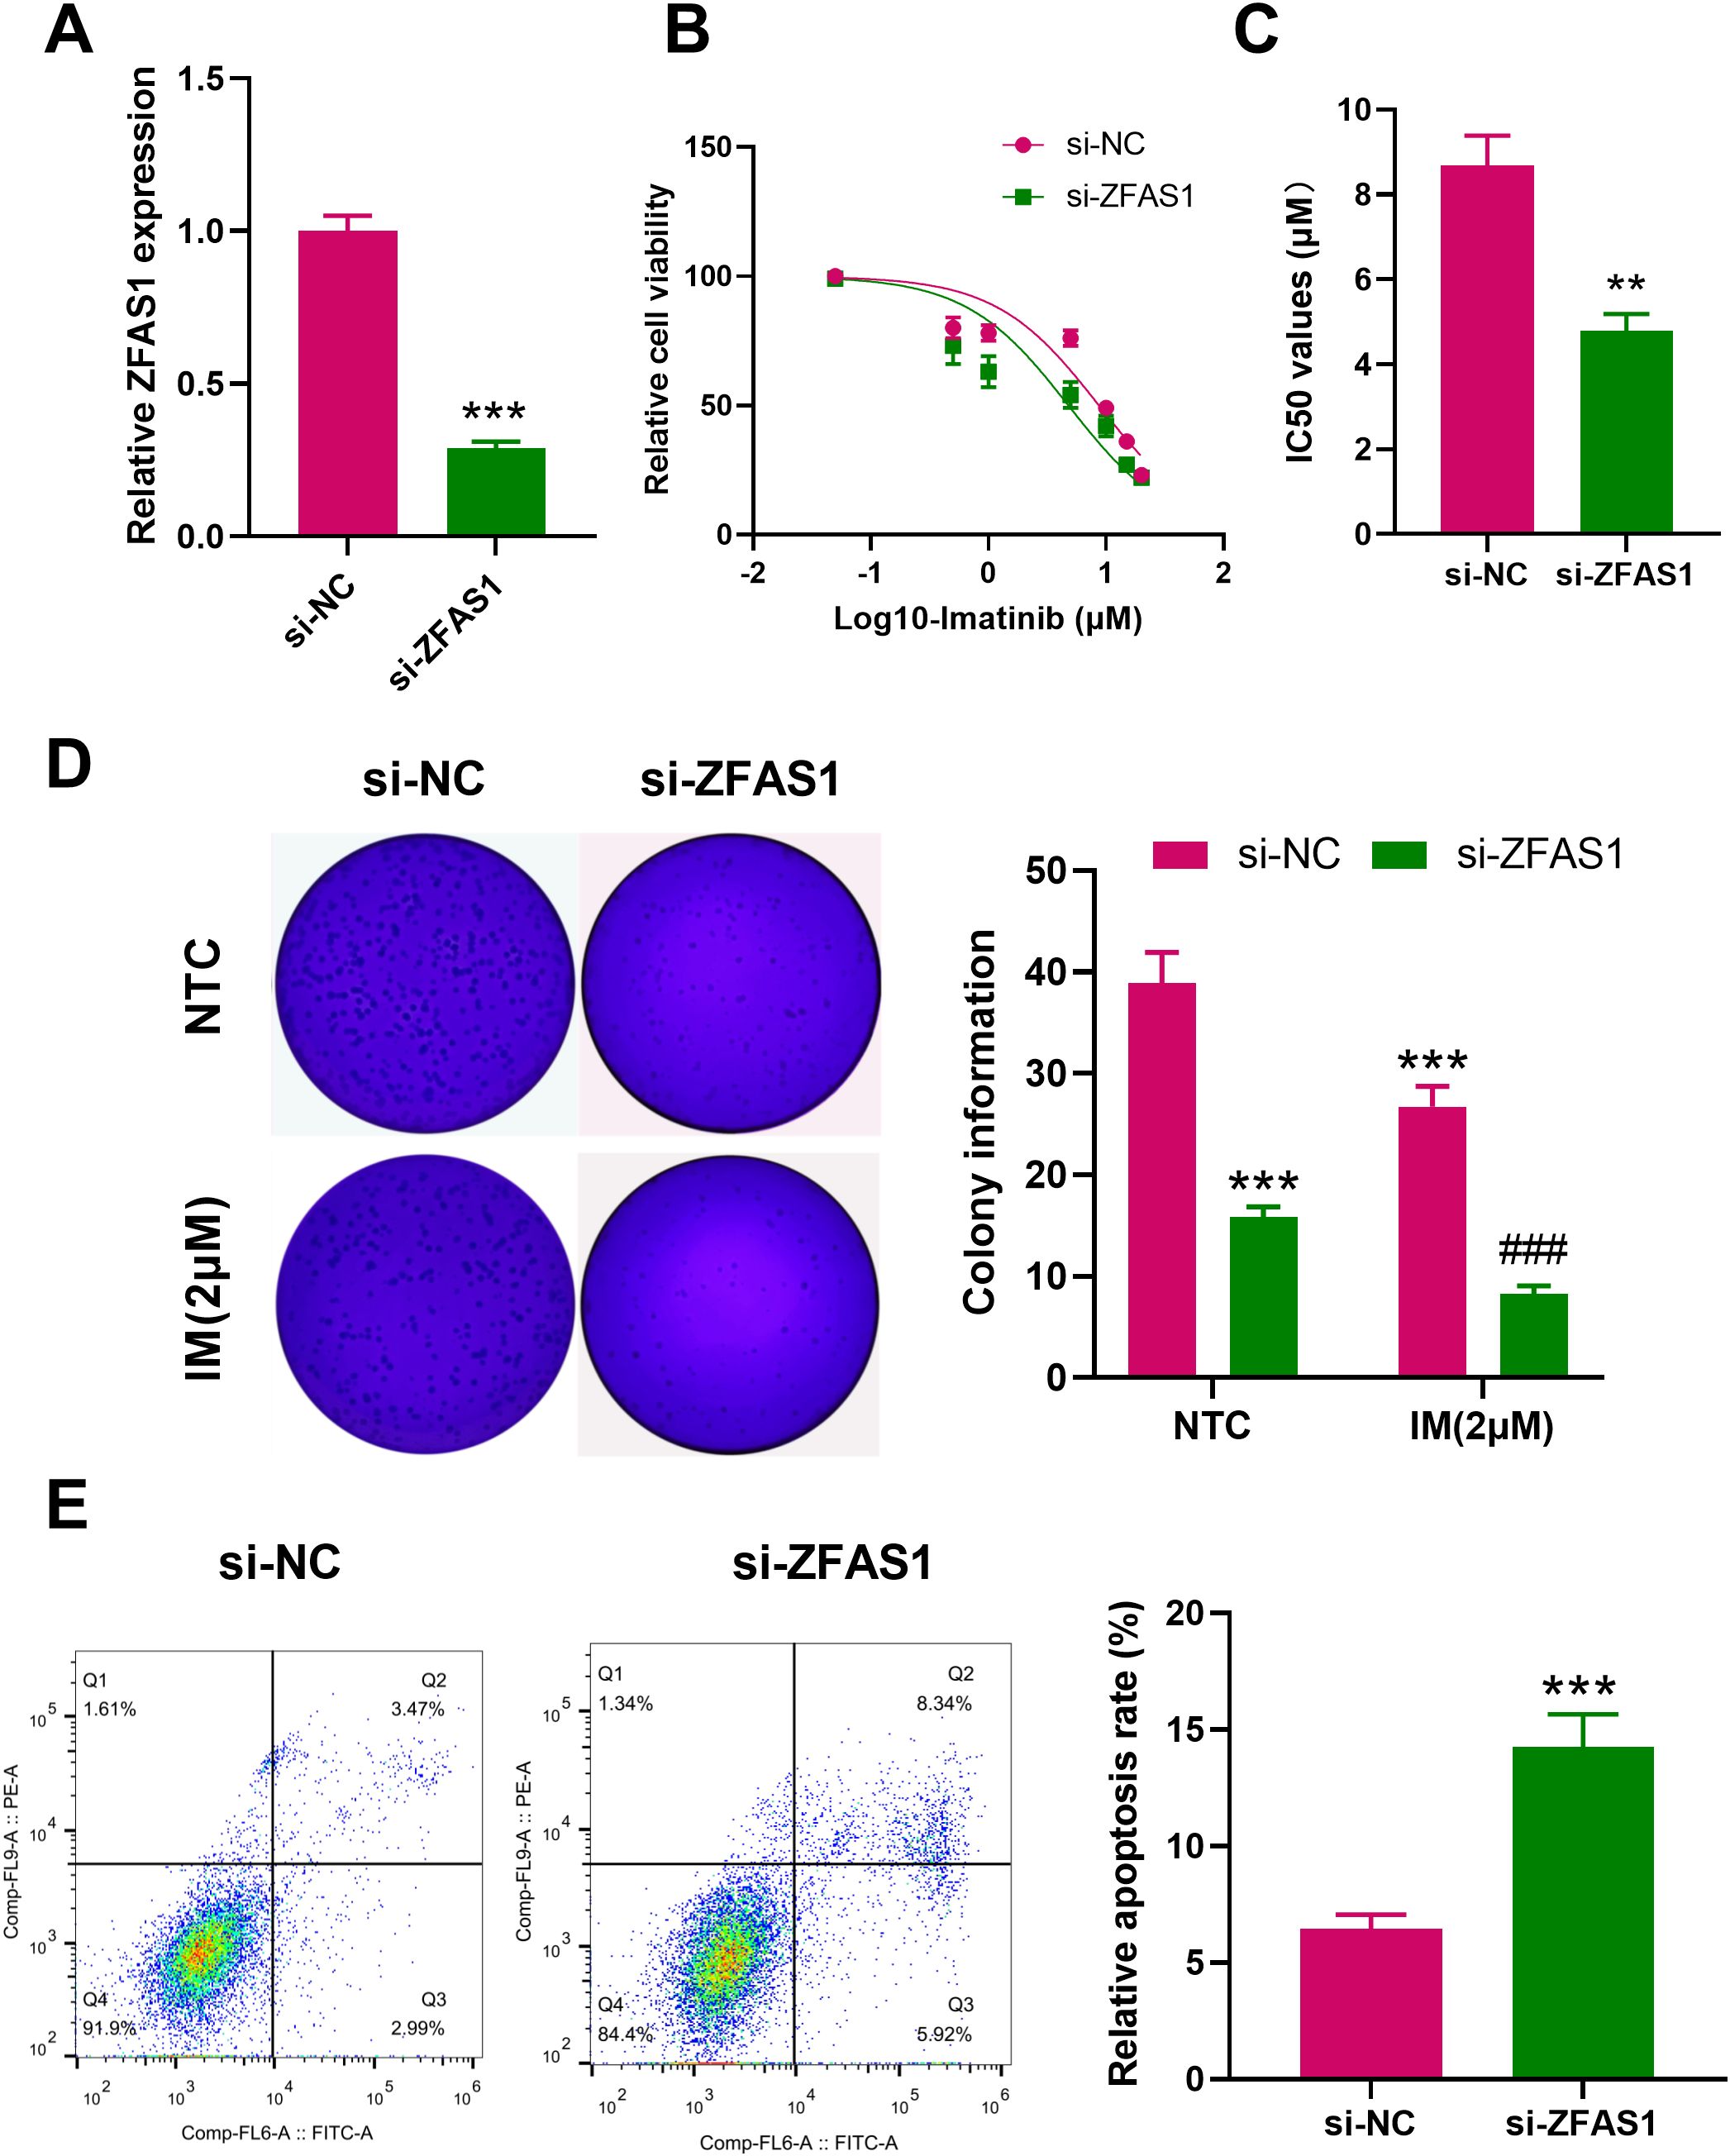
Figure 2. Effects of ZFAS1 knockdown on imatinib-resistant K562 cells. (A) PCR analysis showing the efficiency of ZFAS1 knockdown in IM-R K562 cells. (B) Drug sensitivity assay (CCK-8) showing relative cell viability of si-NC and si-ZFAS1 IM-R K562 cells treated with varying concentrations of IM. (C) IC50 values of imatinib in si-ZFAS1 cells and si-NC cells. (D) Colony formation assay showing the number of colonies formed by si-NC and si-ZFAS1 IM-R K562 cells treated with or without 2 µM IM. (E) Flow cytometry analysis showing the apoptosis rate of si-NC and si-ZFAS1 IM-R K562 cells treated with 2 µM IM. Data are presented as mean ± SD. NTC: non-treated control; **p<0.01, ***p<0.001 vs. si-NC; ###p<0.001 vs. IM+si-NC.
Knockdown of ZFAS1 significantly reduced glycolytic function in IM-R cells. Compared with the si-NC group, glucose uptake decreased from 1.00 ± 0.08 to 0.63 ± 0.05 (p < 0.001), lactate production decreased from 1.00 ± 0.08 to 0.54 ± 0.03 (p < 0.001), and ATP levels dropped from 1.00 ± 0.08 to 0.49 ± 0.03 (p < 0.001, Figures 3A–C). To further assess glycolytic function, ECAR was measured. As shown in Figures 3D, E, si-ZFAS1 cells exhibited a marked decrease in both basal glycolysis (11.33 ± 1.10, p <0.01) and glycolytic capacity (53.33 ± 4.6, p <0.01) compared to si-NC cells (29.52 ± 3.55; 69.54 ± 5.32). In contrast, mitochondrial oxidative phosphorylation was enhanced upon ZFAS1 knockdown. OCR analysis revealed that both basal (81 ± 6.2, p <0.01) and maximal respiration (194 ± 12.1, p <0.01) were significantly increased in si-ZFAS1 cells (49 ± 3.8; 114 ± 9.5, Figures 3F, G). These data suggested ZFAS1 plays a crucial role in the regulation of a metabolic shift from glycolysis to oxidative phosphorylation in IM-R K562 cells. The inhibition of glucose uptake and glycolysis, coupled with increased oxidative phosphorylation, highlights the metabolic reprogramming induced by ZFAS1 knockdown, which may contribute to the increased sensitivity to imatinib observed in these cells.
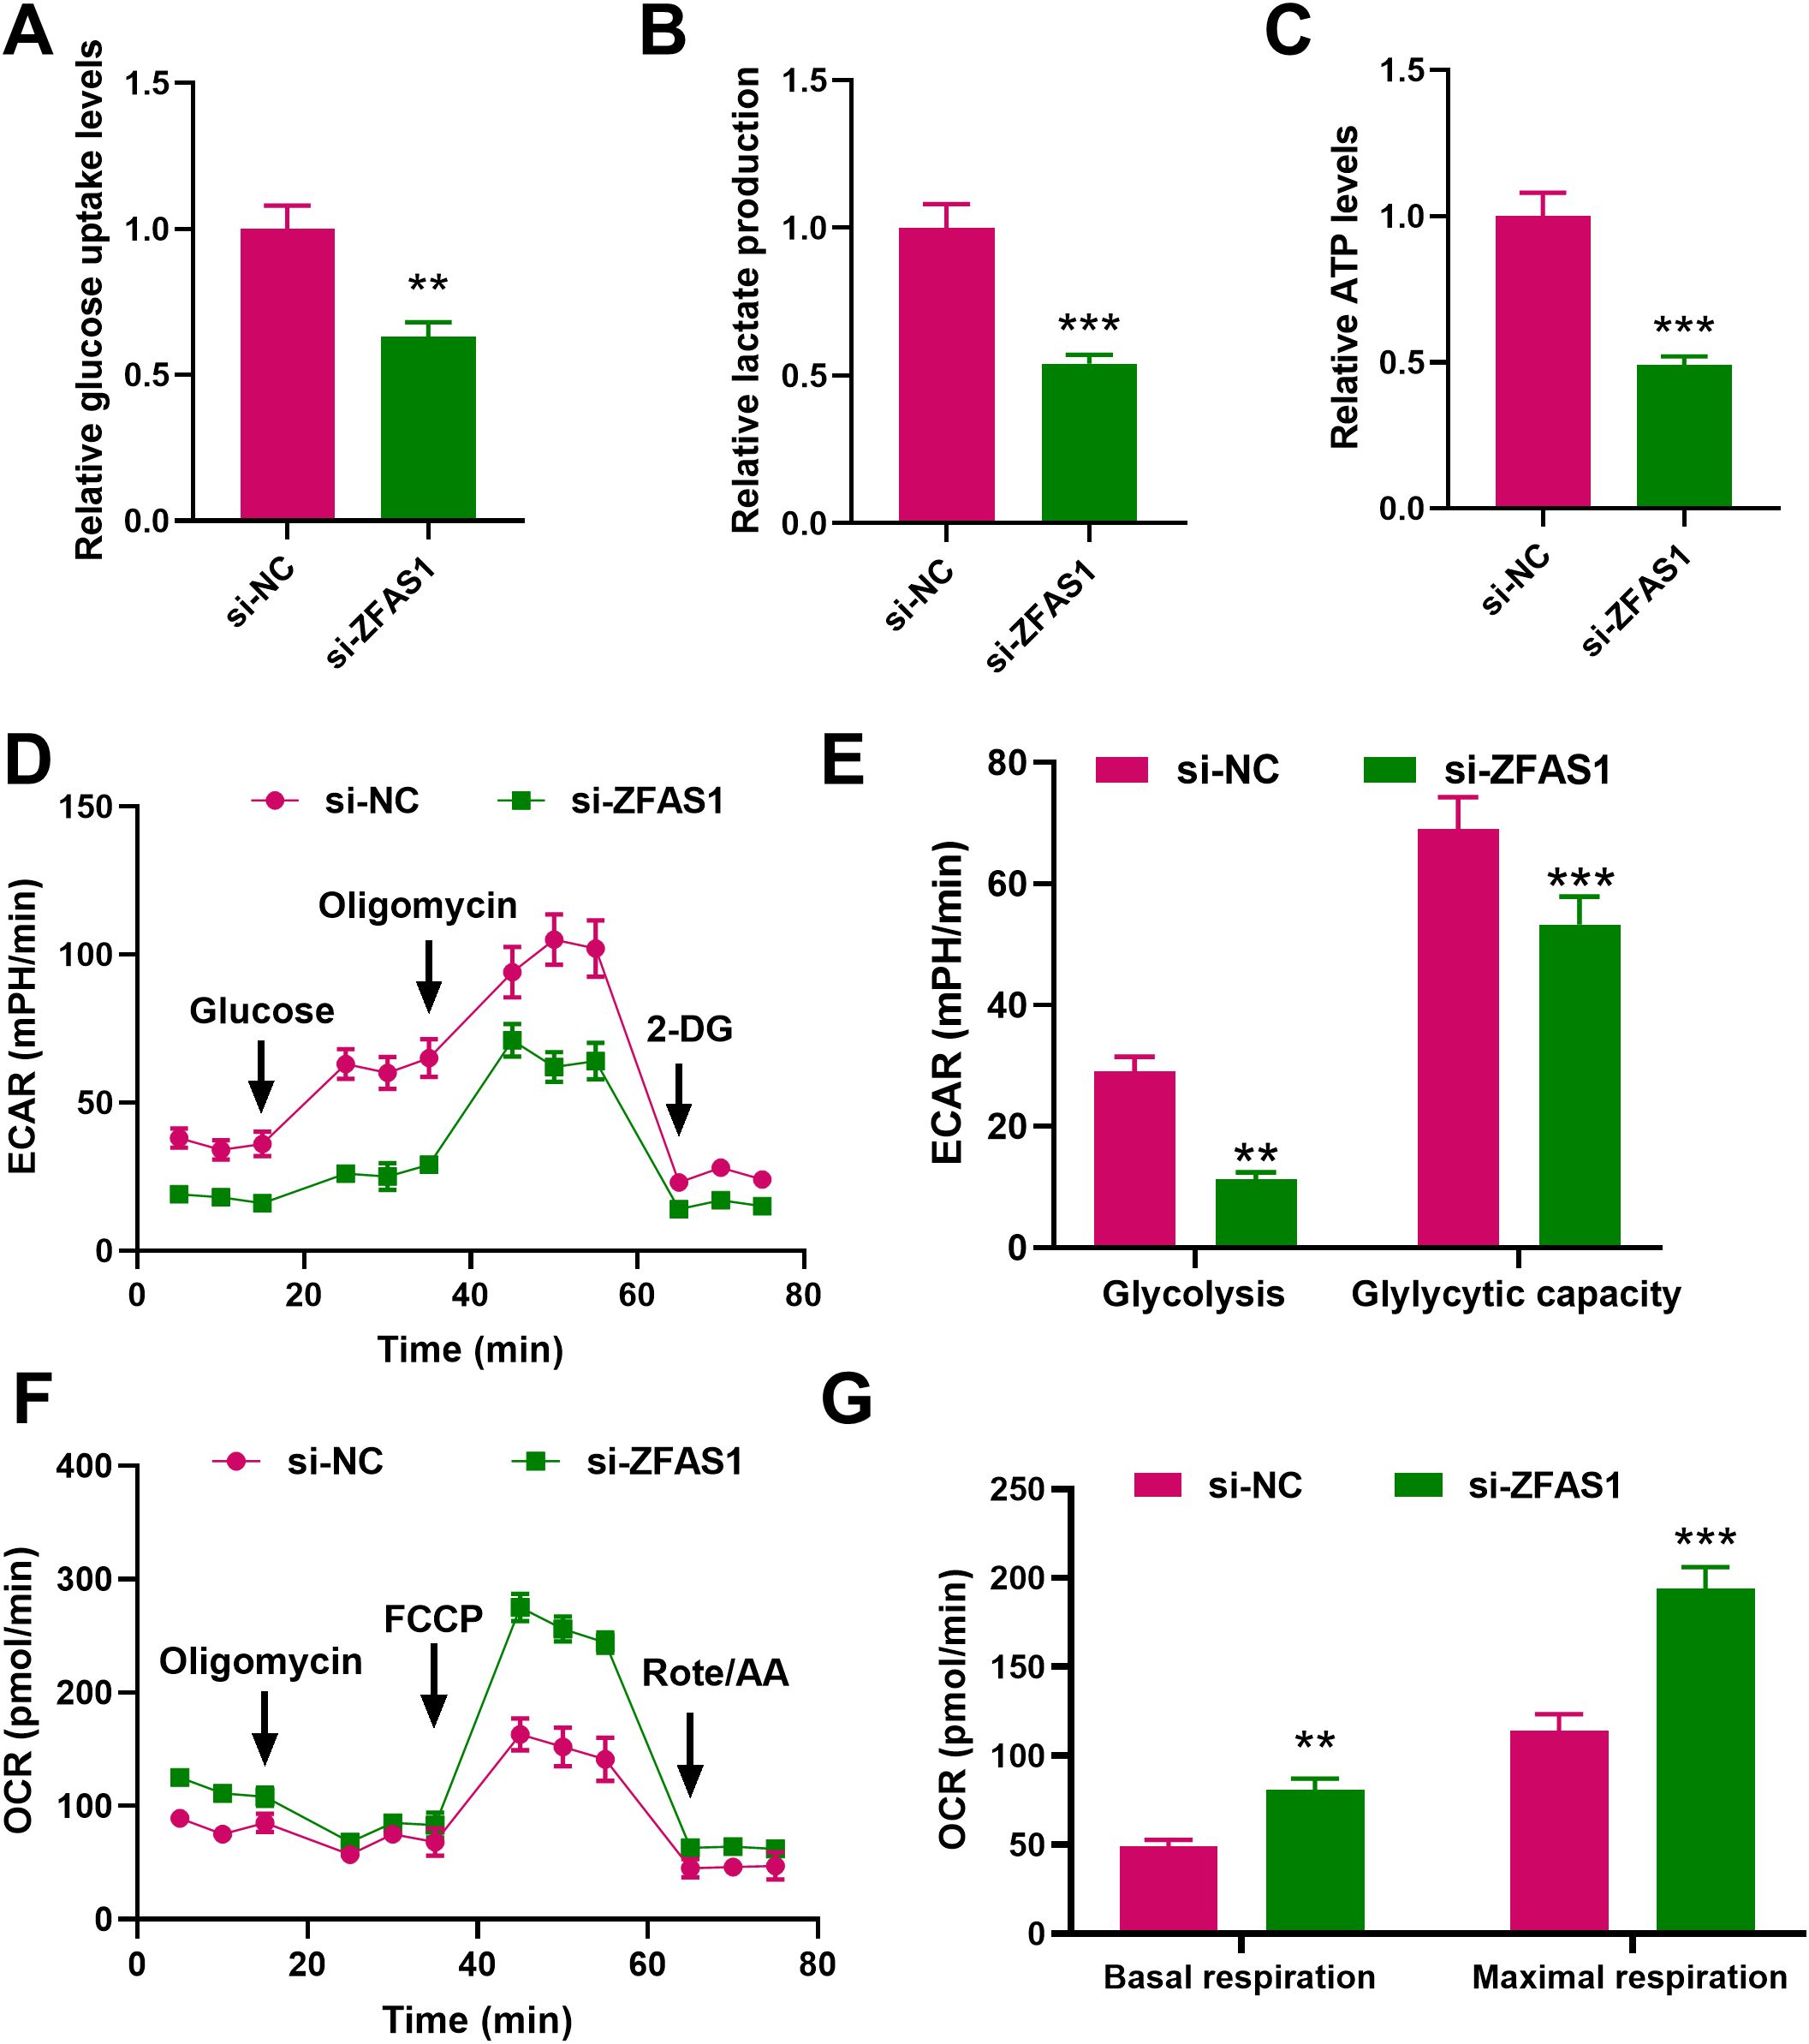
Figure 3. Effects of ZFAS1 knockdown on glucose metabolism in IM-R K562 cells. (A) Relative glucose uptake levels in si-NC and si-ZFAS1 IM-R K562 cells. (B) Relative lactate production in si-NC and si-ZFAS1 IM-R K562 cells. (C) Relative ATP levels in si-NC and si-ZFAS1 IM-R K562 cells. (D) Extracellular acidification rate (ECAR) in si-NC and si-ZFAS1 IM-R K562 cells. (E) Oxygen consumption rate (OCR) in si-NC and si-ZFAS1 IM-R K562 cells. (F) ECAR vs. OCR plot illustrating the metabolic shift in si-ZFAS1 IM-R K562 cells. (G) Comprehensive metabolic profile showing the impact of ZFAS1 knockdown on IM-R K562 cell metabolism. Data are presented as mean ± SD. **p<0.01, ***p<0.001 vs. si-NC.
3.3 Mechanism of ZFAS1 regulation of glucose metabolism reprogramming through STAT3 and IGF2BP2
Using the LncATLAS database, ZFAS1 was predicted to be predominantly located in the cytoplasm of CML cells. This was further confirmed by cytoplasmic/nuclear RNA separation experiments, which showed that ZFAS1 is mainly present in the cytoplasm (Figures 4A, B). RNA FISH was used to investigate the cellular localization of ZFAS1 in IM-R K562 cells (Figure 4C). The results showed that ZFAS1 was primarily localized in the cytoplasm of IM-R K562 cells. We hypothesized that ZFAS1 may exert its function in IM-R K562 cells through post-transcriptional regulation. It has been suggested that lncRNAs may interact with RBPs to regulate their downstream target genes. IGF2BP2, a classical RBP, has been shown in multiple studies to play a role in regulating mRNA stability, thereby affecting tumor progression. Bioinformatic analysis using the starBase database predicted that ZFAS1 might promote STAT3 expression through the IGF2BP2 (Figure 4D). After ZFAS1 silencing, STAT3 mRNA expression was markedly suppressed in IM-R cells, with levels dropping from 1.00 ± 0.10 in the si-NC+NC group to 0.24 ± 0.02 in the si-ZFAS1+NC group (p <0.001). However, this effect was reversed by the overexpression of IGF2BP2, with levels increasing from 0.24 ± 0.02 in the si-ZFAS1+NC group to 0.91 ± 0.08 in the si-ZFAS1+ IGF2BP2 group (p <0.001), indicating that ZFAS1 mediates STAT3 expression through IGF2BP2 (Figure 4E). Western blot analysis further confirmed the protein expression changes of STAT3 after ZFAS1 knockdown and IGF2BP2 overexpression (Figure 4F), which is consistent with the mRNA expression trends shown in Figure 4E. Moreover, RIP experiments demonstrated that ZFAS1 interacts with STAT3, and STAT3 co-immunoprecipitates with IGF2BP2. ZFAS1 knockdown significantly reduced IGF2BP2-mediated enrichment of STAT3 mRNA, with levels dropping from 3.28± 0.3 in the si-NC group to 1.24± 0.10 in the si-ZFAS1 group (p <0.001, Figure 4G), confirming the interaction between ZFAS1, STAT3, and IGF2BP2. ZFAS1 knockdown led to a decrease in the stability of STAT3 mRNA (p <0.001), an effect that was reversed by the overexpression of IGF2BP2 (p <0.05, Figure 4H). This indicates that ZFAS1 enhances the stability of STAT3 mRNA through IGF2BP2.These results elucidate the mechanism by which ZFAS1 regulates glucose metabolism reprogramming in CML cells. By interacting with IGF2BP2, ZFAS1 stabilizes STAT3 mRNA, thereby promoting STAT3 expression and contributing to IM-R.
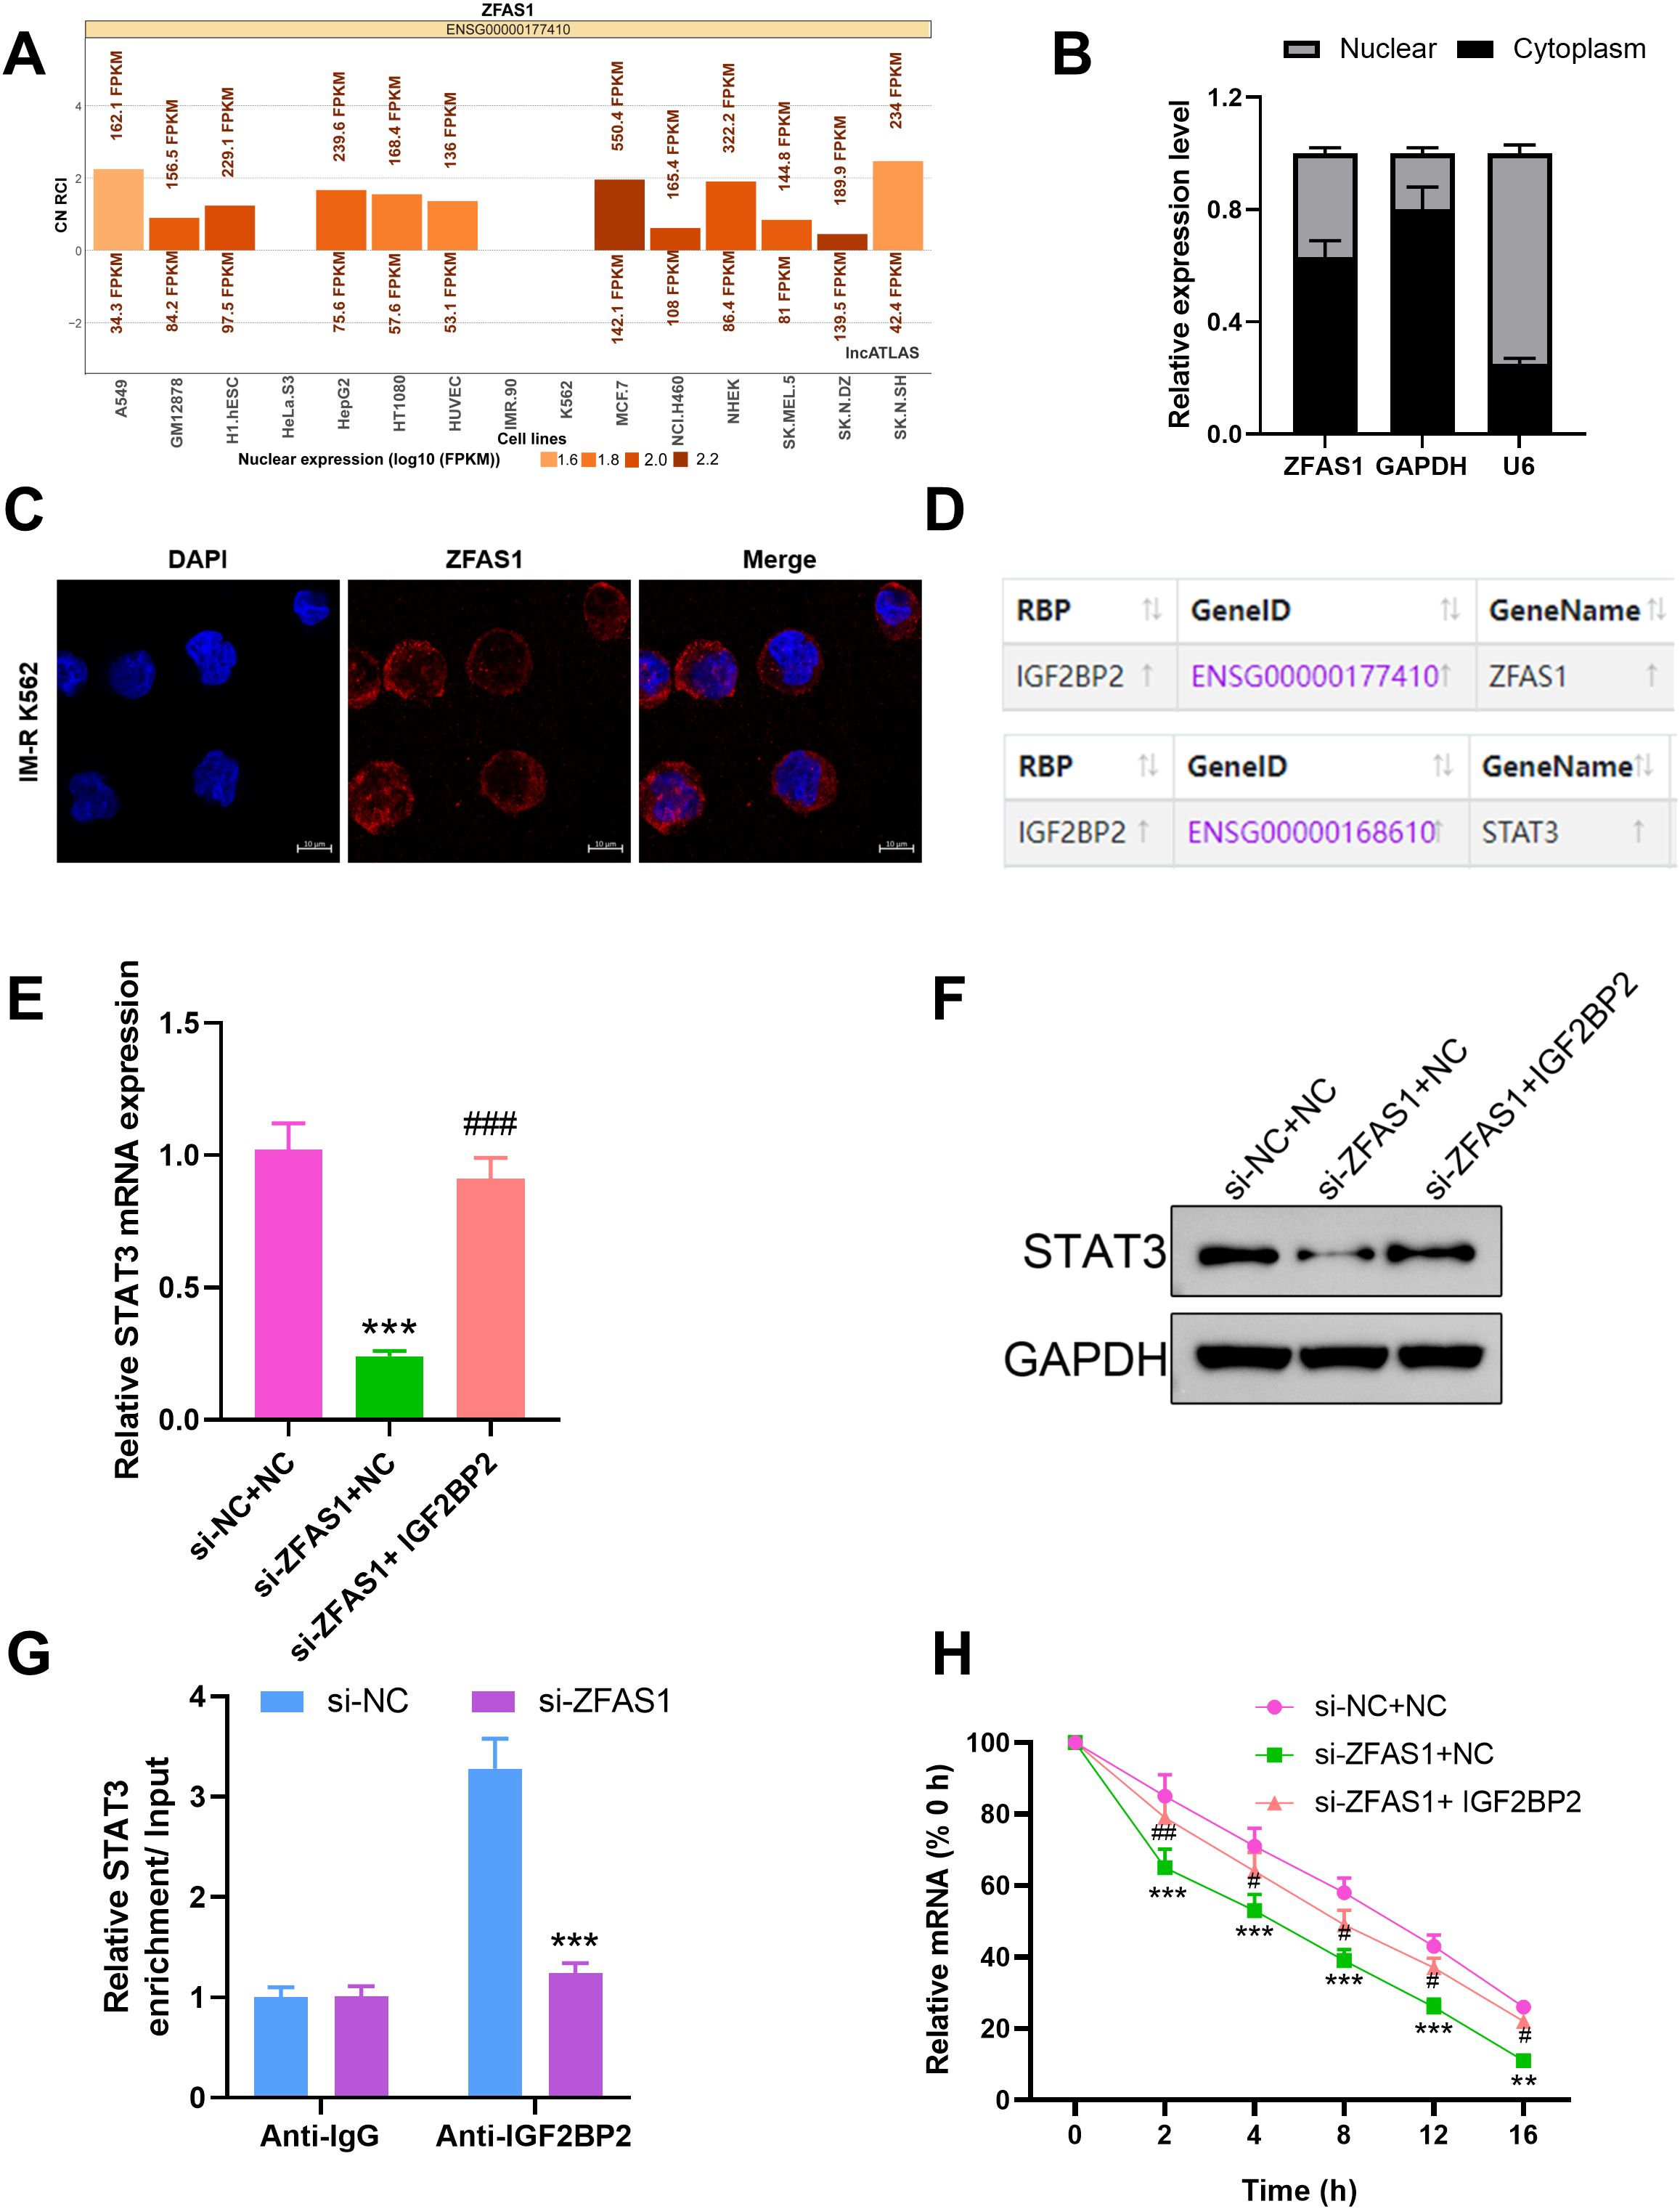
Figure 4. Mechanistic insights into ZFAS1 regulation of glucose metabolism through STAT3 and IGF2BP2 in CML cells. (A) Prediction of ZFAS1 localization using the LncATLAS database, indicating predominant cytoplasmic localization. (B) Cytoplasmic/nuclear RNA separation experiments confirming the cytoplasmic localization of ZFAS1 in CML cells. (C) RNA FISH showed that ZFAS1 located in the cytoplasm in cells, scale bars, 10 μm. (D) Bioinformatics prediction using starBase database showing potential interaction between ZFAS1 and IGF2BP2. (E, F) Effect of ZFAS1 knockdown on STAT3 expression and the reversal of this effect by IGF2BP2 overexpression. (G) RNA immunoprecipitation (RIP) analysis showing interaction between ZFAS1, STAT3, and IGF2BP2. Knockdown of ZFAS1 reverses STAT3 enrichment on IGF2BP2 protein. (H) Effect of ZFAS1 knockdown on STAT3 mRNA stability and the reversal of this effect by IGF2BP2 overexpression. **p<0.01, ***p<0.001 vs. si-NC or si-NC+NC; #p<0.05, ##p<0.01, ###p<0.001 vs. si-ZFAS1+NC.
3.4 STAT3 overexpression reverses the effects of ZFAS1 knockdown on imatinib sensitivity and glucose metabolism reprogramming in IM-R K562 cells
To explore whether STAT3 mediates the regulatory effects of ZFAS1 on imatinib sensitivity and metabolism, we performed rescue experiments by overexpressing STAT3 in ZFAS1-knockdown cells. Drug sensitivity assays showed that knockdown of ZFAS1 significantly enhanced the sensitivity of IM-R K562 cells to imatinib, as indicated by a decrease in the IC50 value IC50 value from 7.839 µM (p <0.001) to 4.216 µM (p <0.001). Overexpression of STAT3 reversed the increased sensitivity induced by ZFAS1 knockdown, as indicated by a decrease in the IC50 value IC50 value from 4.216 µM to 9.149 µM (p <0.001, Figures 5A, B). ZFAS1 knockdown resulted in a significant reduction in glucose uptake (0.63 ± 0.05), lactate production (0.54 ± 0.04), and ATP levels (0.49 ± 0.04) in IM-R K562 cells as compared to si-NC+NC group (1.00 ± 0.1). These effects on glucose uptake (0.98 ± 0.07), lactate production (0.96 ± 0.07), and ATP levels (0.94 ± 0.08) were reversed by the overexpression of STAT3, indicating that STAT3 can mitigate the metabolic alterations caused by ZFAS1 knockdown (p <0.001, Figures 5C-E). ECAR measurements showed that ZFAS1 knockdown significantly inhibited both basal glycolysis (10 ± 1.6, p <0.001) and glycolytic capacity (54 ± 4.2, p <0.001), which was rescued by STAT3 overexpression (25.67 ± 1.90; 68.67 ± 4.50, p <0.05/0.001, Figures 5F, G). OCR analysis showed that ZFAS1 knockdown significantly increased both basal (82 ± 6.2, p <0.001) and maximal mitochondrial respiration (194 ± 12.1, p <0.001), whereas STAT3 overexpression reversed these effects (55 ± 3.5; 130 ± 7.2, p <0.01/0.001, Figures 5H, I), indicating a metabolic shift from oxidative phosphorylation back to glycolysis.
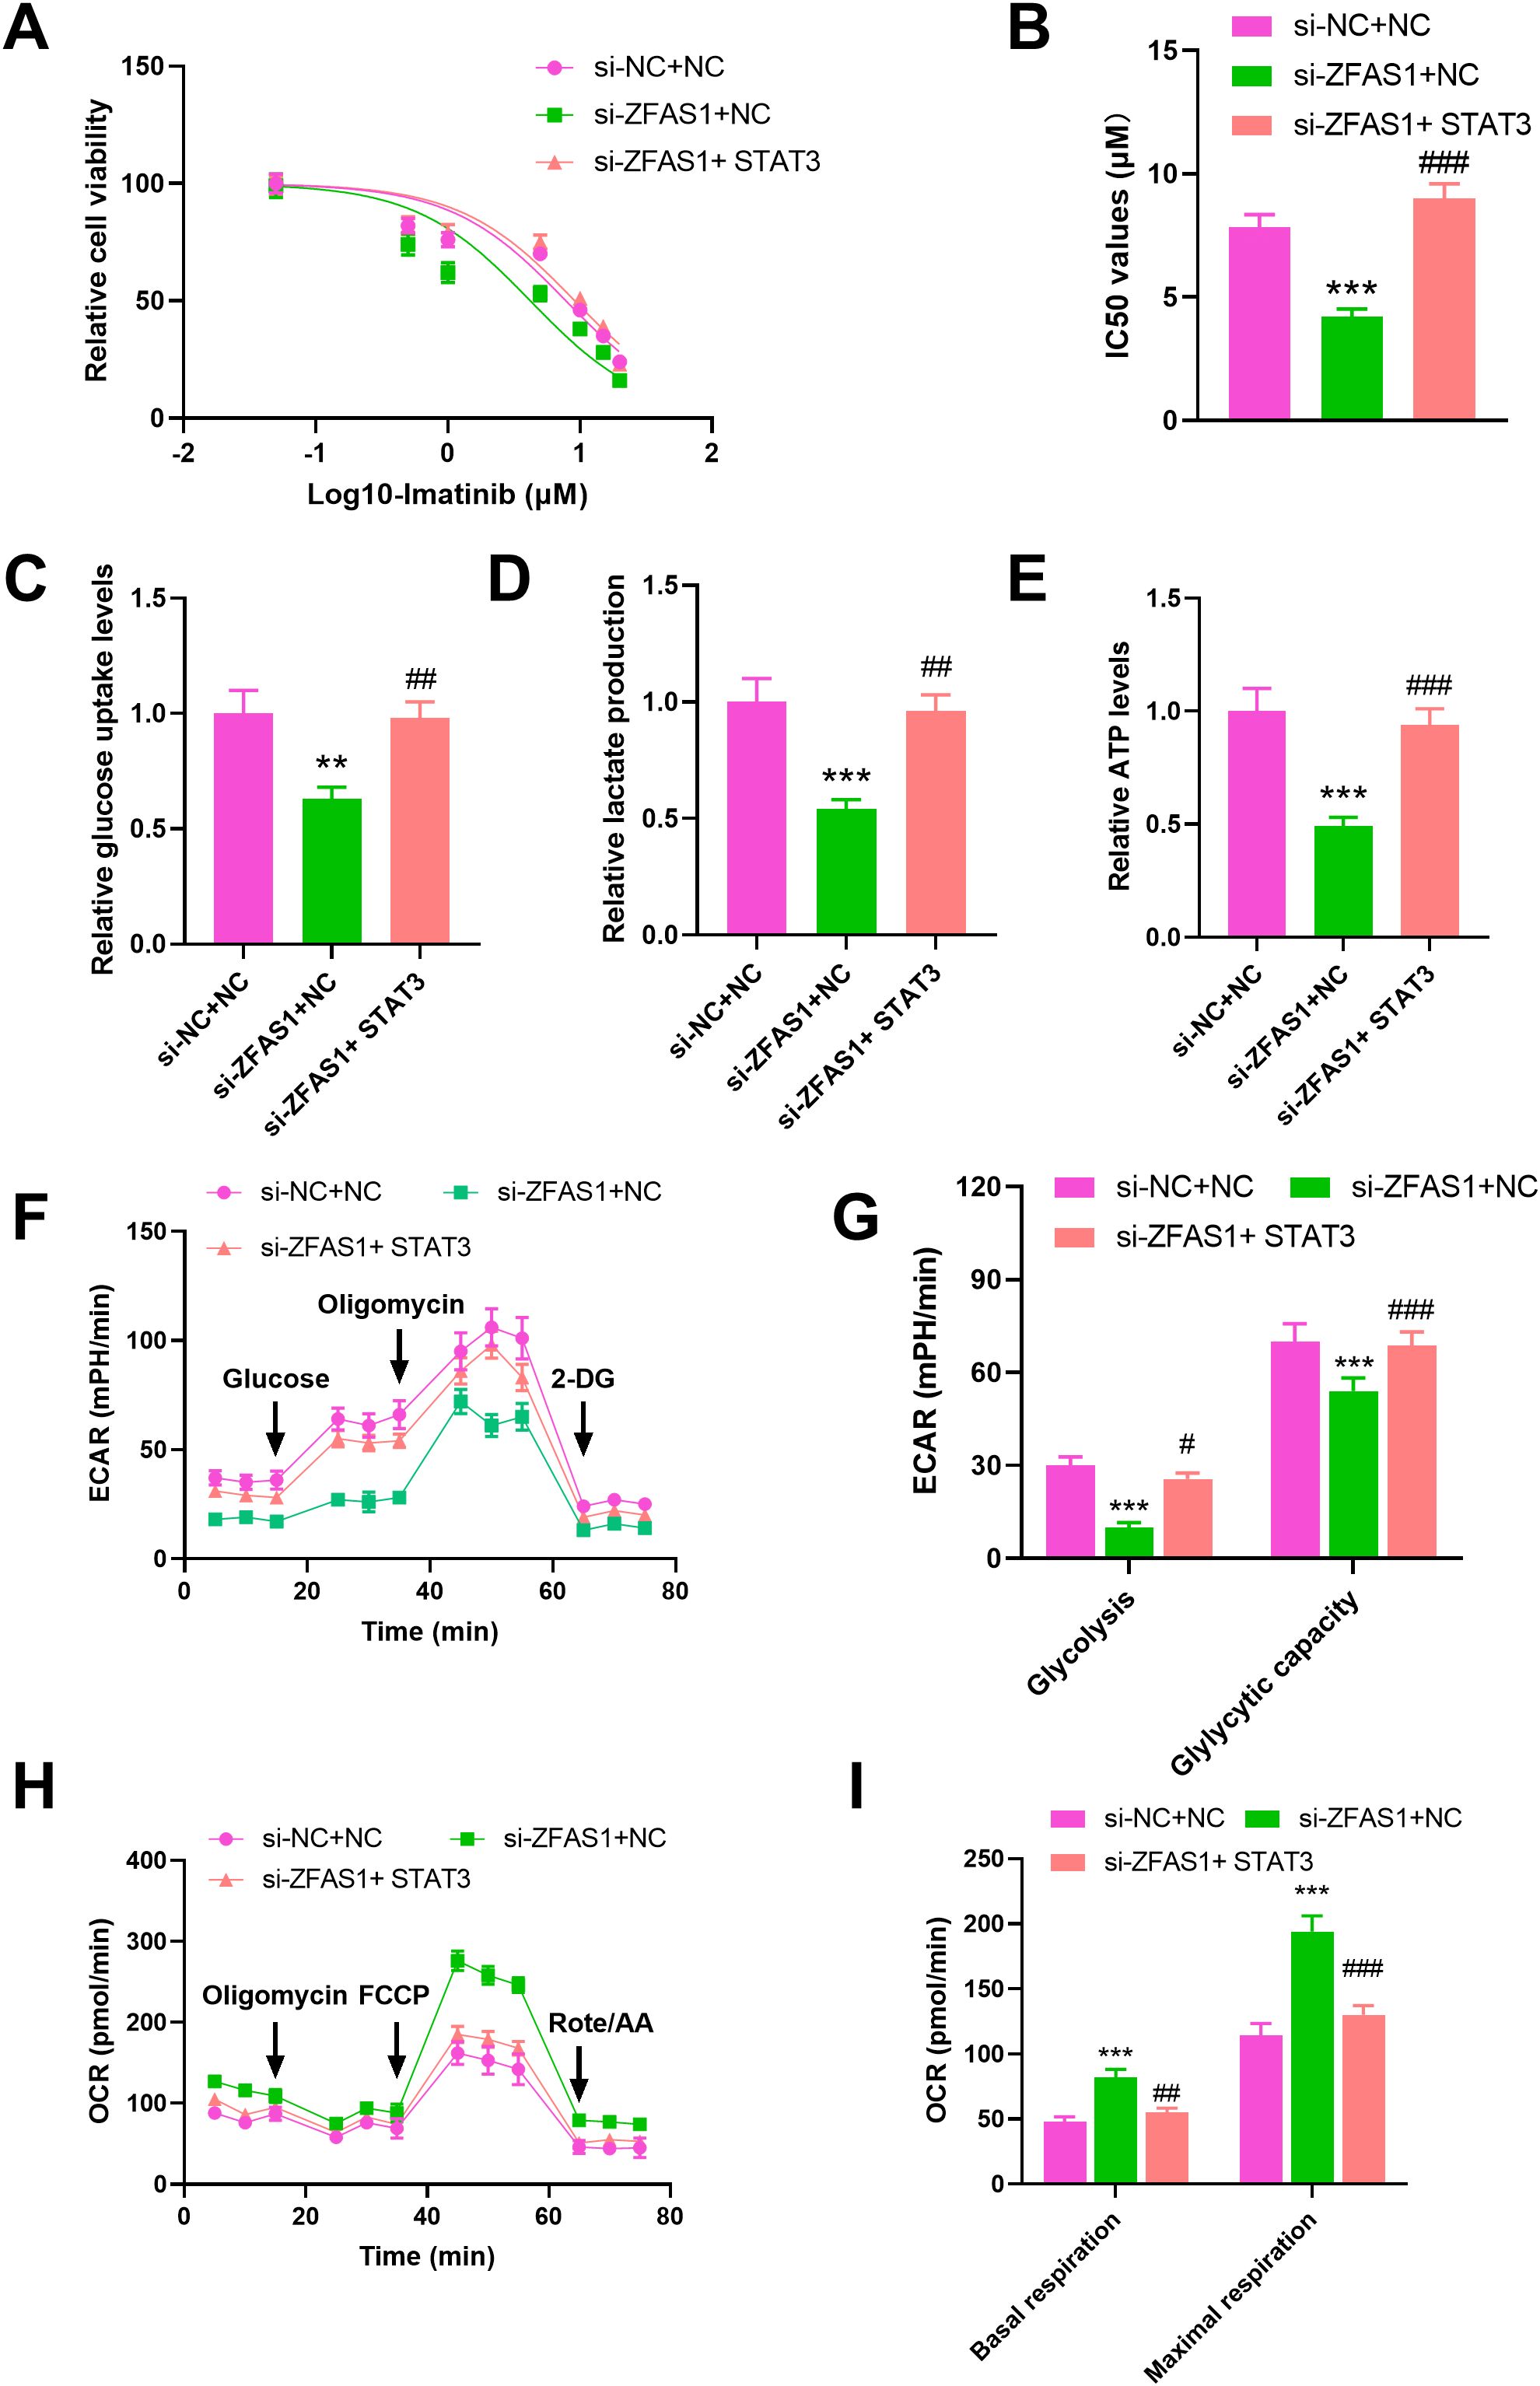
Figure 5. STAT3 overexpression reverses the effects of ZFAS1 knockdown on imatinib sensitivity and glucose metabolism reprogramming in IM-resistant K562 cells, including si-NC+NC, si-ZFAS1+NC, and si-ZFAS1+STAT3 IM-R K562 cells. (A) Drug sensitivity assay by CCK-8 showing relative cell viability of cells treated with varying concentrations of IM. (B) IC50 values were determined via CCK-8 assay after 48 hours of imatinib treatment. (C) Relative glucose uptake levels. (D) Relative lactate production. (E) Relative ATP levels. (F) ECAR over time. (G) Glycolysis and glycolytic capacity. (H) OCR over time. (I) Summary of basal respiration and maximal respiration. **p<0.01, ***p<0.001 vs. si-NC+NC; #p<0.05, ##p<0.01, ###p<0.001 vs. si-ZFAS1+NC.
3.5 ZFAS1 induces HIF1α upregulation through STAT3
To further confirm whether STAT3 mediates the effects of ZFAS1 on glycolytic activity, we overexpressed STAT3 in ZFAS1-silenced CML cells. This approach aimed to determine if restoration of STAT3 levels could rescue the metabolic suppression caused by ZFAS1 knockdown. In addition, we examined the expression of HIF1α, a key transcription factor involved in glycolysis (29), which is known to be transcriptionally regulated by STAT3 (30). Therefore, we assessed whether ZFAS1 influences the STAT3–HIF1α axis to regulate glycolysis in CML cells. We further assessed the protein levels of LDHA and PDK1, two well-established downstream targets of HIF1α. The expression level of STAT3 mRNA was significantly increased in IM-R K562 cells transfected with STAT3-overexpression vector (2.24 ± 0.20) compared to the NC group (1.01 ± 0.10, p <0.001), demonstrating successful overexpression (Figure 6A). Western Blot analysis (Figure 6B) revealed that knockdown of ZFAS1 introduced a reduction of HIF1α, LDHA, and PDK1 expression levels. However, the overexpression of STAT3 reversed the ZFAS1 knockdown effects, restoring the expression levels of these proteins. These findings indicate that ZFAS1 promotes the upregulation of HIF1α through the activation of STAT3. The elevated levels of HIF1α and its downstream targets suggest enhanced glycolytic activity, which may contribute to the metabolic reprogramming and drug resistance observed in CML cells.
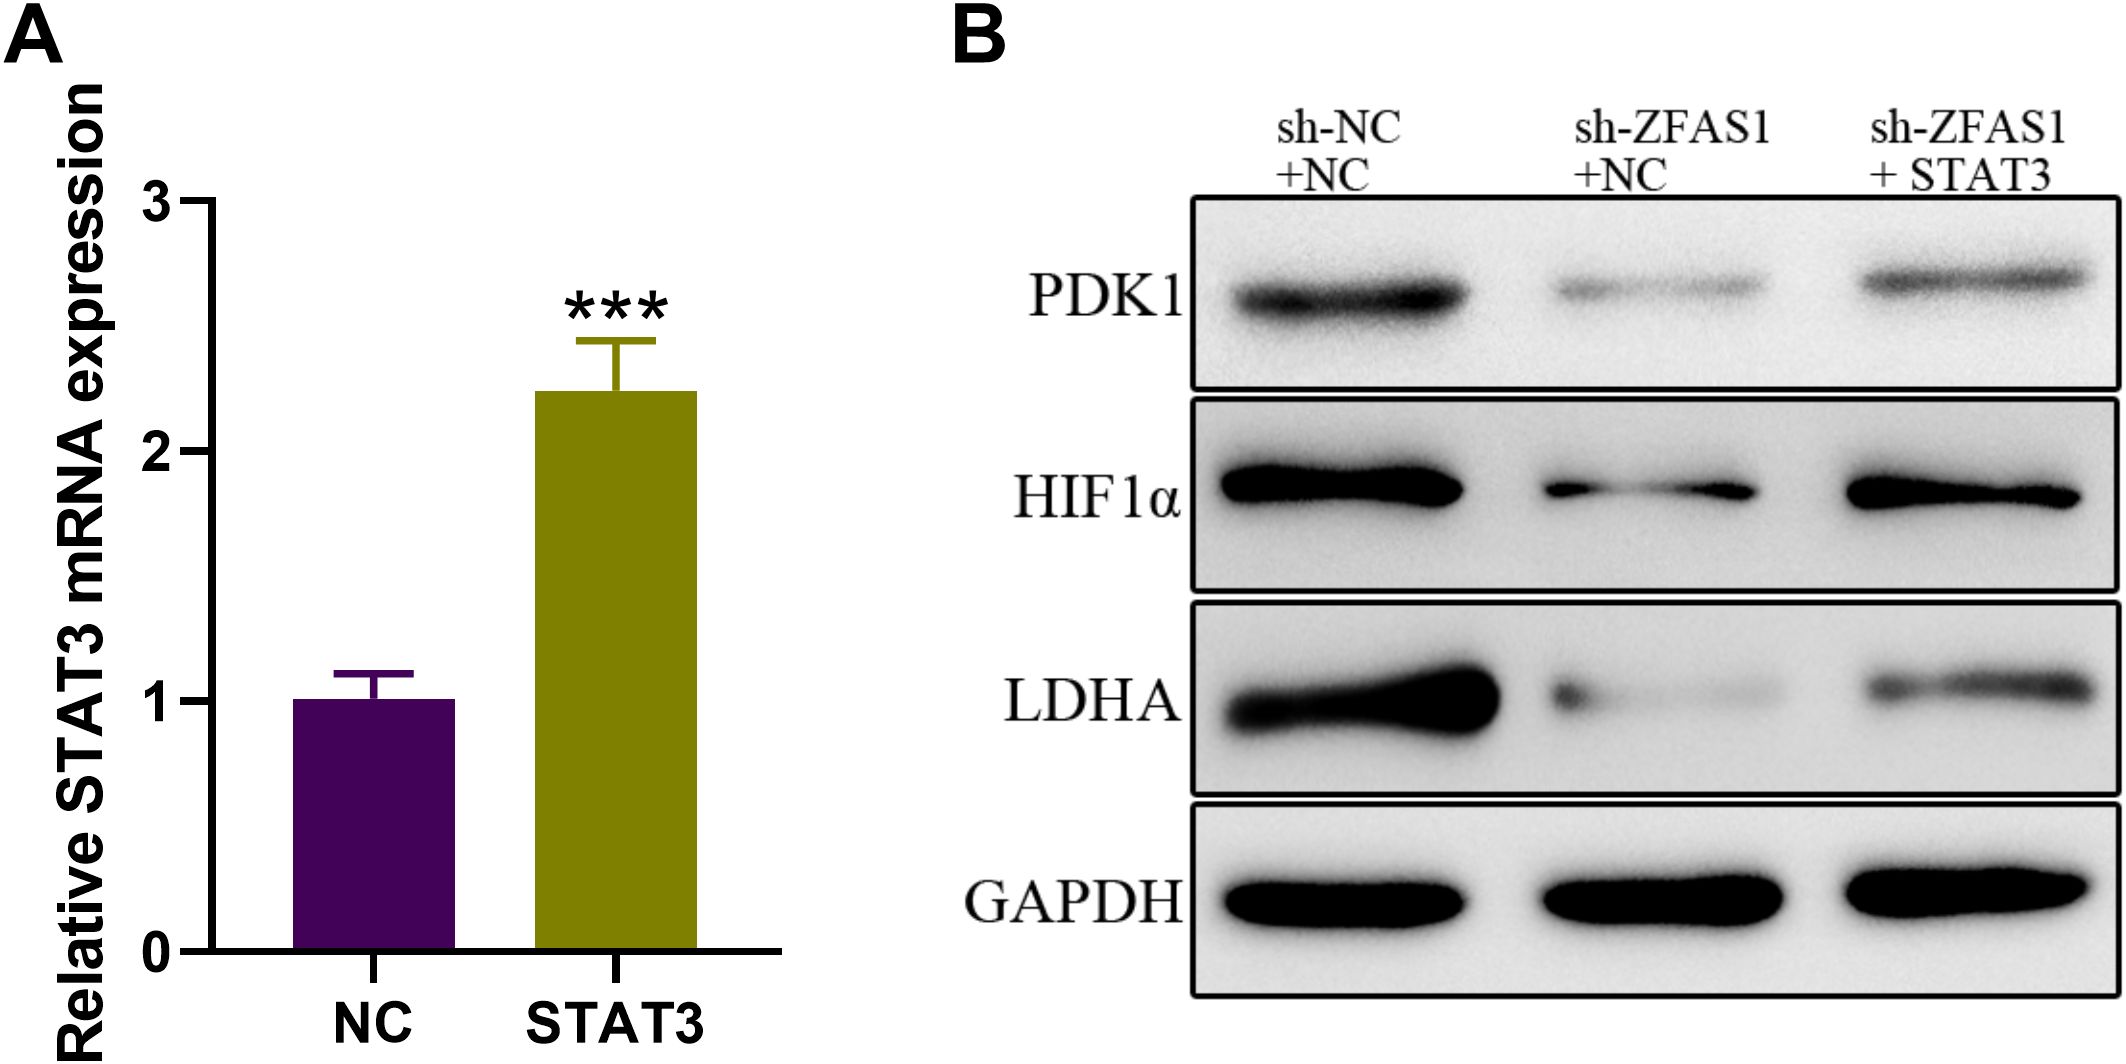
Figure 6. ZFAS1 promotes HIF1α upregulation through STAT3 in IM-resistant K562 cells. (A) Relative expression of STAT3 in IM-R K562 cells transfected with STAT3 plasmid compared to negative control (NC). (B) Western blot analysis showing the protein expression levels of HIF1α, LDHA, and PDK1 in si-NC, si-ZFAS1, and si-ZFAS1 + STAT3 transfected IM-R K562 cells. Data are presented as mean ± SD. ***p<0.001 vs. NC.
3.6 2-DG reverses the effect of STAT3 overexpression on imatinib sensitivity in IM-R K562 cells
Drug sensitivity assays using CCK-8 showed that overexpression of STAT3 significantly decreased the sensitivity of IM-R K562 cells to imatinib, as evidenced by an increased IC50 value. However, treatment with the glycolysis inhibitor 2-DG reversed the effect of STAT3 overexpression, restoring imatinib sensitivity in these cells (Figure 7A). Specifically, the IC50 value for imatinib in STAT3-overexpressing cells (11.48 µM, p <0.01) was significantly higher compared to control cells (7.929 µM), but this increase was negated by 2-DG treatment (9.063 µM, p <0.05, Figure 7B). STAT3-mediated imatinib resistance in IM-R K562 cells is, at least in part, dependent on enhanced glycolytic activity. The reversal of this resistance by 2-DG highlights the potential therapeutic utility of targeting glycolysis in overcoming STAT3-induced drug resistance in CML.
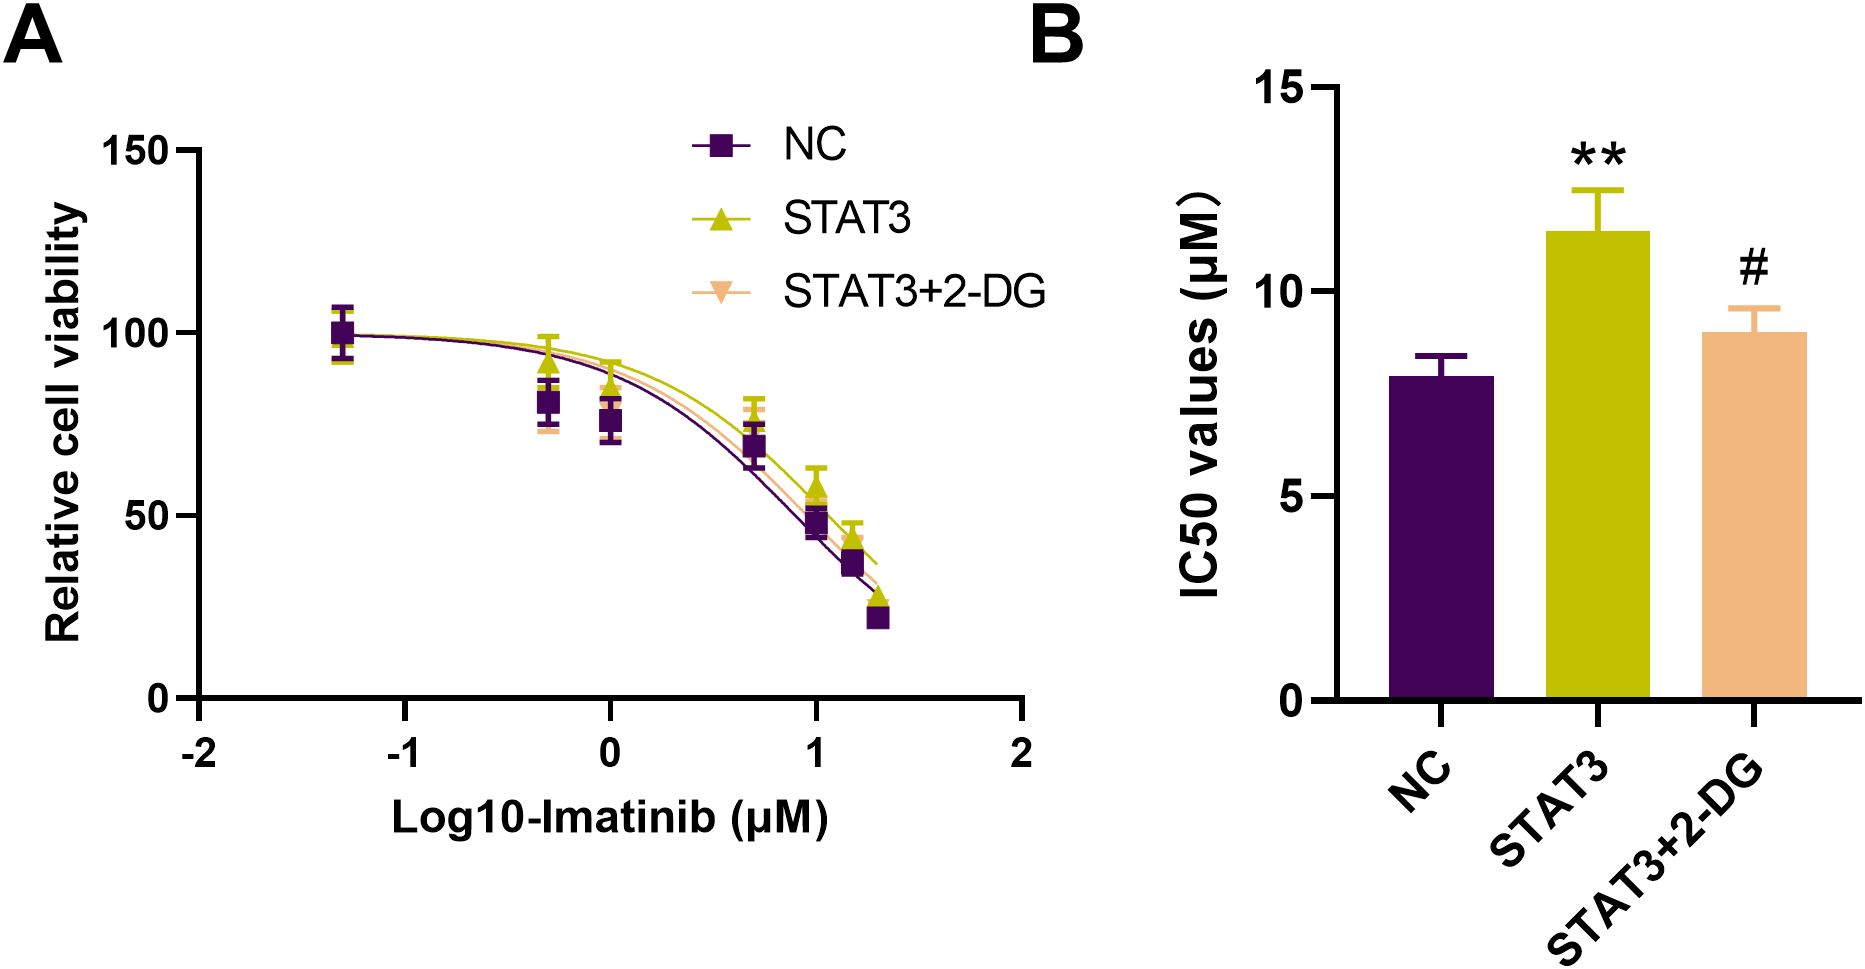
Figure 7. Effect of 2-DG on STAT3-mediated imatinib resistance in IM-R K562 cells. (A) CCK-8 assay shows relative cell viability of IM-R K562 cells with negative control (NC), STAT3 overexpression (STAT3), and STAT3 treated with 2-DG (STAT3 + 2-DG) under varying concentrations of imatinib. (B) IC50 values were determined via CCK-8 assay after 48 hours of imatinib treatment. **p<0.01 vs. NC; #p<0.05 vs. STAT3.
4 Discussion
In this study, we demonstrate that the long noncoding RNA ZFAS1 exerts oncogenic effects in CML by promoting glucose metabolism and activating STAT3 signaling. Our findings align with prior reports highlighting ZFAS1’s involvement in other hematologic malignancies and solid tumors. Notably, ZFAS1 has been implicated in enhancing glycolysis and tumor proliferation via its interaction with key metabolic regulators.
Previously, it is highlighted the role of lncRNAs in cancer progression and drug resistance, but the specific involvement of ZFAS1 in CML resistance mechanisms was not well understood before this study (31). The present study further demonstrated that knocking down ZFAS1 expression using shRNA strongly increased the sensitivity of IM-R CML cells to imatinib treatment. These findings suggest that ZFAS1 may be a potential therapeutic target for overcoming IM resistance in CML. Notably, the upregulation of ZFAS1 has been extensively reported in various malignancies, where it contributes to tumor progression and metastasis (32). Moreover, ZFAS1 has also been associated with drug resistance in multiple cancer types, such as melanoma, ovarian cancer, and hepatocellular carcinoma (32). The current findings regarding the involvement of ZFAS1 in IM resistance in CML are consistent with these previous reports and further underscore the therapeutic potential of targeting ZFAS1 in cancer treatment. In addition, knockdown of the ZFAS1 has been shown to significantly alter the metabolic profile of cancer cells. In our study, ZFAS1 knockdown in IM-R K562 cells induced a metabolic shift from glycolysis toward oxidative phosphorylation. These results provide new mechanistic insights into the anti-tumor effects of ZFAS1 inhibition and reveal the metabolic adaptations associated with overcoming drug resistance.
A previous study demonstrated that compared to CML patients in chronic phase (CML-CP), the expression of STAT3 in the bone marrow samples of CML patients in accelerated phase/blast phase (CML-AP/BP) was significantly elevated; additionally, the level of STAT3 expression in IM-R K562/G01 cells was significantly higher than that in K562 cells (33). In our study, the expression of STAT3 is significantly elevated in IM-R K562 cells. The study demonstrates a positive correlation between the expression of STAT3 and ZFAS1. However, the potential interaction between STAT3 and ZFAS1 is still unclear. The selection of IGF2BP2 as a key interacting protein in this study is based on its well-established role as an RBP that regulates the stability and translation of specific mRNAs. IGF2BP2 has been implicated in the stabilization of mRNAs involved in critical cellular processes such as growth, differentiation, and metabolism, which are essential for cancer progression. Besides, many studies reported that lncRNAs has been reported to regulate downstream genes through interacting with IGF2BP2 (34–39). Furthermore, starBase database predicts that both ZFAS1 and STAT3 bind to IGF2BP2. ZFAS1 was found to interact with IGF2BP2, enhancing the stability of STAT3 mRNA and thereby promoting STAT3 expression. The upregulation of STAT3 by ZFAS1 was shown to lead to the increased expression of HIF1α. The elevated HIF1α, in turn, resulted in the increased expression of the glycolytic enzymes LDHA and PDK1. The mechanism proposed in this study, where ZFAS1 interacts with IGF2BP2 to stabilize STAT3 mRNA and promote its expression, provides a novel insight into the regulation of STAT3 in the context of CML drug resistance (40). Previous study has also highlighted the oncogenic role of STAT3 in various cancers, where its constitutive activation is associated with poor prognosis and treatment resistance (41). The current findings build upon this by revealing the interplay between ZFAS1, IGF2BP2, and STAT3, which appears to be an important mechanism driving cancer progression. The regulation of HIF1α, LDHA, and PDK1 by the ZFAS1-STAT3 axis is a novel insight that can have significant implications for understanding and targeting cancer metabolism.
Previous studies have also highlighted the role of STAT3 activation in conferring resistance to BCR::ABL1 inhibitors, including imatinib, in CML (42). Also, STAT3’s central role in mediating drug resistance in CML through metabolic reprogramming. For instance, Tezcanli Kaymaz et al. (43) reported that STAT3 silencing sensitizes nilotinib-resistant CML cells by switching their energy metabolism from glycolysis to mitochondrial respiration. Our data further support this by demonstrating that inhibition of ZFAS1 reduces STAT3 expression and downregulates glycolytic enzyme expression, leading to diminished glucose uptake and lactic acid production. Moreover, our use of the glycolytic inhibitor 2-DG revealed that ZFAS1’s effects on CML cell survival are, at least in part, mediated by glycolysis. This is consistent with the observations of Patel et al. (44), who showed that STAT3 promotes drug persistence in CML by shifting cellular metabolism toward glycolysis, thereby supporting leukemic stem cell survival. Interestingly, the role of STAT3 in cancer is not restricted to CML. In lung cancer, Zheng et al. (45) demonstrated that STAT3 inhibitors could sensitize resistant cells to EGFR-TKIs, further implicating STAT3 as a universal driver of drug resistance via metabolic control. These cross-cancer observations support the broader relevance of our findings and the therapeutic potential of targeting the ZFAS1–STAT3 axis.
There are still some research limitations in this study. This study primarily focused on in vitro experiments. In vivo studies are required to confirm the therapeutic potential of targeting the ZFAS1/STAT3 axis in animal models and clinical settings. While the study provided insights into the interaction between ZFAS1 and STAT3, further investigation is needed to fully elucidate the downstream signaling pathways and molecular mechanisms involved in glucose metabolism reprogramming.
While our study provides compelling evidence for the involvement of the ZFAS1/STAT3 axis in regulating IM resistance in CML cells through reprogramming of glucose metabolism, the findings are limited by the exclusive use of in vitro models. Further studies, particularly in animal models, are needed to validate these findings and assess their physiological relevance in a whole-organism context. Such investigations will contribute to a more comprehensive understanding of the therapeutic potential of targeting the ZFAS1/STAT3 pathway in CML. To facilitate the clinical translation of these findings, future studies should include well-designed clinical trials aimed at evaluating the efficacy of ZFAS1 and STAT3 as therapeutic targets for overcoming imatinib resistance. Beyond this, broader transcriptomic and signaling analyses should encompass additional lncRNAs and pathways that may interact with ZFAS1 and STAT3, thereby elucidating the complexity of resistance mechanisms. Moreover, the exploration of combination therapies involving glycolysis inhibitors, like 2-DG, in conjunction with imatinib and other TKIs, should be pursued in both preclinical and clinical settings to develop more effective treatment strategies for patients with CML (46). Furthermore, long-term studies are needed to assess the sustained impact of targeting the ZFAS1/STAT3 axis on CML progression, relapse rates, and overall patient survival.
Collectively, our study highlights a novel regulatory mechanism by which ZFAS1 enhances STAT3 activation and glycolysis in CML. This mechanism provides insight into how metabolic reprogramming supports TKI resistance and suggests that ZFAS1 or STAT3 could serve as therapeutic targets to overcome resistance and improve treatment outcomes.
Data availability statement
The raw data supporting the conclusions of this article will be made available by the authors, without undue reservation.
Ethics statement
The studies involving humans were approved by the Biomedical Ethics Committee of Inner Mongolia Medical University. The studies were conducted in accordance with the local legislation and institutional requirements. The participants provided their written informed consent to participate in this study.
Author contributions
LY: Conceptualization, Data curation, Formal analysis, Investigation, Methodology, Project administration, Software, Supervision, Validation, Visualization, Writing – original draft. YH: Conceptualization, Data curation, Formal analysis, Funding acquisition, Methodology, Project administration, Resources, Software, Supervision, Validation, Visualization, Writing – review & editing.
Funding
The author(s) declare that no financial support was received for the research and/or publication of this article.
Conflict of interest
The authors declare that the research was conducted in the absence of any commercial or financial relationships that could be construed as a potential conflict of interest.
Generative AI statement
The author(s) declare that no Generative AI was used in the creation of this manuscript.
Publisher’s note
All claims expressed in this article are solely those of the authors and do not necessarily represent those of their affiliated organizations, or those of the publisher, the editors and the reviewers. Any product that may be evaluated in this article, or claim that may be made by its manufacturer, is not guaranteed or endorsed by the publisher.
References
1. Kumar R and Krause DS. Recent advances in understanding chronic myeloid leukemia: where do we stand? Fac Rev. (2021) 10:35. doi: 10.12703/r/10-35
2. Kantarjian H, Jabbour E, and O’Brien S. Chronic myelogenous leukemia. Mol Hematol. (2024), 83–97. doi: 10.1002/9781394180486.ch6
3. Milojkovic D and Apperley J. Mechanisms of resistance to imatinib and second-generation tyrosine inhibitors in chronic myeloid leukemia. Clin Cancer Res. (2009) 15:7519–27. doi: 10.1158/1078-0432.CCR-09-1068
4. Osman AEG and Deininger MW. Chronic Myeloid Leukemia: Modern therapies, current challenges and future directions. Blood Rev. (2021) 49:100825. doi: 10.1016/j.blre.2021.100825
5. Quintas-Cardama A, Kantarjian HM, and Cortes JE. Mechanisms of primary and secondary resistance to imatinib in chronic myeloid leukemia. Cancer Control. (2009) 16:122–31. doi: 10.1177/107327480901600204
6. Jabbour E, Parikh SA, Kantarjian H, and Cortes J. Chronic myeloid leukemia: mechanisms of resistance and treatment. Hematol Oncol Clin North Am. (2011) 25:981–95, v. doi: 10.1016/j.hoc.2011.09.004
7. Alves R, Goncalves AC, Rutella S, Almeida AM, De Las Rivas J, Trougakos IP, et al. Resistance to tyrosine kinase inhibitors in chronic myeloid leukemia-from molecular mechanisms to clinical relevance. Cancers (Basel). (2021) 13:4820. doi: 10.3390/cancers13194820
8. Kolenda T, Guglas K, Kopczynska M, Teresiak A, Blizniak R, Mackiewicz A, et al. Oncogenic role of ZFAS1 lncRNA in head and neck squamous cell carcinomas. Cells. (2019) 8:366. doi: 10.3390/cells8040366
9. He A, He S, Li X, and Zhou L. ZFAS1: A novel vital oncogenic lncRNA in multiple human cancers. Cell Prolif. (2019) 52:e12513. doi: 10.1111/cpr.12513
10. Gu Y, Mohammad IS, and Liu Z. Overview of the STAT-3 signaling pathway in cancer and the development of specific inhibitors. Oncol Lett. (2020) 19:2585–94. doi: 10.3892/ol.2020.11394
11. El-Tanani M, Al Khatib AO, Aladwan SM, Abuelhana A, McCarron PA, and Tambuwala MM. Importance of STAT3 signalling in cancer, metastasis and therapeutic interventions. Cell Signal. (2022) 92:110275. doi: 10.1016/j.cellsig.2022.110275
12. Coppo P, Flamant S, De Mas V, Jarrier P, Guillier M, Bonnet ML, et al. BCR-ABL activates STAT3 via JAK and MEK pathways in human cells. Br J Haematol. (2006) 134:171–9. doi: 10.1111/j.1365-2141.2006.06161.x
13. Sharma U, Barwal TS, Khandelwal A, Malhotra A, Rana MK, Singh Rana AP, et al. LncRNA ZFAS1 inhibits triple-negative breast cancer by targeting STAT3. Biochimie. (2021) 182:99–107. doi: 10.1016/j.biochi.2020.12.026
14. Wang KN, Zhou K, Zhong NN, Cao LM, Li ZZ, Xiao Y, et al. Enhancing cancer therapy: The role of drug delivery systems in STAT3 inhibitor efficacy and safety. Life Sci. (2024) 346:122635. doi: 10.1016/j.lfs.2024.122635
15. Wang HQ, Man QW, Huo FY, Gao X, Lin H, Li SR, et al. STAT3 pathway in cancers: Past, present, and future. MedComm. (2020) 3:e124. doi: 10.1002/mco2.124
16. Yucel B, Altundağ Kara S, Cekmen MB, Ada S, and Demircan Tan B. STAT3 mediated regulation of glucose metabolism in leukemia cells. Gene. (2022) 809:146012. doi: 10.1016/j.gene.2021.146012
17. Zhu X, Shi Y, and Wang J. B7-H3 regulates glucose metabolism in neuroblastom via Stat3/c-Met pathway. Appl Biochem Biotechnol. (2024) 196:1386–98. doi: 10.1007/s12010-023-04606-7
18. Yao A, Xiang Y, Si YR, Fan LJ, Li JP, Li H, et al. PKM2 promotes glucose metabolism through a let-7a-5p/Stat3/hnRNP-A1 regulatory feedback loop in breast cancer cells. J Cell Biochem. (2019) 120:6542–54. doi: 10.1002/jcb.27947
19. Ou B, Sun H, Zhao J, Xu Z, Liu Y, Feng H, et al. Polo-like kinase 3 inhibits glucose metabolism in colorectal cancer by targeting HSP90/STAT3/HK2 signaling. J Exp Clin Cancer Res: CR. (2019) 38:426. doi: 10.1186/s13046-019-1418-2
20. Ediriweera MK and Jayasena S. The role of reprogrammed glucose metabolism in cancer. Metabolites. (2023) 13:345. doi: 10.3390/metabo13030345
21. Lei P, Wang W, Sheldon M, Sun Y, Yao F, and Ma L. Role of glucose metabolic reprogramming in breast cancer progression and drug resistance. Cancers (Basel). (2023) 15:3390. doi: 10.3390/cancers15133390
22. Li Y, Zeng P, Xiao J, Huang P, and Liu P. Modulation of energy metabolism to overcome drug resistance in chronic myeloid leukemia cells through induction of autophagy. Cell Death Discov. (2022) 8:212. doi: 10.1038/s41420-022-00991-w
23. Lai Q, Duan H, Jiang Y, Yang L, Deng M, Lin Z, et al. Resensitizing the imatinib-resistant chronic myeloid leukemia through reshaping the glucose mtabolism by insulin sensitizer. Blood. (2024) 144:5781. doi: 10.1182/blood-2024-208054
24. Naka K. New routes to eradicating chronic myelogenous leukemia stem cells by targeting metabolism. Int J Hematol. (2021) 113:648–55. doi: 10.1007/s12185-021-03112-y
25. Gonzalez M, Lopez J, Schenkel K, Reffell K, Eide C, Bajpeyi S, et al. A role for lipid metabolism in tyrosine kinase inhibitor (TKI) resistance of chronic myeloid leukemia (CML). Blood. (2021) 11:612573. doi: 10.1182/blood-2021-148507
26. Hu C, Fu X, Li S, Chen C, Zhao X, and Peng J. Chidamide inhibits cell glycolysis in acute myeloid leukemia by decreasing N6-methyladenosine-related GNAS-AS1. Daru: J Faculty Pharmacy Tehran Univ Med Sci. (2024) 32:11–24. doi: 10.1007/s40199-023-00482-y
27. Peng Y, Huang Z, Zhou F, Wang T, Mou K, and Feng W. Effect of HSP90AB1 and CC domain interaction on Bcr-Abl protein cytoplasm localization and function in chronic myeloid leukemia cells. Cell Commun Signal: CCS. (2021) 19:71. doi: 10.1186/s12964-021-00752-9
28. Kang Y, Hodges A, Ong E, Roberts W, Piermarocchi C, and Paternostro G. Identification of drug combinations containing imatinib for treatment of BCR-ABL+ leukemias. PloS One. (2014) 9:e102221. doi: 10.1371/journal.pone.0102221
29. Semenza GL. HIF-1 mediates metabolic responses to intratumoral hypoxia and oncogenic mutations. J Clin Invest. (2013) 123:3664–71. doi: 10.1172/JCI67230
30. Rad E, Dodd K, Thomas L, Upadhyaya M, and Tee A. STAT3 and HIF1α Signaling drives oncogenic cellular phenotypes in Malignant peripheral nerve sheath tumors. Mol Cancer Res: MCR. (2015) 13:1149–60. doi: 10.1158/1541-7786.MCR-14-0182
31. Majidinia M and Yousefi B. Long non-coding RNAs in cancer drug resistance development. DNA Repair (Amst). (2016) 45:25–33. doi: 10.1016/j.dnarep.2016.06.003
32. Dong D, Mu Z, Zhao C, and Sun M. ZFAS1: a novel tumor-related long non-coding RNA. Cancer Cell Int. (2018) 18:1–8. doi: 10.1186/s12935-018-0623-y
33. Wang H, Xie B, Kong Y, Tao Y, Yang G, Gao M, et al. Overexpression of RPS27a contributes to enhanced chemoresistance of CML cells to imatinib by the transactivated STAT3. Oncotarget. (2016) 7:18638–50. doi: 10.18632/oncotarget.7888
34. Wang Y, Lu JH, Wu QN, Jin Y, Wang DS, Chen YX, et al. LncRNA LINRIS stabilizes IGF2BP2 and promotes the aerobic glycolysis in colorectal cancer. Mol Cancer. (2019) 18:174. doi: 10.1186/s12943-019-1105-0
35. Wang P, Wang X, He D, and Zhuang C. LncRNA AK142643 promotes hepatic lipid accumulation by upregulating CD36 via interacting with IGF2BP2. Gene. (2023) 887:147747. doi: 10.1016/j.gene.2023.147747
36. Zhao X, Chen J, Zhang C, Xie G, Othmane B, Kuang X, et al. LncRNA AGAP2-AS1 interacts with IGF2BP2 to promote bladder cancer progression via regulating LRG1 mRNA stability. Cell Signal. (2023) 111:110839. doi: 10.1016/j.cellsig.2023.110839
37. Yang R, Wan J, Ma L, Zhou F, Yang Z, Li Z, et al. TMEM44-AS1 promotes esophageal squamous cell carcinoma progression by regulating the IGF2BP2-GPX4 axis in modulating ferroptosis. Cell Death Discov. (2023) 9:431. doi: 10.1038/s41420-023-01727-0
38. Lang C, Yin C, Lin K, Li Y, Yang Q, Wu Z, et al. m(6) A modification of lncRNA PCAT6 promotes bone metastasis in prostate cancer through IGF2BP2-mediated IGF1R mRNA stabilization. Clin Trans Med. (2021) 11:e426. doi: 10.1002/ctm2.426
39. Mao J, Qiu H, and Guo L. LncRNA HCG11 mediated by METTL14 inhibits the growth of lung adenocarcinoma via IGF2BP2/LATS1. Biochem Biophys Res Commun. (2021) 580:74–80. doi: 10.1016/j.bbrc.2021.09.083
40. Boudny M and Trbusek M. The important role of STAT3 in chronic lymphocytic leukaemia biology. Klin Onkol. (2020) 33:32–8. doi: 10.14735/amko202032
41. Zhu T, Wang Z, Wang G, Hu Z, Ding H, Li R, et al. Long non-coding RNA ZFAS1 promotes the expression of EPAS1 in gastric cardia adenocarcinoma. J Adv Res. (2021) 28:7–15. doi: 10.1016/j.jare.2020.06.006
42. Eiring AM, Page BD, Kraft IL, Mason CC, Vellore NA, Resetca D, et al. Combined STAT3 and BCR-ABL1 inhibition induces synthetic lethality in therapy-resistant chronic myeloid leukemia. Leukemia. (2015) 29:586–97. doi: 10.1038/leu.2014.245
43. Tezcanli Kaymaz B, Selvi Gunel N, Sogutlu F, Ozates Ay NP, Baran Y, Gunduz C, et al. Investigating the potential therapeutic role of targeting STAT3 for overcoming drug resistance by regulating energy metabolism in chronic myeloid leukemia cells. Iranian J Basic Med Sci. (2022) 25:904–12. doi: 10.22038/IJBMS.2022.64138.14121
44. Patel SB, Nemkov T, Stefanoni D, Benavides GA, Bassal MA, Crown BL, et al. Metabolic alterations mediated by STAT3 promotes drug persistence in CML. Leukemia. (2021) 35:3371–82. doi: 10.1038/s41375-021-01315-0
45. Zheng Q, Dong H, Mo J, Zhang Y, Huang J, Ouyang S, et al. A novel STAT3 inhibitor W2014-S regresses human non-small cell lung cancer xenografts and sensitizes EGFR-TKI acquired resistance. Theranostics. (2021) 11:824–40. doi: 10.7150/thno.49600
Keywords: chronic myeloid leukemia, imatinib resistance, ZFAS1, stat3, glucose metabolism reprogramming
Citation: Yang L and Han Y (2025) ZFAS1/STAT3 axis modulates imatinib resistance of chronic myeloid leukemia cells through glucose metabolism reprogramming. Front. Oncol. 15:1603060. doi: 10.3389/fonc.2025.1603060
Received: 31 March 2025; Accepted: 19 June 2025;
Published: 08 July 2025.
Edited by:
Christian Pecquet, Université Catholique de Louvain, BelgiumReviewed by:
Ilyas Chachoua, Bilkent University, TürkiyeRaquel Alves, University of Coimbra, Portugal
Sweta B. Patel, University of Colorado Anschutz Medical Campus, United States
Copyright © 2025 Yang and Han. This is an open-access article distributed under the terms of the Creative Commons Attribution License (CC BY). The use, distribution or reproduction in other forums is permitted, provided the original author(s) and the copyright owner(s) are credited and that the original publication in this journal is cited, in accordance with accepted academic practice. No use, distribution or reproduction is permitted which does not comply with these terms.
*Correspondence: Yanqiu Han, eWFucWl1LWhAbGR5LmVkdS5ycw==