 Chongshuang Yang1†
 Man Li2†
 Xin Yi3Lin Wang1Guangxian Kuang1Chunfang Zhang1Benyong Yao1Zhihong Qin1Tianliang Shi1*Qiang Jiang1*
- 1Department of Radiology, Tongren People’s Hospital, Tongren, Guizhou, China
- 2Department of Research and Development, Shanghai United Imaging Intelligence Co., Ltd., Shanghai, China
- 3Department of Cardiology, Affiliated Hospital of North China University of Science and Technology, Tangshan, Hebei, China
Objective: The aim of this study was to evaluate the performance of radiomics based on multiparametric magnetic resonance imaging (MRI) for the preoperative prediction of parametrial invasion (PMI) in cervical cancer (CC).
Materials and methods: This retrospective study included 110 consecutive patients with International Federation of Obstetrics and Gynecology (FIGO) stage IB–IIA CC. Patients were randomly divided into a training and a testing cohort in an 8:2 ratio. The region of interest (ROI) was manually delineated. Radiomics features were extracted separately from T2-weighted imaging (T2WI), diffusion-weighted imaging (DWI), apparent diffusion coefficient (ADC), and contrast-enhanced T1-weighted imaging (T1C). Feature selection was performed using the correlation coefficient, recursive feature cancellation, and the least absolute shrinkage and selection operator algorithm. Radiomics models based on single-sequence, dual-sequence, and multi-sequence combinations were then constructed. Model performance was assessed using receiver operating characteristic (ROC) curve analysis. The DeLong test was used to compare the area under the curve (AUC), supplemented by net reclassification improvement and comprehensive discrimination improvement measures.
Results: A total of 2,264 radiomics features were initially extracted. After feature selection, 7, 10, 6, and 8 valid features were retained from T1C, T2WI, ADC, and DWI sequence, respectively. A total of 15 radiomics models were developed, namely, 4 single-sequence models, 6 double-sequence models, and 5 multi-sequence models. All models showed good classification performance for PMI in both training and testing cohorts, with an AUC ranging from 0.755 to 1.000 in the training cohort and from 0.758 to 0.917 in the testing cohort. Among them, the T1C+ADC+DWI model demonstrated the best diagnostic performance, significantly outperforming all other models (p < 0.05), with the highest AUC in both training and testing cohorts (training: 1.000, testing: 0.917).
Conclusion: Radiomics based on multiparametric MRI can effectively predict PMI status in patients with early-stage CC, offering valuable support for individualized treatment planning and clinical decision-making.
1 Introduction
Cervical cancer (CC) is the most common malignancy of the female reproductive system (1). Parametrial invasion (PMI) refers to the spread of cancer cells beyond the cervix into the surrounding parametrium. PMI is a key factor in the International Federation of Obstetrics and Gynecology (FIGO) staging system, which plays an important role in determining treatment strategies (2). Surgery is typically recommended for patients with CC without PMI (stage IIA and below), while concurrent chemoradiotherapy is the preferred approach for patients with PMI (stage IIB and above) (3). Therefore, accurate pre-treatment assessment of PMI is of great clinical significance for personalized treatment planning in CC.
Magnetic resonance imaging (MRI) is the preferred imaging modality for the diagnosis, staging, and treatment evaluation of CC, and it has been incorporated into the FIGO staging system as a recommended assessment tool (4). However, MRI-based evaluation of PMI by the radiologist has a relatively high false-positive rate, particularly in cases with large tumor or indistinct tumor boundaries caused by compression or inflammation (5, 6).
Radiomics combines image processing and big data analysis with medical imaging, enabling the large-scale extraction of quantifiable image features from lesions and the generation of imaging biomarkers that reflect subtle characteristics of tumors. This approach facilitates comprehensive analysis of the associations between imaging data and genetic, pathological, and clinical information (7). Radiomics has been applied to predict lympho-vascular space invasion (LVSI) (8), deep stromal invasion (9), and lymph node metastasis (10) in CC. Recently, several studies (11–13) have demonstrated that MRI-based radiomics offers significant advantages in predicting PMI in CC. However, to date, no studies have reported the use of multiparametric MRI-based radiomics for PMI prediction. Therefore, in this study, we aimed to develop radiomics models based on multiparametric MRI to predict PMI status preoperatively and support personalized treatment decision-making in patients with early-stage CC.
2 Materials and methods
This study was approved by the Ethics Committee of Tongren People’s Hospital on 23 May 2024, exempting the subjects from informed consent.
2.1 Patient collection
This study retrospectively analyzed the preoperative MRI images and clinicopathological data of patients with CC with FIGO stage IB1–IIA who underwent radical resection in our hospital from March 2020 to October 2024. The inclusion criteria were as follows: (1) Patients were pathologically diagnosed with CC and had a clearly documented PMI status. (2) Patients had not received radiotherapy or chemotherapy before MRI scanning. (3) Patients underwent scanning with routine MRI, diffusion-weighted imaging (DWI), and contrast-enhanced T1-weighted imaging (T1C). The exclusion criteria were as follows: (1) MRI images that did not meet the requirements for tumor segmentation. (2) The time interval between MRI scanning and surgery was more than 2 weeks. The overall workflow for this study is shown in Figure 1.
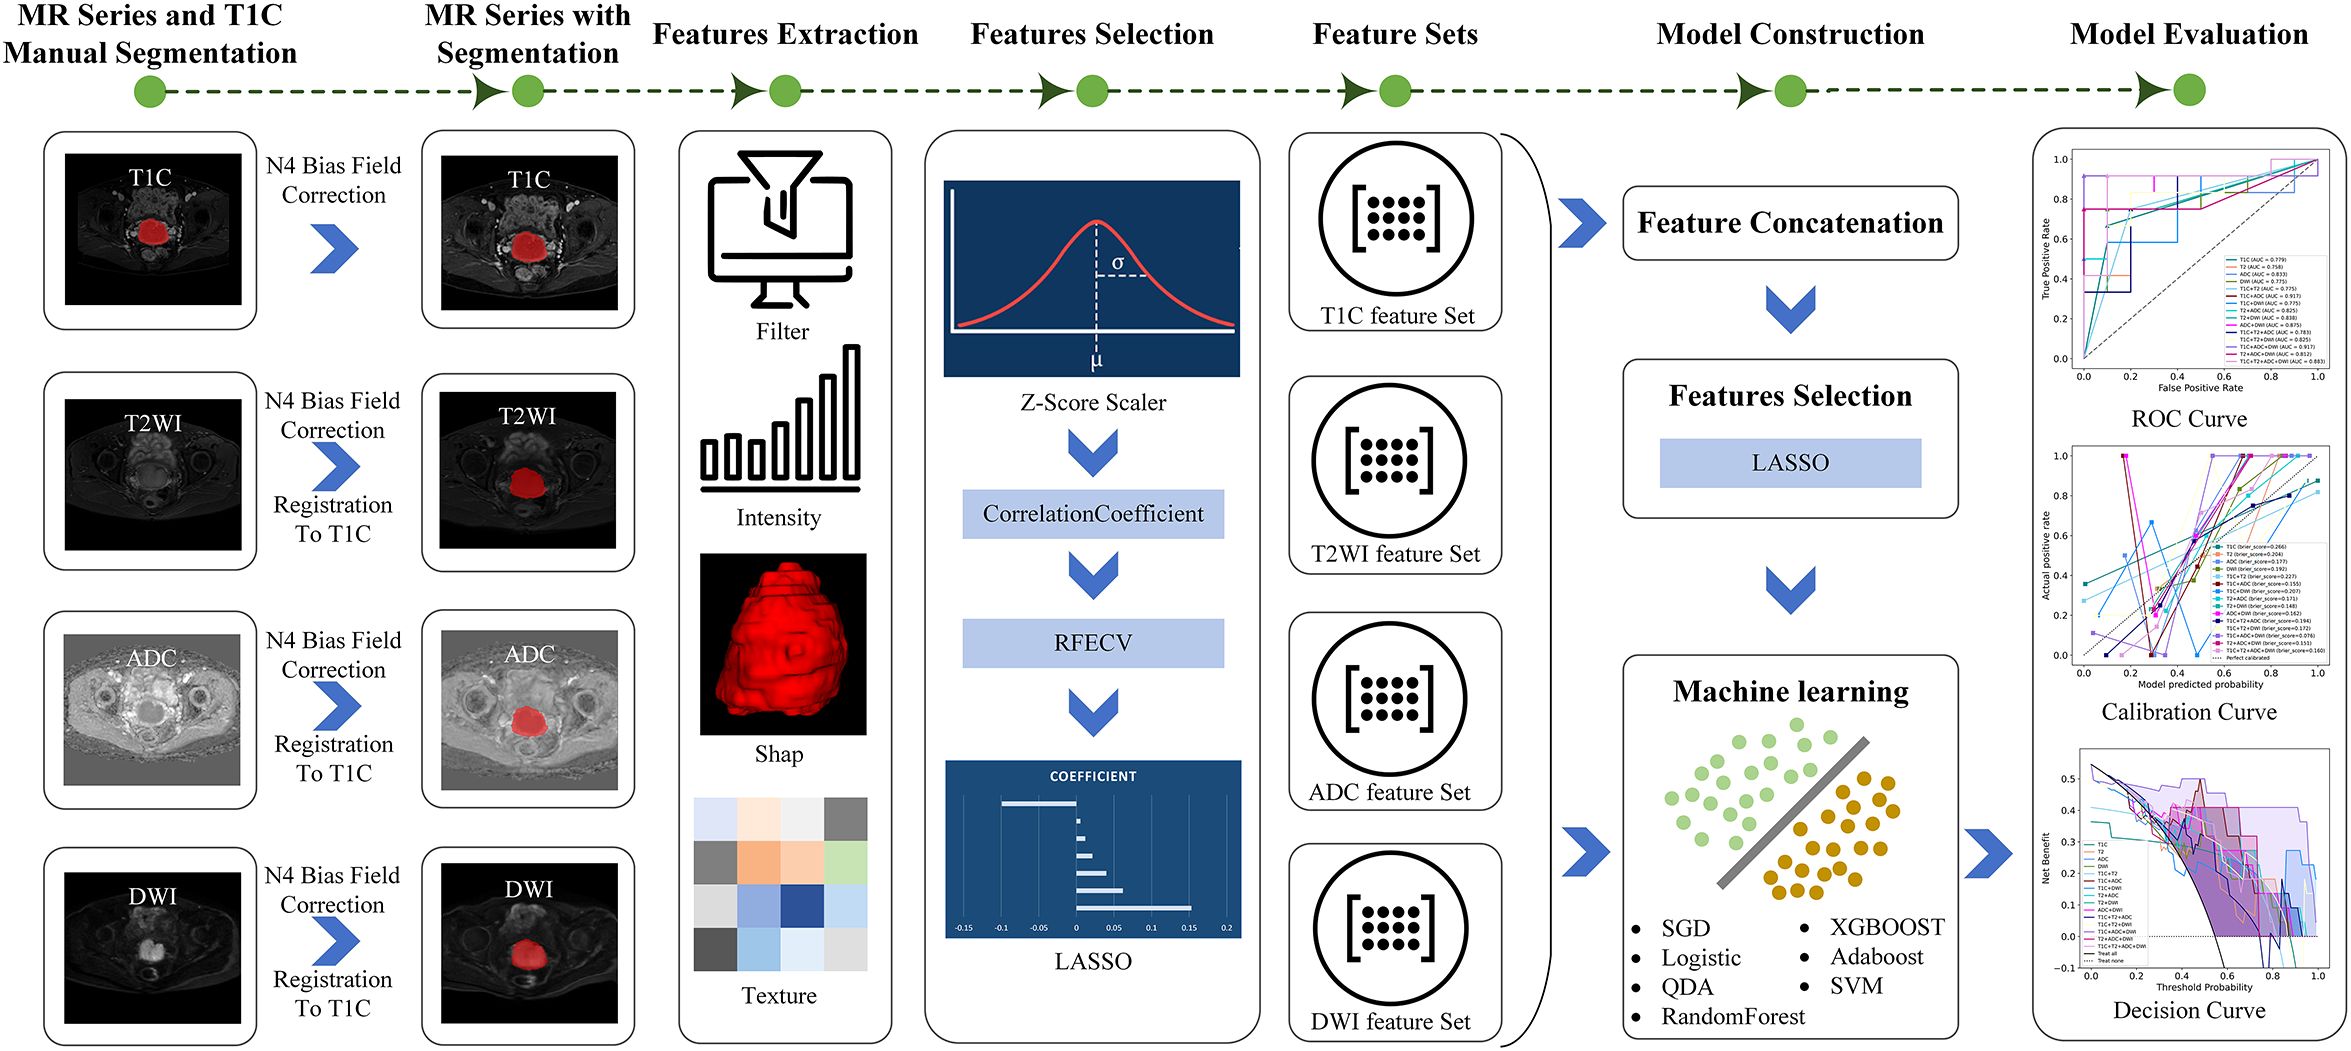
Figure 1. The overall workflow for this study.
2.2 Image acquisition
MRI scanning was performed on a Philips Ingenia 3.0 T MR machine. A total of four types of MRI images were used in this study, namely, axial T2-weighted imaging (T2WI), DWI, apparent diffusion coefficient (ADC), and T1C. The parameters of MRI scanning were as follows: T2WI: repetition time (TR)/echo time (TE) = 2,500/70 ms, field of view (FOV) = 23 × 36 cm, matrix = 264 × 320, slice thickness/spacing = 5/1 mm. T1WI: TR/TE = 485/8 ms, FOV = 32 × 28 cm, matrix = 300 × 377, slice thickness/spacing = 5/1 mm. DWI: TR/TE = 3,960/73 ms, FOV = 23 × 22 cm, matrix = 68 × 78, slice thickness/spacing = 3.3/0.33 mm, b-values were 0 and 800 s/mm2. After conventional pelvic MRI scanning, the patient was kept in the same position, and a contrast agent (0.1 mmol/kg) was injected through the elbow vein. Multislice dynamic contrast-enhanced images covering the lesion tissue were acquired, with delayed images obtained at 2 and 5 min post-injection. The scanning parameters for contrast-enhanced sequences were consistent with those of T1WI. After scanning, the ADC images were automatically reconstructed.
2.3 Manual segmentation and image preprocessing
2.3.1 Manual segmentation
The regions of interest (ROIs) were manually segmented slice by slice on axial T1C images using ITK-SNAP software (University of Pennsylvania Image Computing and Science Laboratory, version 3.6.0). Two radiologists with over 5 years of work experience independently performed the delineation. Inter-observer agreement was assessed by calculating the Dice similarity coefficient, which yielded a value of 0.8566 ± 0.0442, demonstrating good consistency. For cases with low agreement (Dice < 0.7), the final ROI was reviewed and adjudicated by a senior radiologist with more than 15 years of experience to ensure segmentation accuracy and reproducibility.
2.3.2 Image preprocessing
To eliminate intensity inhomogeneity commonly present in MR images, we first applied the N4 bias field correction method to all sequences. Subsequently, an adaptive normalization procedure was performed for each image to remove extreme voxel values (above the 99th percentile and below the 1st percentile), thereby minimizing the influence of outliers. Next, the intensity values were normalized to a range of 0 to 1 using min–max normalization to ensure data consistency and comparability across patients. For multi-sequence image analysis, the T1C sequence was used as the reference image, while T2WI, DWI, and ADC sequences were designated as moving images. These were spatially aligned to the T1C sequence using the symmetric normalization (SyN) algorithm, which integrates both affine and non-linear (deformable) transformations and employs mutual information as the optimization criterion. This registration process ensures spatial correspondence across sequences, laying a robust foundation for subsequent multi-parametric data fusion and analysis.
2.4 Radiomics feature extraction and feature selection
2.4.1 Feature extraction
This study was conducted using the uAI Research Portal (United Imaging Intelligence, China, Version: 20240430), which is built on the Python programming language (version 3.7.3, https://www.python.org) and incorporates the widely used PyRadiomics package (https://pyradiomics.readthedocs.io/en/latest/index.html). Our study involved four sequences: T1C, T2WI, ADC, and DWI, and extracted 14 shape features, 18 first-order statistical features that describe the distribution of voxel intensities, and 72 texture features that characterize the spatial gray-level distribution of the pixel neighborhoods. To further expand the feature set, we applied 24 different filtering processes to the original images, including but not limited to mean filtering, Gaussian filtering, logarithmic filtering, and wavelet transformation. Subsequently, we extracted an additional 432 first-order statistical features and 1,728 texture features from these filtered images. In total, 2,264 radiomics features were extracted from each sequence.
2.4.2 Feature selection
Feature selection involves identifying the most discriminative features from the original feature set to reduce dimensionality. For the 2,264 radiomics features, z-score normalization was applied to normalize the features. Subsequently, the correlation coefficient between each feature and the presence or absence of PMI was calculated, retaining only those with a significance level of p < 0.05. Following this, a recursive feature elimination method was employed to iteratively remove features. This method employed a support vector machine (SVM) as the base estimator and iteratively removed redundant features. In each iteration, the model performance of the feature subset was evaluated via 5-fold cross-validation until the number of remaining features reached the predefined threshold. Finally, to further optimize feature selection, the least absolute shrinkage and selection operator (LASSO) was applied to identify the subset of features most strongly associated with the existence of PMI.
2.5 Classification model building
Based on the radiomics features selected from four sequences (T1C, T2WI, ADC, and DWI), four single-sequence models were constructed. By combining radiomics features from two to four sequences and performing feature selection again using LASSO, six dual-sequence models, four triple-sequence models, and one four-sequence model were subsequently developed. In total, 15 models were constructed. For each model, we evaluated the area under the curve (AUC), sensitivity, specificity, accuracy, precision, and F1 score. We also generated receiver operating characteristic (ROC) curves, calibration curves, and decision curves. Ultimately, we selected the best-performing model for predicting PMI in CC by comparing the diagnostic performance of all models.
2.6 Statistical analyses
The data were imported into the statistical analysis module of the uAI Research Portal software for correlation analysis, in which the differences in continuous variables and quantitative data in patients with positive and negative PMI were compared using either the t-test or the Mann–Whitney U test, depending on the data distribution. Categorical variables and the incidence of PMI were compared using the chi-square test or Fisher’s exact test. A p-value < 0.05 was considered statistically significant. The diagnostic performance of the models was evaluated using ROC analysis. The DeLong test was used to compare AUC, and the analysis was supplemented by net reclassification improvement (NRI) and integrated discrimination improvement (IDI) measures.
3 Results
3.1 Characteristics of patients
A total of 110 patients aged 38–68 years were included in this study, with a median age of 52 years. Among the 110 enrolled patients, 60 were positive for PMI and 50 were negative. According to the ratio of 8:2 (random seed = 20), patients were randomly assigned to the training cohort (n = 88) and the testing cohort (n = 22). The clinical characteristics of the patients are shown in Table 1. In the training cohort, a significant difference was observed in LVSI status between the PMI-positive and PMI-negative groups (p < 0.001). There were no significant differences in age, tumor size, pathological type, and degree of differentiation between the two groups (p > 0.05).
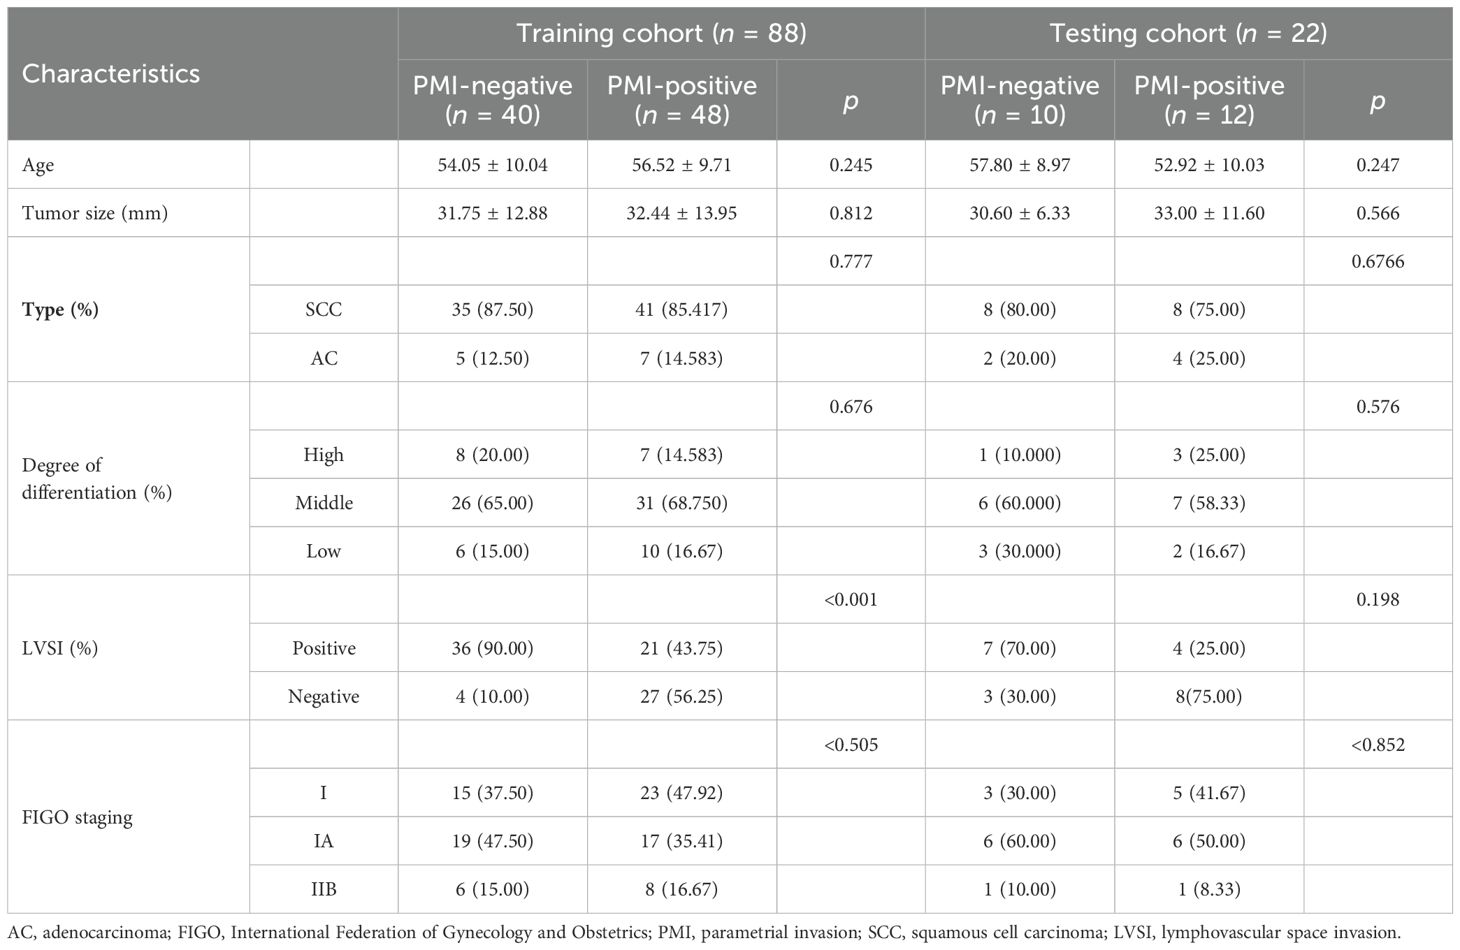
Table 1. The general clinical information of patients.
3.2 Single modality features selection
A total of 2,264 radiomics features were extracted from the ROIs of each sequence. Then, the correlation coefficient (p < 0.05), recursive feature elimination, and LASSO methods were used sequentially to screen the features (as shown in Figure 2). In the recursive feature elimination process, we selected the top 10 features for further analysis. In the end, 7, 10, 6, and 8 valid features were selected from T1C, T2WI, ADC, and DWI, respectively.
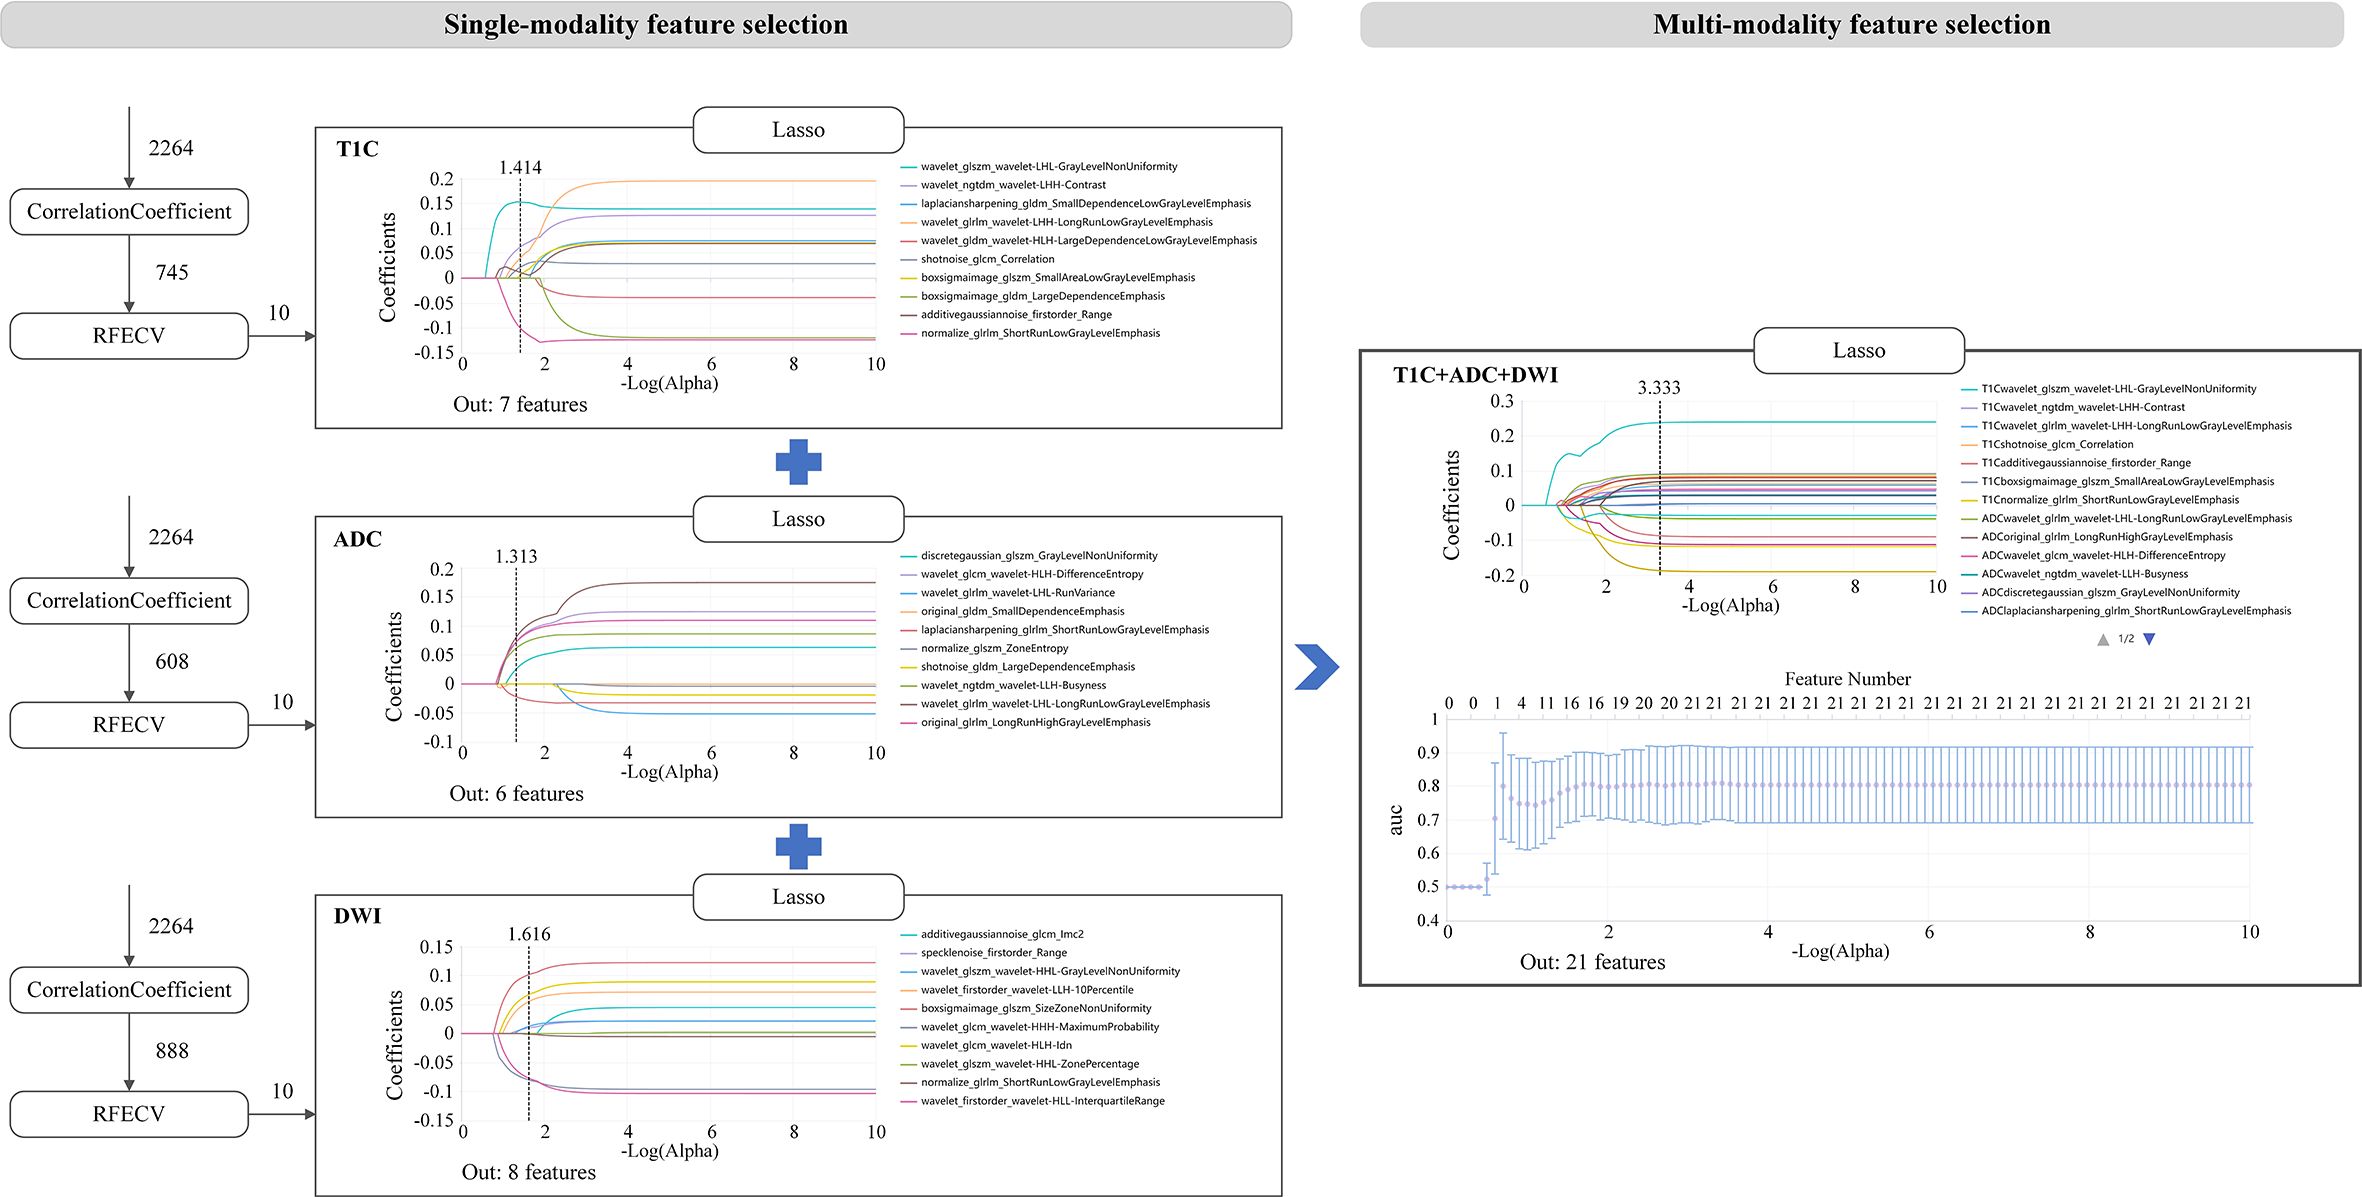
Figure 2. Radiomics features screened from single-modality and multi-modality.
3.3 Multi-modality feature selection
In the process of multi-sequence joint modeling, features from multiple sequences are concatenated, and feature selection is performed again using the LASSO method. Taking the T1C+ADC+DWI model as an example, 21 key features were retained after LASSO screening analysis, as shown in Figures 2, 3A. These features include the first-order statistics, grayscale co-occurrence matrix (GLCM), grayscale run length matrix (GLRLM), gray-level size zone matrix (GLSZM), and neighboring gray-tone difference matrix (NGTDM). The Rad-scores of the screened features in the training and testing cohorts are shown in Figures 3B, C, respectively.
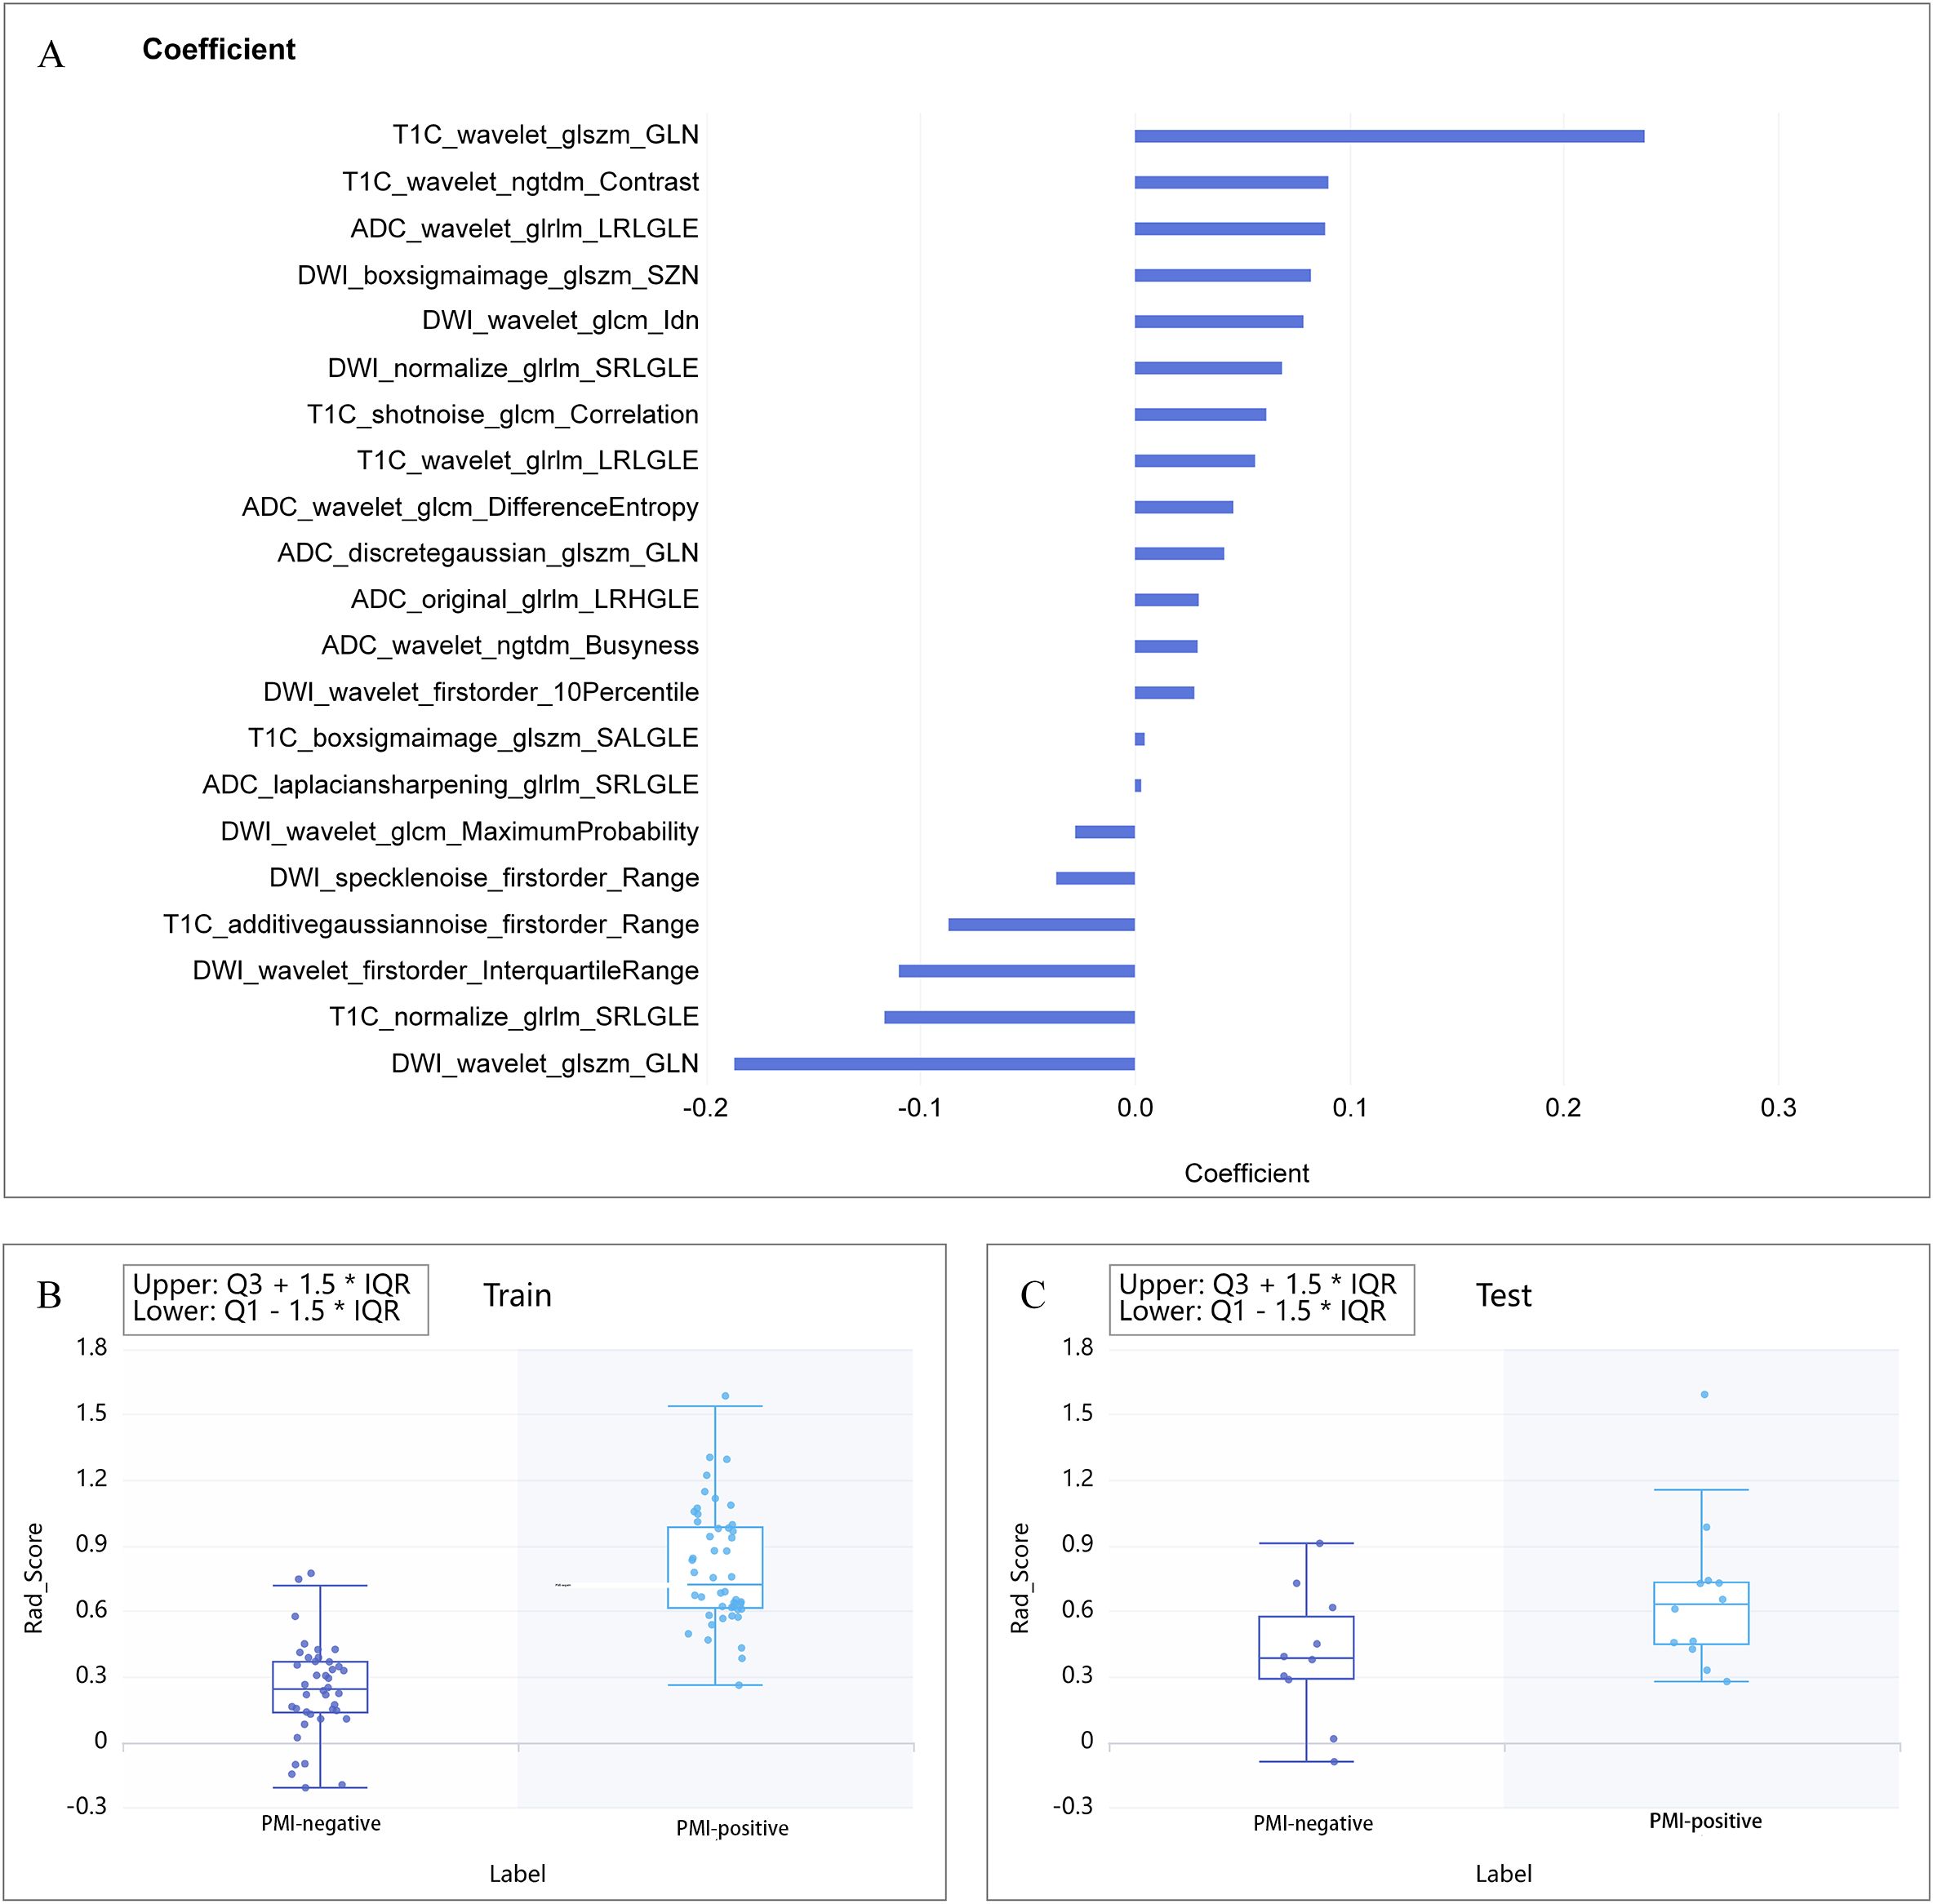
Figure 3. (A) Combination of selected radiomic features. (B, C) show the Rad-score distribution for the training and testing cohorts, respectively.
3.4 Performance of radiomics models
The diagnostic performance of each radiomics model is shown in Table 2. All models demonstrated good classification performance for distinguishing positive and negative PMI in both the training and testing cohorts, with AUCs ranging from 0.755 to 1.000 in the training cohort and from 0.758 to 0.917 in the testing cohort. Among the four single-sequence models, the ADC model achieved the highest AUC in both the training and testing cohorts (training: 0.977; testing: 0.833). Among the six dual-sequence combination models, the T1C+ADC model had the highest AUC (training: 0.993; testing: 0.917). Among the combined models with three or more sequences, the T1C+ADC+DWI model demonstrated the strongest diagnostic performance, with an AUC of 1.000 in the training cohort and 0.917 in the testing cohort. Therefore, the T1C+ADC+DWI model was identified as the optimal model (Figures 4A, B).
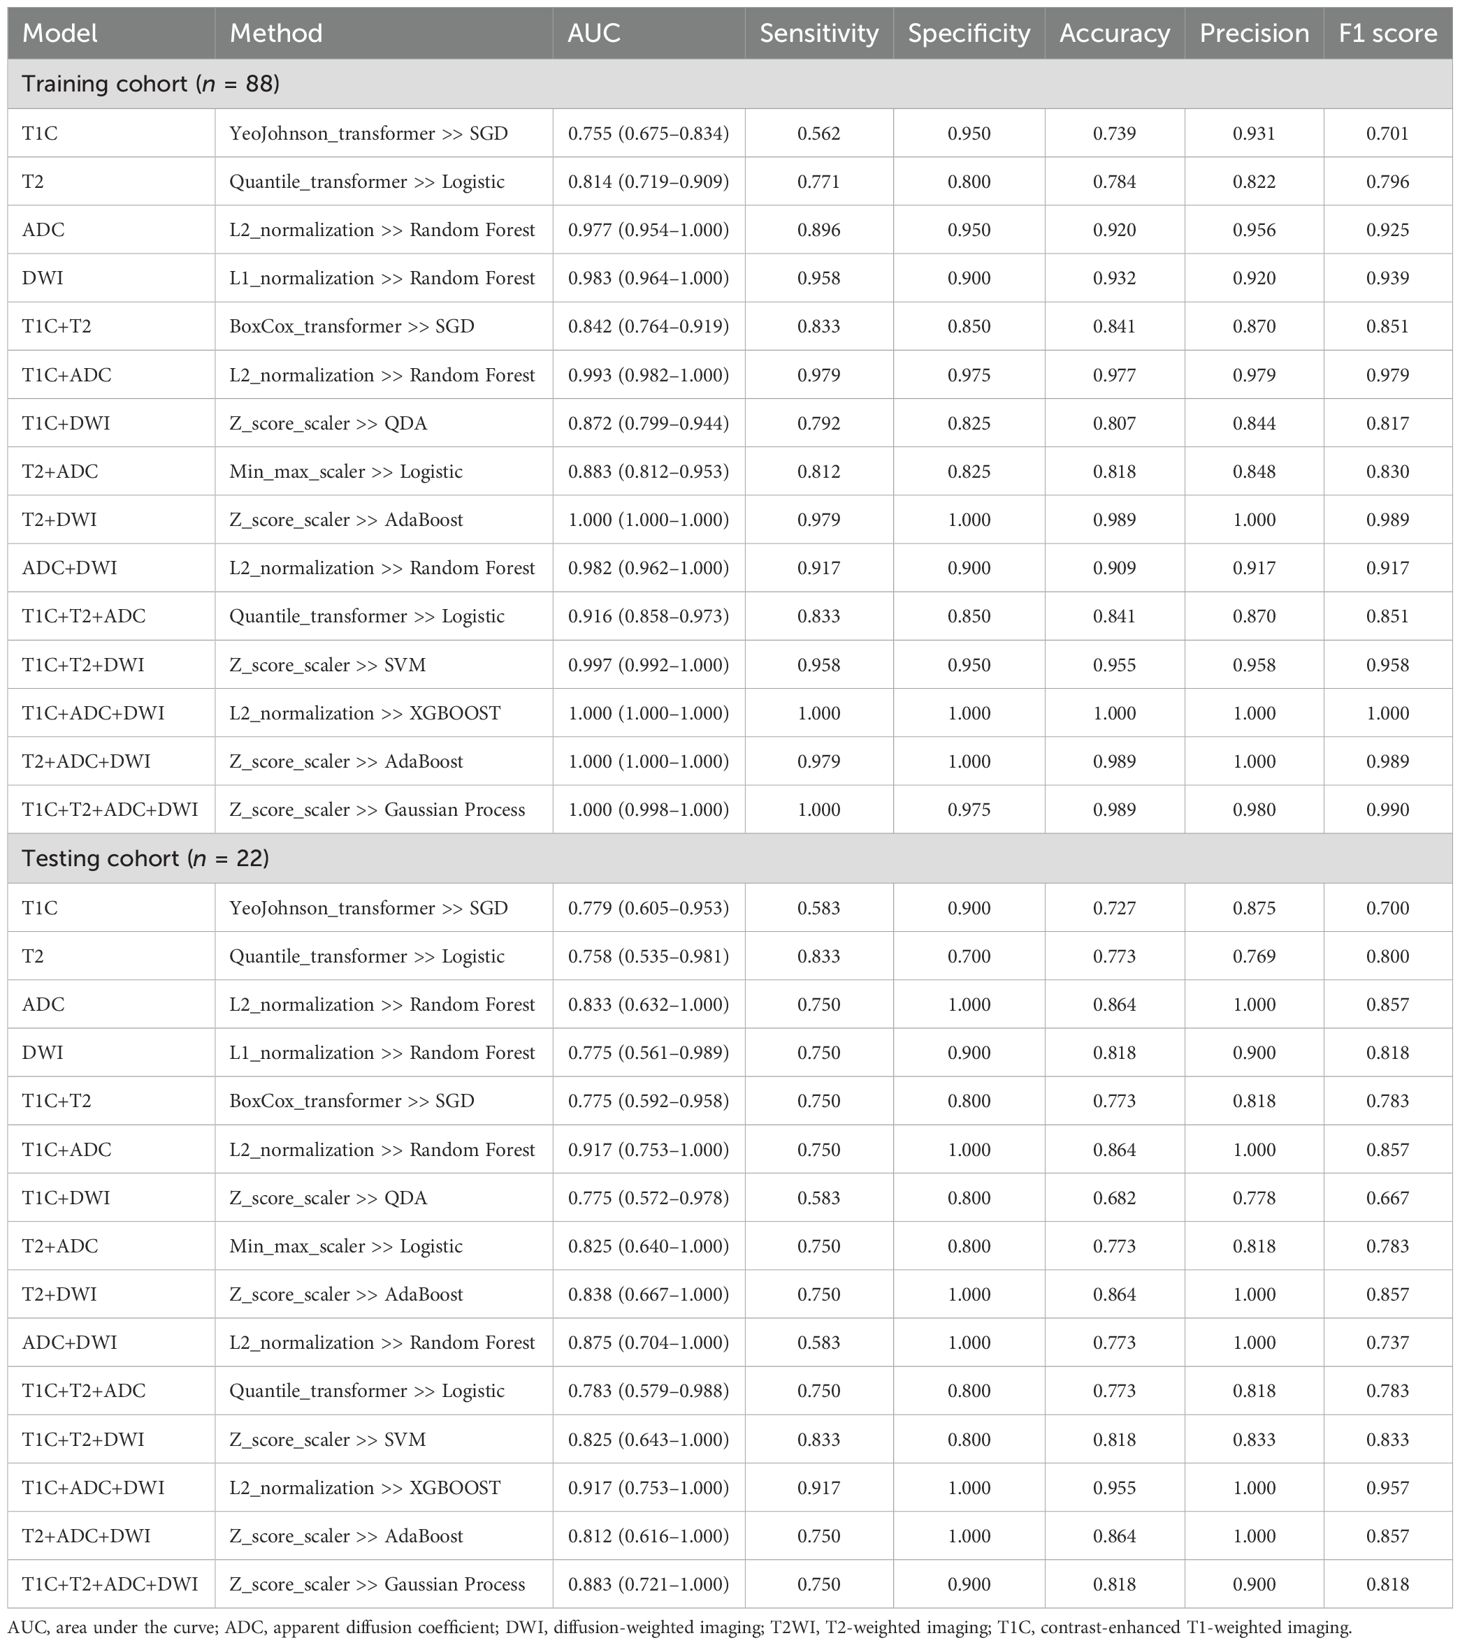
Table 2. Performance of the radiomics models in the training and testing cohorts.
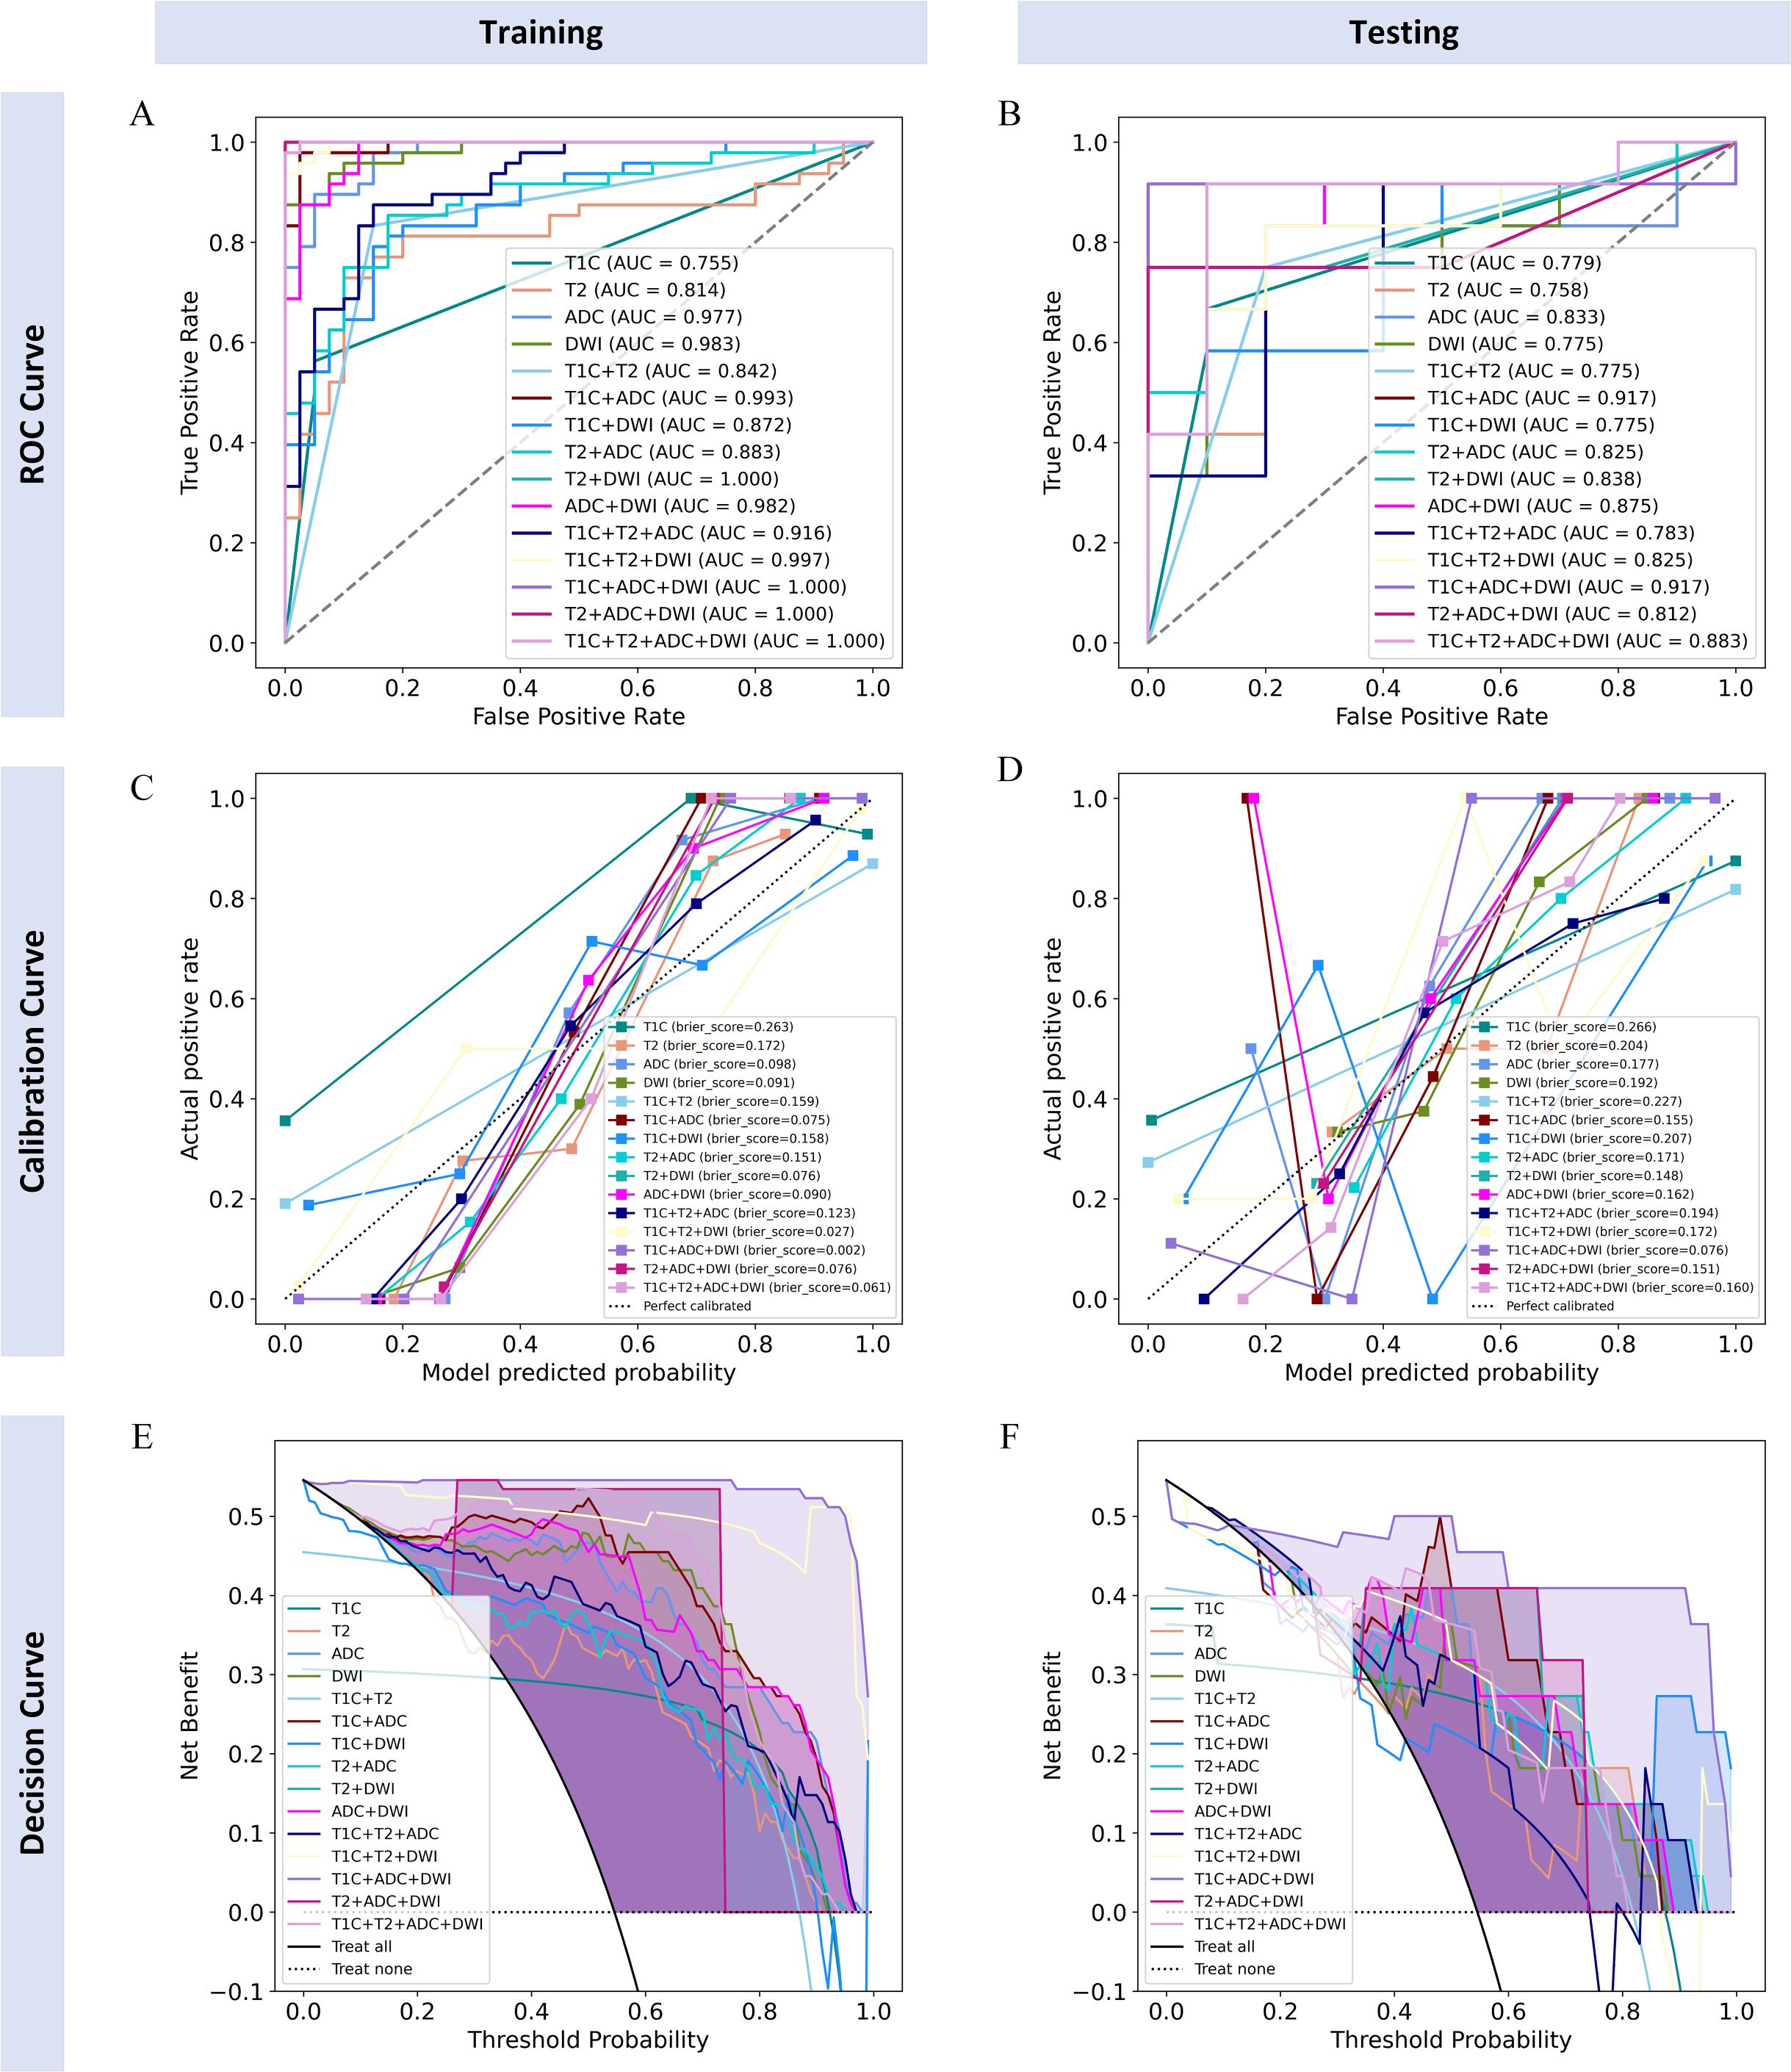
Figure 4. ROC curves, calibration curves, and decision curves of each radiomics model in training and testing cohorts. (A, B) ROC curves for the training and testing cohorts; (C, D) calibration curves for the training and testing cohorts; (E, F) decision curves for the training and testing cohorts.
Next, we compared the diagnostic capability of the T1C+ADC+DWI model with the other 14 models (as shown in Table 3). In the training cohort, the diagnostic capability of the T1C+ADC+DWI model was significantly different from all other models (integrated NRI score > 0 and either NRI p-value < 0.05 or IDI p-value < 0.05). In the testing cohort, the diagnostic performance of the T1C+ADC+DWI model also differed significantly from all models (integrated NRI score > 0 and either NRI p-value < 0.05 or IDI p-value < 0.05) except for the T1C+T2 model (NRI p-value = 0.0717; IDI p-value = 0.4114).
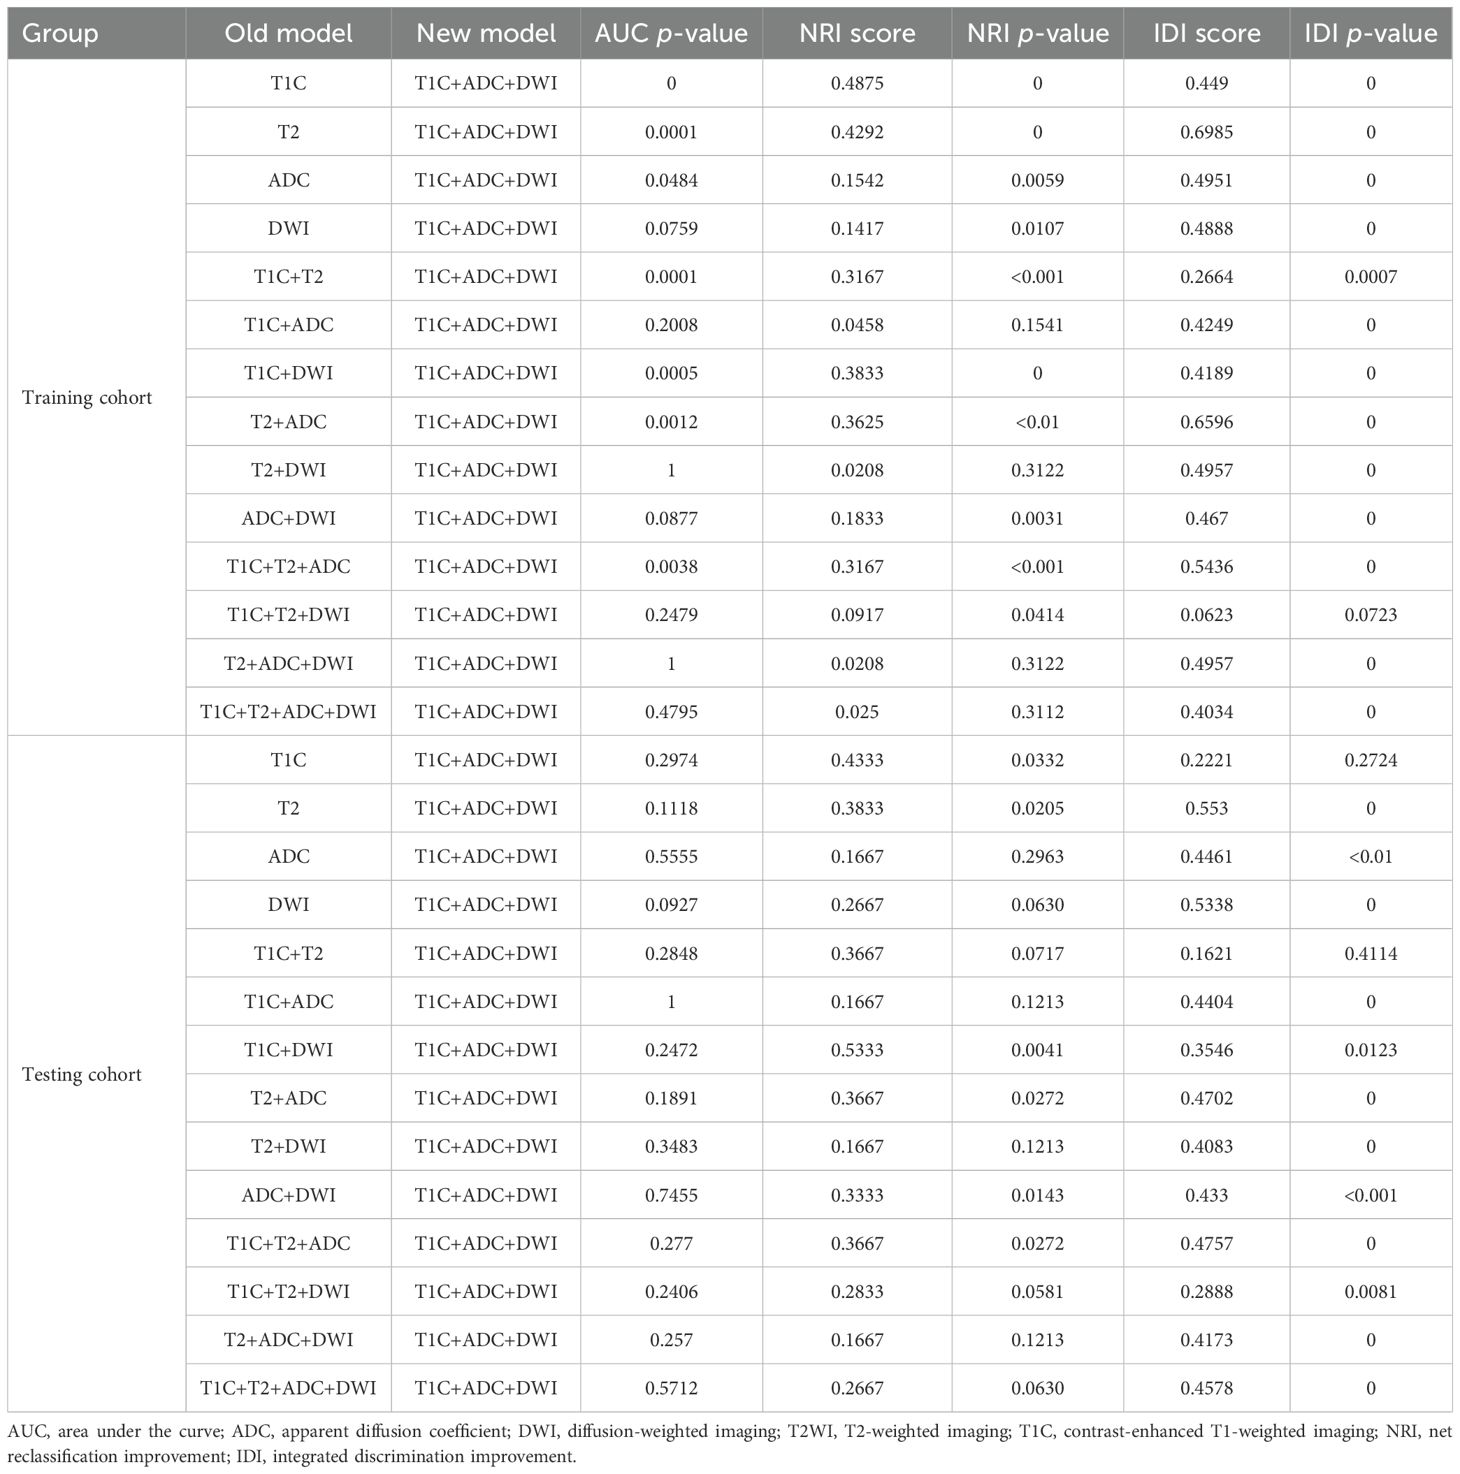
Table 3. Performance comparison between the T1C+ADC+DWI model and all other models in both the training and testing cohorts.
Then, we continued to compare the T1C+T2 model with all other models (as shown in Table 4). In the training cohort, the diagnostic performance of the T1C+T2 model was not higher than that of most models (NRI score ≤ 0) except for the T1C, T2, T1C+DWI, and T2+ADC models (integrated NRI score > 0 and either NRI p-values < 0.05 or IDI p-values < 0.05). Therefore, the T1C+T2 model could not be considered an optimal model.
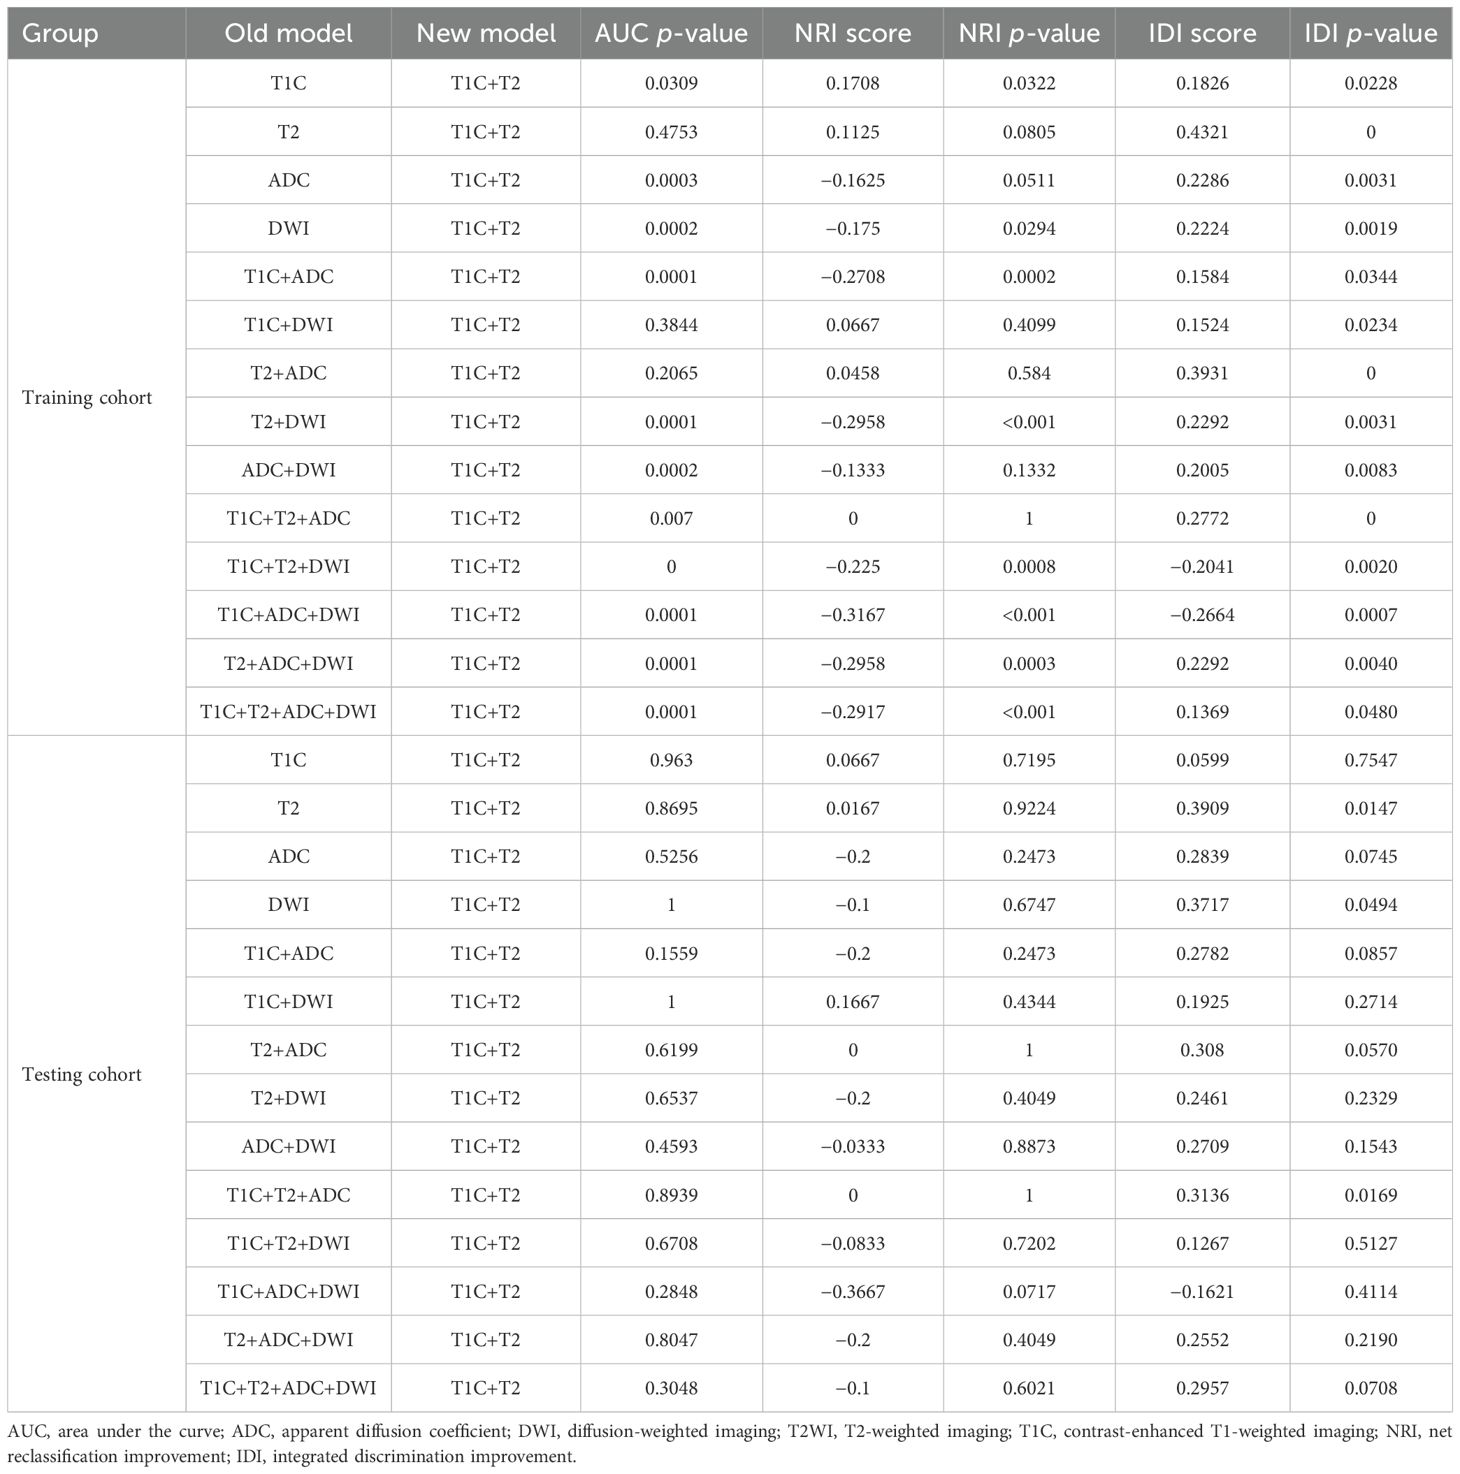
Table 4. Performance comparison between the T1C+T2 model and all other models in both the training and testing cohorts.
Finally, we believe that the radiomics model based on the T1C+ADC+DWI sequences is the best model. The calibration curves of the radiomics model based on the T1C+ADC+DWI sequences showed good agreement over a wide probability range between the training and testing cohorts (Figures 4C, D). The decision curves show that the radiomics model based on the T1C+ADC+DWI sequences provides a greater net benefit in both the training and testing cohorts (Figures 4E, F).
4 Discussion
PMI is widely recognized as a risk factor for CC and has a direct impact on the prognosis of patients (14). Therefore, accurate preoperative evaluation of PMI is crucial. Although the disruption of the low-intensity cervical interstitial ring on T2WI can serve as a radiological indicator of PMI, the assessment largely depends on the radiologist’s experience and involves subjective interpretation. By contrast, radiomics can quantitatively extract high-dimensional features that reflect underlying biological information related to genes, proteins, and the tumor microenvironment, which are invisible to the naked eye (15). Compared with traditional visual assessment, radiomics offers a more objective and detailed evaluation of tumor pathology. In the present study, we retrospectively collected preoperative T2WI, ADC, DWI, and T1C images from patients with CC. Radiomics features were extracted and screened from each imaging modality, and predictive models were constructed based on single-sequence, double-sequence, and multi-sequence combinations. The diagnostic performance of each model in predicting PMI status was then systematically compared.
Firstly, our study found that all models demonstrated good classification performance for predicting PMI status in CC in both the training and testing cohorts, with AUCs ranging from 0.842 to 1.000 in the training cohort and from 0.755 to 0.917 in the testing cohort. Several previous studies have reported the predictive performance of radiomics and deep learning models for PMI in CC, with AUCs ranging from 0.73 to 0.91 (11, 16), which is consistent with our findings. These results indicate that MRI-based radiomics can serve as a non-invasive biomarker for predicting PMI in CC, thereby helping to optimize treatment decisions.
Moreover, our study demonstrated that among the 15 radiomics models, the radiomics model based on T1C+ADC+DWI sequences achieved the best performance in predicting PMI in CC, with AUCs of 1.000 and 0.917 in the training and testing cohorts, respectively. This finding is consistent with Huang et al. (17), who showed that multiparametric MRI-based radiomics models outperform single-sequence models in predicting LVSI in CC. From a biological perspective, the superior performance of the T1C+ADC+DWI model may be attributed to the complementary information captured by the three sequences. T1C reflects tumor perfusion and neovascularization, which are closely related to tumor aggressiveness and stromal infiltration (18). ADC quantifies water diffusion within tissue and indirectly reflects tumor cellularity and microstructural integrity. DWI further enhances tissue contrast based on the diffusion of water molecules, aiding in the identification of tumor heterogeneity (19). This combination allows for a more comprehensive assessment of tumor biology, including microangiogenesis, blood supply, cellular density, and tissue structure, all of which are highly relevant to PMI. Interestingly, the model based on four sequences (T1C+T2WI+ADC+DWI) did not yield significantly better performance, suggesting that simply adding more sequences does not necessarily enhance predictive power. Instead, an optimal combination of informative and complementary sequences may be more effective for radiomics-based prediction of PMI in CC.
There are some limitations to this study. Firstly, this was a single-center study with a relatively small sample size. The model was developed and validated within the same cohort, which may limit the generalizability of the findings to broader clinical settings. Although the current results are encouraging, external validation using independent, multi-center datasets with larger and more diverse patient populations is necessary to confirm the robustness and clinical applicability of the model. Future research will focus on addressing this limitation. Secondly, this study was retrospective in nature, and selection bias was inevitable. Thirdly, although pathological type, degree of differentiation, LVSI (20), deep stromal invasion, and lymph node metastasis (21) are recognized pathological predictors of PMI in CC, these variables are only available through postoperative pathological examination and therefore were not included in the preoperative radiomics model. Fourthly, the ROIs in this study were manually delineated by experienced radiologists. Manual segmentation is time-consuming and subject to intra- and inter-observer variability, which may affect the reproducibility and clinical applicability of radiomics analysis. Although the Dice similarity coefficient was calculated to assess inter-observer agreement (mean Dice = 0.8566 ± 0.0442), intraclass correlation coefficient (ICC) analysis—which more directly evaluates the reproducibility of radiomic features—was not performed. In future work, we plan to incorporate ICC analysis to enhance the reliability of feature extraction and also to integrate automated or semi-automated segmentation tools to improve segmentation consistency and operational efficiency.
5 Conclusion
In conclusion, radiomics based on multiparametric MRI demonstrates excellent performance in predicting PMI in patients with early-stage CC. This noninvasive approach shows great promise for individualized preoperative assessment and may assist clinicians in optimizing surgical strategies while avoiding overtreatment or undertreatment. With further validation and integration into clinical workflows, radiomics models have the potential to contribute meaningfully to precision medicine and improve clinical decision-making in CC management.
Data availability statement
The original contributions presented in the study are included in the article/supplementary material. Further inquiries can be directed to the corresponding authors.
Ethics statement
The studies involving humans were approved by the Ethics Committee of Tongren People’s Hospital. The studies were conducted in accordance with the local legislation and institutional requirements. Written informed consent for participation was not required from the participants or the participants’ legal guardians/next of kin because the subjects were exempted from informed consent. This study was approved by the Ethics Committee of Tongren People’s Hospital on May 23, 2024, exempting the subjects from informed consent.
Author contributions
CY: Conceptualization, Formal Analysis, Methodology, Project administration, Visualization, Writing – original draft. ML: Formal Analysis, Methodology, Software, Visualization, Writing – review & editing. XY: Formal Analysis, Methodology, Project administration, Writing – original draft. LW: Data curation, Investigation, Resources, Writing – original draft. GK: Data curation, Investigation, Resources, Writing – original draft. CZ: Data curation, Investigation, Resources, Writing – original draft. BY: Data curation, Investigation, Writing – original draft. ZQ: Conceptualization, Formal Analysis, Project administration, Supervision, Writing – review & editing. TS: Conceptualization, Funding acquisition, Project administration, Writing – review & editing. QJ: Project administration, Supervision, Writing – review & editing.
Funding
The author(s) declare that no financial support was received for the research and/or publication of this article.
Conflict of interest
Author ML was employed by the company Shanghai United Imaging Intelligence Co., Ltd.
The remaining authors declare that the research was conducted in the absence of any commercial or financial relationships that could be construed as a potential conflict of interest.
Generative AI statement
The author(s) declare that no Generative AI was used in the creation of this manuscript.
Publisher’s note
All claims expressed in this article are solely those of the authors and do not necessarily represent those of their affiliated organizations, or those of the publisher, the editors and the reviewers. Any product that may be evaluated in this article, or claim that may be made by its manufacturer, is not guaranteed or endorsed by the publisher.
References
1. Bray F, Laversanne M, Sung H, Ferlay J, Siegel RL, Soerjomataram I, et al. Global cancer statistics 2022: GLOBOCAN estimates of incidence and mortality worldwide for 36 cancers in 185 countries. CA Cancer J Clin. (2024) 74:229–63. doi: 10.3322/caac.21834
2. Soares LC, de Souza RJ, and Oliveira M. Reviewing FIGO 2018 cervical cancer staging. Acta Obstet Gynecol Scand. (2023) 102:1757–8. doi: 10.1111/aogs.14667
3. Abu-Rustum NR, Yashar CM, Arend R, Barber E, Bradley K, Brooks R, et al. NCCN guidelines(R) insights: cervical cancer, version 1.2024. J Natl Compr Canc Netw. (2023) 21:1224–33. doi: 10.6004/jnccn.2023.0062
4. Re GL, Cucinella G, Zaccaria G, Crapanzano A, Salerno S, Pinto A, et al. Role of MRI in the assessment of cervical cancer. Semin Ultrasound CT MR. (2023) 44:228–37. doi: 10.1053/j.sult.2023.03.010
5. Zhao X, Wang X, Zhang B, Liu X, Xuan D, Xia Y, et al. Classifying early stages of cervical cancer with MRI-based radiomics. Magn Reson Imaging. (2022) 89:70–6. doi: 10.1016/j.mri.2022.03.002
6. Hu Y and Ai J. Development and validation of radiomics-based models for predicting the parametrial invasion in stage IB1 to IIA2 cervical cancer. Int J Gen Med. (2024) 17:3813–24. doi: 10.2147/IJGM.S478842
7. Hu Q, Shi J, Zhang A, Duan S, Song J, Chen T, et al. Added value of radiomics analysis in MRI invisible early-stage cervical cancers. Br J Radiol. (2022) 95:20210986. doi: 10.1259/bjr.20210986
8. Yang C, Wu M, Zhang J, Qian H, Fu X, Yang J, et al. Radiomics based on MRI in predicting lymphovascular space invasion of cervical cancer: a meta-analysis. Front Oncol. (2024) 14:1425078. doi: 10.3389/fonc.2024.1425078
9. Yan H, Huang G, Yang Z, Chen Y, and Xiang Z. Machine learning-based multiparametric magnetic resonance imaging radiomics model for preoperative predicting the deep stromal invasion in patients with early cervical cancer. J Imaging Inform Med. (2024) 37:230–46. doi: 10.1007/s10278-023-00906-w
10. Hou L, Zhou W, Ren J, Du X, Xin L, Zhao X, et al. Radiomics analysis of multiparametric MRI for the preoperative prediction of lymph node metastasis in cervical cancer. Front Oncol. (2020) 10:1393. doi: 10.3389/fonc.2020.01393
11. Xiao ML, Fu L, Wei Y, Liu AE, Cheng JJ, Ma FH, et al. Intratumoral and peritumoral MRI radiomics nomogram for predicting parametrial invasion in patients with early-stage cervical adenocarcinoma and adenosquamous carcinoma. Eur Radiol. (2024) 34:852–62. doi: 10.1007/s00330-023-10042-2
12. Wang T, Gao T, Guo H, Wang Y, Zhou X, Tian J, et al. Preoperative prediction of parametrial invasion in early-stage cervical cancer with MRI-based radiomics nomogram. Eur Radiol. (2020) 30:3585–93. doi: 10.1007/s00330-019-06655-1
13. Li XX, Lin TT, Liu B, and Wei W. Diagnosis of cervical cancer with parametrial invasion on whole-tumor dynamic contrast-enhanced magnetic resonance imaging combined with whole-lesion texture analysis based on T2- weighted images. Front Bioeng Biotechnol. (2020) 8:590. doi: 10.3389/fbioe.2020.00590
14. Kang S, Wu J, Li J, Hou Q, and Tang B. Prognostic significance of clinicopathological factors influencing overall survival and event-free survival of patients with cervical cancer: A systematic review and meta-analysis. Med Sci Monit. (2022) 28:e934588. doi: 10.12659/MSM.934588
15. Gillies RJ, Kinahan PE, and Hricak H. Radiomics: images are more than pictures, they are data. Radiology. (2016) 278:563–77. doi: 10.1148/radiol.2015151169
16. Shang F, Tan Z, Gong T, Tang X, Sun H, and Liu S. Evaluation of parametrial infiltration in patients with IB-IIB cervical cancer by a radiomics model integrating features from tumoral and peritumoral regions in (18) F-fluorodeoxy glucose positron emission tomography/MR images. NMR BioMed. (2023):e4945. doi: 10.1002/nbm.4945
17. Huang G, Cui Y, Wang P, Ren J, Wang L, Ma Y, et al. Multi-parametric magnetic resonance imaging-based radiomics analysis of cervical cancer for preoperative prediction of lymphovascular space invasion. Front Oncol. (2021) 11:663370. doi: 10.3389/fonc.2021.663370
18. Hauge A, Gaustad JV, Huang R, Simonsen TG, Wegner CS, Andersen LMK, et al. DCE-MRI and quantitative histology reveal enhanced vessel maturation but impaired perfusion and increased hypoxia in bevacizumab-treated cervical carcinoma. Int J Radiat Oncol Biol Phys. (2019) 104:666–76. doi: 10.1016/j.ijrobp.2019.03.002
19. Bhardwaj R, Boruah DK, Gogoi BB, Zahir F, and Sharma A. Added-value of diffusion-weighted imaging (DWI) and dynamic contrast-enhanced (DCE-MRI) magnetic resonance imaging in the preoperative assessment of cervical cancer. J Obstet Gynaecol India. (2022) 72:330–40. doi: 10.1007/s13224-021-01488-9
20. Kilic C, Cakir C, Yuksel D, Tokgozoglu N, Comert GK, Karalok A, et al. Which factors predict parametrial involvement in early stage cervical cancer? A Turkish multicenter study. Eur J Obstet Gynecol Reprod Biol. (2019) 243:63–6. doi: 10.1016/j.ejogrb.2019.10.033
Keywords: cervical cancer, magnetic resonance imaging, radiomics, parametrial invasion, multiparameters
Citation: Yang C, Li M, Yi X, Wang L, Kuang G, Zhang C, Yao B, Qin Z, Shi T and Jiang Q (2025) Multiparametric MRI-based radiomics for preoperative prediction of parametrial invasion in early-stage cervical cancer. Front. Oncol. 15:1604749. doi: 10.3389/fonc.2025.1604749
Received: 02 April 2025; Accepted: 25 June 2025;
Published: 01 August 2025.
Edited by:
Robert Fruscio, University of Milano Bicocca, ItalyReviewed by:
Raffaella Ergasti, Agostino Gemelli University Polyclinic (IRCCS), ItalyYuting Ke, Massachusetts Institute of Technology, United States
Copyright © 2025 Yang, Li, Yi, Wang, Kuang, Zhang, Yao, Qin, Shi and Jiang. This is an open-access article distributed under the terms of the Creative Commons Attribution License (CC BY). The use, distribution or reproduction in other forums is permitted, provided the original author(s) and the copyright owner(s) are credited and that the original publication in this journal is cited, in accordance with accepted academic practice. No use, distribution or reproduction is permitted which does not comply with these terms.
*Correspondence: Tianliang Shi, NTczMzMxMzg5QHFxLmNvbQ==; Qiang Jiang, MTA1NjQ5NjA5QHFxLmNvbQ==
†These authors have contributed equally to this work