 Lifei Zhang
 Yunna Ma
 Jiantao Dong
 Jianhui Cai
- 1Department of Surgery, Hebei Medical University, Shijiazhuang, Hebei, China
- 2Department of Gastrointestinal Surgery, Hebei General Hospital, Shijiazhuang, Hebei, China
- 3Department of Cardiovascular Medicine, Hebei General Hospital, Shijiazhuang, Hebei, China
- 4Department of Oncology and Immunotherapy, Hebei General Hospital, Shijiazhuang, Hebei, China
- 5Department of Research and Development (R&D), Yetem Biotech Corp. Ltd., Shijiazhuang, Hebei, China
Background: Tumor deposit (TD) is an independent risk factor associated with recurrence or metastasis for patients with colorectal cancer (CRC). The scenario in which both TD and lymph node metastasis (LNM) are positive is not clearly illustrated by the current TNM staging system. Simply treating one TD as one or two LNMs by a weighting factor is inappropriate. The aim of this study was to evaluate the prognostic impact of TD counts and revise TNM staging by utilizing TD count as a stratification criterion in patients with CRC.
Methods: All the cases diagnosed with CRC between 2010 and 2019 were extracted from the Surveillance, Epidemiology, and End Results (SEER) database. Patients who met all inclusion criteria were grouped as TD=0, TD=1, TD=2, or TD≥3 based on their TD counts. To compare overall survival (OS) between groups, survival curves were plotted using Kaplan–Meier methods with log-rank tests. Utilizing TD count as a stratification criterion, the NM classification was regrouped. Using the Cox proportional hazards model, univariate and multivariate analyses were performed to identify significant factors in the revised TNM staging system. A nomogram was then created. The C-index, calibration plots, and receiver operating characteristic (ROC) curve were used to verify the model’s accuracy.
Results: A total of 60,145 patients who satisfied all inclusion requirements were ultimately included in the datasets for analysis. Among them, 6,092 (10.1%) had TDs, with only 1,384 (22.7%) staged as N1c. The 3-year OS rates were 74.6%, 50.4%, 39.8%, and 29.1% in the TD=0, TD=1, TD=2, and TD≥3 groups, respectively (p < 0.001), indicating that a greater TD count was linked to a worse prognosis. We introduced a novel stage, N2c, for patients with 10 or more LNMs. We found a striking overlap between the survival curves of this new subgroup and those of the M1a group, with p = 0.39. We observed that the survival trajectories of CRC patients with more than three TDs were similar to those of patients in the N2c group and the M1a group, with p = 0.15 and p = 0.42, respectively, which means that CRC patients with more than 10 LNMs or three TDs are equivalent to the presence of distant metastases. Utilizing TD count as a stratification criterion, we regrouped the NM classification. We finally assigned CRC patients with three or more TDs to the M1a. Finally, the revised TNM staging’s prognostic significance was demonstrated by the nomogram and dynamic nomogram. The C-indices for OS prediction in the training cohort and validation cohort were 0.751 (95% CI: 0.748–0.754) and 0.752 (95% CI: 0.747–0.756), respectively. The ROC curve study revealed that both the training cohort and the validation group had areas under the curve (AUCs) of approximately 0.8 at 1, 3, and 5 years. The calibration curves demonstrated good agreement between actual observation and the nomogram-predicted Cancer-Specific Death (CSD) probability. The clinical application study demonstrated that the model outperformed the TNM staging approach in terms of net benefit increases and fewer needless procedures.
Conclusions: TDs have significant predictive significance in CRC. The revised TNM staging using TD counts as a stratification criterion predicts survival more accurately than the current staging. CRC patients with more than 10 LNMs or three TDs have a level of malignancy comparable to the existence of distant metastases. The dynamic nomogram could assist medical practitioners in diagnosing, providing prognoses, and optimizing treatment strategies more quickly and effectively.
1 Background
Optimizing cancer treatment strategies requires accurate prognostic assessment (1, 2). The most extensively used approach for colorectal cancer prognostic evaluation is the American Joint Committee on Cancer (AJCC) TNM staging system (3). It has changed dramatically over the last two decades, with the primary driver being the introduction of tumor deposit (4–6). The eighth edition of the AJCC staging system classified tumor deposit (TD) as a distinct tumor nodule that was found in the adjacent mesentery or pericolonic or perirectal fat and did not exhibit histological evidence of a remnant lymph node or a readily discernible vascular or neural component (7). N1c refers to colorectal cancer (CRC) individuals who have TD but no lymph node metastases (LNMs). In contrast, the presence of TD or LNM with any T lesion is defined as stage III, which means a local advanced stage that needs more aggressive treatment decisions (8). Nevertheless, when coexisting with positive nodes, TDs are discarded in nodal staging (e.g., pN1a + 5 TDs = pN1a). This contradicts the evidence that TDs with node involvement had a worse outcome than N1c alone (9). The N1c category fails to recognize the synergistic disadvantage of TD+LNM coexistence, resulting in a staging blind spot. In addition, each TD is handled similarly (1 TD = 10 TDs in staging impact), and all N1c patients receive similar adjuvant therapy (7). The failure to elevate therapy for widespread TDs demonstrates a key gap in precision oncology. TD is an independent risk factor associated with recurrence or metastasis (10, 11). The main controversy is that the TNM staging system, at present, has lost a substantial amount of information regarding TD and should be revised.
To date, numerous researchers have worked diligently to elucidate the role of TD (12–15). Compared to TD-negative N2 patients, N1c patients had superior 5-year overall survival (OS) and disease-free survival (DFS), but they had inferior 5-year DFS compared to TD-negative N1 patients, according to a meta-analysis (16). The influence on CRC prognosis of TD positivity may be between N1 and N2. Given that patients who tested positive for TD had a worse prognosis, several studies have demonstrated that TD should be distinguished from LNM. According to Shi M et al., a significant number of TDs would make the survival of CRC patients poorer (17). Dae Hee Pyo et al. recommended treating one TD as one positive lymph node while counting in order to increase the predictive accuracy of TNM staging (18). Meanwhile, Wang S. et al. concluded that the eighth TNM staging system’s “N1c” classification is inferior to weighing one TD as two LNMs (19). However, each TD may vary from others in terms of size, shape, or contour. Simply treating one TD as one or two LNMs by a weighting factor is inappropriate. Previous research results need to be ameliorated.
This study aimed to quantify the independent prognostic significance of TD counts relative to LNM status in CRC, develop a revised TNM staging system integrating TD counts as a stratification criterion, and rigorously validate its predictive accuracy for CRC patients, ultimately bridging pathological insights with precision prognostication.
2 Methods
2.1 Patient selection
Data of all patients with CRC diagnoses were collected from the SEER database [Research Data, 17 Registries, Nov 2023 Sub (2000–2021)] in April 2024 with reference number 22021-Nov2021. Using the SEER*Stat program version 8.4.4, we began with a nationwide cohort of 327,579 CRC cases from 2010 to 2019, identifying patients with the primary site code C18.0-C20.9. Some patients with the following exclusion criteria were excluded: 1) appendix and unknown tumor site, 2) no first malignant primary, 3) unknown TD number, 4) unknown TNM stage, 5) unknown regional nodes positive, 6) unknown or no surgery, 7) received neoadjuvant therapy, 8) missing or unknown cause of death, 9) unknown grade, 10) unknown tumor size, and 11) unknown perineural invasion. Patients with potential follow-up <60 months were excluded to ensure robust 5-year survival estimation. Cases recorded as “alive” with <60 months of follow-up represented data inconsistencies or eligibility violations and were removed. The research ultimately included 60,145 individuals who met all inclusion criteria. Figure 1 shows the selection criteria and screening procedure.
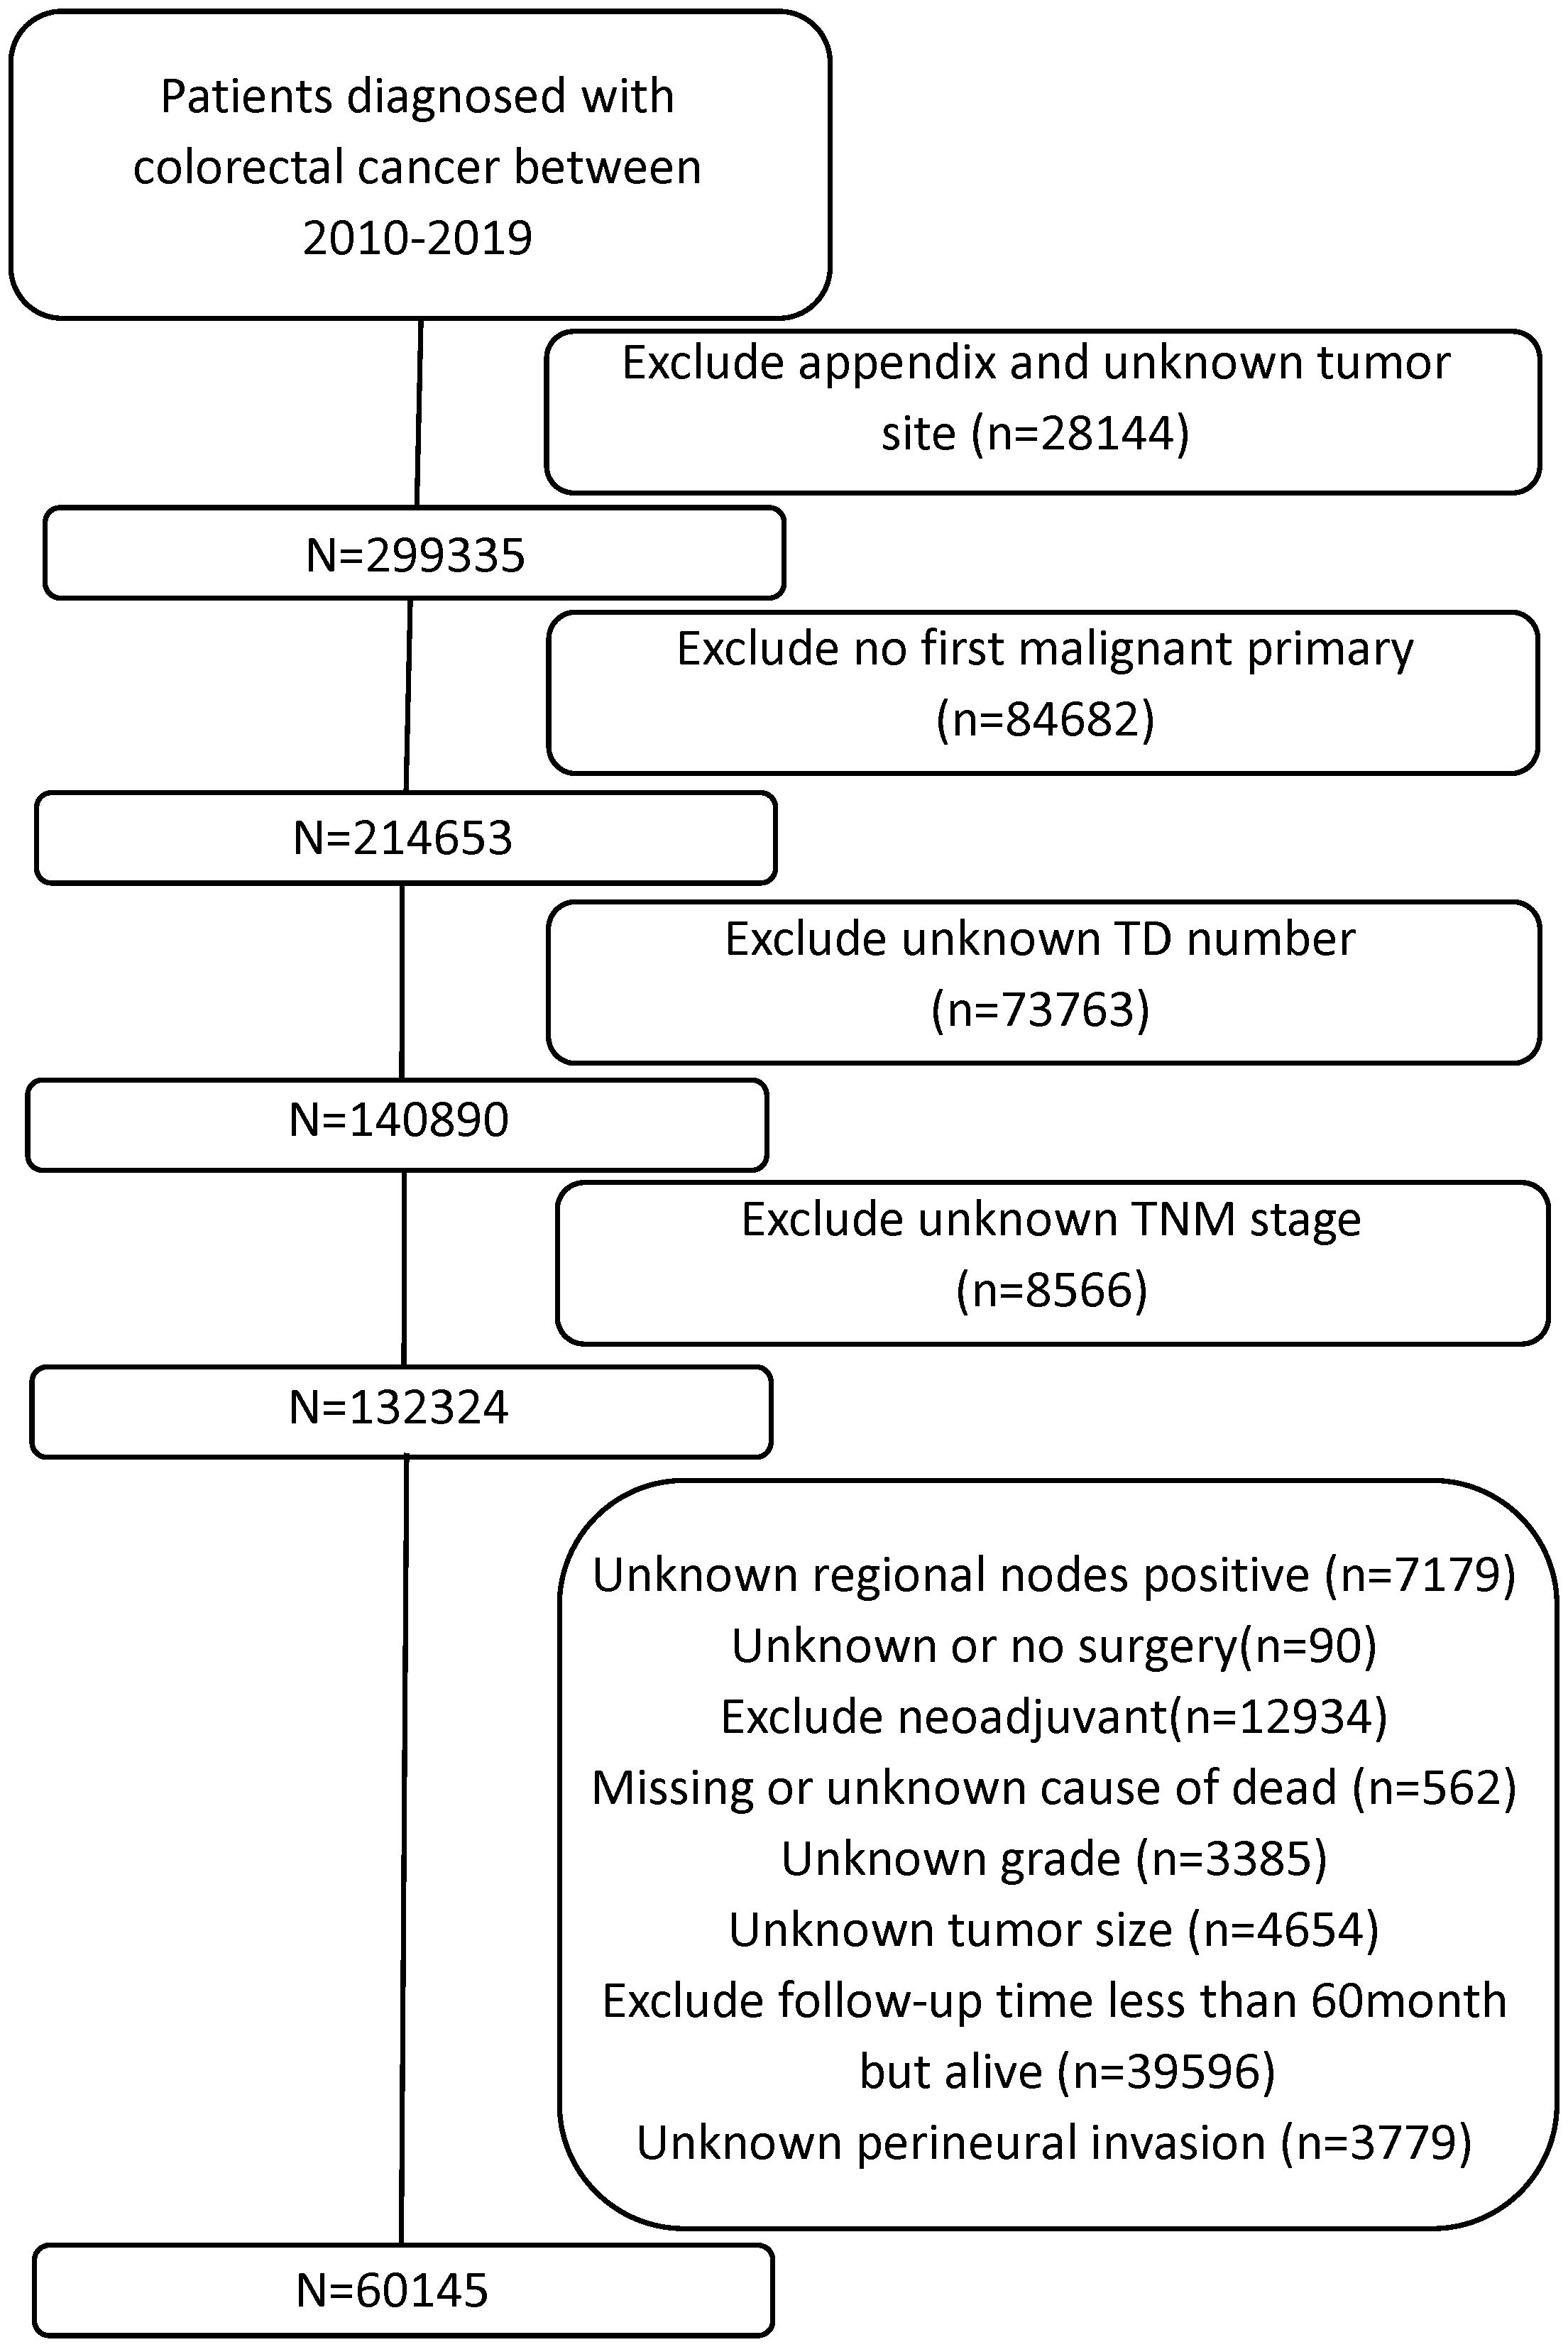
Figure 1. Flowchart of selection of study subjects.
2.2 Variables
The collected demographic and clinical variables included tumor deposit, age, gender, primary site, tumor size, grade, histology, AJCC T stage, AJCC N stage, AJCC M stage, radiation, chemotherapy, carcinoembryonic antigen (CEA) pretreatment, perineural invasion, marital status, survival time, and survival outcome.
Age was investigated as a continuous factor. Tumor deposit was divided into four groups: 0, 1, 2, and ≥3. Tumor sizes were split into groups of ≤50 and >50 mm. The two divisions were made using the best cut-off value determined by the Yale University-developed bioinformatics program X-Tile (version 3.6.1). Histology was classified into adenocarcinoma (ICD-O-3 code including 8140/3, 8210/3, 8211/3, 8213/3, 8221/3, 8260/3, 8261/3, 8262/3, and 8263/3), mucinous adenocarcinoma/signet ring cell carcinoma (ICD-O-3 code include 8480/3, 8481/3, and 8490/3), and others. OS was identified using the SEER “survival months” variable. The result of the follow-up was defined as either alive or dead from any cause.
2.3 Statistical analysis
To compare OS between groups, survival curves were created using log-rank testing and the Kaplan–Meier procedures. TNM staging was then revised by utilizing the TD count as a stratification criterion. The 7:3 ratio of eligible patients was used to randomly assign them to a validation cohort (n = 18,044) and a training group (n = 42,101). The baseline clinical variable features were compared using the Kruskal–Wallis H test for non-normally distributed continuous variables and the chi-square test for categorical data.
Using the Cox proportional hazards model, univariate and multivariate analyses were used to identify significant covariates (p < 0.05) in the training set. Variables’ calculated hazard ratios (HRs) were reported with 95% CI. Stepwise regression was used to determine the final model. Based on the findings of the multivariate analysis, the nomogram was constructed to predict the likelihood of individual survival. Then, a dynamic nomogram was created to use this model in clinical settings.
The nomogram’s capacity for discrimination was assessed using the bootstrap-corrected C-index. The ROC curves were created, together with the related areas under the curve (AUCs), building on the estimation that was previously presented. To do a more comprehensive assessment of the model’s calibration, the difference between the expected and actual probability was computed using the calibration plot.
For all data analyses, version 4.2.2 of the R program was utilized (http://www.R-project.org/). p-Values below 0.05 were regarded as statistically significant on both sides.
3 Results
3.1 Patient baseline characteristics
A total of 60,145 CRC patients were gathered from the SEER database, including 6,092 (10.1%) patients with TDs. Of the entire sets, 54,053 (89.9%) were classified as TD=0, 2,492 (4.1%) as TD=1, 1,283 (2.1%) as TD=2, and 2,317 (3.9%) as TD≥3. Among the 6,092 (10.1%) TD-positive CRC patients, only 1,384 (22.7%) were staged as N1c, comprising 797 as TD=1, 285 as TD=2, and 302 as TD≥3. All covariates, excluding gender, were significantly correlated with TD counts. The detailed information is shown in Table 1.
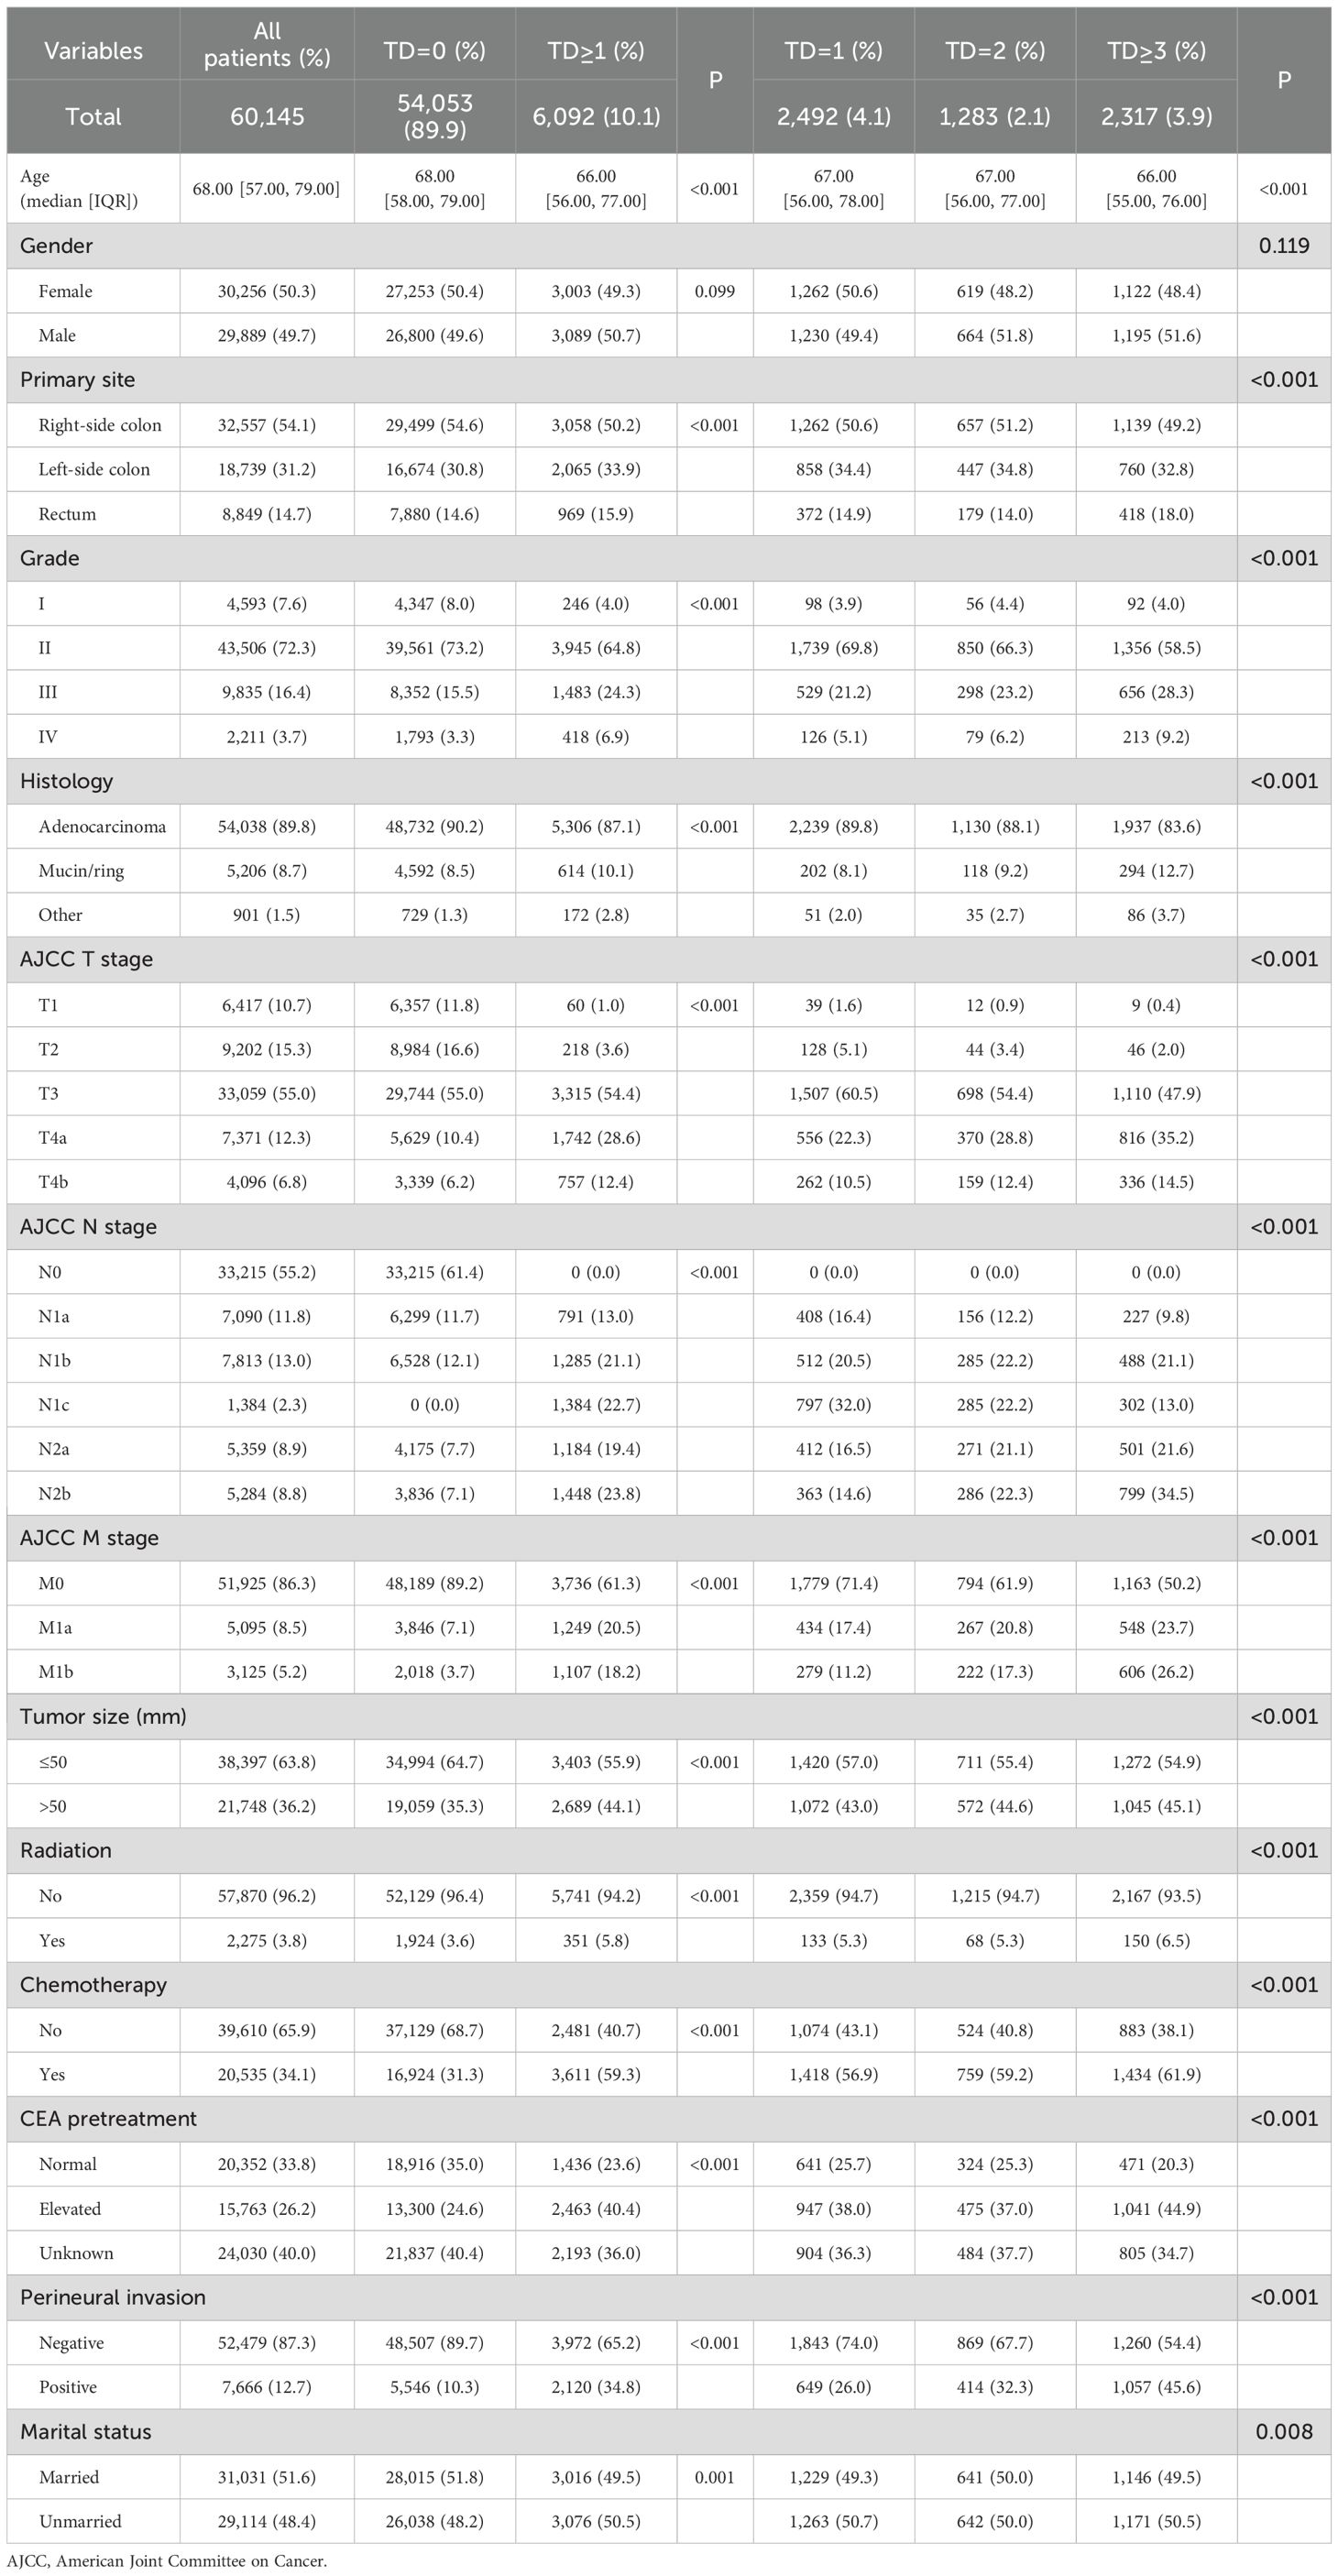
Table 1. Comparison of demographics and clinicopathologic characteristics based on the number of tumor deposits.
3.2 Survival analysis
For the eligible patients, the median follow-up period was 64 months (Interquartile Range (IQR): 20–87). A total of 31,416 patients (52.2%) died. The TD groups’ OS rates were contrasted (Figure 2A). TD count was a significant predictive factor for CRC patients, as seen by the 3-year OS rates of 74.6%, 50.4%, 39.8%, and 29.1% in the TD=0, TD=1, TD=2, and TD≥3 groups, respectively (p < 0.001). According to the AJCC TNM staging method, N1c stands for TD-positive patients. Thus, a survival analysis comparing the TD-positive group and the N1c group was conducted (Figure 2B). As indicated by the 3-year OS rates of 40.0% and 58.9% (p < 0.001), the N1c group was unable to prognostically predict the outcome for patients with TDs. Then, survival analysis was conducted between the TD groups and AJCC TNM stage groups (Figure 2C). The 3-year OS rates were 74.6%, 51.4%, 50.4%, 41.5%, 39.8%, 28.8%, 32.9%, and 29.1% in the TD=0, N2a, TD=1, T4b, TD=2, N2b, M1a, and TD≥3 groups, respectively (p < 0.001). The Kaplan–Meier curves of the TD=1 and N2a groups exhibited great similarity. The TD=2 group, however, was situated between the T4b and N2b groups. After the crossover, the TD≥3 and M1a groups partially merged.
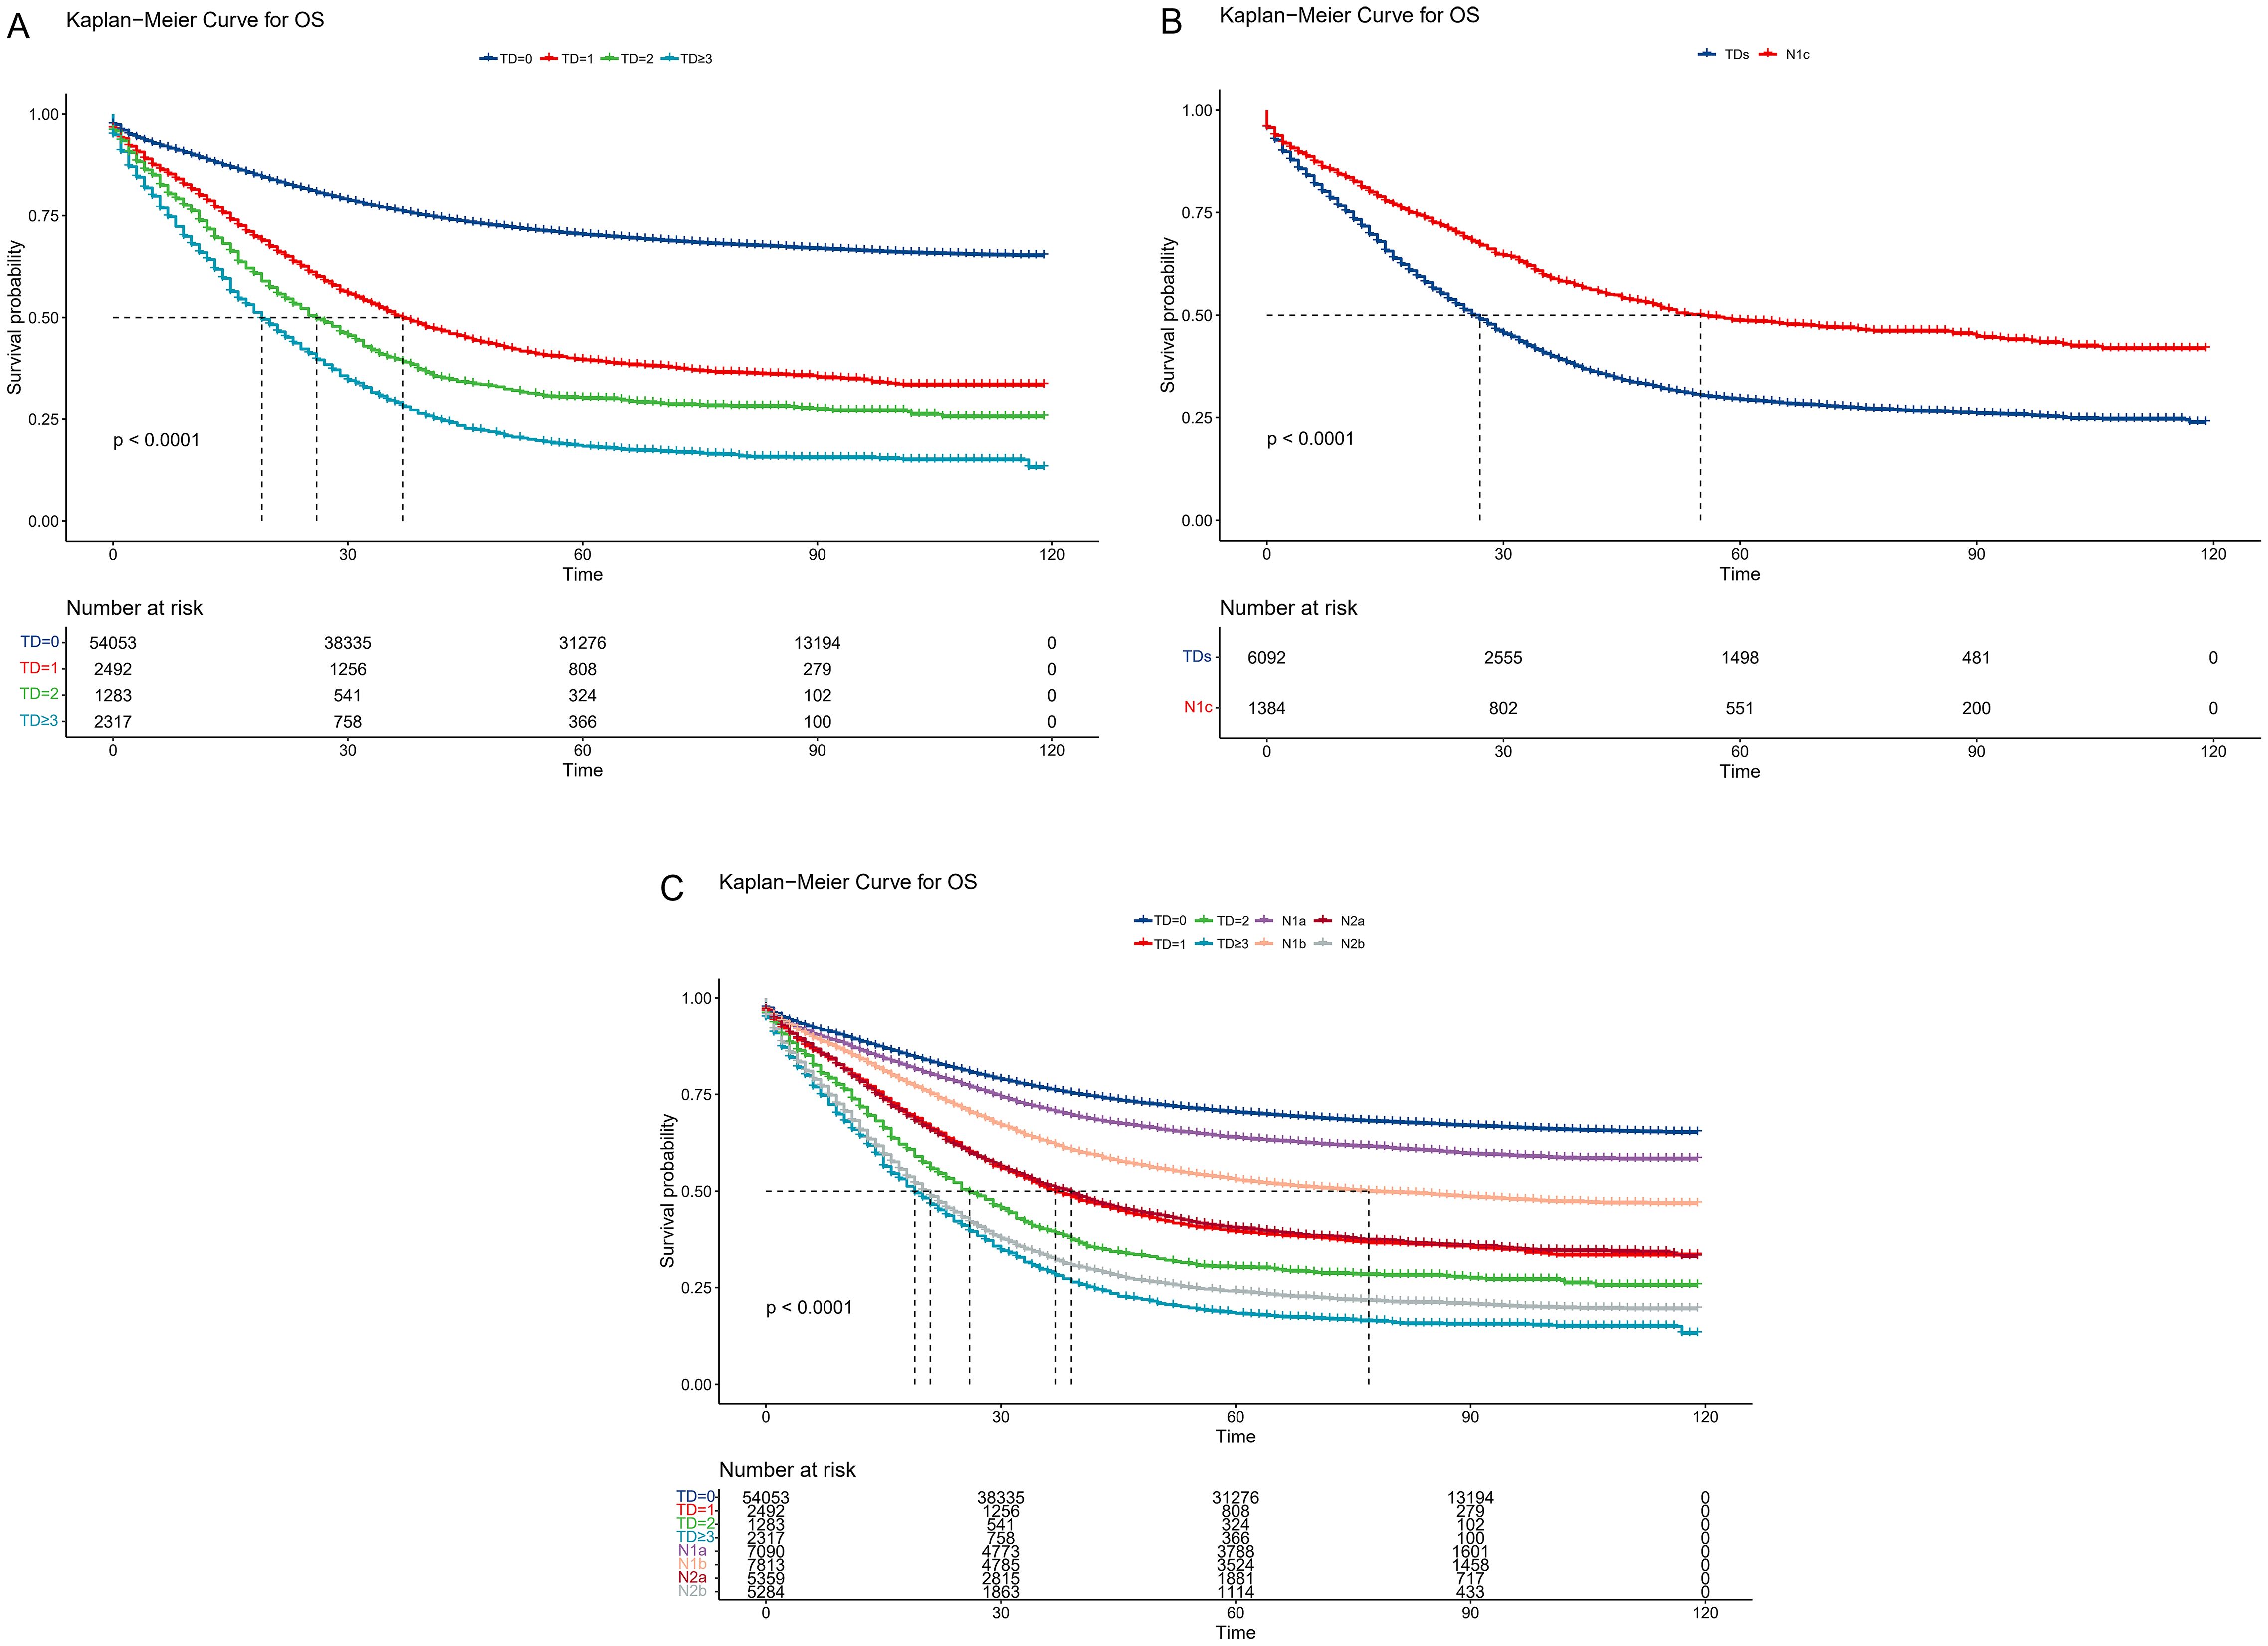
Figure 2. Comparison of overall survival among the current TNM groups. (A) Kaplan–Meier curves according to the tumor deposit counts. (B) Survival comparison between TD-positive and N1c CRC patients. (C) Survival comparison between TD groups and AJCC TNM stage groups. TD, tumor deposit; CRC, colorectal cancer; AJCC, American Joint Committee on Cancer.
3.3 Revised TNM staging
To establish a more scientific and reasonable TNM staging system, first, the TD count was considered a stratification criterion, and then the NM classification was regrouped. Unlike the current AJCC staging system, the N1c stage was eliminated, new N2a was regrouped as four to six LNMs, new N2b was regrouped as seven to nine LNMs, and the new N2c was created, which had 10 or more LNMs. Then, survival analysis was validated between the TD groups and the regrouped new NM groups (Figure 3A). The 3-year OS rates were 51.4%, 50.4%, 39.8%, 39.8%, 29.1%, 28.8%, and 26.6% in the new N2a, TD=1, new N2b, TD=2, TD≥3, M1a, and new N2c groups, respectively (p < 0.001). The Kaplan–Meier curves almost overlapped between the TD=1 and new N2a groups, similar to the TD=2 and new N2b groups. Meanwhile, the TD≥3 group was similar to the new N2c and M1a groups. Moreover, survival analysis was conducted between single couples (Figures 3B–F). The p-values were 0.66, 0.69, 0.42, 0.15, and 0.39 in the TD=1 new N2a couple, TD=2 new N2b couple, TD≥3 M1a couple, TD≥3 new N2c couple, and new N2c M1a couple, respectively. In the subgroup analysis, the TD≥3 and M1a couple exhibited greater similarity than the TD≥3 and new N2c couple, while the new N2c group had a similar malignancy to the M1a group. Finally, a revised TNM staging was constructed. TD=1 and new N2a were regrouped as *N2a, TD=2 and new N2b were regrouped as *N2b, TD≥3 and M1a were regrouped as *M1a, and new N2c was renamed as *N2c.
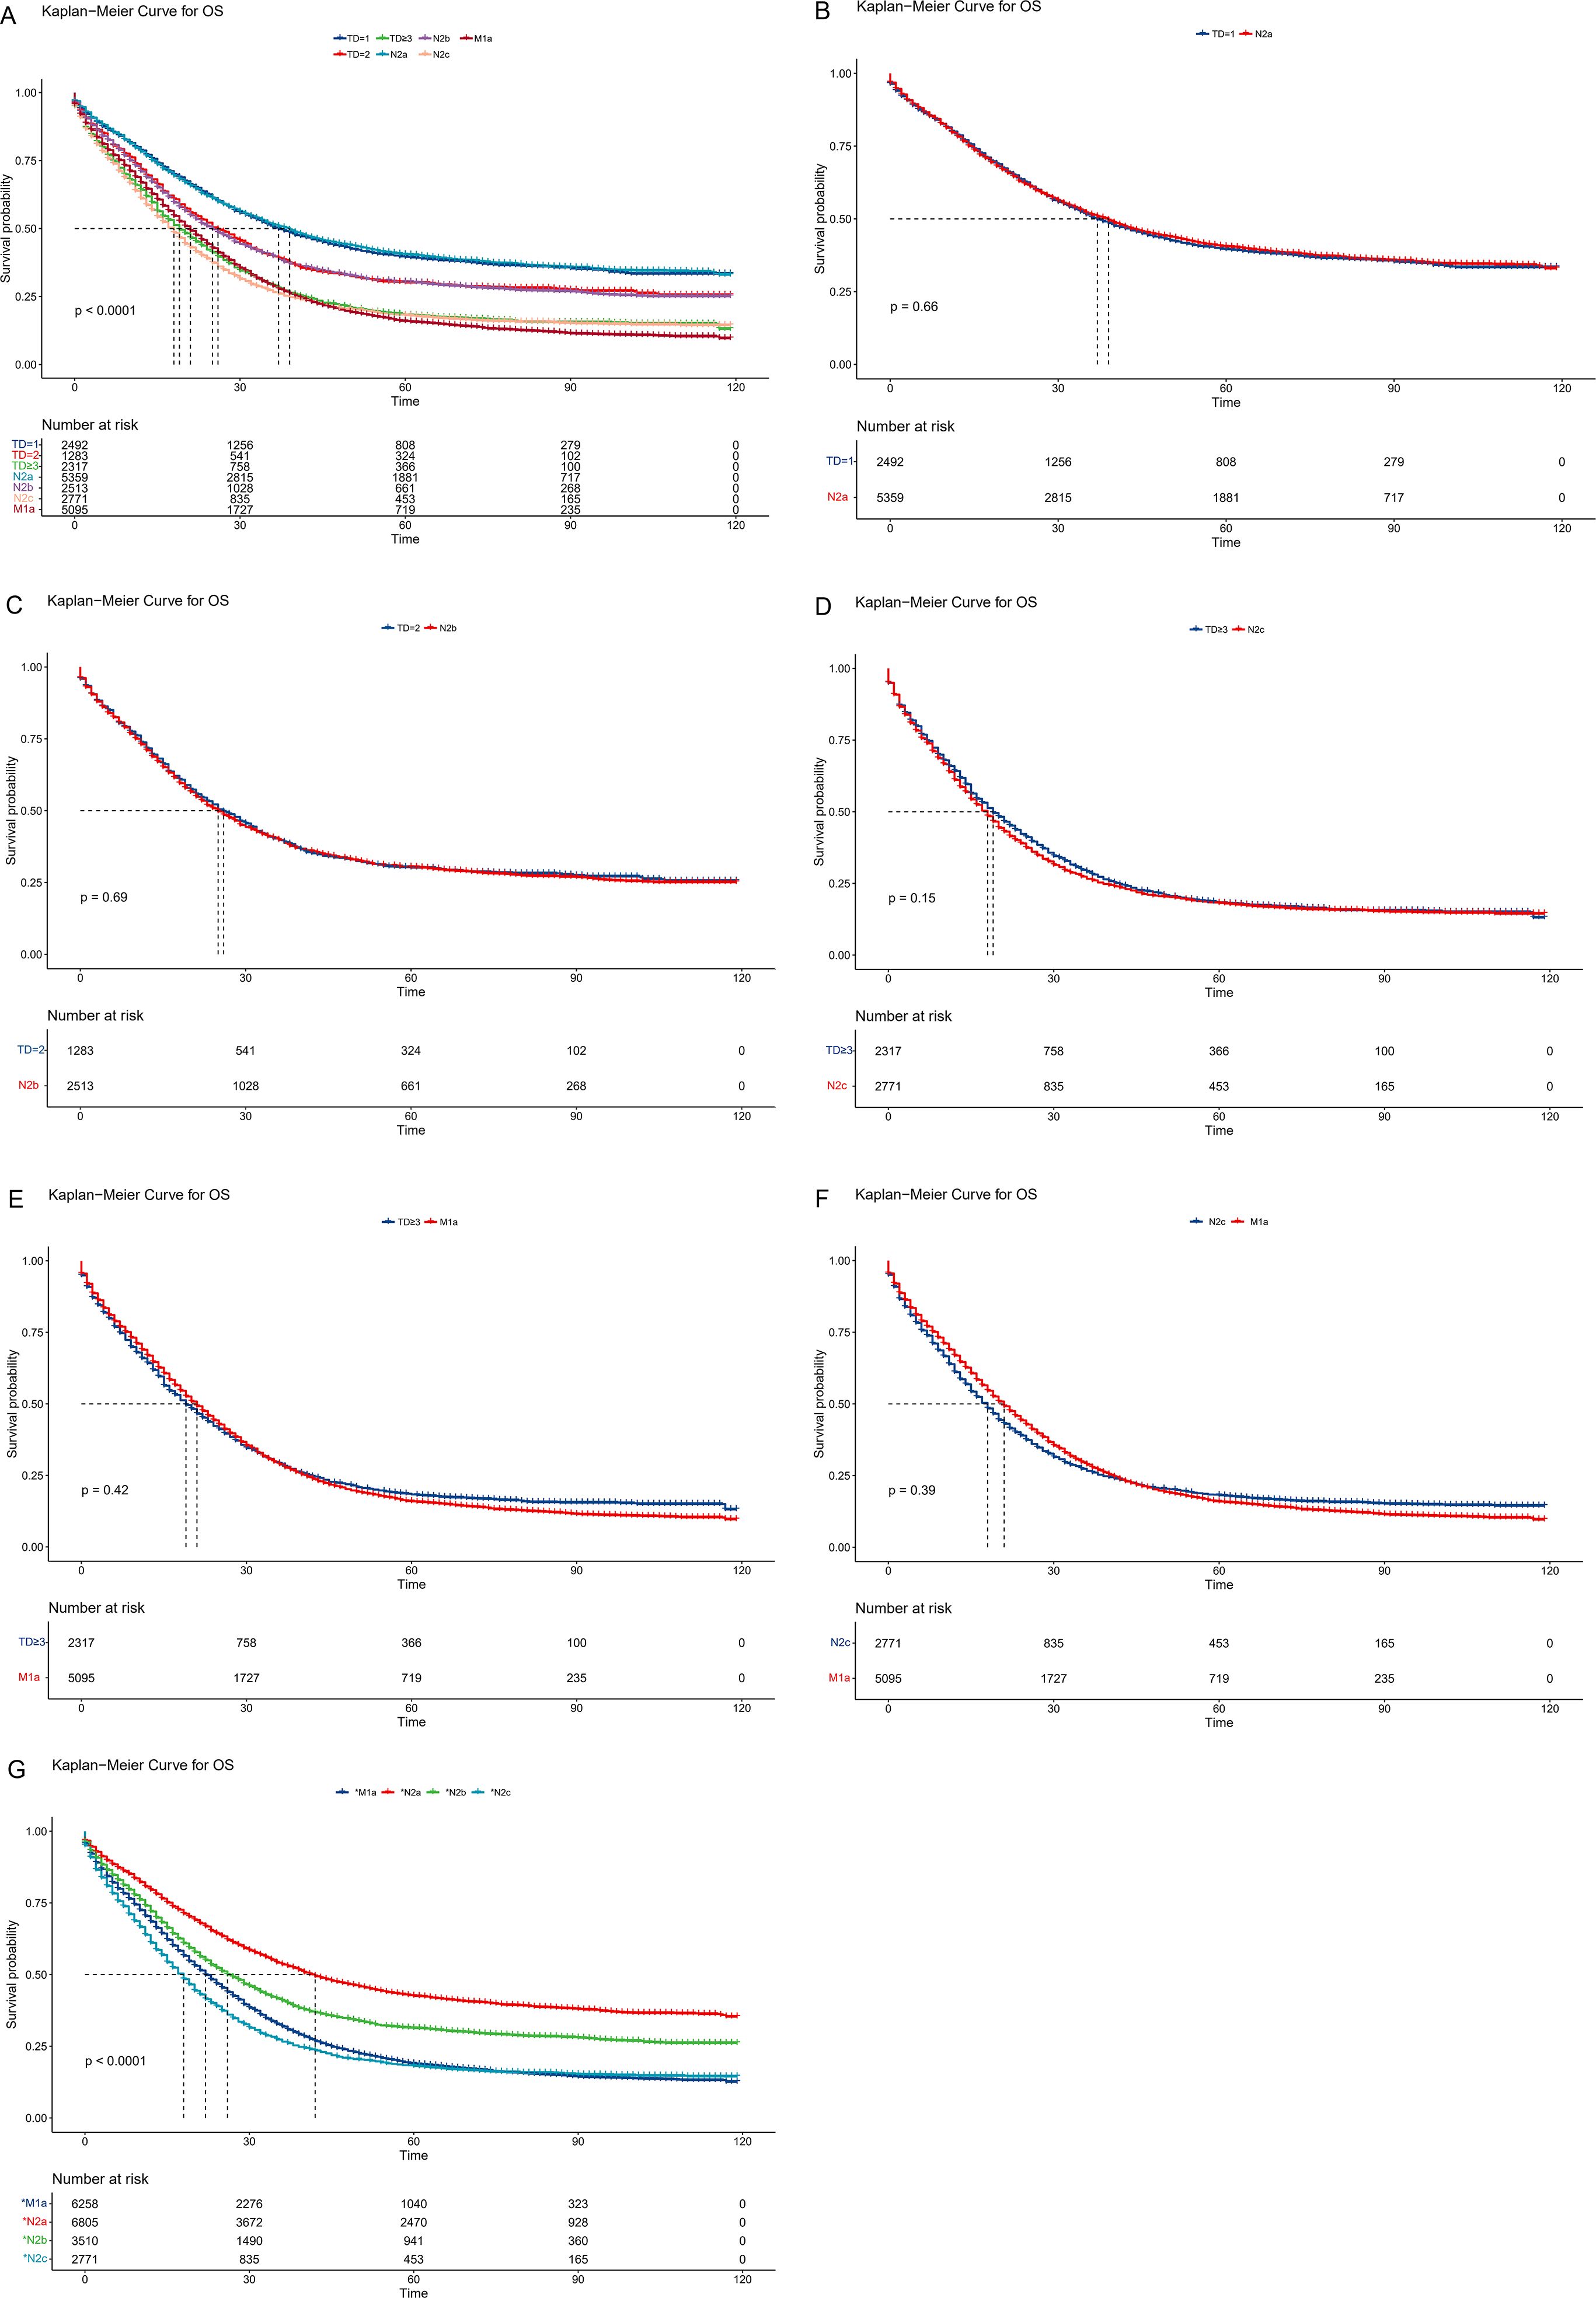
Figure 3. Comparison of overall survival among the revised TNM staging system. (A) Survival comparison between TD groups and regrouped new NM groups. (B) Survival comparison between TD=1 and new N2a couple. (C) Survival comparison between TD=2 and new N2b couple. (D) Survival comparison between TD≥3 and new N2c couple. (E) Survival comparison between TD≥3 and new M1a couple. (F) Survival comparison between M1a and new N2c couple. (G) Survival comparison of revised NM groups. TD, tumor deposit.
In the revised TNM staging system, 5,485 patients were adjusted from the N stage to *N2a(1717), *N2b(997), and *N2c(2771), whereas 1,163 patients were changed from the M0 stage to the *M1a stage (Table 2). The 3-year OS rates were 53.5%, 40.9%, 26.6%, and 31.9% in the *N2a, *N2b, *N2c, and *M1a stages, respectively (p < 0.001) (Figure 3G). For the current and updated TNM staging, the corresponding C-indices were 0.6731 (95% CI: 0.6715–0.6747) and 0.6744 (95% CI: 0.6728–0.6760).
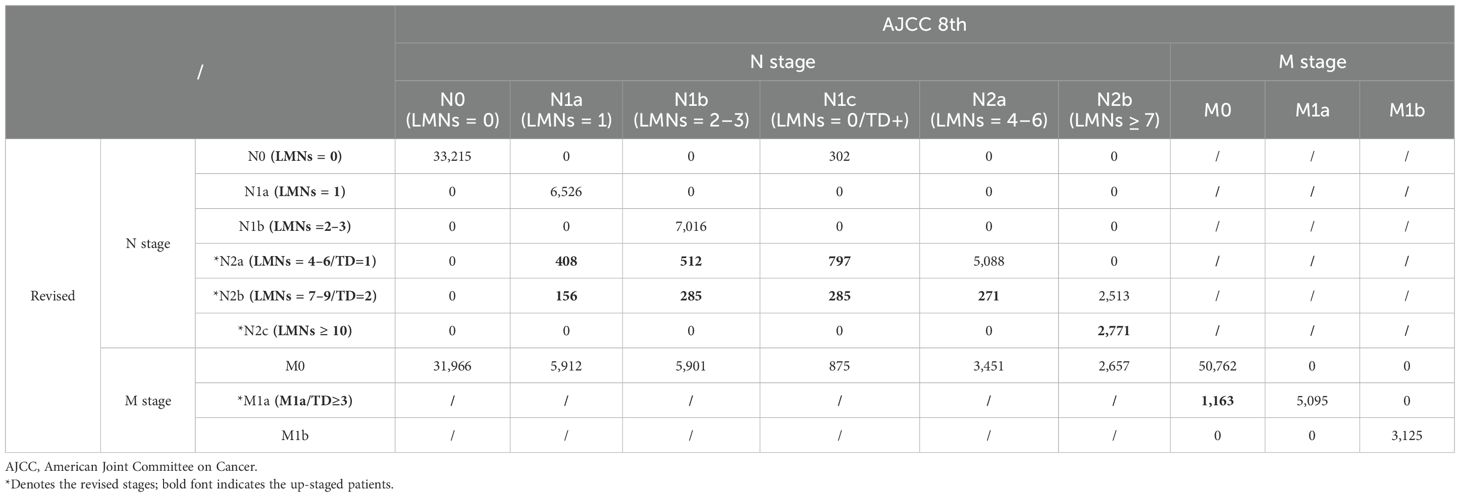
Table 2. Stage migration in the revised staging system utilizing TD count as a stratification criterion.
3.4 Univariate and multivariate analyses
Table 3 shows the demographics and tumor features of the CRC patient group with the revised TNM staging. These data are presented in the entire set (n = 60,145), training set (n = 42,101), and validation set (n = 18,044).
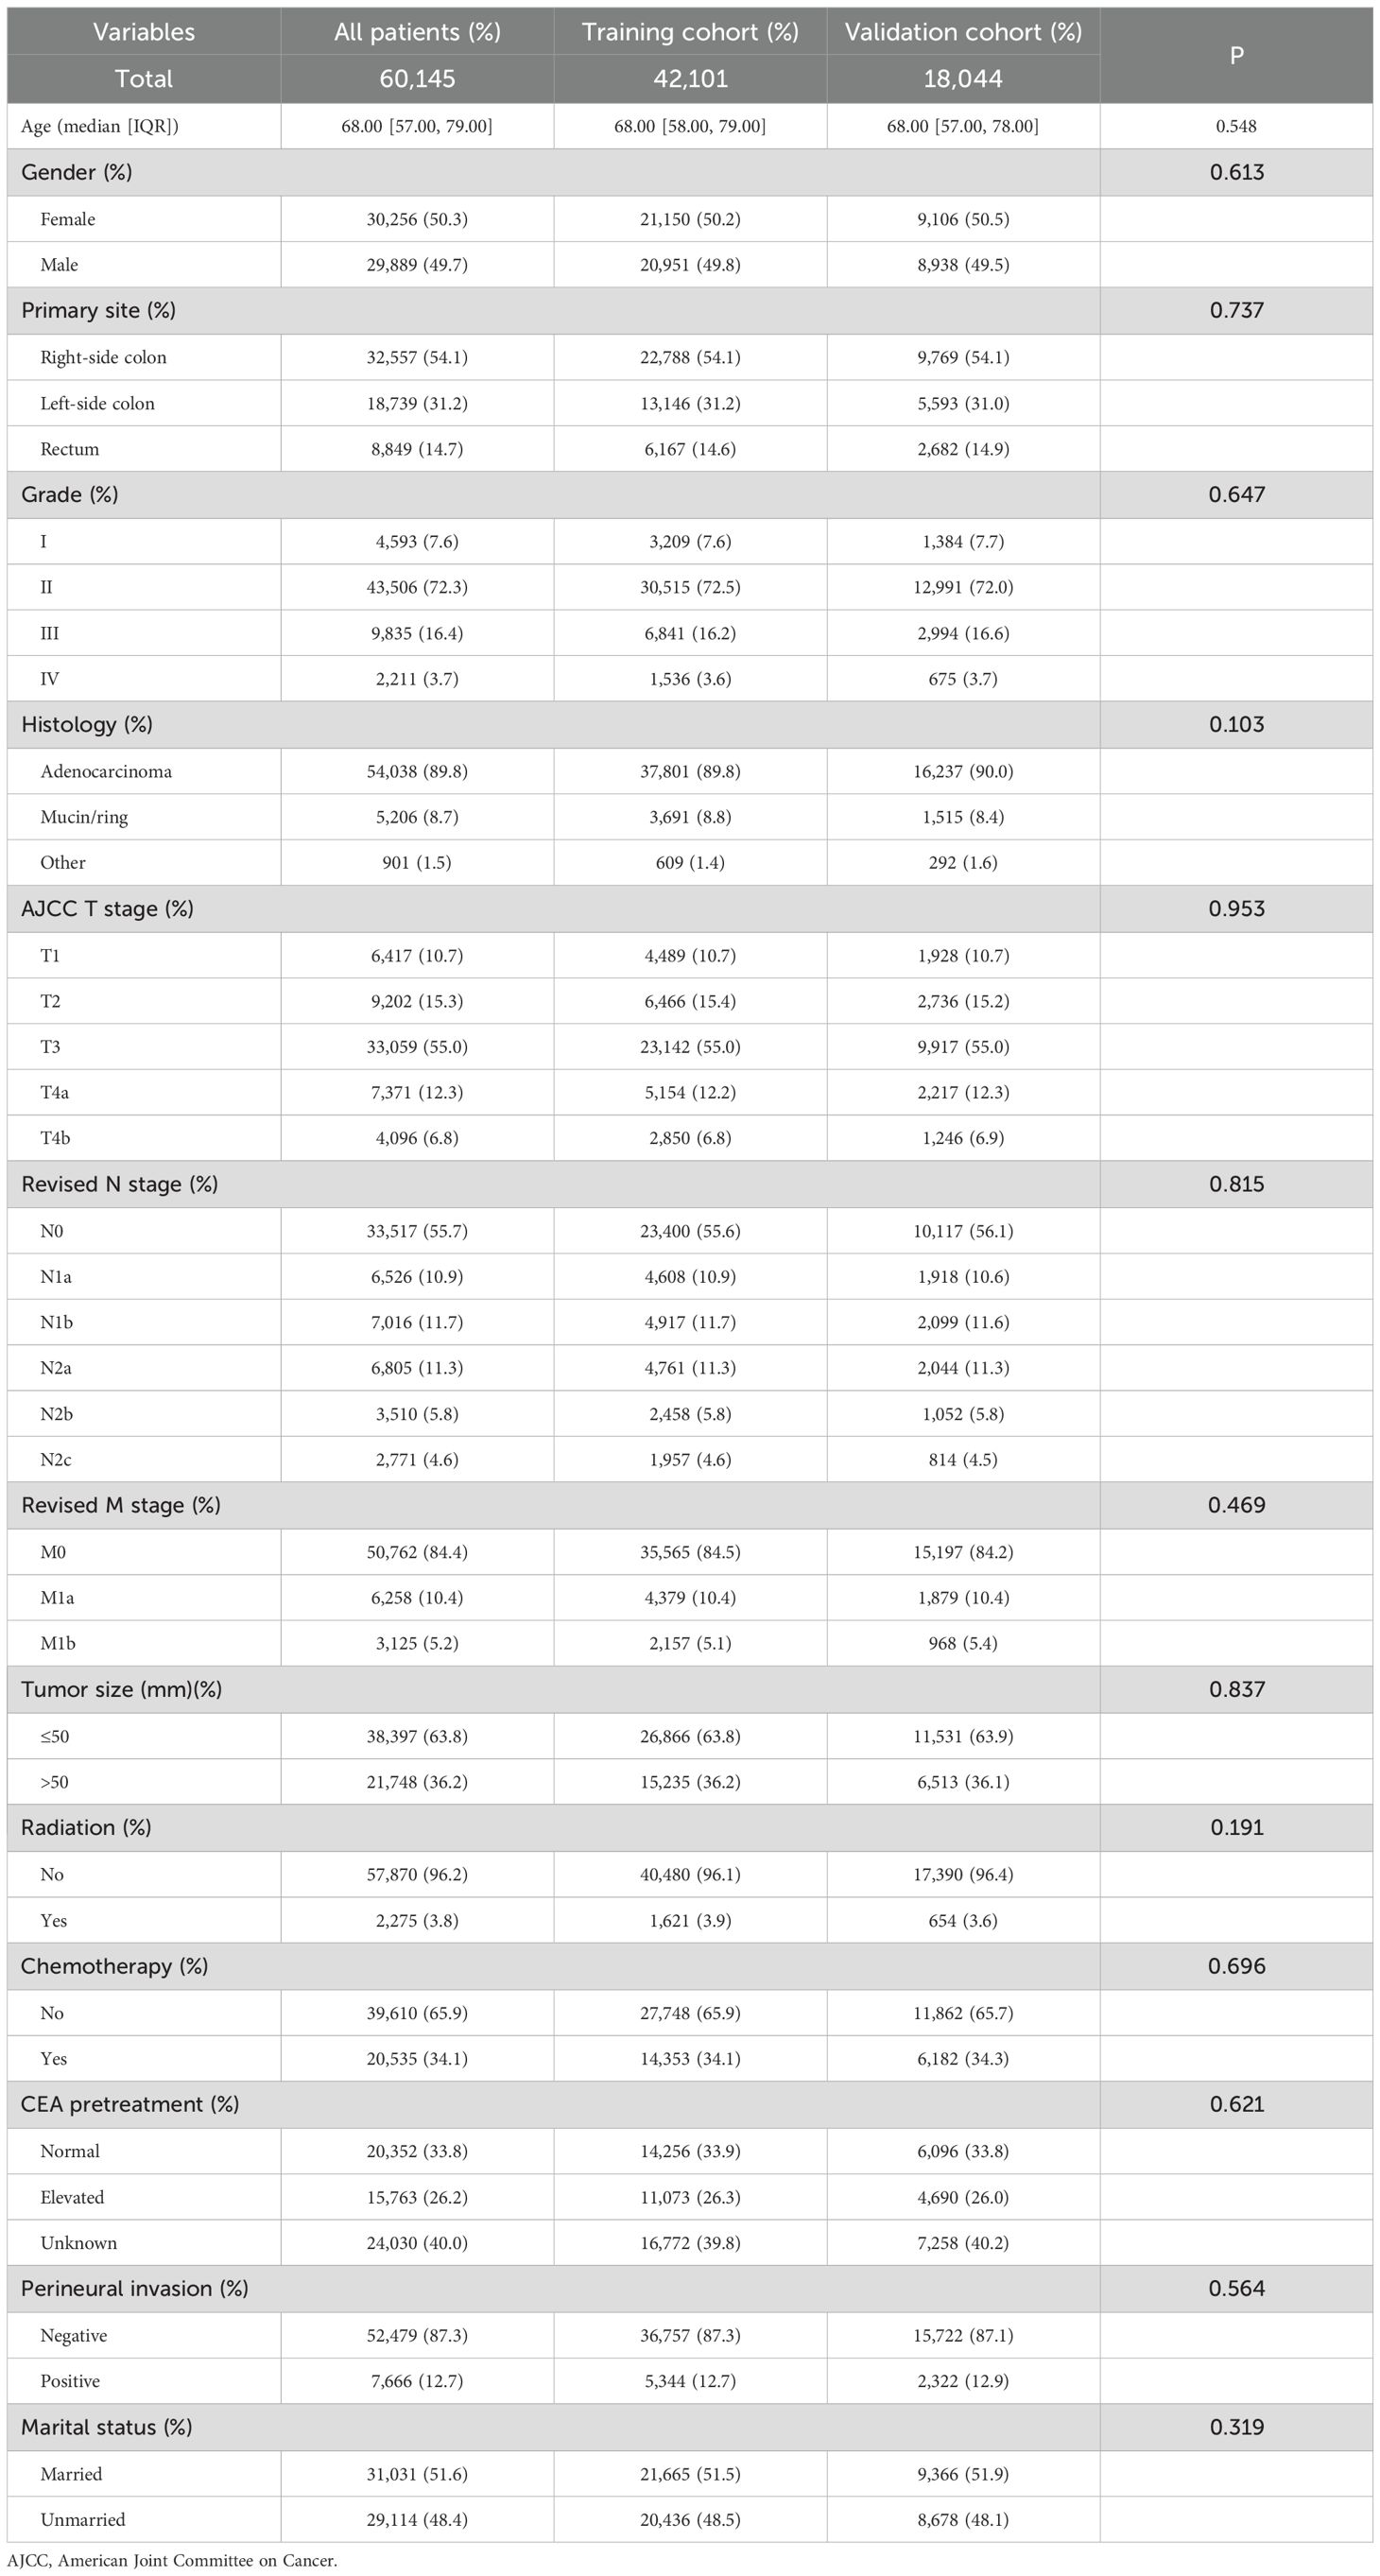
Table 3. Baseline demographics and clinical characteristics for the cohort with revised TNM staging.
According to univariate analysis, age, primary site, tumor size, grade, histology, AJCC T stage, revised N stage, revised M stage, radiation, chemotherapy, CEA pretreatment, perineural invasion, and marital status were linked to OS (p < 0.05). The criteria for the final model were the stepwise regression’s least Akaike information criterion (AIC) score. The multivariate analysis and prediction model incorporated all additional covariates, with the exception of original site, histology, tumor size, and radiation. The findings of the univariate and multivariate Cox regression analyses for OS in patients with CRC are shown in Table 4, along with the HR and 95% CI.
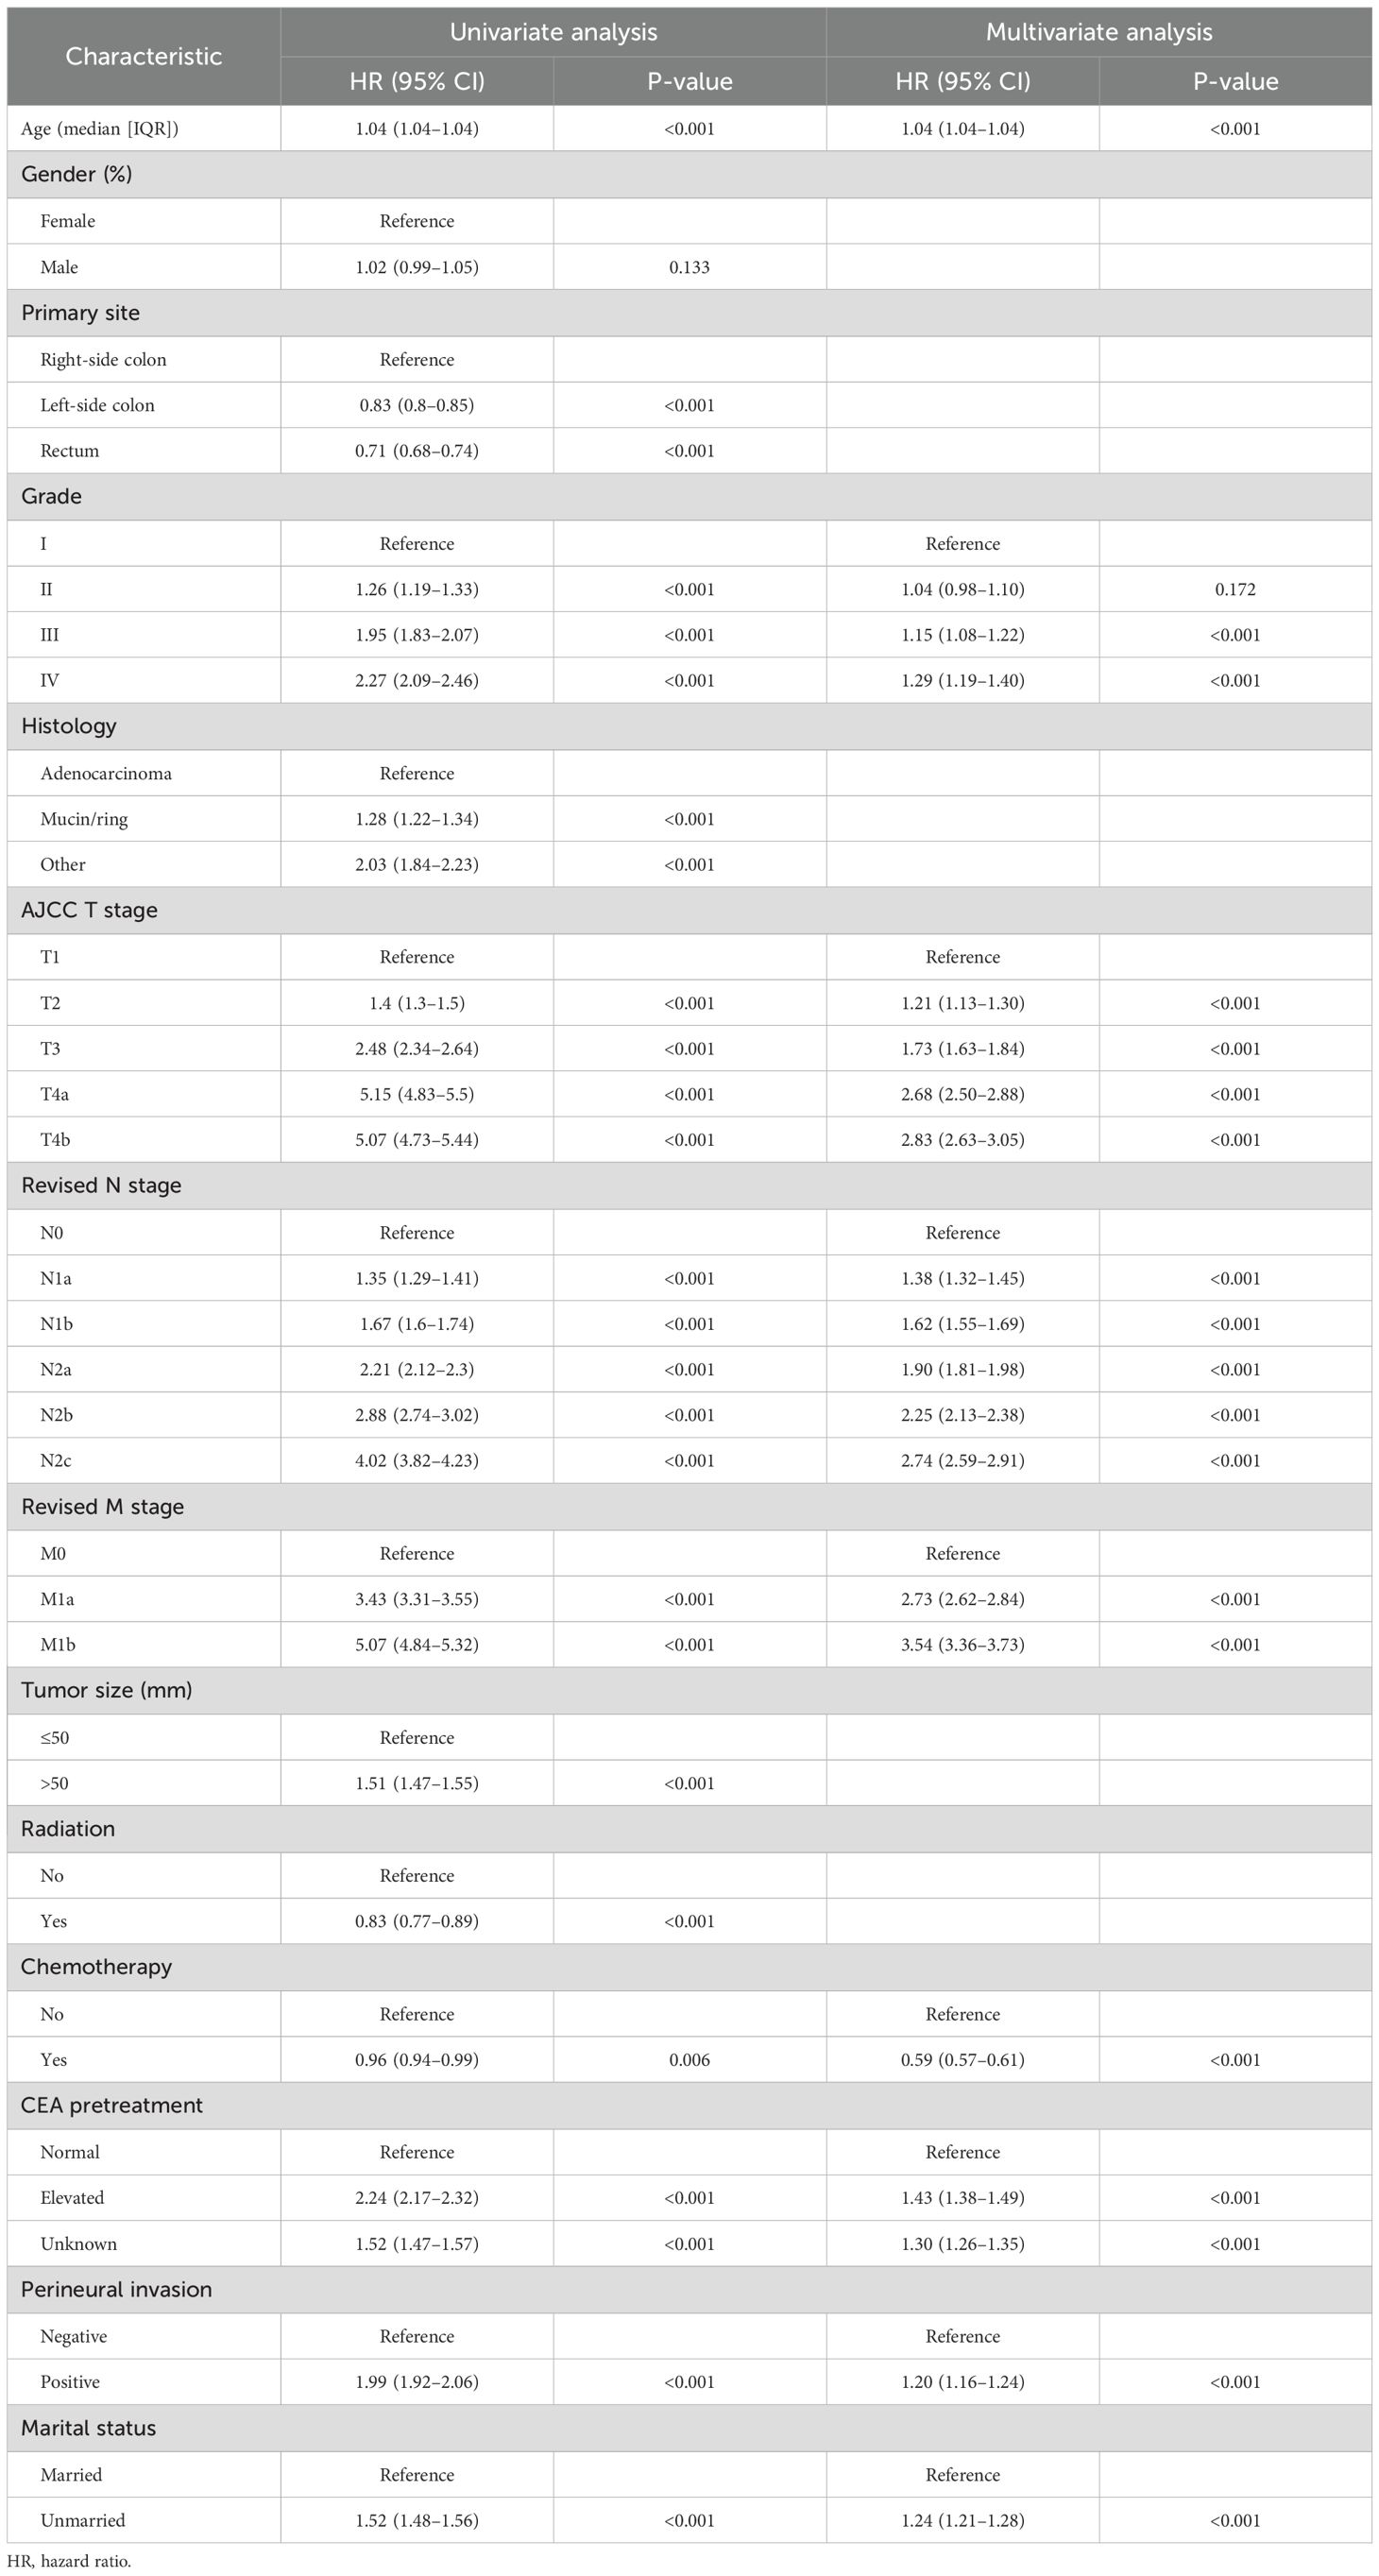
Table 4. Univariate and multivariate analyses of CSD in the training set (n = 42,101).
3.5 Prognostic nomogram construction and validation
To predict OS at 1, 3, and 5 years in CRC patients, a nomogram was developed using the multivariate model from the training cohort (Figure 4). The total score given at the bottom of the graph can be used to forecast the 1-, 3-, and 5-year OS rates of a particular patient by summing the scores for the individual elements in the nomogram, which summarizes the scores achieved on the scale for each of these risk variables.
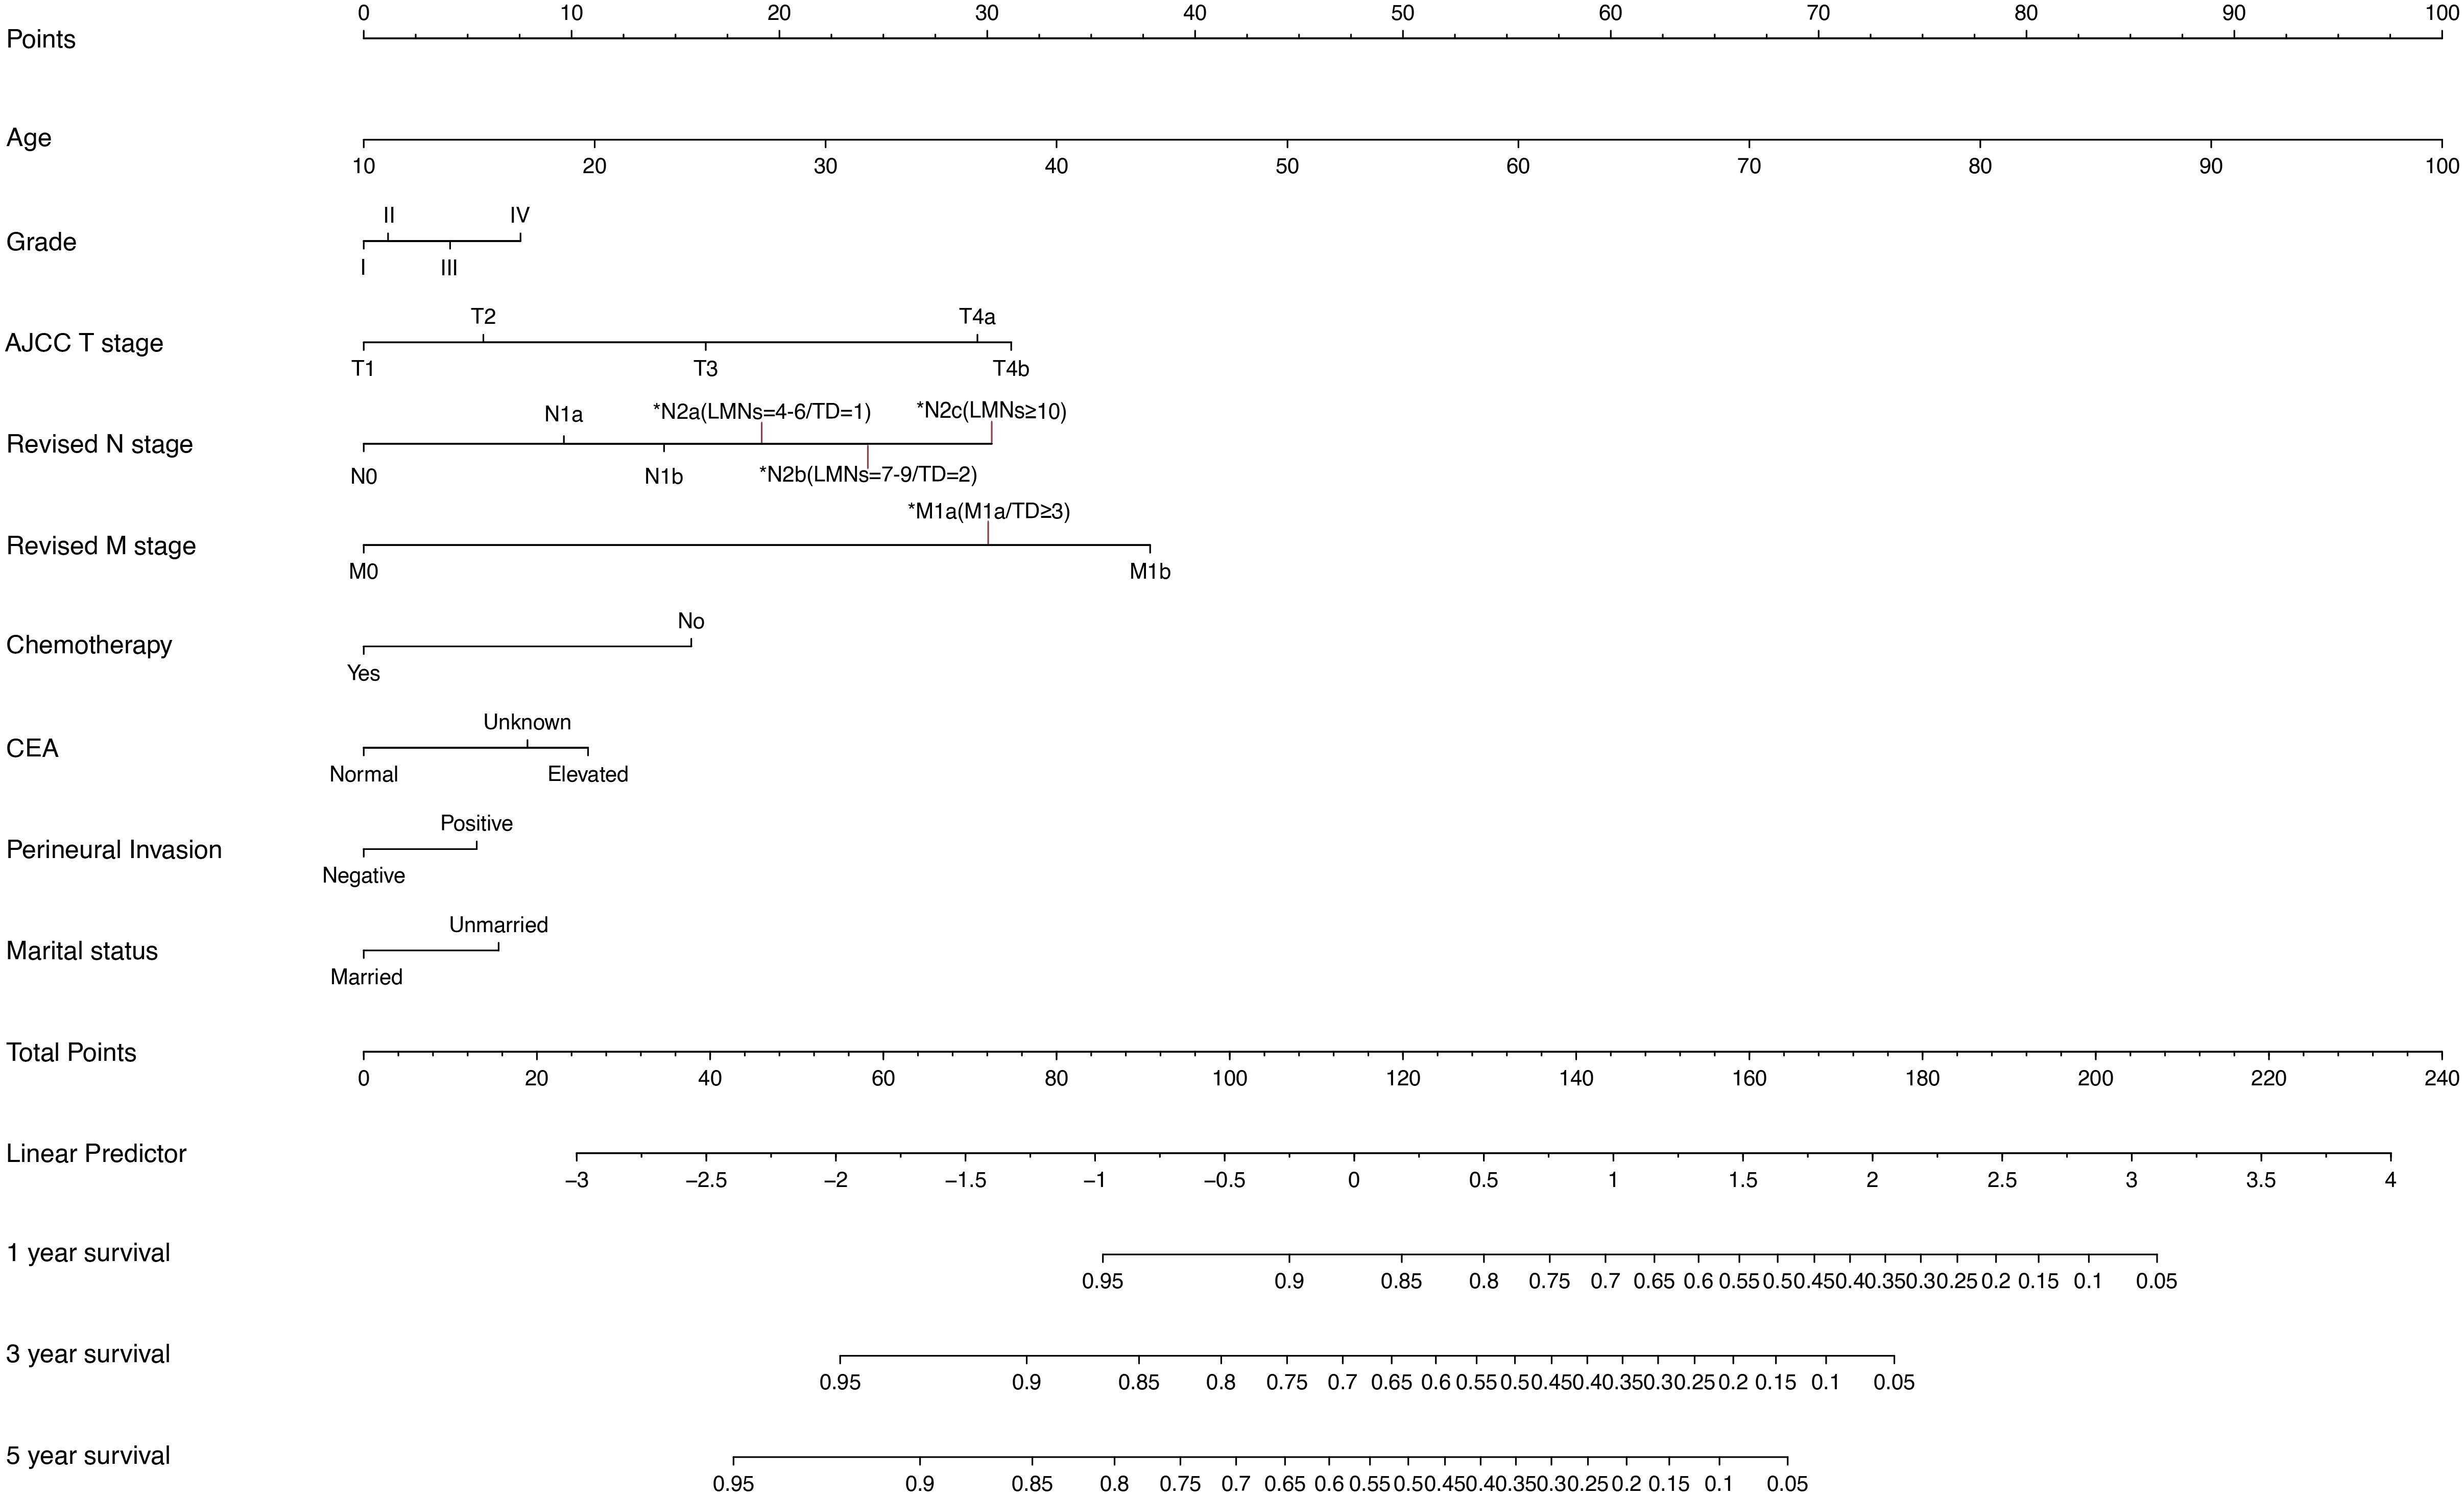
Figure 4. Nomogram for predicting 1-, 3-, and 5-year OS. OS, overall survival.
The prognostic nomogram’s C-indices for OS prediction in the training and validation cohorts were 0.751 (95% CI: 0.748–0.754) and 0.752 (95% CI: 0.747–0.756), respectively. The ROC curves (Figure 5) were created in the same way as the C-index, and the corresponding AUC values were obtained. The AUC values for predicting 1-, 3-, and 5-year OS rates in the training cohort were 0.797 (95% CI: 0.792–0.803), 0.816 (95% CI: 0.812–0.820), and 0.823 (95% CI: 0.819–0.827), respectively. The validation cohort’s numbers, however, were 0.797 (95% CI: 0.789–0.805), 0.818 (95% CI: 0.812–0.824), and 0.821 (95% CI: 0.815–0.827). The results proved the predictive model’s remarkable accuracy.
Figure 5. Nomogram ROC curves to predict 1-, 3-, and 5-year OS in the validation cohort. ROC, receiver operating characteristic; OS, overall survival.
Meanwhile, Figure 6 depicts the calibration curves for the probability of OS at 1, 3, and 5 years. The calibration plots were all rather close to the 45-degree diagonal line, showing the extraordinary accuracy of the predictions made using the nomogram models.
Figure 6. (A–C) Nomogram calibration plots to predict 1-,3-, and 5-year CSD in the validation cohort.
3.6 Dynamic nomogram construction
To make it easier and more practical for medical professionals to apply the developed nomogram in clinical settings, initially, we connected the RStudio application to a shinyapps server account that we had built. After that, four files were created using the multivariable Cox regression results: functions.R, global.R, server.R, and ui.R. The nomogram was made available online once all files had been submitted to the shinyapps server (https://tdrevisetnm.shinyapps.io/dynnomapp/). The clinical variables for the patient are listed on the website’s left side and can be entered by selecting an option next to each variable. After that, the survival rate can be calculated.
4 Discussion
The results of this study showed a high correlation between tumor aggressiveness characteristics and TD numbers, where a greater TD count was linked to a worse prognosis. Because of the lack of a description of the number of TDs, the N1c staging in the current eighth edition of the AJCC TNM staging method severely underestimates the influence of TDs on outcome. The revised TNM staging incorporates the number of afflicted regional lymph nodes, the degree of infiltration, and distant metastases, as well as a complete assessment of the impact of TD counts on recovery. Utilizing TD counts as a stratification criterion, 6,648 (11.1%) patients were up-staged, and the increased C-index indicates that the revised TNM staging produced a better accurate prognosis prediction than the present TNM staging.
Initially discovered in 1935, scientists have been studying TDs for ages. Evidence suggests two non-mutually exclusive origins of TD. 1) Vascular/perineural invasion: TD may arise from extramural vascular invasion (EMVI), where tumor clusters dislodge from primary sites and colonize perivascular/perineural spaces, lacking true lymphoid tissue (20, 21). 2) Obliterated lymph nodes: A subset likely represents replaced lymph nodes where tumor growth destroys nodal architecture (22–24). Even though our understanding of TD has improved in recent years, the mechanism of its presence and development is currently unclear. Studies have shown that TD, the early stage of distant metastasis, similar to intrahepatic metastasis of liver cancer and intrapulmonary metastasis of lung cancer, is caused by intra-organic spread of the original tumor (25). Chen J et al. claimed that the prevalence of TD in CRC patients can be independently predicted by primary site, T stage, grade, CEA, and LNMs (26), which is similar to the data in Table 1 of this investigation. Overall, TD is more often associated with aggressive characteristics of the disease.
Additional research has been conducted to determine the prognostic significance of TD and explore its integration into the TNM staging system. In terms of prediction, the updated nodal staging approach by Li et al., which incorporates TDs as positive lymph nodes, performed better than the seventh edition of the AJCC staging system (27). Dae et al. hypothesized that the updated nodal staging, which combined TD counts with lymph nodes and introduced a novel N3 stage, may predict survival more precisely than current staging (18). However, other studies have shown that TD and LNM reporting should be different. In terms of biology and results, TDs are not equivalent to LNMs, per a meta-analysis (20). Wang S et al. preferred to weight one TD as two LNMs (19). We believe that TD should be characterized according to the level of malignancy. Therefore, based on the survival curves of groups with varying numbers of positive lymph nodes, we eliminated N1c staging and introduced N2c staging, which contained 10 or more positive lymph nodes, reassigning TD-positive colorectal cancer patients in accordance with the comparability of survival curves across groups with varied numbers of TDs and different numbers of LNMs.
In line with many previous experiments, we also found that the prognosis worsened with the number of LNMs (28, 29). N2c, a new stage, was created for patients with 10 or more LNMs. We found a striking overlap between the survival curves of this new subgroup and those of the M1a group, with p = 0.39, indicating no statistically significant difference. Meanwhile, we observed that the survival trajectories of CRC patients with more than three TDs were similar to those of patients in the N2c group and the M1a group, with p = 0.15 and p = 0.42, respectively, which means that in CRC patients, having more than 10 LNMs or three TDs is equivalent to the presence of distant metastases. This serves as a reminder that more intensive treatment and follow-up schedules are necessary for the two particular groups. Finally, groups with three or more TDs were assigned to the M1a rather than the N2c since the former had a slightly higher C-index when combined.
We propose TD≥3 reclassification as a biologically plausible, clinically actionable hypothesis and not a definitive conclusion. This approach aligns with TNM’s historical evolution, where prognostic data frequently precede comprehensive biological validation. For instance, the eighth edition of AJCC initially redefined T1a/T1b melanoma subtypes based solely on survival cutoffs (30). Similarly, the Union for International Cancer Control (UICC) gastric cancer staging classifies cytology-positive peritoneal washings as M1 without size criteria (31). Within this conceptual framework, grouping TD≥3 with M1a serves as a critical clinical alert for therapy intensification. Specifically, under current practice, TD≥3 patients receive stage III therapy, achieving only 29.1% 3-year OS. By contrast, metastasis-level regimens (e.g., those for oligometastatic disease) may improve OS, as extrapolated from clinical trials. Such redefinitions—grounded in alignment between survival outcomes and biological profiles—enable rational therapy escalation prior to randomized controlled trial (RCT) confirmation. Consequently, survival-driven staging revisions frequently accelerate clinical translation by preceding mechanistic studies.
Finally, the revised TNM staging’s prognostic significance was demonstrated by the nomogram and dynamic nomogram. The weighted scores in the nomogram revealed that the T, N, and M stages were the most closely related to patient prognosis in the revised TNM staging method, which was consistent with the prior traditional TNM staging approach (32, 33). Meanwhile, we discovered that the M1a group, more than the three TD groups and more than the 10 LNM groups, had the most similar weighted scores in the nomogram, supporting the three groups’ similar prognosis as previously stated. Chemotherapy was the fourth factor that influenced the outcome, highlighting the importance of designing uniform chemotherapy methods after surgery. The eighth edition of AJCC categorizes patients with TD≥3 as stage III (N1c if lymph nodes are negative), and the recommended treatment is adjuvant chemotherapy alone (e.g., CAPOX for 3 to 6 months) (7). However, our results demonstrate that these patients had a 3-year overall survival rate of 29.1%, which is comparable to that of M1a single metastatic illness (30.2%, p = 0.42), indicating that the current therapeutic method is inadequate. Reclassifying TD≥3 as M1a is reasonable from biological and prognosis perspectives. These individuals should be treated with combined chemotherapy and targeted medicines (e.g., bevacizumab), as is done for oligometastatic illness. Although retrospective results support this method, it is critical to validate it in prospective trials such as PRODIGE 42 before it is used in guidelines. In addition, marital status, which has a weighted score that is even higher than that of perineural invasion, should be included as another predictive parameter, reminding us that unmarried/single individuals should be given more attention. While marital status lacks direct biological causality with TD formation, it serves as a proxy for healthcare access and psychosocial stress. The higher TD risk in unmarried patients (Table 1) likely reflects the cumulative effects of diagnostic delays and stress-promoted tumor aggression. This association should not imply marital status as a therapeutic target. Rather, it highlights the need for social support interventions in high-risk groups. The variables determining prognosis in this study’s nomogram are broadly compatible with the results of other retrospective investigations, with just a minor variance in the weight of the influence of each factor (34, 35).
Our study demonstrates that TD count is a powerful, independent prognostic modifier in CRC. We recommend that 1) central pathology review and standardized TD reporting (including precise enumeration, anatomic location, and extranodal extension status) should be enforced in prospective trials to reduce inter-observer variability. 2) The dynamic nomogram should be externally validated in Asian and European datasets and then integrated into Electronic Health Record (EHR)-based decision support tools to facilitate personalized adjuvant therapy intensity and surveillance intervals. 3) Future research should explore the molecular landscape (e.g., consensus molecular subtype, tumor budding, and immune microenvironment) that underlies aggressive TD biology and should test whether TD-directed neoadjuvant therapy or anti-angiogenic agents can improve outcomes in this newly defined M1a-equivalent population.
5 Limitation
A number of limitations must also be considered. First, despite the huge sample size, given that this is a retrospective study, the patient selection strategy may be biased. Furthermore, using information from a public transparency database from the United States, we tested the nomogram in the preliminary study by allocating eligible cases randomly to the training and validation cohorts. More validation in an independent prospective cohort based on a distinct demographic is still needed before the study is expanded. In addition, the SEER database just records the number of TDs; however, there are no statistics on the parameters that may raise the weight of prognosis, such as size, location, and shape, which should be investigated further in future studies. Moreover, because the SEER database lacks extensive information about detailed chemotherapy regimen (e.g., FOLFOX vs. CAPOX, dosing intensity, or treatment duration) or molecular markers or some important clinical signs like smoking, evaluating their effects is difficult. These elements can potentially affect how well the nomograms work. In light of this, it may be possible to improve the nomogram’s prognostication capabilities in further studies by taking these parameters into account.
6 Conclusion
In conclusion, TDs have significant predictive significance in CRC and should not be simply equated with LNMs. The revised TNM staging using TD counts as a stratification criterion predicts survival more accurately than the current staging. CRC patients with more than 10 LNMs or three TDs have a level of malignancy comparable to the existence of distant metastases. The dynamic nomogram could assist medical practitioners in diagnosing, providing prognoses, and optimizing treatment strategies more quickly and effectively.
Data availability statement
The original contributions presented in the study are included in the article/supplementary material. Further inquiries can be directed to the corresponding author.
Ethics statement
Study approval was obtained from the ethics committee of Hebei General Hospital.
Author contributions
LZ: Writing – original draft, Conceptualization, Data curation, Formal analysis, Investigation, Methodology, Software, Validation, Visualization. YM: Data curation, Writing – original draft. JD: Formal analysis, Writing – original draft. JC: Writing – review & editing.
Funding
The author(s) declare financial support was received for the research and/or publication of this article. This research was funded by Hebei Government Special Funds for Top-Talents (item number: 2019-2024), and Central funds for guiding local technological development (item number: 246Z2406G).
Acknowledgments
We acknowledge the efforts of the Surveillance, Epidemiology, and End Results (SEER) Program tumor registries for creating the SEER database (https://seer.cancer.gov/).
Conflict of interest
Author JC was employed by the company Yetem Biotech Corp. Ltd.
The remaining authors declare that the research was conducted in the absence of any commercial or financial relationships that could be construed as a potential conflict of interest.
Generative AI statement
The author(s) declare that no Generative AI was used in the creation of this manuscript.
Any alternative text (alt text) provided alongside figures in this article has been generated by Frontiers with the support of artificial intelligence and reasonable efforts have been made to ensure accuracy, including review by the authors wherever possible. If you identify any issues, please contact us.
Publisher’s note
All claims expressed in this article are solely those of the authors and do not necessarily represent those of their affiliated organizations, or those of the publisher, the editors and the reviewers. Any product that may be evaluated in this article, or claim that may be made by its manufacturer, is not guaranteed or endorsed by the publisher.
Abbreviations
CRC, colorectal cancer; AJCC, American Joint Committee on Cancer; TD, tumor deposit; LNM, lymph node metastasis; OS, overall survival; DFS, disease-free survival; SEER, The Surveillance, Epidemiology, and End Results; HR, hazard ratio; ROC, receiver operating characteristic; AUC, area under the curve; CEA, carcinoembryonic antigen; AIC, Akaike information criterion; CI, confidence interval.
References
1. Stone P, Buckle P, Dolan R, Feliu J, Hui D, Laird BJA, et al. Prognostic evaluation in patients with advanced cancer in the last months of life: ESMO Clinical Practice Guideline. ESMO Open. (2023) 8:101195. doi: 10.1016/j.esmoop.2023.101195
2. El-Mesallamy HO, Hamdy NM, Zaghloul AS, and Sallam AM. Serum retinol binding protein-4 and neutrophil gelatinase-associated lipocalin are interrelated in pancreatic cancer patients. Scand J Clin Lab Invest. (2012) 72:602–7. doi: 10.3109/00365513.2012.723135
3. Rizk NI, Kassem DH, Abulsoud AI, AbdelHalim S, Yasser MB, Kamal MM, et al. Revealing the role of serum exosomal novel long non-coding RNA NAMPT-AS as a promising diagnostic/prognostic biomarker in colorectal cancer patients. Life Sci. (2024) 352:122850. doi: 10.1016/j.lfs.2024.122850
4. Ueno H, Nagtegaal ID, Quirke P, Sugihara K, and Ajioka Y. Tumor deposits in colorectal cancer: Refining their definition in the TNM system. Ann Gastroenterol Surg. (2023) 7:225–35. doi: 10.1002/ags3.12652
5. Delattre JF, Selcen Oguz Erdogan A, Cohen R, Shi Q, Emile JF, Taieb J, et al. A comprehensive overview of tumour deposits in colorectal cancer: Towards a next TNM classification. Cancer Treat Rev. (2022) 103:102325. doi: 10.1016/j.ctrv.2021.102325
6. Hamdy NM, Zaki MB, Rizk NI, Abdelmaksoud NM, Abd-Elmawla MA, Ismail RA, et al. Unraveling the ncRNA landscape that governs colorectal cancer: A roadmap to personalized therapeutics. Life Sci. (2024) 354:122946. doi: 10.1016/j.lfs.2024.122946
7. Weiser MR. AJCC 8th edition: colorectal cancer. Ann Surg Oncol. (2018) 25:1454–5. doi: 10.1245/s10434-018-6462-1
8. Amin MB, Greene FL, Edge SB, Compton CC, Gershenwald JE, Brookland RK, et al. The Eighth Edition AJCC Cancer Staging Manual: Continuing to build a bridge from a population-based to a more “personalized” approach to cancer staging. CA Cancer J Clin. (2017) 67:93–9. doi: 10.3322/caac.21388
9. Zhang YC, Li M, Jin YM, Xu JX, Huang CC, and Song B. Radiomics for differentiating tumor deposits from lymph node metastasis in rectal cancer. World J Gastroenterol. (2022) 28:3960–70. doi: 10.3748/wjg.v28.i29.3960
10. Zheng P, Chen Q, Li J, Jin C, Kang L, and Chen D. Prognostic significance of tumor deposits in patients with stage III colon cancer: A nomogram study. J Surg Res. (2020) 245:475–82. doi: 10.1016/j.jss.2019.07.099
11. Khan H, Radomski SN, Siddiqi A, Zhou N, Paneitz DC, Johnston FM, et al. Tumor deposits are associated with a higher risk of peritoneal disease in non-metastatic colorectal cancer patients. J Surg Oncol. (2023) 127:975–82. doi: 10.1002/jso.27207
12. Lundstrom S, Agger E, Lydrup ML, Jorgren F, and Buchwald P. Tumour deposit count is an independent prognostic factor in colorectal cancer-a population-based cohort study. Br J Surg. (2024) 112. doi: 10.1093/bjs/znae309
13. Jorgren F, Agger E, Lydrup ML, and Buchwald P. Tumour deposits in colon cancer predict recurrence and reduced survival in a nationwide population-based study. BJS Open. (2023) 7. doi: 10.1093/bjsopen/zrad122
14. Shi X, Lu L, Wang Z, Dai Y, Hu S, Wu Z, et al. The potential role of tumor deposits in the prognosis and TNM staging for colorectal cancer. J Gastrointest Oncol. (2024) 15:2473–95. doi: 10.21037/jgo-24-786
15. Ma T, Qin Z, Xu G, Zheng PW, Feng L, Ma D, et al. Negative prognostic impact of tumor deposits in stage III colorectal cancer patients. PloS One. (2024) 19:e0310327. doi: 10.1371/journal.pone.0310327
16. Brouwer NPM, van Vliet S, IntHout J, De Wilt JHW, Simmer F, Hugen N, et al. Tumour deposits are associated with worse survival than extranodal extension; a network meta-analysis on tumour nodules in colorectal cancer. Histopathology. (2024) 86(4):485–96. doi: 10.1111/his.15301
17. Shi M, Zhang H, Yao G, Wu J, Zhu C, Zhang X, et al. The role of tumor deposits in predicting the efficacy of chemotherapy in stage III colon cancer. Front Oncol. (2020) 10:586603. doi: 10.3389/fonc.2020.586603
18. Pyo DH, Kim SH, Ha SY, Yun SH, Cho YB, Huh JW, et al. Revised nodal staging integrating tumor deposit counts with positive lymph nodes in patients with stage III colon cancer. Ann Surg. (2023) 277:e825–31. doi: 10.1097/SLA.0000000000005355
19. Wang S, Guan X, Ma M, Zhuang M, Ma T, Liu Z, et al. Reconsidering the prognostic significance of tumour deposit count in the TNM staging system for colorectal cancer. Sci Rep. (2020) 10:89. doi: 10.1038/s41598-019-57041-2
20. Nagtegaal ID, Knijn N, Hugen N, Marshall HC, Sugihara K, Tot T, et al. Tumor deposits in colorectal cancer: improving the value of modern staging-A systematic review and meta-analysis. J Clin Oncol. (2017) 35:1119–27. doi: 10.1200/JCO.2016.68.9091
21. Lord AC, D’Souza N, Pucher PH, Moran BJ, Abulafi AM, Wotherspoon A, et al. Significance of extranodal tumour deposits in colorectal cancer: A systematic review and meta-analysis. Eur J Cancer. (2017) 82:92–102. doi: 10.1016/j.ejca.2017.05.027
22. Basnet S, Lou QF, Liu N, Rana R, Shah A, Khadka M, et al. Tumor deposit is an independent prognostic indicator in patients who underwent radical resection for colorectal cancer. J Cancer. (2018) 9:3979–85. doi: 10.7150/jca.27475
23. Nagayoshi K, Ueki T, Nishioka Y, Manabe T, Mizuuchi Y, Hirahashi M, et al. Tumor deposit is a poor prognostic indicator for patients who have stage II and III colorectal cancer with fewer than 4 lymph node metastases but not for those with 4 or more. Dis Colon Rectum. (2014) 57:467–74. doi: 10.1097/DCR.0000000000000059
24. Belt EJ, van Stijn MF, Bril H, de Lange-de Klerk ES, Meijer GA, Meijer S, et al. Lymph node negative colorectal cancers with isolated tumor deposits should be classified and treated as stage III. Ann Surg Oncol. (2010) 17:3203–11. doi: 10.1245/s10434-010-1152-7
25. Zheng K, Zheng N, Xin C, Zhou L, Sun G, Wen R, et al. The prognostic significance of tumor deposit count for colorectal cancer patients after radical surgery. Gastroenterol Res Pract. (2020) 2020:2052561. doi: 10.1155/2020/2052561
26. Chen J, Zhang Z, Ni J, Sun J, Ren W, Shen Y, et al. Predictive and prognostic assessment models for tumor deposit in colorectal cancer patients with no distant metastasis. Front Oncol. (2022) 12:809277. doi: 10.3389/fonc.2022.809277
27. Li J, Yang S, Hu J, Liu H, Du F, Yin J, et al. Tumor deposits counted as positive lymph nodes in TNM staging for advanced colorectal cancer: a retrospective multicenter study. Oncotarget. (2016) 7:18269–79. doi: 10.18632/oncotarget.7756
28. Takamatsu M, Yamamoto N, Kawachi H, Nakano K, Saito S, Fukunaga Y, et al. Prediction of lymph node metastasis in early colorectal cancer based on histologic images by artificial intelligence. Sci Rep. (2022) 12:2963. doi: 10.1038/s41598-022-07038-1
29. Kim HJ and Choi GS. Clinical implications of lymph node metastasis in colorectal cancer: current status and future perspectives. Ann Coloproctol. (2019) 35:109–17. doi: 10.3393/ac.2019.06.12
30. Scolyer RA, Rawson RV, Gershenwald JE, Ferguson PM, and Prieto VG. Melanoma pathology reporting and staging. Mod Pathol. (2020) 33:15–24. doi: 10.1038/s41379-019-0402-x
31. Cabalag CS, Chan ST, Kaneko Y, and Duong CP. A systematic review and meta-analysis of gastric cancer treatment in patients with positive peritoneal cytology. Gastric Cancer. (2015) 18:11–22. doi: 10.1007/s10120-014-0388-5
32. Puppa G, Sonzogni A, Colombari R, and Pelosi G. TNM staging system of colorectal carcinoma: a critical appraisal of challenging issues. Arch Pathol Lab Med. (2010) 134:837–52. doi: 10.5858/134.6.837
33. Chen K, Collins G, Wang H, and Toh JWT. Pathological features and prognostication in colorectal cancer. Curr Oncol. (2021) 28:5356–83. doi: 10.3390/curroncol28060447
34. Pei JP, Zhang CD, Liang Y, Zhang C, Wu KZ, Zhao ZM, et al. Novel nomograms individually predicting overall survival of non-metastatic colon cancer patients. Front Oncol. (2020) 10:733. doi: 10.3389/fonc.2020.00733
Keywords: colorectal cancer, tumor deposit, SEER, TNM, nomogram
Citation: Zhang L, Ma Y, Dong J and Cai J (2025) Utilizing tumor deposit count as a stratification criterion in revising TNM staging system for patients with colorectal cancer: a nomogram review study. Front. Oncol. 15:1605030. doi: 10.3389/fonc.2025.1605030
Received: 02 April 2025; Accepted: 28 July 2025;
Published: 25 August 2025.
Edited by:
David Gibbons, St. Vincent’s University Hospital, IrelandReviewed by:
Nadia M. Hamdy, Ain Shams University, EgyptYoutao Lu, University of Pennsylvania, United States
Copyright © 2025 Zhang, Ma, Dong and Cai. This is an open-access article distributed under the terms of the Creative Commons Attribution License (CC BY). The use, distribution or reproduction in other forums is permitted, provided the original author(s) and the copyright owner(s) are credited and that the original publication in this journal is cited, in accordance with accepted academic practice. No use, distribution or reproduction is permitted which does not comply with these terms.
*Correspondence: Jianhui Cai, OTAwMzAyNDZAaGVibXUuZWR1LmNu
†ORCID: Jianhui Cai, orcid.org/0009-0002-3188-7786