 Nan Xu1†
 Juan Tao
 Shaowu Wang
- 1Department of Radiology, Second Affiliated Hospital of Dalian Medical University, Dalian, China
- 2Department of Pathology, Second Affiliated Hospital of Dalian Medical University, Dalian, China
- 3Department of Radiology, Inner Mongolia Autonomous Region Hospital of Traditional Chinese Medicine, Hohhot, China
Objective: To investigate an in vivo biopsy method based on CT-MRI fusion image registration and evaluate its value for improving the accuracy of preoperative core needle biopsies(CNBs) histological grading in soft tissue sarcoma (STS)and determining the correlation between multiparametric MRI(mp MRI) and both STS French Federation of Cancer Center (FNCLCC) grading and the Ki-67 labeling index (LI).
Methods: 32 STS patients were enrolled prospectively and underwent 3.0T MRI, Diffusion weighted imaging(DWI) and Hydrogen proton magnetic resonance spectroscopy (1H MRS) examination, then underwent a preoperative CT guided CNBs that was confirmed by subsequent surgery. We used a novel image fusion registration method to ensure the biopsy sampling point was located in a high cell density area and the MRI-Region of Interest (ROI) was compatible with the biopsy specimen. We evaluated the accuracy of biopsy pathology diagnoses compared to that of surgery, and compared the mp MRI parameters between FNCLCC low- and high-grade/Ki67 low- and high-expression groups. The statistical analyses included the intraclass correlation coefficient(ICC), the Wilcoxon rank-sum test, Receiver Operating Characteristic (ROC) curves, and Spearman’s rank correlation.
Result: The pathological diagnosis accuracy of the biopsy specimens was 100%, the subtype diagnosis accuracy was 87.5%, while the grading diagnosis accuracy was 93.8% compared with that of the surgical specimens. The FNCLCC high-grade group and Ki67 high-expression group had lower Apparent diffusion coefficient(ADC) values and higher Cholin/Creatin (Cho/Cr) ratios. The area under the curve(AUC) of ADCmin, ADCmean values and Cho/Cr ratios to discriminate between low- and high-grade groups were 0.956,0.969,0.917, low and high expression groups were 0.929,0.957,0.943; The ADC values of STSs correlated negatively while the Cho/Cr ratios correlated positively with FNCLCC grading (r=-0.782,-0.814, 0.758,p<0.001) and Ki-67 LI (r=-0.853, -0.902,0.710,p<0.001).
Conclusion: The CT-MRI fusion image registration method may improve the accuracy of pre treatment STS CNBs pathology diagnoses and can be used for precise imaging-pathology control studies. ADC values and Cho/Cr ratios may therefore serve as a valuable supplement to STS histopathological grading and correlate with Ki67 expression.
Introduction
STSs are a group of malignant tumors among soft tissue tumors with invasive or metastatic characteristics and exhibit high heterogeneity and diverse histological subtypes. Therefore, it is crucial to identify the histological subtype and pathological grade of STSs before treatment (1, 2). For low-grade sarcomas in the localized stage, surgical resection can be considered as a treatment option, while for high-grade sarcomas, neoadjuvant therapy is often recommended before surgery. Histological grading of STS is based on the FNCLCC system, which includes tumor characteristics such as mitotic rate, degree of differentiation, and necrosis. In addition, the Ki-67 index, as an independent prognostic factor for tumor prognosis (3), is also one of the key pathological markers that clinicians focus on before initiating STS treatment.
The diagnosis of STS prior to treatment is conducted primarily through biopsy. With the application of coaxial needles, the risk of needle tract seeding metastasis has been reduced significantly (4). However, compared to surgical specimens, the histological subtype and grading diagnosis of CNB specimens is not always accurate, with studies showing that the consistency of grading between pre-treatment CNBs and surgical resection specimens were from 32% to 87% (5, 6). The most likely reason for the low accuracy of biopsies is the high heterogeneity of STS tumors. Biopsy specimens may not accurately reflect all tumor information due to the poor resolution of soft tissue images guided by ultrasound or CT.
MRI is widely established as the preferred imaging modality for evaluating qualitative and quantitative features of STS. Qualitative MRI features, including peritumoral enhancement, T2-weighted image (T2WI) signal heterogeneity and necrotic area demonstrate significant correlation with FNCLCC grade (7–9). Serving as critical components of Imaging Cognitive Fusion methodology, these characteristics helps planning needle trajectories and puncture sites during Image guided CNBs (10). However, the correlation between qualitative MRI features of STS and histological grading faces significant influence from subjective factors, notably the interpreting radiologist’s image analysis proficiency and clinical expertise.
Several studies used quantitative parameters of functional MRI to evaluate the benignity/malignancy, histological grading, and expression of pathological markers in STS (11–15). However, determining the extent to which imaging reflects pathological changes, most research methods directly compare the imaging features of tumors with the results of their histological or cytological pathological tests. However, this is not an accurate match between the ROI of the image and the pathological sampling point and may lead to deviations in the pathological interpretation of the image.
Yuan et al. (16) established a nude mouse model of rhabdomyosarcoma and evaluated the relationship between fMRI quantitative parameters and pathological indicators of rhabdomyosarcoma using a new and precise method to compare imaging pathology. They showed that DWI and intravoxel incoherent motion (IVIM) parameters were helpful for accurately evaluating Ki-67 expression levels. Subsequently, they applied this method to clinical research and investigated the accuracy of the Dynamic contrast enhanced Magnetic resonance imaging (DCE-MRI), IVIM, and Diffusion kurtosis imaging (DKI) parameters to predict STS pathological grading and Ki-67 expression. That study further confirmed the method achieved an accurate comparison between imaging and surgical specimen pathology of superficial soft tissue masses in limbs (17–20). However, this method is only applicable to surgical specimens, whereas a considerable number of sarcoma patients have lost the opportunity for surgery or require neoadjuvant therapy before undergoing surgery. This group of patients therefore require a method for comparing imaging and pathology using biopsy specimens in order to improve the accuracy of biopsies and also precise comparative studies between imaging features and pathological indicators of biopsy specimens.
This study used a novel image registration method based on in vivo CNBs that involved enhanced MRI and DWI to select and label the CNBs target slice, thereby enabling surgeons to puncture the lesion area with cellular activity. The MRI image of the target slice is then fused and registered with the CT image of the needle tip slice to delineate the ROI, thereby achieving accurate matching and comparison of “MRI ROI pathology sampling points”. The study also included a preliminarily investigation of the correlation between mp MRI parameters and pathological markers.
Materials and methods
The local institutional ethics board approved the prospective study design(Consent Letter Number: 2022053 and KY2025-69-01). Informed consent was obtained from all the patients.
Patients
From June 2022 to October 2024, 115 patients suspected of having a STS underwent enhanced MRI and DWI examinations, followed immediately by CT guided core needle biopsies (CNBs). A total of 32 cases were included and 83 cases were excluded. The exclusion criteria were: (1) Inadequate MRI image quality(n=8); (2) history of treatment or recurrence before the MR examination(n=10); (3) >7 days interval between surgery and the MRI/CNBs (n=9); (4) failed CT-MRI fusion registration (n=4); (5) well-differentiated liposarcoma(as the adipose tissue components demonstrate signal suppression on DWI, which precludes accurate measurement of ADCvalues) (n=13); and (6) an equivocal pathological result (n=6). The flow chart of the study is shown in Figure 1.
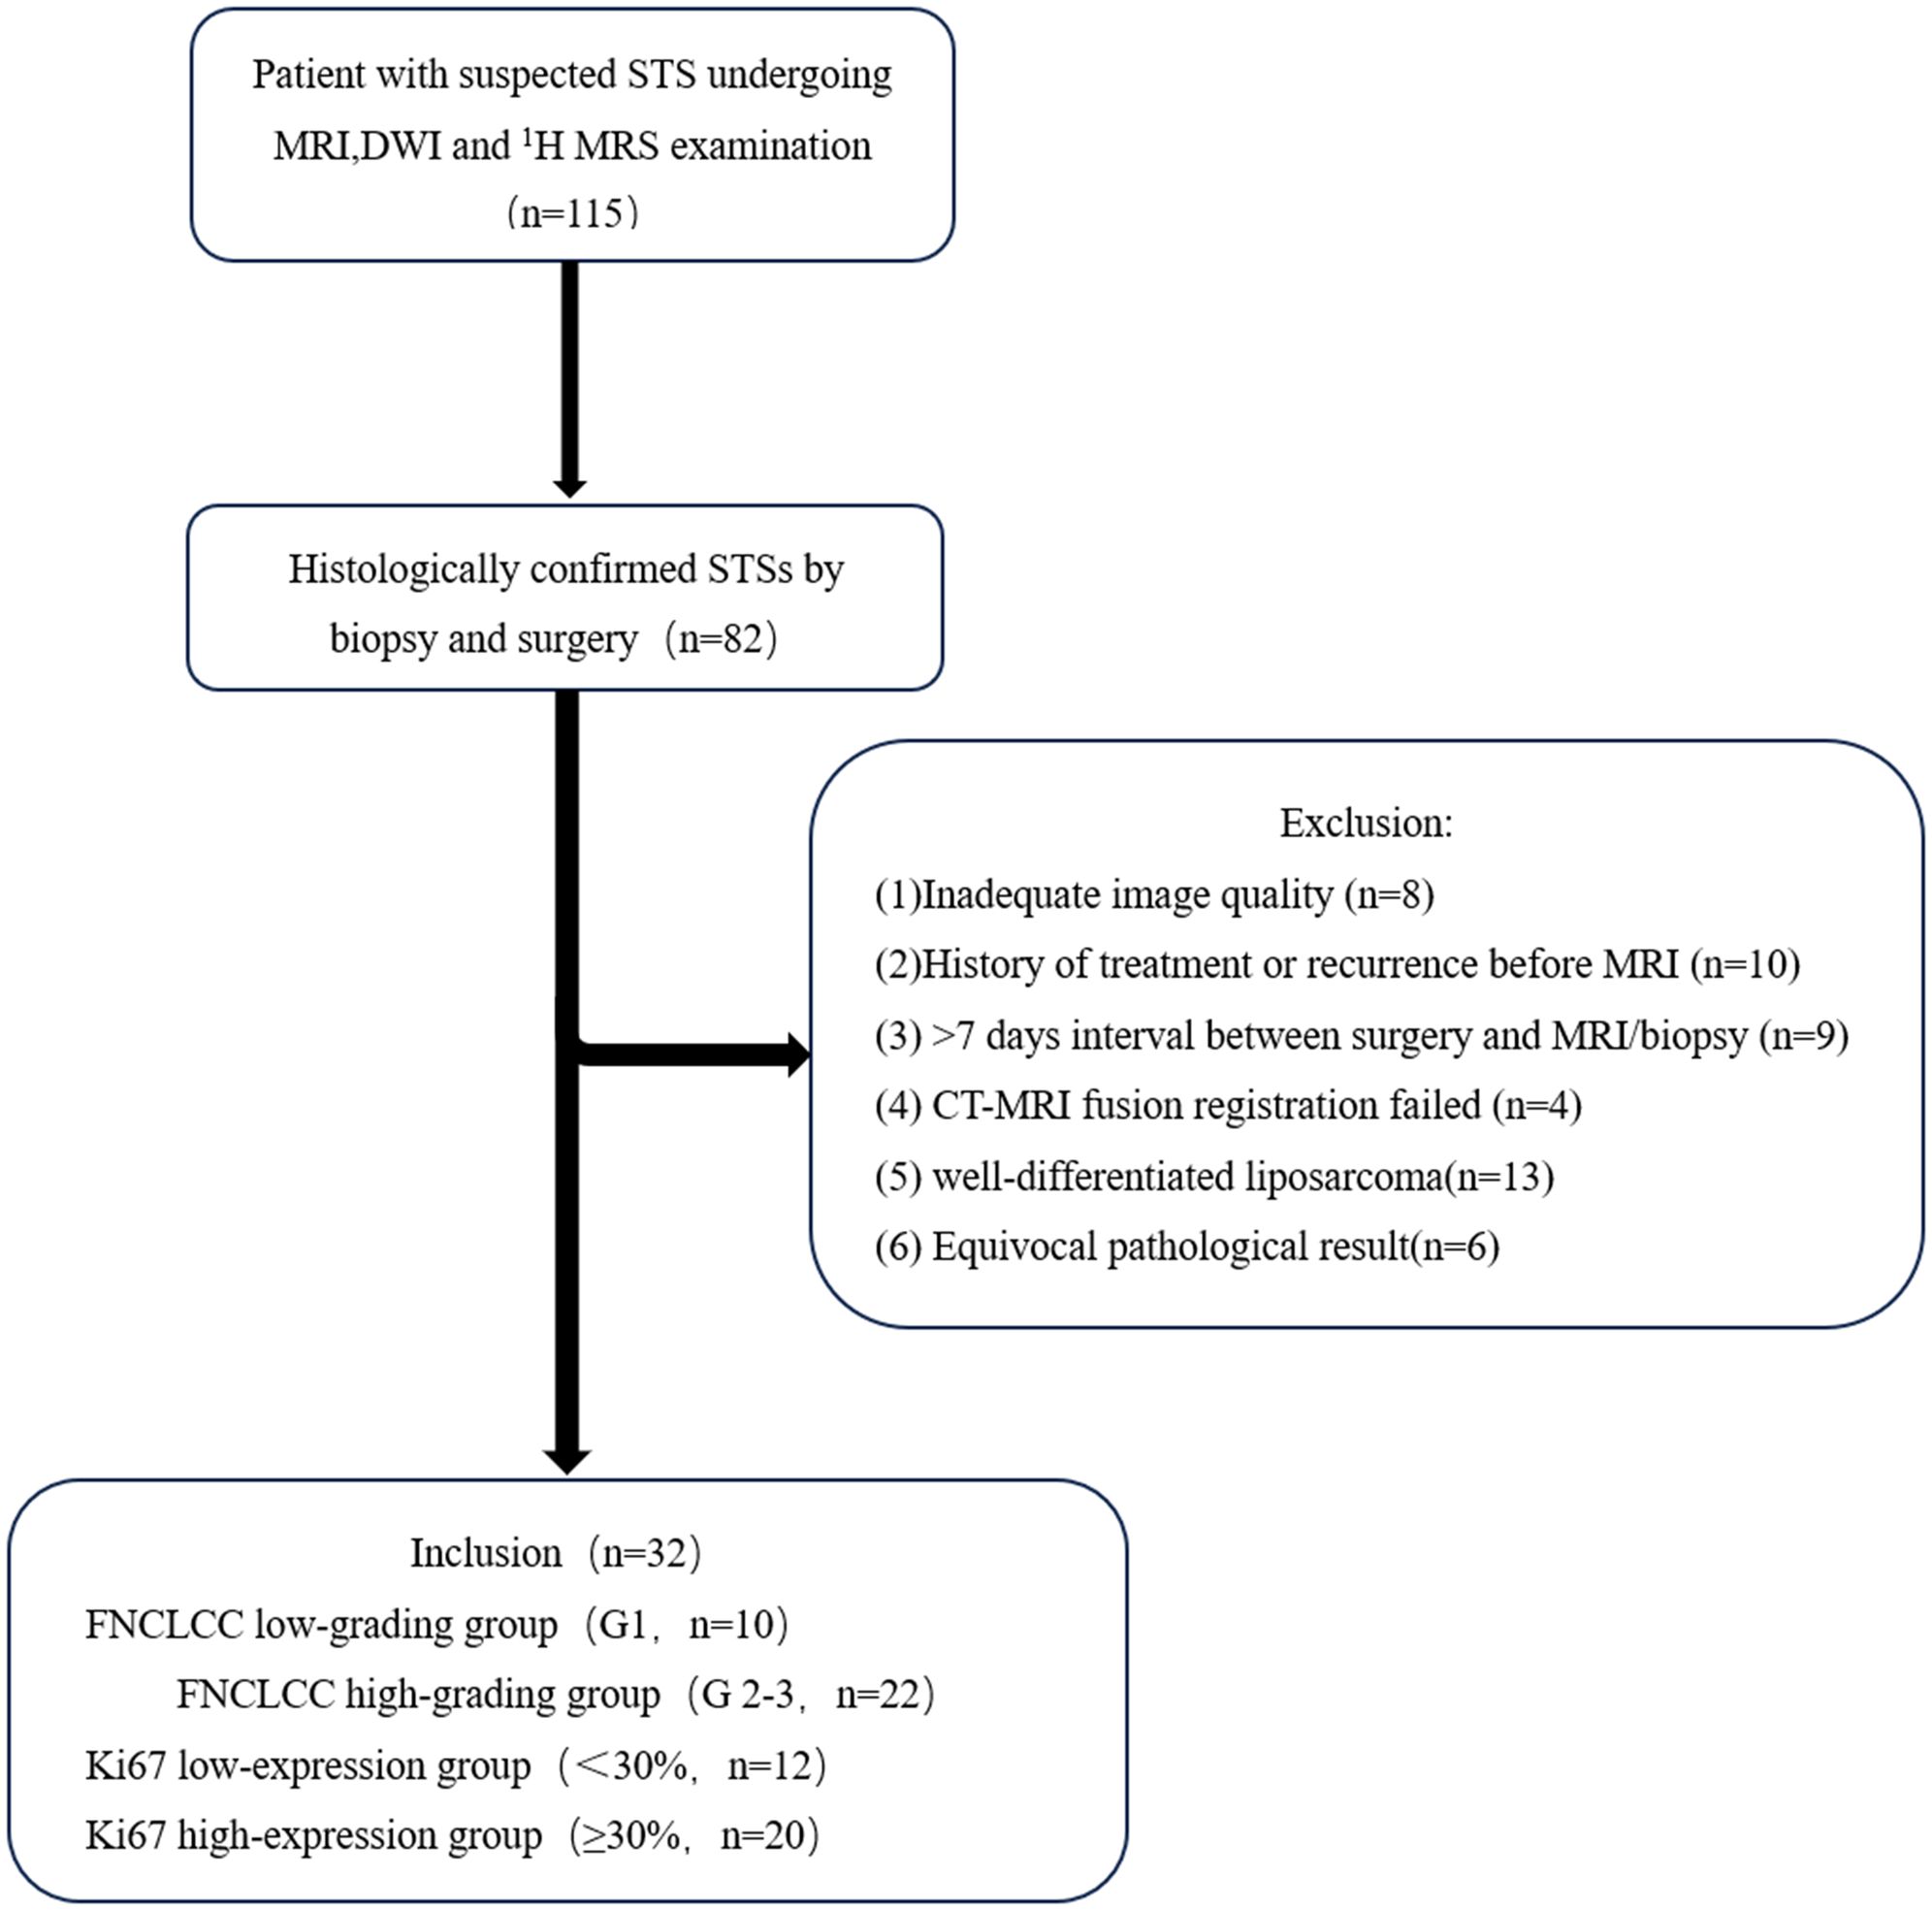
Figure 1. Study flowchart.
Imaging data
All the MRI examinations were performed on a 3.0T scanner (Discovery MR750w, GE Healthcare) with a 16-channel phased array body coil depending on the tumor location, equipped with an ADW4.6 workstation and Functool software. A conventional MRI was performed using a fast spin-echo sequence, including T1-weighted imaging (T1WI) Axial, T1WI fat suppressed (T1WI-FS)Axial, T2WI Axial, T2WI fat suppressed (T2WI-FS)Axial, T1WI-FS Axial C+,DWI and 1H MRS. DWI was performed before the enhancement scan, using a spin-echo echo-planar imaging (SE-EPI) sequence with the following parameters: repetition time (TR)=3000–3711 ms, echo time (TE)=68–70 ms, and matrix size=256 × 224. The field of view (FOV), slice thickness, and slice spacing were matched to those of the axial T2-weighted imaging (T2WI) sequence. DWI was obtained with diffusion sensitivity coefficients (b-values) of 0 and 800 s/mm², and the number of excitations (NEX) was set to 4. 1H MRS was performed after DWI examination, using a PROBE-P sequence and multi voxel imaging scan with the following parameters: TR=1000ms, TE=144ms, matrix size=128×128,and NEX=1.Saturation bands were employed to shield interfering signals such as water, bone, blood vessels, and nerves around the lesion, with a voxel size of 2 × 2 × 2 mm. CT-guided CNB was performed on a 64-slice CT scanner(Siemens Sensation) after DWI examination with the following parameters: tube voltage=120kV, tube current=200mAs, pitch=0.9mm, rotation time=0.6s, and matrix size=512 × 512.Other CT scan data (position, FOV, slice thickness, and slice gap) were completely consistent with the MRI scan data.
All the MRI raw images were processed using the Advantage Workstation (ADW 4.7, GE Healthcare) software to generate corresponding pseudo-color images and measure the quantitative parameters. ROI selection: two radiologists (10 years of CNBs experience and 12 years of musculo-skeletal imaging experience, respectively) blinded to the patients’ histopathological results independently placed ROI on the CT-MRI fusion image. A 2D rectangular ROI measuring 2cm×0.2cm was positioned anterior to the needle tip, aligned with the puncture trajectory to approximate the shape of the biopsy specimen. For statistical analysis, the mean values of ROI measurements were utilized.
CT-MRI image fusion registration method
We evaluated the CT-MRI image fusion registration method based on an in vivo CT-guided percutaneous CNB, with the aim of establishing a MRI-pathology control. This method is described in Figure 2.
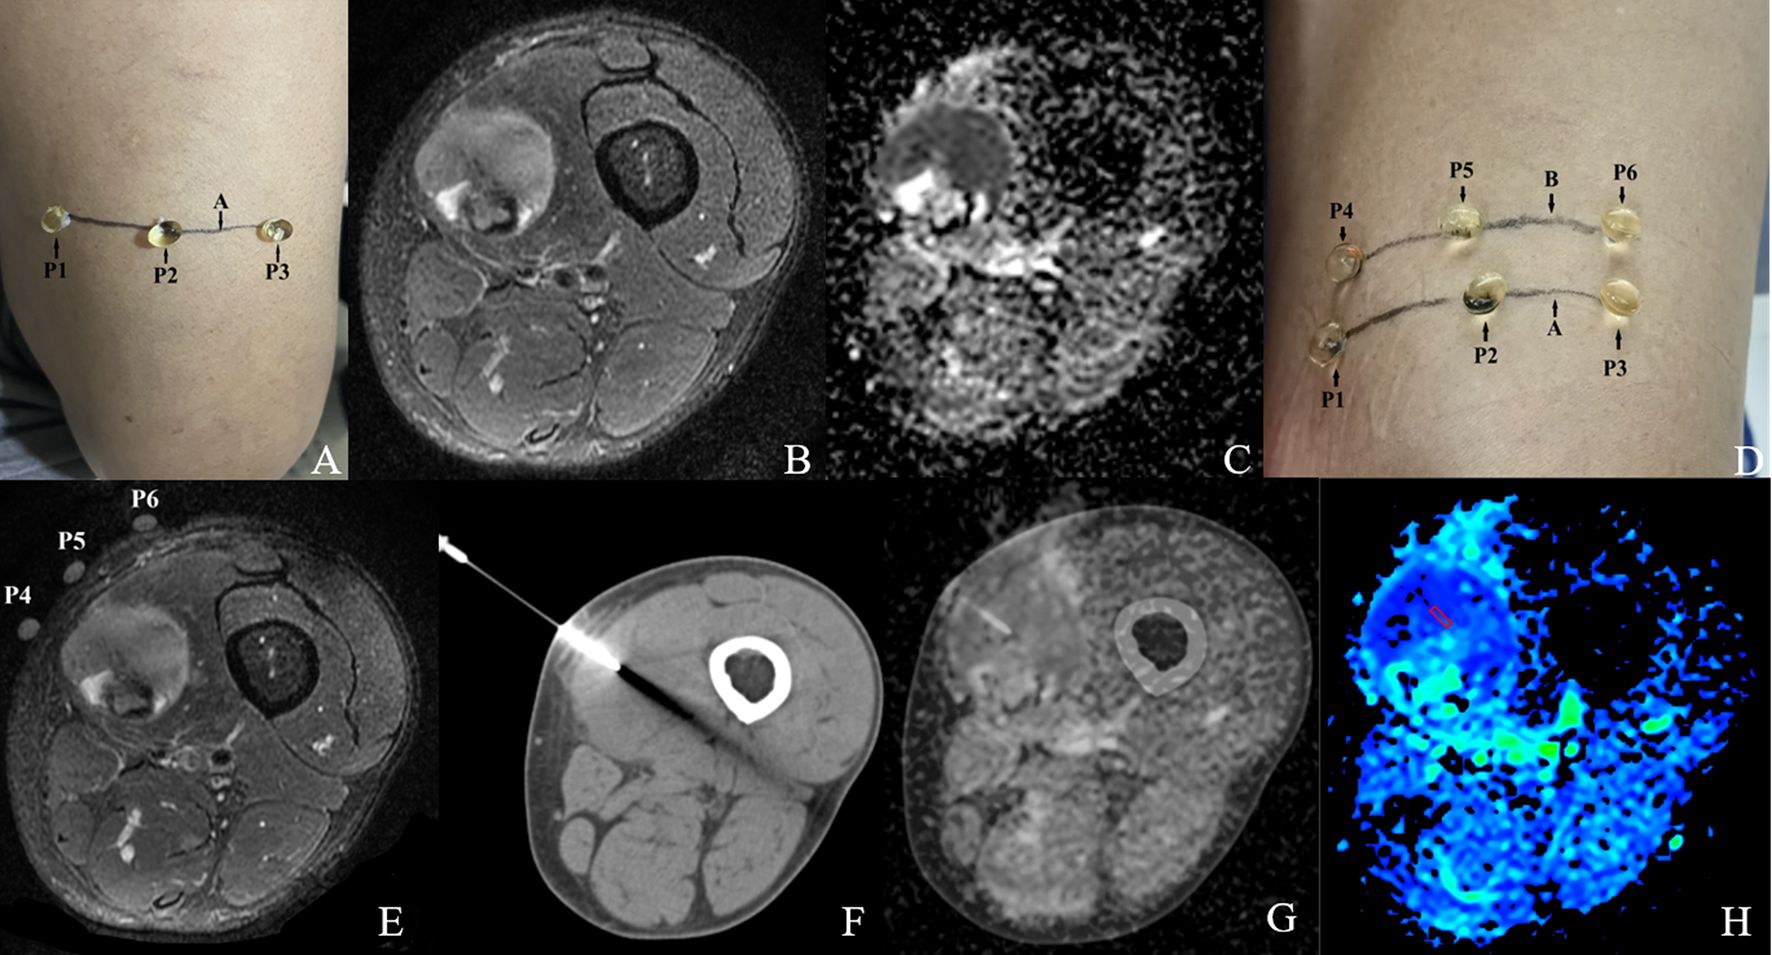
Figure 2. CT-MRI image fusion registration method.
Step 1: Before MRI scanning, the general location of the tumor lesion was determined by ultrasound or palpation, and a horizontal line A drawn over the mass at the most palpable site. Three vitamin D capsule markers were positioned on line A as P1, P2 and P3 (Figure 2A).
Step 2: The 3.0 T MRI scanning protocol included T2WI-FS and DWI sequences. The patient’s position, FOV value, slice thickness, and slice gap were recorded (lesion with a head-to-foot size <5 cm; slice thickness 3 mm, slice gap 1 mm; lesion with a head-to-foot size ≥5 cm; slice thickness 5 mm, slice gap 1 mm) (Figures 2B, C).
Step 3: The slice with a large area of hyperintensity on T2WI-FS, hyperintensity on DWI while hypointensity on ADC was selected jointly as the target slice by the two radiologists mentioned earlier. This was calculated as the distance S between the capsule slice and the target slice (S= (slice thickness + slice gap)×slice number). A horizontal line B was then drawn over the mass using data S to mark the target slice. Another three vitamin D capsules markers were positioned on line B as P4, P5, and P6. A further MRI scan was performed to confirm whether the capsule (P4-6) slice overlapped with the target slice. Once consistency was confirmed we completed all the MRI scans. If the signal characteristics of the capsule (P1-3) slice matched that of the target slice there was no need to draw line B or carry out a repeat scan (Figures 2D, E).
Step 4: CT-guided CNB was performed immediately after the MRI scan using a 15-gauge Coaxial needle with a 16-gauge biopsy needle(0.16cm diameter). The CT scan data (position, FOV, slice thickness, and slice gap) were completely consistent with the MRI scan data. The puncture point was selected at the line B level of the body surface, (i.e. the target slice) so that the coaxial needle was perpendicular to line B and inserted into the target slice of the lesion. After confirming the position, the biopsy specimen (size 2×0.2 cm) was obtained (Figure 2F).
Step 5: The MR image of the target slice and the CT image of the needle tip were processed using the Advantage Workstation (Syngo.via, Siemens) for Auto Calibration and fusion (21). Markers such as capsules P4-6, bones, and blood vessels were used for manual fusion if the automatic fusion was not satisfactory. The two radiologists mentioned earlier jointly evaluated the quality of the fused image. The ROI selection method was as mentioned above (Figures 2G, H).
Pathological analysis
In accordance with the 2020 WHO classification of STS, the histopathologic results of all the biopsy specimens and surgical specimens were diagnosed independently by two pathologists with over 10 years of experience in musculo-skeletal pathology who were blinded to the clinical and imaging data. Similar to previous publications, grade II/III STSs were classified as high-grade STS and grade I STS as low-grade STS (18, 22). Ki-67 positivity was determined when the nuclei displayed brown-yellow coloration. Only the areas with the highest number of positive cells (hot spots) were analyzed. Ki-67LI was evaluated using the percentage of positive cells from 1000 tumor cells (× 400). The Ki-67 levels were divided into low (< 30%) and high (≥ 30%) Ki-67 expression groups (20).
Statistical analysis
All the data were analyzed using SPSS 24.0 (IBM). The Shapiro-Wilk test was employed to assess the normality of all continuous variable data. Data conforming to a normal distribution were presented as mean ± standard deviation, while non-normally distributed data were expressed as median (P25, P75). Inter-reader reliability between the two observers was evaluated using the intraclass correlation coefficient (ICC), with an ICC value >0.75 indicating good agreement. The independent samples t-tests or Wilcoxon rank-sum tests were used to detect differences in the ADC and 1H MRS parameters between the FNCLCC low and high graded groups and Ki-67 low and high expression groups in the STSs. Spearman’s rank correlation was used to analyze the association between ADC and 1H MRS parameters, FNCLCC grading, and Ki-67LI. A receiver operating characteristic (ROC) curve was prepared for each parameter, with the area under the curve (AUC) analyzed to evaluate diagnostic performance. The optimal diagnostic cut-off value and corresponding sensitivity and specificity were obtained according to the Youden index for each parameter and Ki-67 LI. A p value < 0.05 was considered statistically significant.
Results
Patient characteristics and CNBs pathological diagnoses
Of the 32 patients, 18 were males and 14 were females with a mean age of 53.67 ± 3.81 years. The lesions were located in 12 upper limbs, 16 lower limbs, and 4 in the trunk, with a maximum diameter of 6.2 ± 2.5 cm. We additionally quantified the MRI scanning duration during the second stage of CT-MRI image registration, recording an average scan time of 7 minutes 32 seconds ±46 seconds. This represents a moderate temporal increase compared to conventional MRI protocols. Based on the results of the pathological diagnoses of the surgical specimens, all 32 CNBs pathological diagnoses were sarcomas (accuracy rate, 100%). 28 pathological subtypes matched the surgical specimens, while 2 subtypes were not diagnosed (both myxoid sarcomas) and 2 subtypes were diagnosed incorrectly (accuracy rate, 87.5%). In terms of grading; low/high grade (8/24) were diagnosed by CNBs and low/high grade (10/22) were diagnosed by surgery (accuracy rate, 93.8%). For Ki-67 LI, 12 patients were classified in the low expression group and 20 patients in the high expression group. The histological subtypes, FNCLCC grading, and Ki-67 expression results of all the patients are shown in Table 1.

Table 1. The histological subtypes, FNCLCC grading, and Ki67 expression results.
Correlation of DWI,1H MRS parameters and FNCLCC grading, Ki67 LI in the biopsy specimens
As shown in Tables 2, The Ki-67 LI and Cho/Cr values of all 32 patients followed a normal distribution, while both ADCmin and ADCmean values exhibited non-normal distribution patterns. The interobserver agreement analysis revealed excellent reproducibility, with ICC ranging from 0.604 to 0.968.
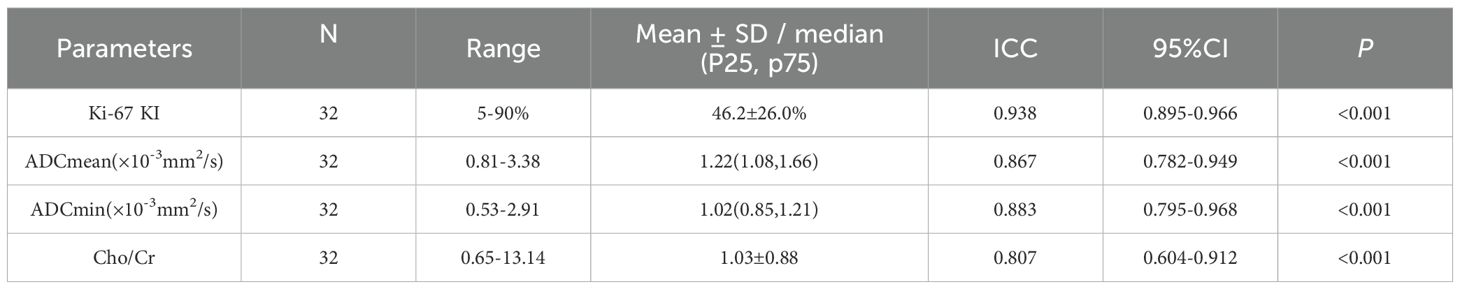
Table 2. Measurements of Ki-67 LI and MRI parameters and inter-reader ICC.
As shown in Tables 3, 4 and Figure 3, the values of ADCmin and ADCmean were significantly lower, while the Cho/Cr ratios were higher in the FNCLCC high grade and Ki67 high expression groups, compared to those in the low grade and low expression groups. ADCmin, ADCmean values correlated negatively, while Cho/Cr ratios correlated positively with FNCLCC Grading and Ki-67 LI; correlation coefficients were −0.782,−0.814,0.758 and−0.853,-0.902,0.710,respectively (p < 0.001),with the correlation with ADCmean values being stronger.
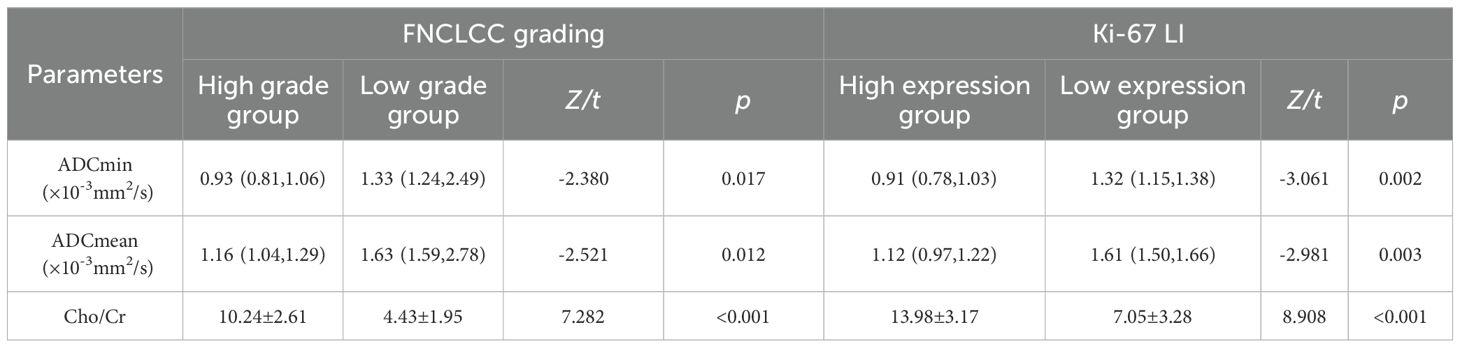
Table 3. Comparison of DWI and 1H MRS parameters of STSs in FNCLCC grading and Ki-67 LI.
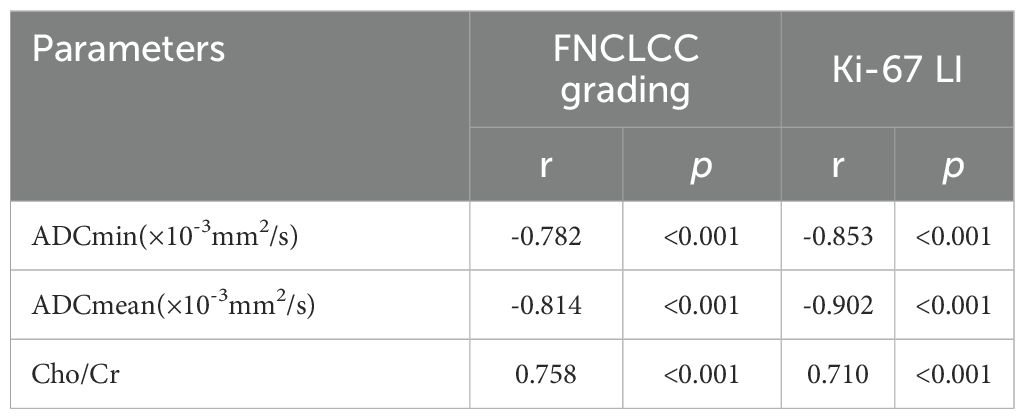
Table 4. Correlation of DWI and 1H MRS parameters of STSs in FNCLCC grading and Ki-67 LI.
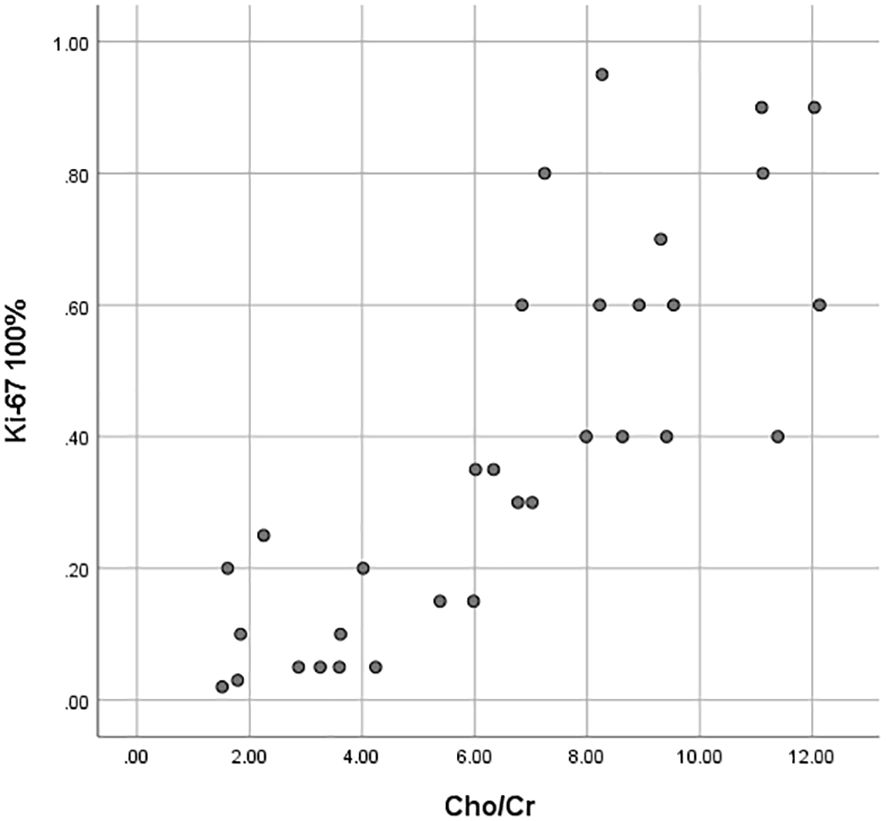
Figure 3. Scatter plots of the correlation between the Ki-67 LI with ADCmin, ADCmean values and Cho/Cr ratios.
Figures 4 and 5 show the features of the CT-MR fusion registration images, pathological diagnosis, and Ki-67 LI images of the histologically confirmed pleomorphic leiomyosarcomas and myxofibrosarcomas.
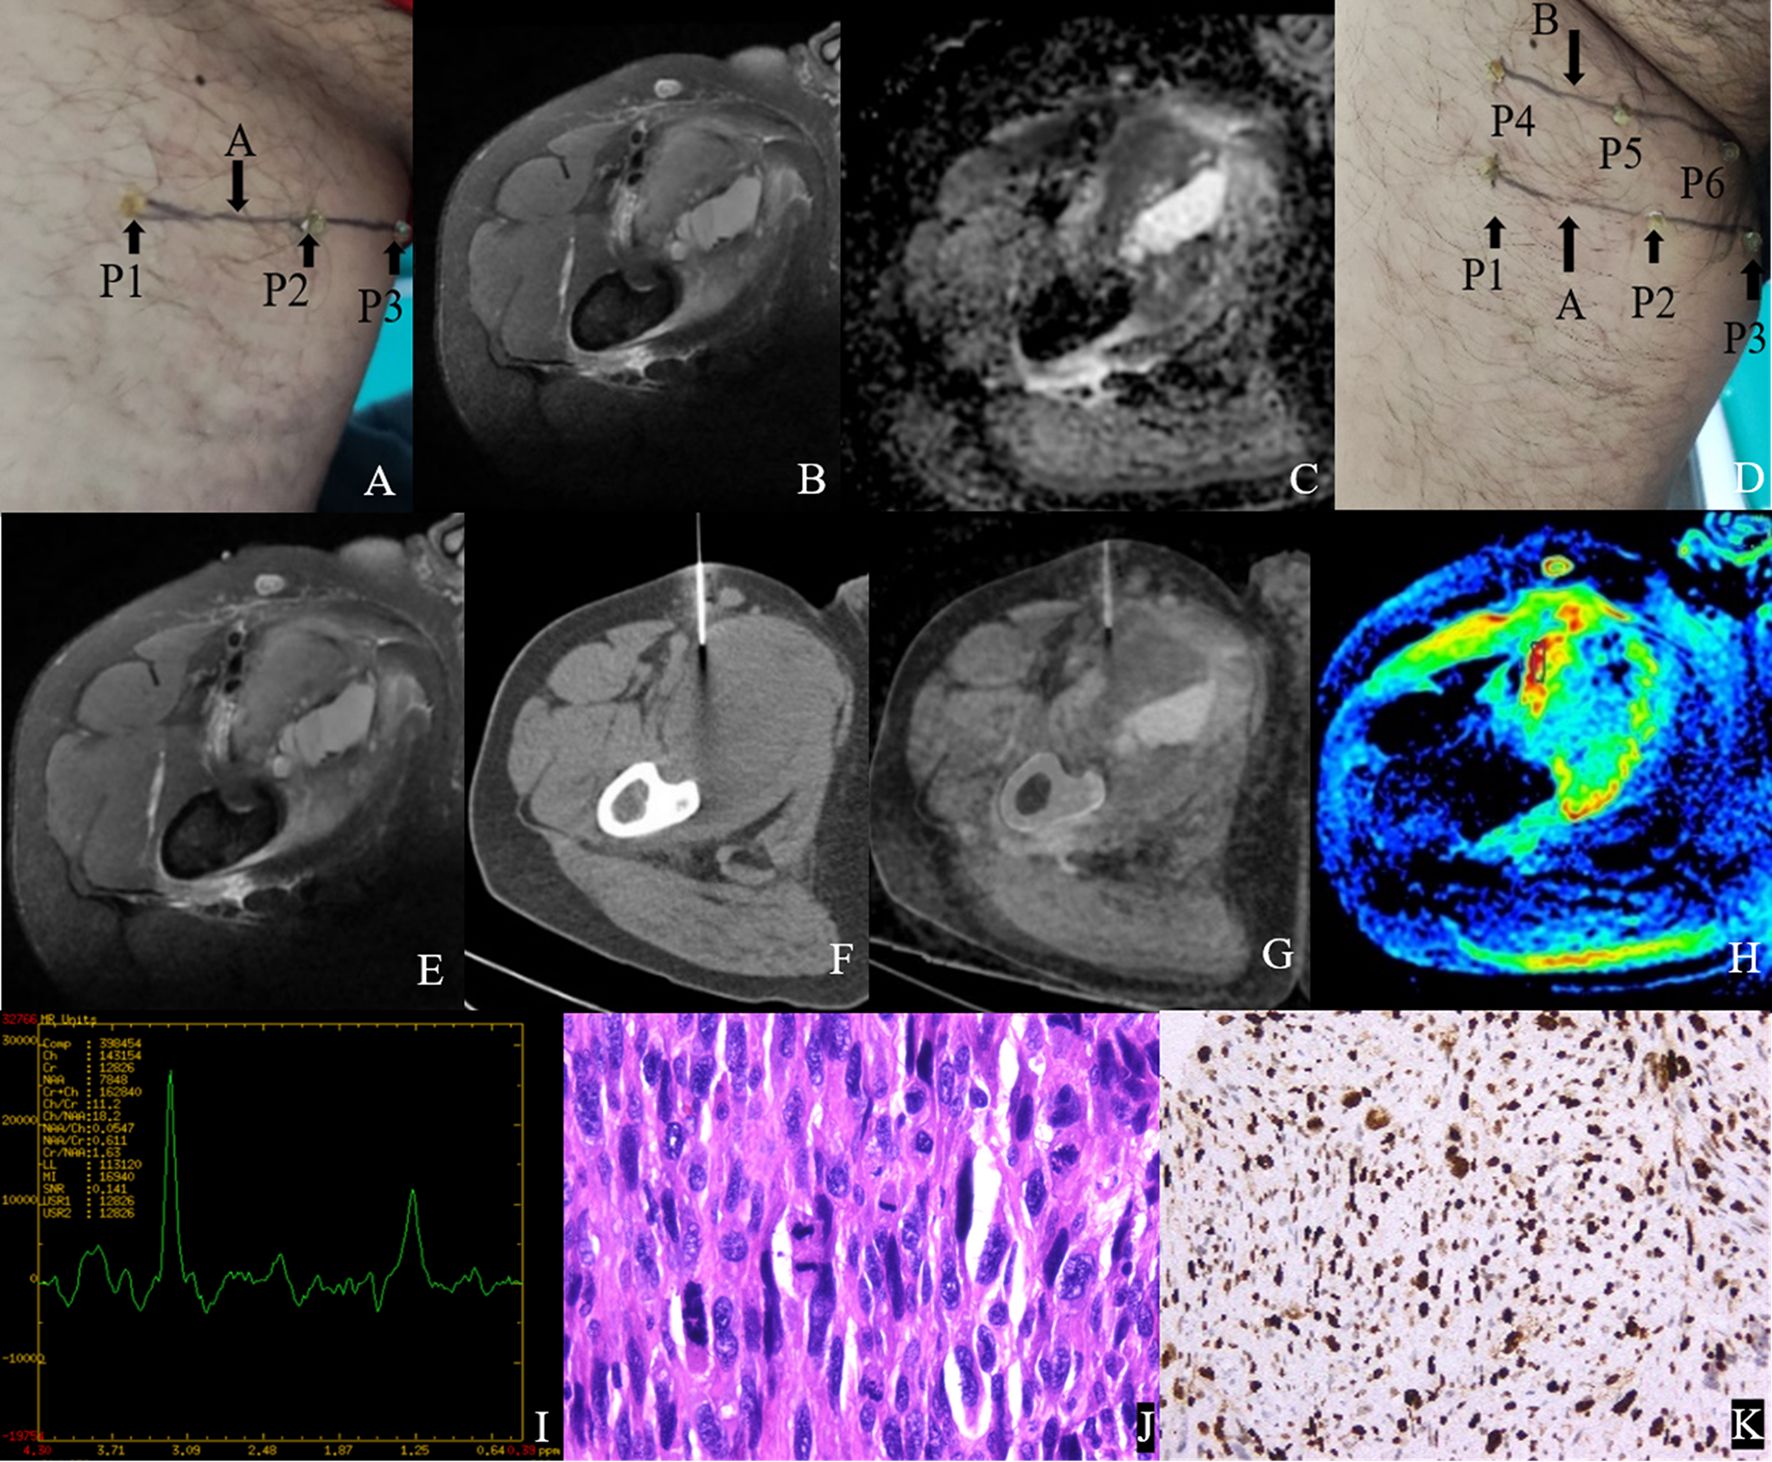
Figure 4. Male, 47Y, Pleomorphic leiomyosarcoma of the right thigh, G3. (A) Body surface positioning marks before MRI examination; (B, C) Targeted slice, chosen by Axial T2WI-FS and ADC image; (D) Mark the targeted slice on body surface; (E) A second time Axial T2WI-FS scan to confirm the target slice; (F) CT guided biopsy at target slice; (G) CT-MRI image fusion at target slice; (H) Draw ROI to obtain DWI quantitative parameters, ADCmin: 0.725×10⁻³ mm2/s, ADCmean: 0.929×10⁻³ mm2/s; (I) 1H MR spectrum, Cho/Cr:11.2; (J) Histological images of biopsy specimens, Grade 3, HE×200; (K) Ki67 index 70%.
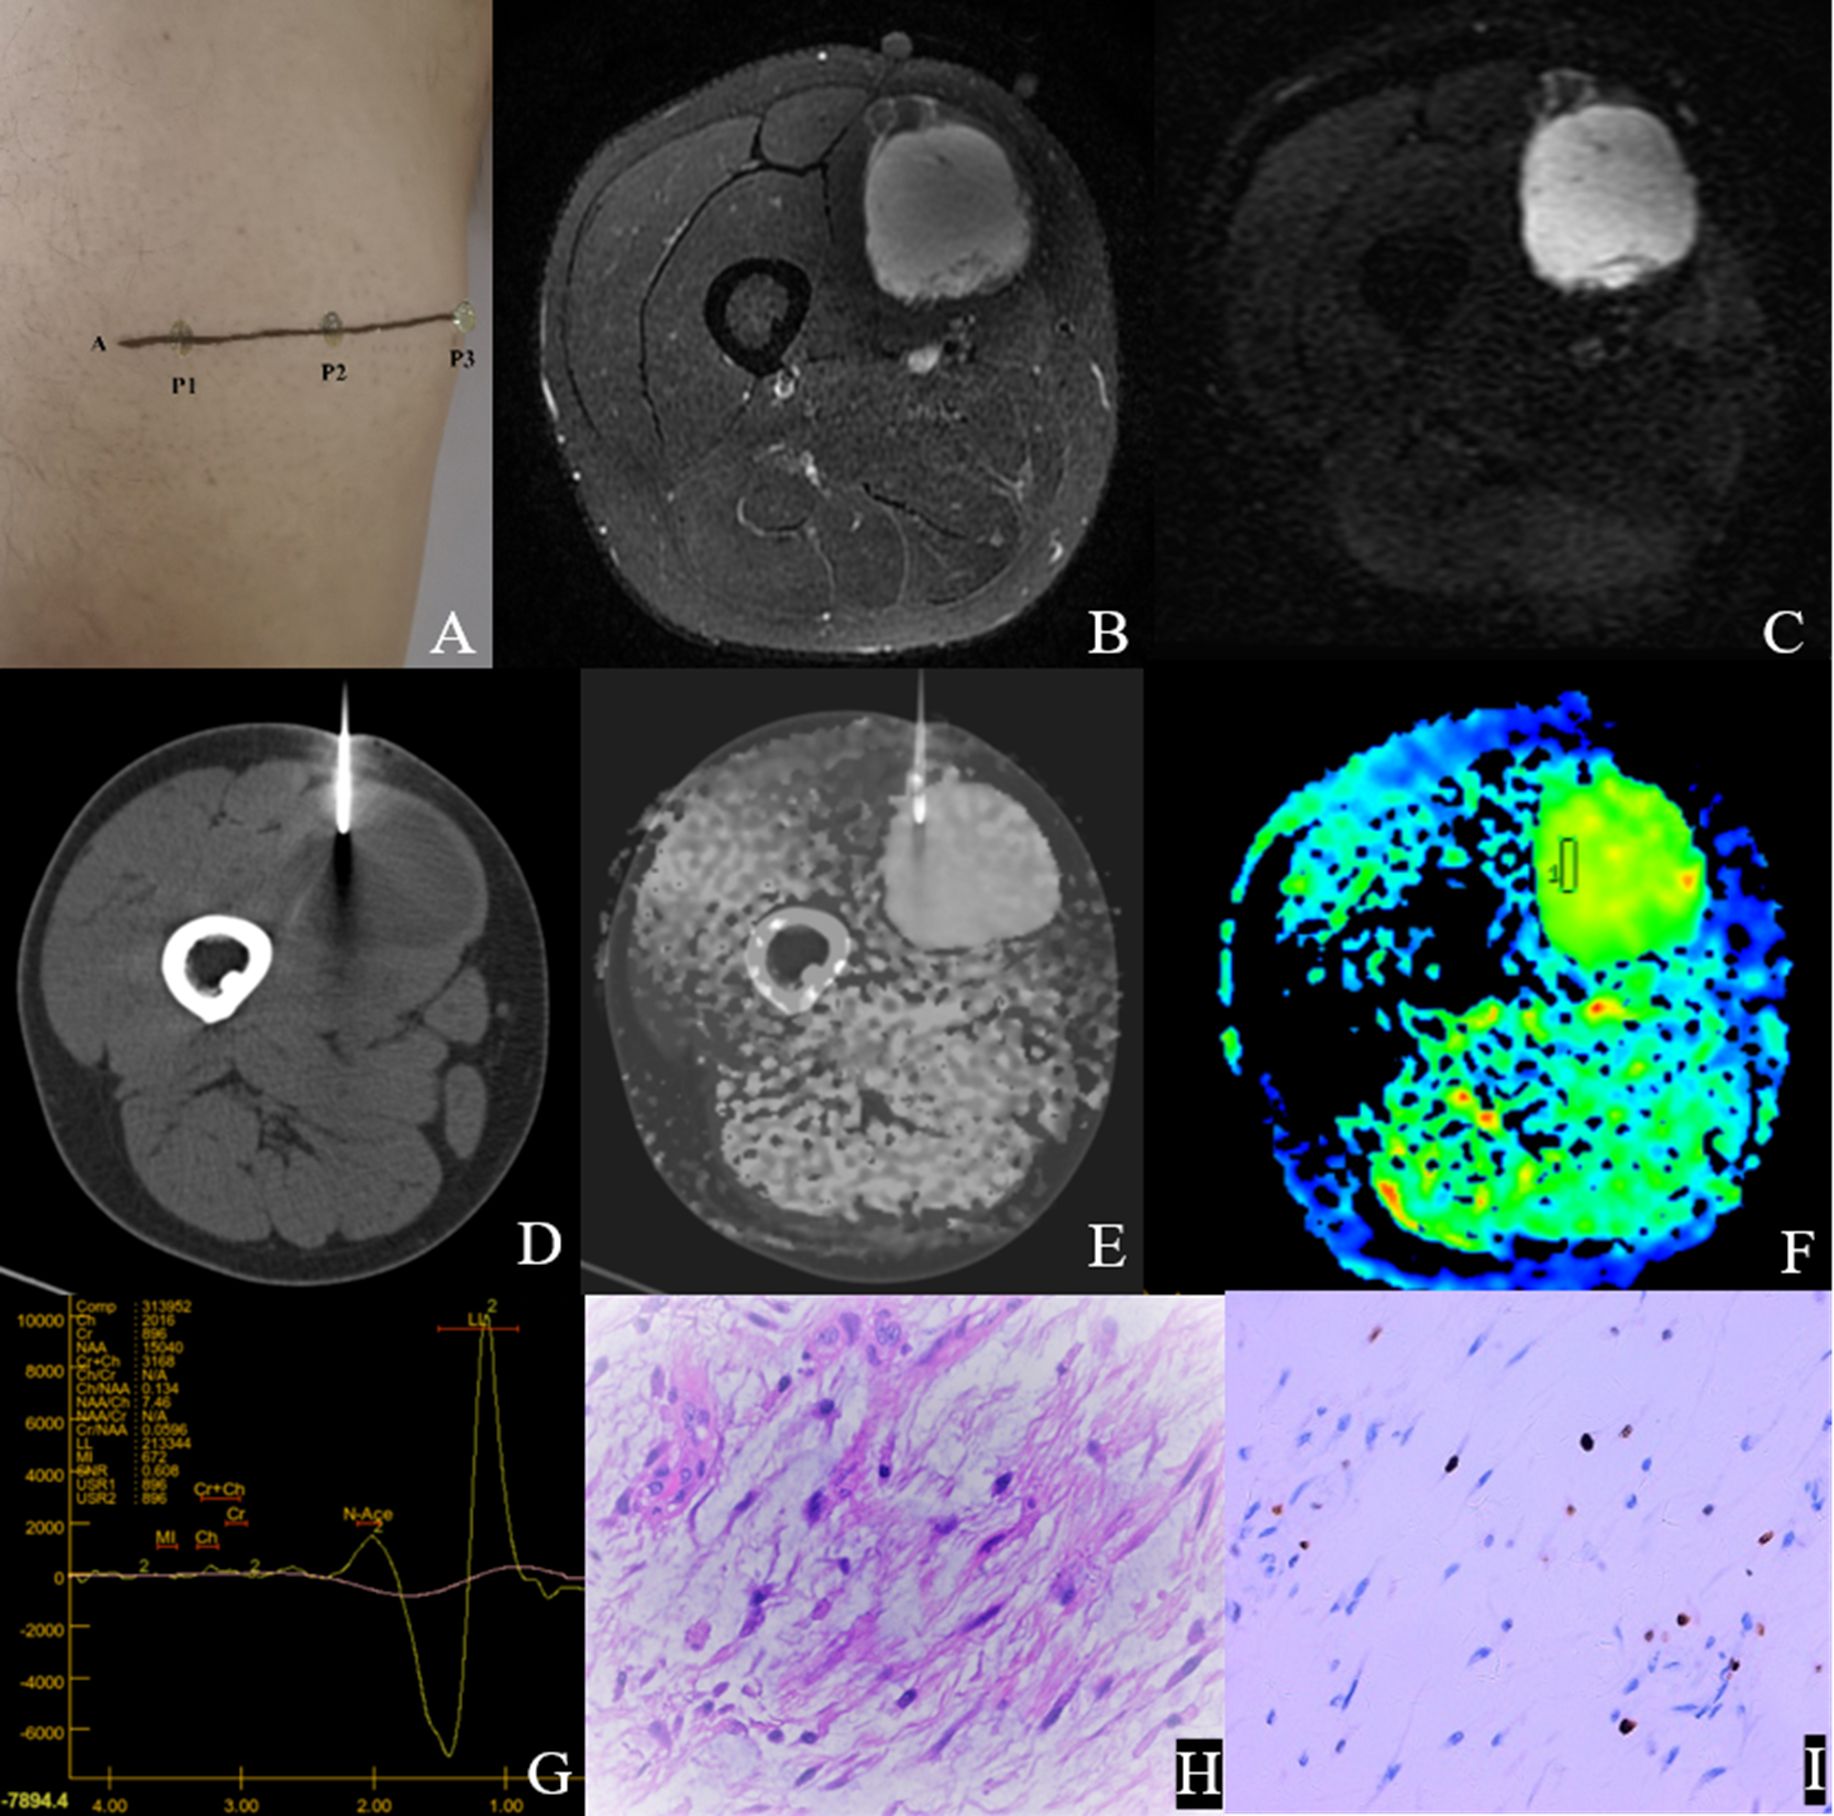
Figure 5. Male,35Y, Myxofibrosarcoma of the right calf, G1. (A) Body surface positioning marks before MRI examination; (B, C) Targeted slice, chosen by Axial T2WI-FS and ADC image; (D) CT guided biopsy at target slice; (E) CT-MRI image fusion at target slice; (F) Draw ROI to obtain DWI quantitative parameters, ADCmin: 3.280×10⁻³ mm2/s, ADCmean: 3.370×10⁻³ mm2/s; (G) 1H MR spectrum, Cho/Cr:2.25; (H) Histological images of biopsy specimens, Grade3, HE×200; (I) Ki67 index 10%.
Diagnostic efficacy analysis of DWI and 1H MRS parameters for FNCLCC grading and Ki67 expression
Table 5 and Figure 6 show the diagnostic efficiency of the DWI and 1H MRS parameters for differentiating between the low and high FNCLCC grade groups, while Table 6 and Figure 7 show the diagnostic efficiency of DWI and 1H MRS parameters for differentiating between the low and high Ki-67 expression groups. In both ROC analyses, ADCmean had a higher AUC (0.969, 0.957). The optimal cut-off ADCmean value of 1.525 was associated with 100% sensitivity and 95.8% specificity in the high grade group. In the high expression group, the value was 1.450 with 76.9% sensitivity and 100.0% specificity.
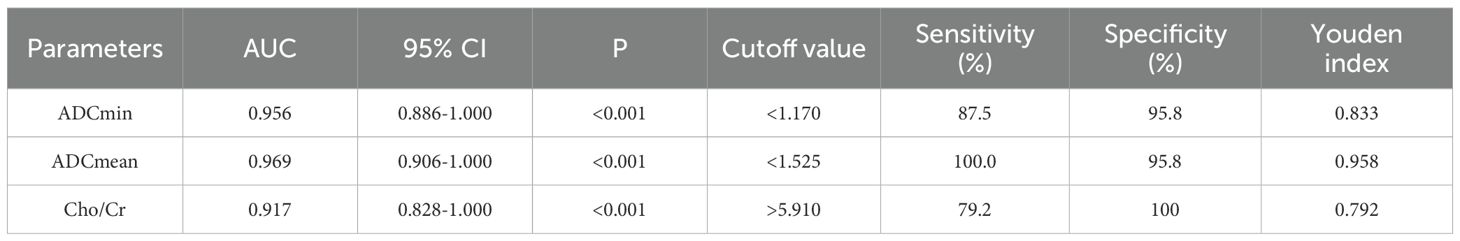
Table 5. Diagnostic performance of DWI and 1H MRS parameters for differentiating low and high grade groups of FNCLCC.
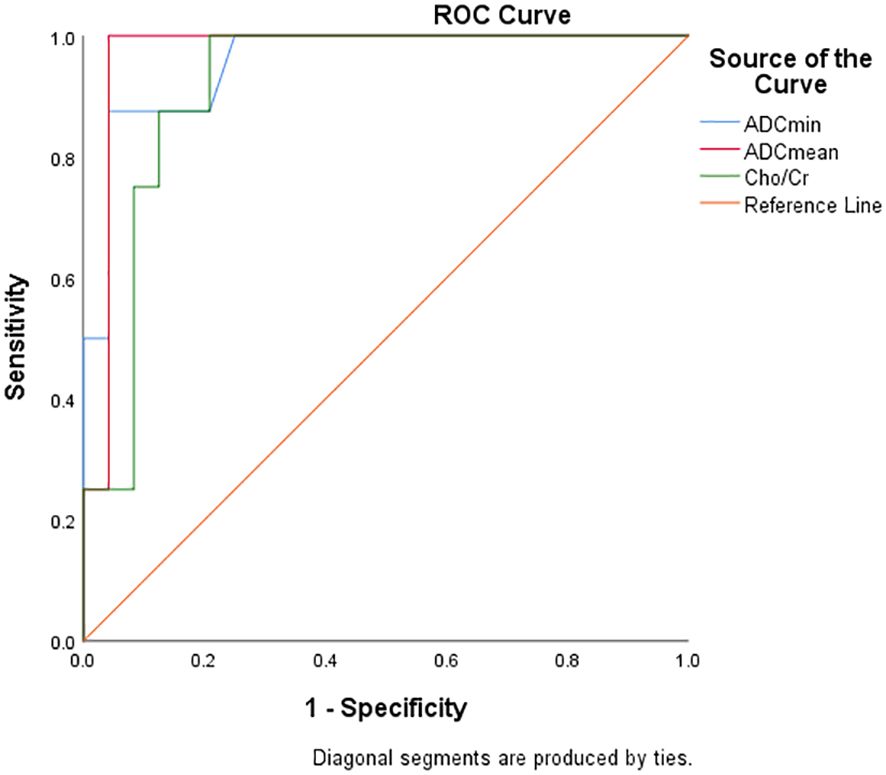
Figure 6. ROC curve showed diagnostic performance of ADCmin, ADCmean and Cho/Cr in FNCLCC grading.
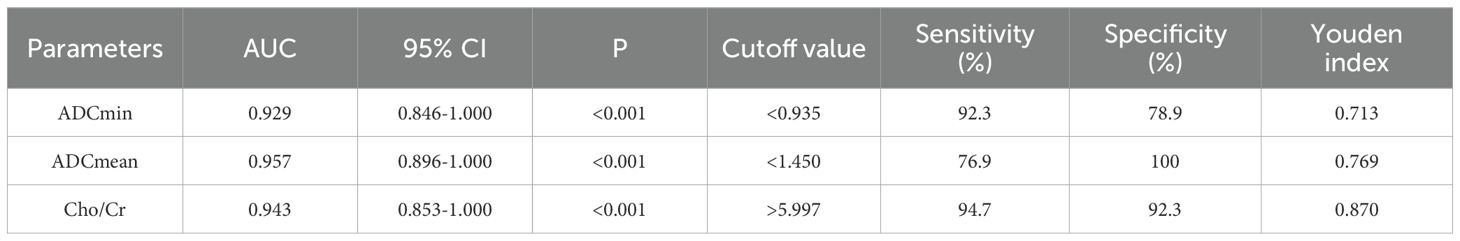
Table 6. Diagnostic performance of DWI and 1H MRS parameters for differentiating low and high expression groups of Ki-67 in STS.
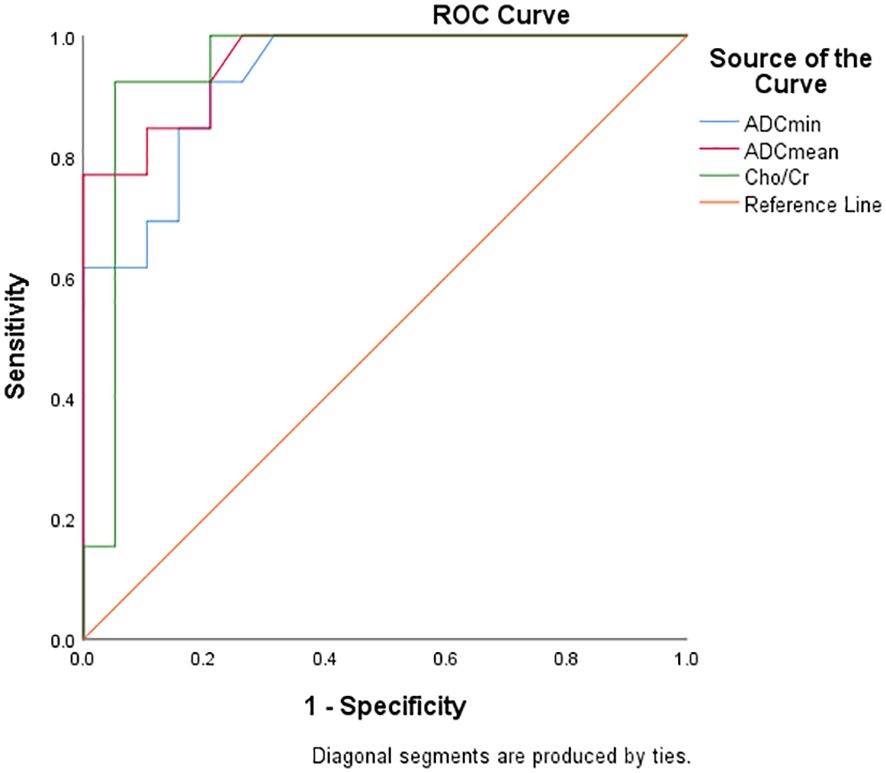
Figure 7. ROC curve showed diagnostic performance of ADCmin, ADCmean and Cho/Cr in Ki67 LI.
Discussion
The key step and challenge for accurately determining tumor pathological changes using imaging is to ensure precise matching between the imaging ROI and histopathological slices. Currently, such research approaches have been more extensively documented in prostate (23, 24) and brain (25–27), with clinical applications encompassing multiple domains including benign-malignant lesion differentiation, radiological-pathological correlation analysis, image-guided CNBs procedures, and intraoperative navigation systems. However, due to the fixed position of brain and prostate, registration is relatively simple but is not applicable to other tissues. Breast can also be regarded as a kind of soft tissue organ, which registration method is similar to that of soft tissue tumors. Maris et al. (28) registered high-resolution PET-CT images of ex vivo breast cancer specimens with digital whole slide images (WSI) using an automatic co-registration algorithm to precisely observe the standardized uptake values (SUVs) of different types of breast tumors. In soft tissue tumors, Jung et al. (29) successfully established a spatially exact co-registration procedure between in vivo MRI, ex vivo MRI and histopathology of STS to identify imaging parameters that reflect radiation therapy response of STS. Wang et al. adopted a “body position line-MRI slice-pathological section control method” (16–20), which also achieved accurate imaging-pathologic control of limb superficial soft tissue tumors.
However, many sarcoma patients loose the opportunity for surgery or require neoadjuvant therapy before undergoing surgery. Clinically, the FNCLCC grading diagnoses before treatment is usually based on biopsy pathology rather than surgical pathology. Therefore, it is equally important to improve the accuracy of CNB and the imaging-pathologic control of biopsy specimens. The imaging-pathologic control of previous biopsy specimens was performed using postoperative ex vivo biopsy specimens. As reported by Rasmussen et al. (30), MRI scans of 31 patients with head and neck squamous cell carcinoma were performed on preoperative and postoperative in vitro specimens. The tumor pathological specimens were formed into digital H&E images and fused with PET/MR images for registration. A CNBs was then performed on the in vitro specimens to accurately determine the correlation between the imaging parameters and tumor pathological markers. Hettler et al. (31) performed pre-operative in vivo MRI scans on 12 patients with STSs and then performed ex vivo CT scans and CNBs of post-operative specimens. Using Eclipse software, the pre-operative MRI images of the lesion and the post-operative ex vivo CT images were fused and imaged, and achieved precise comparison between the MRI ROI and biopsy sampling area. However, ex vivo specimens are soft and prone to deformation, and the extent to which ex vivo specimens can reliably represent the in vivo biological behavior of tumors remains a subject of ongoing scientific debate.
Although it was once envisioned in Hettler’s research (31), our study is the first to use in vivo MRI scanning of STS and CT-guided in vivo CNBs and integration of the MRI imaging slice with the CT-guided CNB sampling slice for image fusion and registration. The biopsy sampling point serves as the pathological sampling point, thereby eliminating the issues that arise after specimens are removed from the body. Secondly, this method essentially achieves precise imaging-pathologic control of biopsy specimens, and also not complicated. It is beneficial to establish a close logical connection between the imaging features of MRI and the pathological information of the specimen. This approach provides a precise “MRI ROI-histopathological slices” correlation method for predicting pathological changes in a STS, and therefore aids in accurate prediction of the STS diagnosis and prognosis. Thirdly, this method enables pathological diagnosis of biopsy specimens to approximate that of surgical specimens, thereby assisting surgeons to evaluate STSs more accurately before surgery.
Ultrasound-guided CNBs are used more commonly for soft tissue tumors and studies have reported an accuracy rate of up to 92.5% (32). However, the spatial resolution of ultrasound images is low, the slices are not fixed, and the image morphology are quite different from MRI, which makes it difficult to achieve precise matching with soft tissue MRI images, except for relatively fixed organs such as the prostate (33). Noebauer-Huhmann et al. (34) achieved reliable grading diagnoses in 90.5% of cases using MRI-guided CNBs for soft tissue tumors, although this method is difficult to implement widely in clinical practice. Therefore, in our study we chose to use CT-guided biopsies. In comparison to standard MRI protocols, the CT-MRI image registration process necessitates additional T2WI-FS and DWI sequences. Based on lesion size, this protocol extends the average MRI scanning time by approximately 7 minutes. Given the substantial diagnostic benefits of this approach, we consider this marginal time increase clinically acceptable and believe the methodology demonstrates strong feasibility for routine clinical implementation.
We selected the ADC value, one of the most commonly used quantitative parameters in MRI clinical examinations, as the imaging biomarker for STS. This was because DWI reflects the degree of water molecule diffusion in tissues, which correlates positively with cell density. Studies have shown that the ADC value has unique value for differentiating between benign and malignant soft tissue tumors and evaluating early prognosis, and decreases with increasing malignancy of STS (35–38). In this preliminary study, the results obtained being consistent with those of previous studies. We also selected the 1H MRS metabolite Cho based on its fundamental role in phospholipid metabolism, a critical component of cell membrane biosynthesis and degradation, which reflected the renewal of cell membranes and cell proliferation. Due to the relatively stable Cr value, Cho/Cr ratio is usually used as a metabolic marker in spectroscopic studies (39). Russo et al. (40) conducted a analysis of 43 STSs, revealing a significant positive correlation (p<0.01) between 1H-MRS Cho peak and mitotic index stratification. Similarly, Patni et al. (39) found that the Cho/Cr ratio was positively correlated with the histological grading of musculoskeletal tumors. However, the above retrospective studies were lack of Imaging-Pathologic correlation analysis. Besides, the inclusion of heterogeneous tumor types (particularly malignant bone tumors) might confound metabolic interpretations. In contrast to previous work, our prospective study implemented rigorous methodological controls to enhance diagnostic specificity. The results showed that Cho/Cr ratio exhibited a great diagnostic performance in evaluating STS histological grading and Ki-67 expression. Well-differentiated liposarcomas were systematically excluded due to the confounding effects of lipid signal suppression in DWI sequences, which could also significantly degrade spectral quality, thereby affected the accuracy of data measurement. However, the data in this study exhibited two outliers, resulting in a non normal distribution of ADC data and unstable spectral curves in these two cases. These outliers correspond to two cases of low-grade myxosarcoma characterized by minimal solid components. Higher ADC values in myxoid tissues make it unable to differentiate between benign and malignant myxoid soft tissue tumors (41). This histological feature also explains why biopsy specimens from these cases failed to yield a definitive histological subtype diagnosis. Gimber et al. reported trends toward more heterogeneous T1- and T2-weighted signal intensity in high-grade tumors within their series of 31 myxoid liposarcomas (42). Research shows that MRI radiomics utilizing T1-weighted, fat-suppressed T2-weighted, and contrast-enhanced T1-weighted sequences have demonstrated high diagnostic accuracy in differentiating benign myxomas from malignant myxoid sarcomas (43). For mucus-rich soft tissue tumors, further investigation with larger sample sizes and more parameters such as T1,T2 mapping or radiomics are required to validate and improve CNBs methodologies.
The FNCLCC grading and KI67 index are important criteria for developing treatment plans for STS patients. However, FNCLCC grading is based on biopsy specimens and is often an unreliable parameter in pre-treatment evaluation. The pathological diagnosis of surgical specimens is also inaccurate, as the application of preoperative treatment may significantly alter the FNCLCC and Ki67 parameters. Therefore, improving the accuracy of grading and Ki67 expression in pre-treatment biopsies is crucial for clinical treatment decisions. Studies have shown that replacing mitotic counts with Ki-67 enhances the accuracy of FNCLCC grading in STS (44). Given that functional imaging reflects tumor aggressiveness and heterogeneity by assessing tumor cell density and proliferative capacity, studies have examined the correlation between STS functional imaging parameters and KI67 index expression (18, 20, 45). Based on the findings of these studies we chose to use Ki67 in the current study.
Although the National Comprehensive Cancer Network(NCCN) Soft Tissue Sarcoma Diagnosis and Treatment Guidelines (2022) recommend image-guided biopsy as the preferred method for definitive pathological diagnosis before treatment (46). Radiomics has become a valuable tool for non-invasive prediction of STS histological grading and benign/malignant distinction (47, 48), which is expected to replace the role of biopsy in the future. The focus of the development of radiomics is on how to achieve trustful model, increasing open-science, increasing prospective multicentric trials, and building large databases to independently validate radiomics models. In addition, the implementation of deep learning and explanatory approaches involving transcriptomics data pave the way for a very exciting and challenging future for radiomics in STS patients.
This pilot study had some limitations. First, our small patient population, uneven distribution of anatomical sites of tumors and some specific STS subtypes(e.g. Alveolar Soft-Part Sarcoma) that do not follow FNLCC grading system may have led to selection bias. Considering this is a preliminary study and the low incidence rate of sarcoma, further improvement would be achieved in larger cohort studies that excludes certain sarcomas that do not follow FNLCC grading system (e.g. Alveolar Soft-Part Sarcoma, Myxoid Round Cell Liposarcomas, Clear Cell Sarcomas). Secondly, due to the lack of specialized sarcoma image fusion software, the study used commercial software in the Siemens post-processing system which did not calculate registration errors and may also have introduced bias. Thirdly, the CNBs path we chose should have avoided passing through multiple compartments to prevent metastasis, but may have affected the patient’s position in the CT scan, resulting in inconsistency of the position of the MR scan. This was the reason why we had four failed cases of fusion image registration. Fourthly, While 1H-MRS demonstrates significant potential in stratifying Fnclcc grading and quantifying Ki-67 proliferative activity in STS, the spectral instability observed in our cohort(n=8), thereby limiting the final sample size. Further research on how to control the quality of 1H MRS spectral lines in STS is necessary. In addition, our study attempted to use vitamin capsules to label and locate the target slice, which also served as an image registration marker and achieved good results.
Conclusion
This study conducted a preliminary investigation of a fusion registration method between pre CNBs MRI images and in vivo CNBs CT images of STSs, and achieved a precise comparison of “MRI- ROI to biopsy histopathological slices”. Considering that pre-treatment grading is the basis of STS treatment plans, we demonstrated that CT guided CNBs using this method had a high accuracy in histopathological diagnosis, and that DWI and 1H MRS parameters accurately assessed STS Fnclcc grading and ki67 expression under precise imaging-pathology control. In the future, we plan to conduct larger cohort studies to confirm whether this method can be extended to more MRI functional sequences and other tumors, which may help to identify the best imaging biomarkers that reflect the biological behavior of tumors in various systems.
Data availability statement
The raw data supporting the conclusions of this article will be made available by the authors, without undue reservation.
Ethics statement
The studies involving humans were approved by Ethics Committee of the Second Hospital of Dalian Medical University, Dalian, China. The studies were conducted in accordance with the local legislation and institutional requirements. The participants provided their written informed consent to participate in this study.
Author contributions
NX: Conceptualization, Data curation, Formal analysis, Methodology, Software, Validation, Visualization, Writing – original draft, Writing – review & editing. YL: Conceptualization, Data curation, Software, Validation, Visualization, Writing – review & editing. XY: Data curation, Software, Visualization, Writing – review & editing. JT: Data curation, Software, Validation, Visualization, Writing – review & editing. LS: Methodology, Software, Validation, Visualization, Writing – review & editing. CS: Methodology, Project administration, Supervision, Writing – review & editing. SW: Conceptualization, Formal analysis, Funding acquisition, Methodology, Resources, Supervision, Writing – review & editing.
Funding
The author(s) declare that financial support was received for the research and/or publication of this article. This work was supported by the National Natural Science Foundation of China (Grant NO.82271975).
Conflict of interest
The authors declare that the research was conducted in the absence of any commercial or financial relationships that could be construed as a potential conflict of interest.
Generative AI statement
The author(s) declare that no Generative AI was used in the creation of this manuscript.
Publisher’s note
All claims expressed in this article are solely those of the authors and do not necessarily represent those of their affiliated organizations, or those of the publisher, the editors and the reviewers. Any product that may be evaluated in this article, or claim that may be made by its manufacturer, is not guaranteed or endorsed by the publisher.
References
1. WHO. WHO classification of tumours: Soft tissue and bone tumours. 5th ed. France: WHO Classification of Tumours Editorial Board (2020).
2. Neuville A, Chibon F, and Coindre JM. Grading of soft tissue sarcomas: From histological to molecular assessment. Pathology. (2014) 46:113–20. doi: 10.1097/pat.0000000000000048
3. Hoos A, Stojadinovic A, Mastorides S, Hoos A, Stojadinovic A, Mastorides S, et al. High Ki-67 proliferative index predicts disease specific survival in patients with high-risk soft tissue sarcomas. Cancer. (2001) 92:869–74. doi: 10.1002/1097-0142(20010815)92:4<869::aid-cncr1395>3.0.co;2-u
4. Barrientos-Ruiz I, Ortiz-Cruz EJ, Serrano-Montilla J, Bernabeu-Taboada D, and Pozo-Kreilinger JJ. Are biopsy tracts a concern for seeding and local recurrence in sarcomas? Clin Orthop Relat Res. (2017) 475:511–8. doi: 10.1007/s11999-016-5090-y
5. Schneider N, Strauss DC, Smith MJ, Miah AB, Zaidi S, Benson C, et al. The adequacy of core biopsy in the assessment of smooth muscle neoplasms of soft tissues: Implications for treatment and prognosis. Am J Surg Pathol. (2017) 41:923–31. doi: 10.1097/pas.0000000000000867
6. Kiefer J, Mutschler M, Kurz P, Stark GB, Bannasch H, and Simunovic F. Accuracy of core needle biopsy for histologic diagnosis of soft tissue sarcoma. Sci Rep. (2022) 12:1886. doi: 10.1038/s41598-022-05752-4
7. Crombé A, Marcellin PJ, Buy X, Stoeckle E, Brouste V, Italiano A, et al. Soft-tissue sarcomas: assessment of MRI features correlating with histologic grade and patient outcome. Radiology. (2019) 291:710–21. doi: 10.1148/radiol.2019181659
8. Scalas G, Parmeggiani A, Martella C, Tuzzato G, Bianchi G, Facchini G, et al. Magnetic resonance imaging of soft tissue sarcoma: features related to prognosis. Eur J Orthop Surg Traumatol. (2021) 31:1567–75. doi: 10.1007/s00590-021-03003-2
9. Zhao F, Ahlawat S, Farahani SJ, Weber KL, Montgomery EA, Carrino JA, et al. Can MR imaging be used to predict tumor grade in soft-tissue sarcoma? Radiology. (2014) 272:192–201. doi: 10.1148/radiol.14131871
10. Drăgoescu PO, Drocaş AI, Drăgoescu AN, Pădureanu V, Pănuş A, Stănculescu AD, et al. Transperineal prostate biopsy targeted by magnetic resonance imaging cognitive fusion. Diagnost (Basel). (2023) 13:1373. doi: 10.3390/diagnostics13081373
11. Song Y, Yoon YC, Chong Y, Seo SW, Choi YL, Sohn I, et al. Diagnostic performance of conventional MRI parameters and apparent diffusion coefficient values in differentiating between benign and Malignant soft-tissue tumours. Clin Radiol. (2017) 72:691. doi: 10.1016/j.crad.2017.02.003
12. Del Grande F, Ahlawat S, Subhawong T, and Fayad LM. Characterization of indeterminate soft tissue masses referred for biopsy: What is the added value of contrast imaging at 3.0 tesla? J Magn Reson Imaging. (2017) 45:390–400. doi: 10.1002/jmri.25361
13. Gondim Teixeira PA, Simon L, Sirveaux F, Marie B, Louis M, Hossu G, et al. Intravoxel incoherent motion MRI for the initial characterization of non-fatty non-vascular soft tissue tumors. Diagn Interv Imaging. (2020) 101:245–55. doi: 10.1016/j.diii.2019.11.003
14. Lee SK, Jee WH, Jung CK, and Chung YG. Multiparametric quantitative analysis of tumor perfusion and diffusion with 3T MRI: Differentiation between benign and Malignant soft tissue tumors. Br J Radiol. (2020) 93:20191035. doi: 10.1259/bjr.20191035
15. Manikis GC, Nikiforaki K, Lagoudaki E, de Bree E, Maris TG, Marias K, et al. Differentiating low from high-grade soft tissue sarcomas using post-processed imaging parameters derived from multiple DWI models. Eur J Radiol. (2021) 138:109660. doi: 10.1016/j.ejrad.2021.109660
16. Yuan Y, Zeng D, Liu Y, Tao J, Zhang Y, Yang J, et al. DWI and IVIM are predictors of Ki67 proliferation index: Direct comparison of MRI images and pathological slices in a murine model of rhabdomyosarcoma. Eur Radiol. (2020) 30:1334–41. doi: 10.1007/s00330-019-06509-w
17. Li X, Wang Q, Dou Y, Zhang Y, Tao J, Yang L, et al. Soft tissue sarcoma: Can dynamic contrast-enhanced (DCE) MRI be used to predict the histological grade? Skeletal Radiol. (2020) 49:1829–38. doi: 10.1007/s00256-020-03491-z
18. Li X, Tao J, Zhu Y, Yin Z, Zhang Y, and Wang S. Soft tissue sarcoma: Intravoxel incoherent motion and diffusion kurtosis imaging parameters correlate with the histological grade and Ki-67 expression. Acta Radiol. (2023) 64:1546–55. doi: 10.1177/02841851221131931
19. Li X, Yang L, Wang Q, Tao J, Pan Z, and Wang S. Soft tissue sarcomas: IVIM and DKI correlate with the expression of HIF-1α on direct comparison of MRI and pathological slices. Eur Radiol. (2021) 31:4669–79. doi: 10.1007/s00330-020-07526-w
20. Zhang K, Dai Y, Liu Y, Tao J, Pan Z, Xie L, et al. Soft tissue sarcoma: IVIM and DKI parameters correlate with Ki-67 labeling index on direct comparison of MRI and histopathological slices. Eur Radiol. (2022) 32:5659–68. doi: 10.1007/s00330-022-08646-1
21. Thoenissen P, Bucher A, Burck I, Sader R, Vogl T, and Ghanaati S. Image fusion improves interdisciplinary communication in the treatment of head and neck cancer. J Craniofac Surg. (2022) 33:e439–43. doi: 10.1097/SCS.0000000000008447
22. Deyrup AT and Weiss SW. Grading of soft tissue sarcomas: The challenge of providing precise information in an imprecise world. Histopathology. (2006) 48:42–50. doi: 10.1111/j.1365-2559.2005.02288.x
23. Lee CC, Chang KH, Chiu FM, Ou YC, Hwang JI, Hsueh KC, et al. Using IVIM parameters to differentiate prostate cancer and contralateral normal tissue through fusion of MRI images with whole-mount pathology specimen images by control point registration method. Diagnost (Basel). (2021) 11:2340. doi: 10.3390/diagnostics11122340
24. Schiller F, Fechter T, Zamboglou C, Chirindel A, Salman N, Jilg CA, et al. Comparison of PET/CT and whole-mount histopathology sections of the human prostate: A new strategy for voxel-wise evaluation. EJNMMI Phys. (2017) 4:21. doi: 10.1186/s40658-017-0188-1
25. Xie Q, Wu J, Du Z, Di N, Yan R, Pang H, et al. DCE-MRI in human gliomas: A surrogate for assessment of invasive hypoxia marker HIF-1A based on MRI-neuronavigation stereotactic biopsies. Acad Radiol. (2019) 26:179–87. doi: 10.1016/j.acra.2018.04.015
26. Huszar IN, Pallebage-Gamarallage M, Bangerter-Christensen S, Brooks H, Fitzgibbon S, Foxley S, et al. Tensor image registration library: Deformable registration of stand-alone histology images to whole-brain post-mortem MRI data. Neuroimage. (2023) 265:119792. doi: 10.1016/j.neuroimage.2022.119792
27. Yavas G, Caliskan KE, and Cagli MS. Three-dimensional-printed marker-based augmented reality neuronavigation: A new neuronavigation technique. Neurosurg Focus. (2021) 51:E20. doi: 10.3171/2021.5.Focus21206
28. Maris L, Göker M, Debacker JM, De Man K, Van den Broeck B, Van Dorpe J, et al. Method for co-registration of high-resolution specimen PET-CT with histopathology to improve insight into radiotracer distributions. EJNMMI Phys. (2024) 11:85. doi: 10.1186/s40658-024-00681-9
29. Jung M, Bogner B, Diallo TD, Kim S, Arnold P, Füllgraf H, et al. Multiparametric magnetic resonance imaging for radiation therapy response monitoring in soft tissue sarcomas: A histology and MRI co-registration algorithm. Theranostics. (2023) 13:1594–606. doi: 10.7150/thno.81938
30. Rasmussen JH, Olin A, Lelkaitis G, Hansen AE, Andersen FL, Johannesen HH, et al. Does multiparametric imaging with 18F-FDG-PET/MRI capture spatial variation in immunohistochemical cancer biomarkers in head and neck squamous cell carcinoma? Br J Cancer. (2020) 123:46–53. doi: 10.1038/s41416-020-0876-9
31. Hettler M, Kitz J, Seif Amir Hosseini A, Guhlich M, Panahi B, Ernst J, et al. Comparing apparent diffusion coefficient and FNCLCC grading to improve pretreatment grading of soft tissue sarcoma-A translational feasibility study on fusion imaging. Cancers (Basel). (2022) 14:4331. doi: 10.3390/cancers14174331
32. Weigl H, Hohenberger P, Marx A, Vassos N, Jakob J, and Galata C. Accuracy and safety of ultrasound-guided core needle biopsy of soft tissue tumors in an outpatient setting: A sarcoma center analysis of 392 consecutive patients. Cancers (Basel). (2021) 13:5659. doi: 10.3390/cancers13225659
33. Pensa J, Brisbane W, Kinnaird A, Kuppermann D, Hughes G, Ushko D, et al. Evaluation of prostate cancer detection using micro-ultrasound versus MRI through co-registration to whole-mount pathology. Sci Rep. (2024) 14:18910. doi: 10.1038/s41598-024-69804-7
34. Noebauer-Huhmann IM, Amann G, Krssak M, Panotopoulos J, Szomolanyi P, Weber M, et al. Use of diagnostic dynamic contrast-enhanced (DCE)-MRI for targeting of soft tissue tumour biopsies at 3T: Preliminary results. Eur Radiol. (2015) 25:2041–8. doi: 10.1007/s00330-014-3576-0
35. Dudeck O, Zeile M, Pink D, Pech M, Tunn PU, Reichardt P, et al. Diffusion-weighted magnetic resonance imaging allows monitoring of anticancer treatment effects in patients with soft-tissue sarcomas. J Magn Reson Imaging. (2008) 27:1109–13. doi: 10.1002/jmri.21358
36. Chhabra A, Ashikyan O, Slepicka C, Dettori N, Hwang H, Callan A, et al. Conventional MR and diffusion-weighted imaging of musculoskeletal soft tissue Malignancy: Correlation with histologic grading. Eur Radiol. (2019) 29:4485–94. doi: 10.1007/s00330-018-5845-9
37. Choi YJ, Lee IS, Song YS, Kim JI, Choi KU, and Song JW. Diagnostic performance of diffusion-weighted (DWI) and dynamic contrast-enhanced (DCE) MRI for the differentiation of benign from Malignant soft-tissue tumors. J Magn Reson Imaging. (2019) 50:798–809. doi: 10.1002/jmri.26607
38. Herminghaus S, Pilatus U, Möller-Hartmann W, Raab P, Lanfermann H, Schlote W, et al. Increased choline levels coincide with enhanced proliferative activity of human neuroepithelial brain tumors. NMR Biomed. (2002) 15:385–92. doi: 10.1002/nbm.793
39. Patni RS, Boruah DK, Sanyal S, Gogoi BB, Patni M, Khandelia R, et al. Characterisation of musculoskeletal tumours by multivoxel proton MR spectroscopy. Skeletal Radiol. (2017) 46:483–95. doi: 10.1007/s00256-017-2573-1
40. Russo F, Mazzetti S, Grignani G, De Rosa G, Aglietta M, Anselmetti GC, et al. In vivo characterisation of soft tissue tumours by 1.5-T proton MR spectroscopy. Eur Radiol. (2012) 22:1131–9. doi: 10.1007/s00330-011-2350-9
41. Nagata S, Nishimura H, Uchida M, Sakoda J, Tonan T, Hiraoka K, et al. Diffusion-weighted imaging of soft tissue tumors: usefulness of the apparent diffusion coefficient for differential diagnosis. Radiat Med. (2008) 26:287–95. doi: 10.1007/s11604-008-0229-8
42. Gimber LH, Montgomery EA, Morris CD, Krupinski EA, and Fayad LM. MRI characteristics associated with high-grade myx oid liposarcoma. Clin Radiol. (2017) 72:613.e1–6. doi: 10.1016/j.crad.2017.01.016
43. Benhabib H, Brandenberger D, Lajkosz K, Demicco EG, Tsoi KM, Wunder JS, et al. MRI radiomics analysis in the diagnostic differentiation of Malignant soft tissue myxoid sarcomas from benign soft tissue musculoskeletal myxomas. J Magn Reson Imaging. (2025) 61:2630–41. doi: 10.1002/jmri
44. Machado I, Cruz J, Righi A, Gambarotti M, Ferrari C, Ruengwanichayakun P, et al. Ki-67 immunoexpression and radiological assessment of necrosis improves accuracy of conventional and modified core biopsy systems in predicting the final grade assigned to adult-soft tissue sarcomas. An international collaborative study. Pathol Res Pract. (2021) 225:153562. doi: 10.1016/j.prp.2021.153562
45. von Mehren M, Kane JM, Agulnik M, Bui MM, Carr-Ascher J, Choy E, et al. Soft tissue sarcoma, version 2.2022, NCCN clinical practice guidelines in oncology. J Natl Compr Canc Netw. (2022) 20:815–33. doi: 10.6004/jnccn.2022.0035
46. Lee JH, Yoon YC, Seo SW, Choi YL, and Kim HS. Soft tissue sarcoma: DWI and DCE-MRI parameters correlate with Ki-67 labeling index. Eur Radiol. (2020) 30:914–24. doi: 10.1007/s00330-019-06445-9
47. Crombé A, Spinnato P, Italiano A, Brisse HJ, Feydy A, Fadli D, et al. Radiomics and artificial intelligence for soft-tissue sarcomas: Current status and perspectives. Diagn Interv Imaging. (2023) 104:567–83. doi: 10.1016/j.diii.2023.09.005
Keywords: CT-MRI fusion registration, precise imaging-pathology control, mp MRI, STS, CT-guided percutaneous CNBs, FNCLCC grading, ki67
Citation: Xu N, Lu Y, Yang X, Tao J, Shi L, Sun C and Wang S (2025) Research on application of multiparametric MRI to predict FNCLCC grading and ki67 expression in soft tissue sarcoma biopsy pathology: Based on a CT-MRI fusion image registration method. Front. Oncol. 15:1606942. doi: 10.3389/fonc.2025.1606942
Received: 06 April 2025; Accepted: 21 July 2025;
Published: 08 August 2025.
Edited by:
Mitchell Albert, Lakehead University, CanadaReviewed by:
Paolo Spinnato, Rizzoli Orthopedic Institute (IRCCS), ItalyShuang Chen, Fudan University, China
Copyright © 2025 Xu, Lu, Yang, Tao, Shi, Sun and Wang. This is an open-access article distributed under the terms of the Creative Commons Attribution License (CC BY). The use, distribution or reproduction in other forums is permitted, provided the original author(s) and the copyright owner(s) are credited and that the original publication in this journal is cited, in accordance with accepted academic practice. No use, distribution or reproduction is permitted which does not comply with these terms.
*Correspondence: Shaowu Wang, d3N3XzIwMThAMTYzLmNvbQ==
†These authors have contributed equally to this work and share first authorship