 Xiaoli Li
 Gaoyong Han
 Yudan Yang1
 Enhao Liang
- 1Department of Oncology, the First Affiliated Hospital of Zhengzhou University, Zhengzhou, China
- 2School of Automation and Electrical Engineering, Zhongyuan University of Technology, Zhengzhou, China
- 3School of Medicine, Dalian University of Technology, Dalian, China
Introduction: Esophageal cancer (EC) is one of the most aggressive tumor types worldwide, and malnutrition is extremely common among EC patients. By identifying EC biomarkers and conducting risk assessments on patients, more accurate diagnosis and treatment plans can be developed to prolong patients’ survival.
Methods: This study developed a risk assessment model for post-surgical EC patients using clinical data from patients who underwent esophagectomy. Prognostic factors influencing survival were evaluated using Adaptive Lasso for variable selection, followed by Cox proportional hazards regression and Receiver Operating Characteristic (ROC) curve. Among multiple clinical variables, the International Normalized Ratio (INR) emerged as the most significant predictor of survival.
Results: Elevated INR levels were significantly associated with improved 3-year and 5-year survival outcomes compared to the Prognostic Nutritional Index (PNI). Patients with higher INR exhibited notably better postoperative survival rates. Further analysis demonstrated that INR was significantly correlated with the final differentiation degree, final infiltration degree, and final positive/negative status of EC.
Discussion: INR serves as a valuable and independent prognostic biomarker for postoperative survival assessment in EC patients. Incorporating INR into clinical risk models can enhance the accuracy of prognosis and assist clinicians in optimizing individualized therapeutic strategies for surgical EC patients.
1 Introduction
Esophageal cancer (EC) is a common malignant tumor of the digestive tract, ranking eighth in cancer incidence worldwide (1). In China, the incidence of EC is higher than the global average, and it is the fourth leading cause of cancer-related death (2). Esophageal cancer (EC) frequently presents with various gastrointestinal symptoms, notably dysphagia, leading to malnutrition and compromised patient conditions (3–9). The 5-year overall survival rate of EC patients remains poor, being less than 20% (10). The median survival time after diagnosis is only 11 months (11). Surgical treatment is commonly applied in the management of EC patients. However, there is risks with inflammation from surgery and required fasting further compromising the nutritional status and immunity of patients with EC. These complications not only affect the surgical outcomes of patients but also result in a poor prognosis (12–14).
The analysis of factors influencing the survival period of EC has been conducted from diverse aspects with different focuses. The main methods include factor analysis (15), linear regression analysis (16), the analytic hierarchy process (17), and the grey correlation model method (18), each having its own advantages and disadvantages. In establishing statistical models, dependent variables are not always affected by independent variables. For medical data, numerous variables are highly correlated, giving rise to statistical issues such as multiple linearity and multi-collinearity. These statistical problems introduce errors during fitting or prediction, thereby affecting the accuracy of statistical inference (19). Traditional variable selection methods are characterized by disadvantages such as slow calculation speed, poor algorithm stability, and poor model selection stability. The Lasso method was proposed to address these shortcomings (20–25). The Lasso method increases the penalty term to reduce the absolute value of the covariable coefficient to 0. It enables simultaneous variable selection and parameter estimation in the model, in contrast to traditional methods where these two steps are carried out separately. The Lasso method overcomes the drawbacks of traditional variable selection and ridge estimation and has been widely applied in various fields of modern regression analysis. To enhance the performance of the Lasso method, the adaptive Lasso algorithm and its corresponding algorithms have been proposed (24, 26–29).
In this study, based on the adaptive Lasso variable selection method, statistical techniques were utilized to analyze the factors affecting the survival time of EC patients. Cox risk regression analysis was also performed to construct the model. The established model was compared with the Prognostic Nutritional Index (PNI) in terms of 3-year and 5-year survival rates to optimize the prognostic value of PNI.
2 Object and analysis
2.1 Patient sample collection
Data of 410 patients with esophageal cancer were collected for analysis. The data were derived from clinical records of the First Affiliated Hospital of Zhengzhou University. Detailed patient information was recorded. There were 258 male patients (accounting for 62.9%), 152 female patients (accounting for 37.1%), with an age range of 45–80 years and an average age of 61.194 years. The age data were tested and shown to follow a normal distribution. Seventeen blood indicators of each patient were collected, including white blood cell (WBC) count (×109/L), lymphocyte count (×109/L), monocyte count (×109/L), neutrophil count (×109/L), eosinophil count (×109/L), basophil count (×109/L), red blood cell count (×10¹²/L), hemoglobin concentration (g/L), platelet count (×109/L), total protein (g/L), albumin (g/L), globulin (g/L), prothrombin time (Pt, s), international normalized ratio (INR), activated partial thromboplastin time (APTT, s), thrombin time (TT, s), and fibrinogen (FIB, mg/dL).
The inclusion and exclusion criteria are listed below. Inclusion criteria: ① All patients underwent esophagectomy with lymph node dissection and had no evidence of distant metastasis at diagnosis, irrespective of neoadjuvant treatment; ②Patients were diagnosed with EC by postoperative histopathology; ③ Patients had no history of other malignancies. Exclusion criteria: ① The pathology of EC was other types, such as neuroendocrine carcinoma, lymphoma, et al.; ② Patients had incomplete follow-up records; ③ Metastatic disease was identified intraoperatively or within 1 month post-surgery.
During the data collection process, a detailed statistical analysis of missing data was carried out. It was found that there were a small number of missing values in some blood indicators, with a missing proportion of less than 5% for each. For these missing values, the Multiple Imputation by Chained Equations (MICE) method was employed. The MICE method estimates missing values multiple times based on a series of prediction models, generates multiple complete datasets, analyzes these datasets separately, and finally combines the analysis results to reduce the impact of missing values on the research findings.
2.2 Observed variable setting
Inflammatory response markers such as the neutrophil-lymphocyte ratio (NLR), lymphocyte-monocyte ratio (LMR), platelet-lymphocyte ratio (PLR), and prognostic nutritional index (PNI) were set as input variables. The PNI was originally established by Japanese scholars including Ono-temple and is widely used to evaluate the nutritional status of surgical patients, predict surgical risks, and assess prognosis. Its calculation formula is: PNI = serum albumin (g/L) + 5×lymphocyte count (×109/L).
2.3 Methodology
Using patients' blood indicators as inputs and survival time as the output, the aim was to analyze the key factors influencing the survival time of EC patients. Based on the screening results of the Adaptive Lasso algorithm, SPSS 20.0 software was used for Cox proportional-hazards regression analysis, and the accuracy was evaluated according to the 3-year and 5-year survival rates of patients.
2.3.1 Lasso algorithm
Generally, for an independent variable y, it may have many influencing factors called independent variable x. The d-dimensional column vector is represented by β. The symbol t is a compression parameter of Lasso. The important explanatory variables were expected to be obtained, which required the coefficients of individual independent variables in the model to be zero. This process was called variable selection, which was to judge the coefficient of those independent variables as zero through historical data. Thus, the variable was removed, and a sparse model was obtained. Such a sparse model was found by Lasso method.
In Equation 3, λ was defined as a nonnegative regular coefficient, and was called a penalty term. Equation 3 was equivalent to Equations 1 and 2. For Lasso estimation, all variables were restricted to the same parameter. In fact, λ was designed as a fixed value, which was the main reason why Lasso estimation was called biased estimation.
2.3.2 Adaptive Lasso algorithm
Adaptive Lasso method was proposed in 2006, which had so-called Oracle property. The Adaptive Lasso algorithm was selected over the standard Lasso method due to its superior performance in variable selection, particularly in the presence of correlated predictors and high-dimensional covariates. By assigning adaptive weights based on initial estimates, the algorithm applies non-uniform penalization, thereby improving the accuracy of feature selection and parameter estimation. This property is especially beneficial in biomedical datasets where noise, multicollinearity, and limited sample size can impair traditional methods. For adaptive Lasso method, the penalty terms of different variables were calculated by using the least square estimation coefficient under the whole model. The large absolute value of the coefficient might be the variable in the real model, so the penalty was small. On the contrary, the small absolute value of the coefficient might not be an important independent variable, so the penalty was large. Based on this idea, the penalty function of adaptive Lasso was defined as Equations 4, 5:
The formula can be defined as an adaptive Lasso, where each penalty item was given a different weight according to the size of the estimated parameters. The ordinary least squares of is represented by , and is the root uniform estimate of β. γ is a random number with greater than 0. The parameter λ of the penalty function was not defined as a fixed value, but it was varied according to the value of each variable. The model will select more variables than Lasso regression without affecting the fitting effect, and the over compression of parameters can be prevented. In the implementation of the Adaptive Lasso algorithm, the regularization parameter λ was selected using 10-fold cross-validation to minimize prediction error. The weight exponent γ was set to 1, which provides a good balance between model sparsity and stability.
2.3.3 Model stability test
To ensure the stability and reliability of the constructed model, the 10-fold cross-validation method was used to evaluate the model. The specific operation is as follows: The original dataset was randomly divided into 10 subsets of similar sizes. For each round of analysis, 9 of these subsets were selected as the training set for model construction and training, while the remaining 1 subset was used as the test set to evaluate the model's performance. This process was repeated 10 times, ensuring each subset was used as a test set exactly once, thereby reducing bias and improving the reliability of performance estimates. Finally, 10 sets of model evaluation results were obtained. By calculating the mean and standard deviation of various indicators (such as the prediction accuracy of 3-year and 5-year survival rates, the area under the ROC curve, etc.) of these 10 evaluation results, the stability of the model was measured. If the standard deviation of the performance indicators is small, it indicates that the model performs stably on different datasets and has high reliability.
2.4 Follow-up
The First Affiliated Hospital of Zhengzhou University developed a systematic follow-up plan. Professional staff were randomly assigned to conduct telephone follow-up and regular outpatient follow-up. The follow-up period spanned 6–140 months to comprehensively track the survival status of patients. Patients lost to follow-up within 6 months post-surgery were excluded from the final analysis to minimize bias and maintain the robustness of our results. Follow-up was considered complete if patients had at least 6 months of postoperative survival data. Within 1 month after treatment, patients underwent esophagography and chest CT to evaluate short-term clinical effects. In the first 2 years after surgery, patients were followed up every 3 months; after 2 years, they were followed up every 6 months. During each follow-up, detailed information about the patient's survival status, disease recurrence, and other relevant clinical information was recorded.
3 Results
Experiment 1: Using 17 blood indicators as input variables and survival time as the output variable, the Adaptive Lasso algorithm was applied, and the results are shown in Table 1.
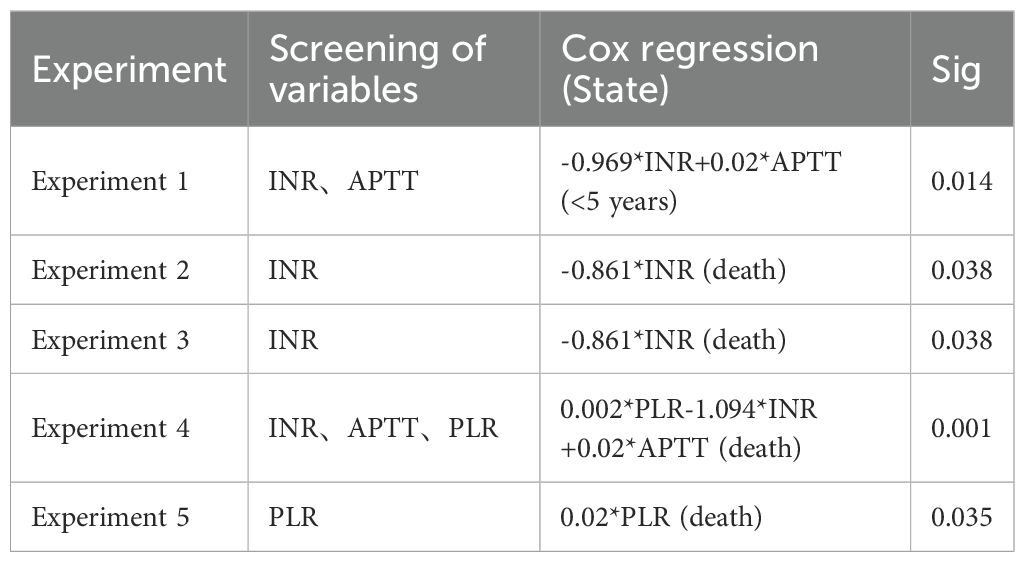
Table 1. Analysis of modeling results of adaptive Lasso and Cox regression.
Experiments 2-4: Considering the possible complex relationships among variables, different combinations of blood indicators (removing lymphocyte-related indicators and adding other variables) and PNI were used as input variables, and survival time was used as the output variable. The Adaptive Lasso algorithm was applied, and the results are also shown in Table 1. In the experimental design process, the removal of lymphocyte-related indicators was based on preliminary exploratory analysis. It was found that the newly added variables had a strong linear relationship with the lymphocyte indicators in the blood. This collinearity might interfere with the variable selection and parameter estimation results of the model, affecting the accuracy and stability of the model. Therefore, in subsequent experiments, lymphocyte-related indicators were removed to optimize the model construction.
Experiment 5: Using 17 blood indicators, and PLR as input variable and survival time as the output variable, the Adaptive Lasso algorithm was applied, and the results are shown in Table 1.
The variables screened from the above 5 experiments were used as the input variables for Cox risk regression, and survival time was used as the output variable. The corresponding analysis results are shown in Table 1. Given the large number of experimental combinations tested, Table 1 presents only the regression results that showed statistically significant associations between the selected variables and survival outcomes. The INR variable was not selected only in Experiment 5, and the significance correlation test value of risk regression was set at 0.05.
Receiver Operating Characteristic (ROC) curves were plotted with a 3-year survival period as the critical value (Figure 1a). It was found that only the area under the PNI curve was greater than 0.5. When the ROC curve was plotted with a 5-year survival period as the critical value (Figure 1b), the area under the PNI curve was also greater than 0.5. However, the statistical analysis of the Cox regression model showed that none of these 5 models were statistically significant under the current settings (detailed data are shown in Tables 2 and 3). It is important to note that statistical significance merely indicates that the model performs better than random guessing. Therefore, statistical significance should not be equated with clinical utility, and the predictive value of INR as a standalone factor should be interpreted with caution.
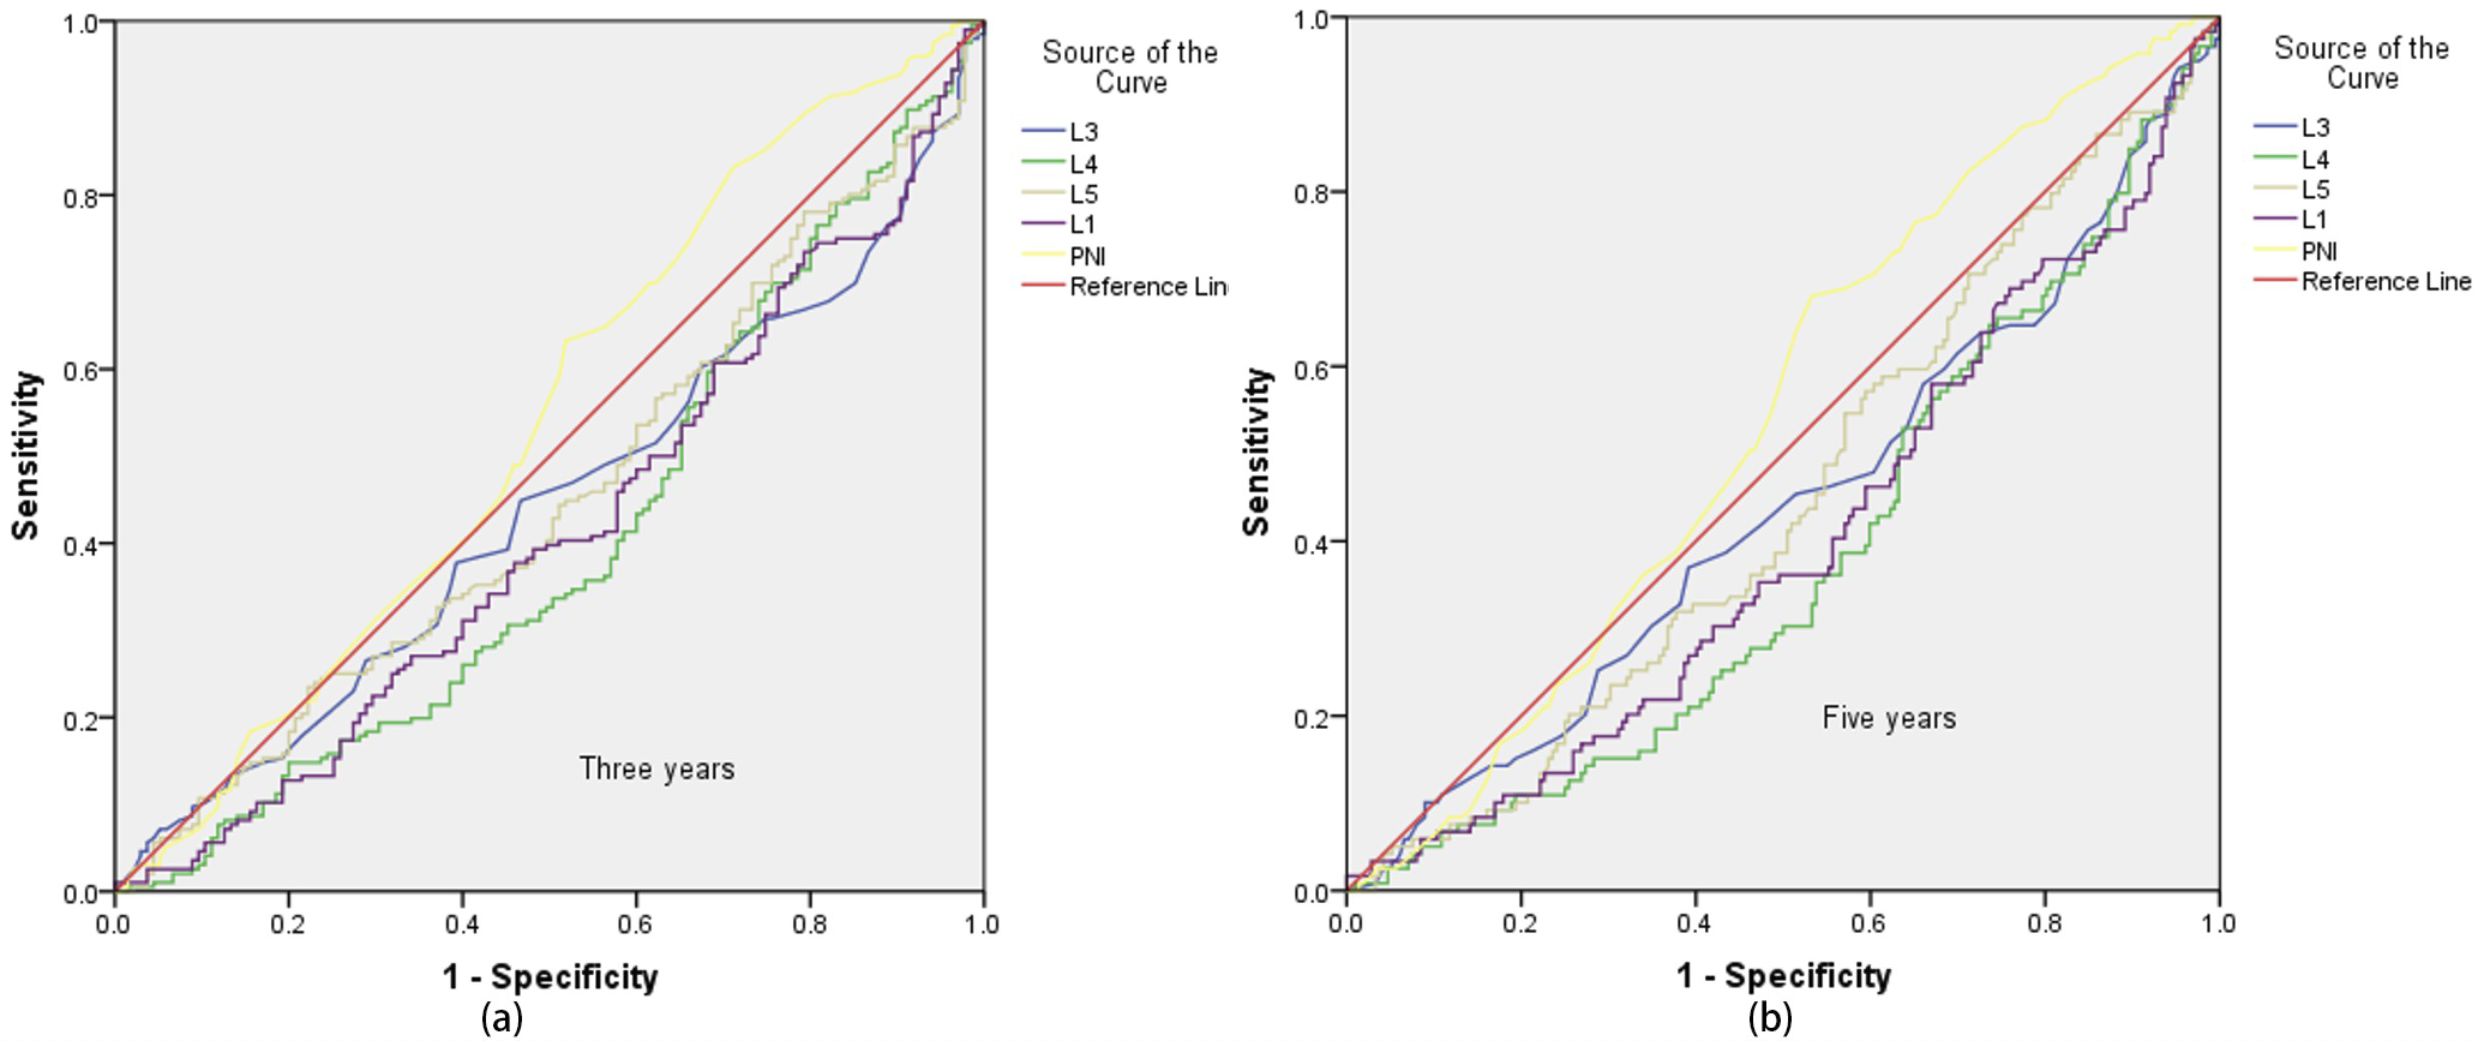
Figure 1. ROC curve with 3-year and 5-year survival as the critical value. Sub-figures (a) and (b) show the ROC curves for 3-year and 5-year survival, respectively.
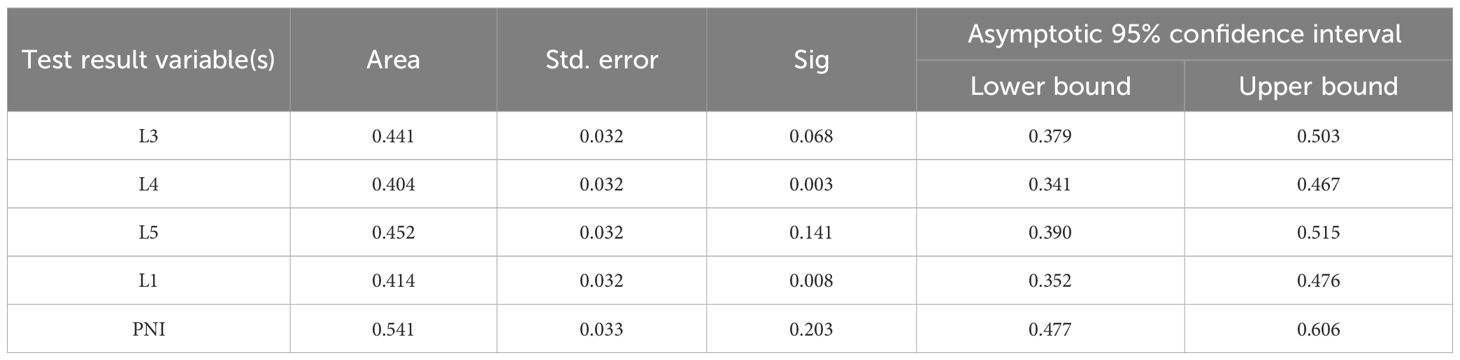
Table 2. Area under ROC curve with 3-year survival as critical value.
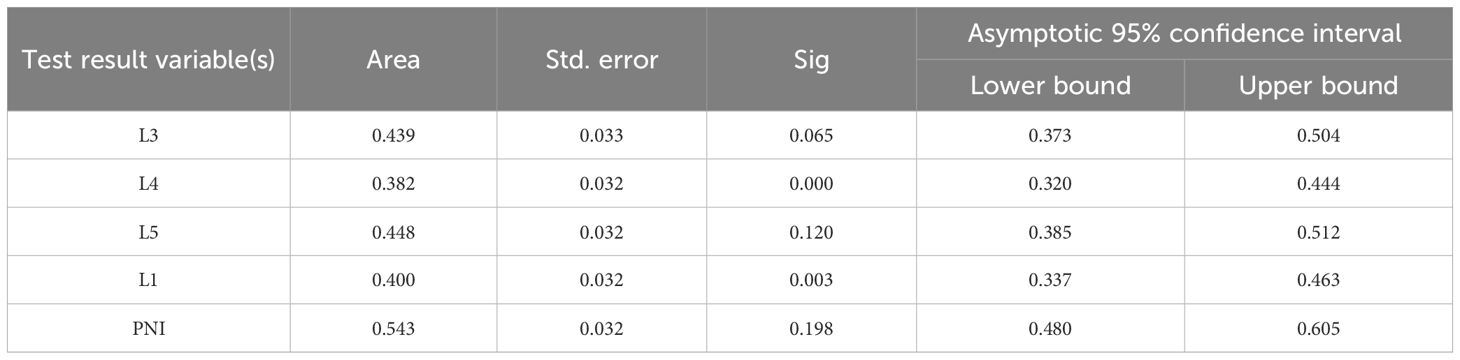
Table 3. Area under the curve with 5-year survival as the critical value.
Given that the above 5 models did not show statistical significance in the analysis of the 3-year and 5-year survival rates of EC patients, based on the preliminary analysis results of the Adaptive Lasso experiments, experiment was further carried out. ROC curve analyses of INR were performed using 150, 200, 250, and 330 cases of data respectively. The results showed that when 3-year and 5-year survival were used as the critical values, the areas under the ROC curves of all data were greater than 0.5 (specific data are shown in Table 4), indicating a close association between INR and the survival time of patients.
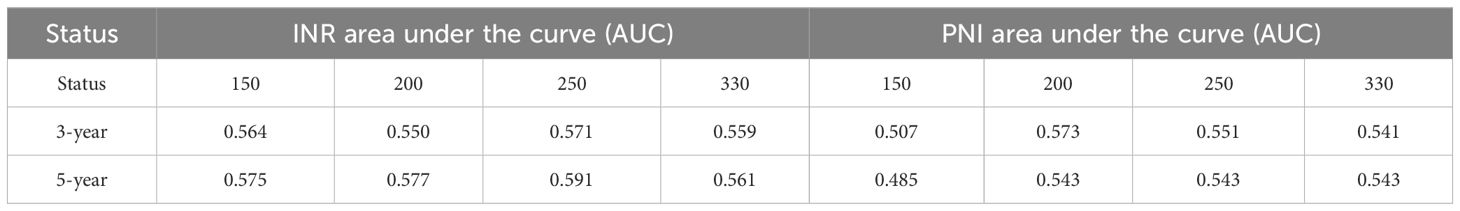
Table 4. Comparison between INR and PNI of different grouping data.
A Cox regression model was established with INR as the input variable and survival time as the output variable. In this study, “lifetime” refers to the time from surgical treatment to death from any cause. “Survival rate” refers to the percentage of patients who remained alive at predefined time points (e.g., 3-year and 5-year survival). The significant correlation between the model and the survival rate is shown in Table 5 (P = 0.015), indicating that the model has certain predictive values. The total data were divided into an experimental group (250 cases) and a test group (160 cases). 3-year and 5-year survival analyses of PNI and INR were performed (detailed results are shown in Tables 6 and 7). The threshold of PNI was determined to be 46.75 and that of INR was 0.905 based on the ROC curve. This approach was chosen to ensure optimal sensitivity and specificity for predicting 3-year and 5-year survival outcomes. Comparative analysis showed that in the high-concentration case, the 3-year and 5-year survival rates of the INR group were higher than those of the PNI group.
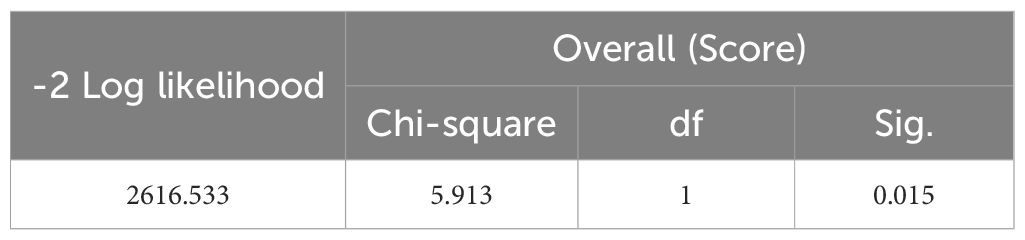
Table 5. Omnibus tests of model coefficients.
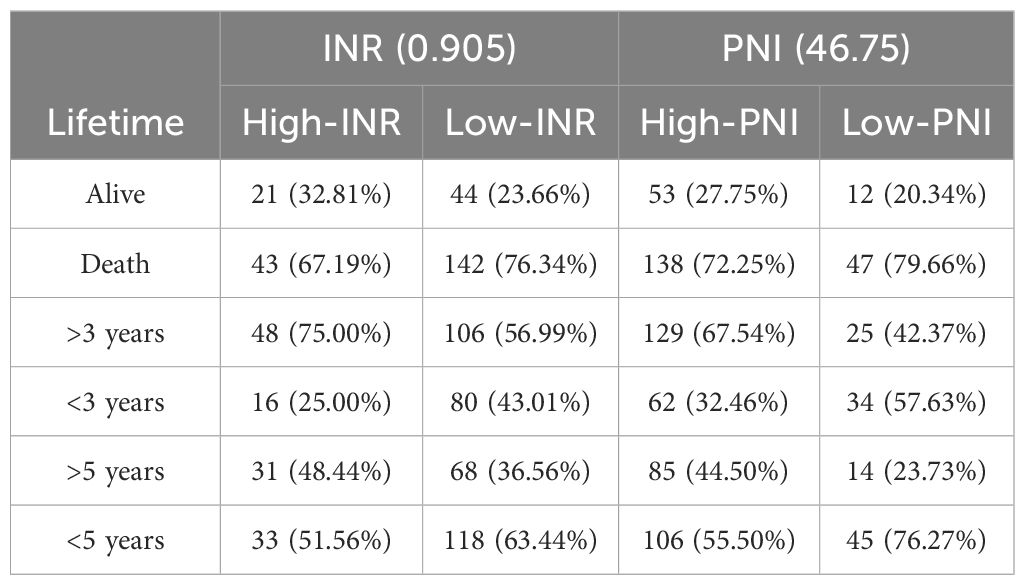
Table 6. Comparison of PNI and INR survival rates in the experimental group.
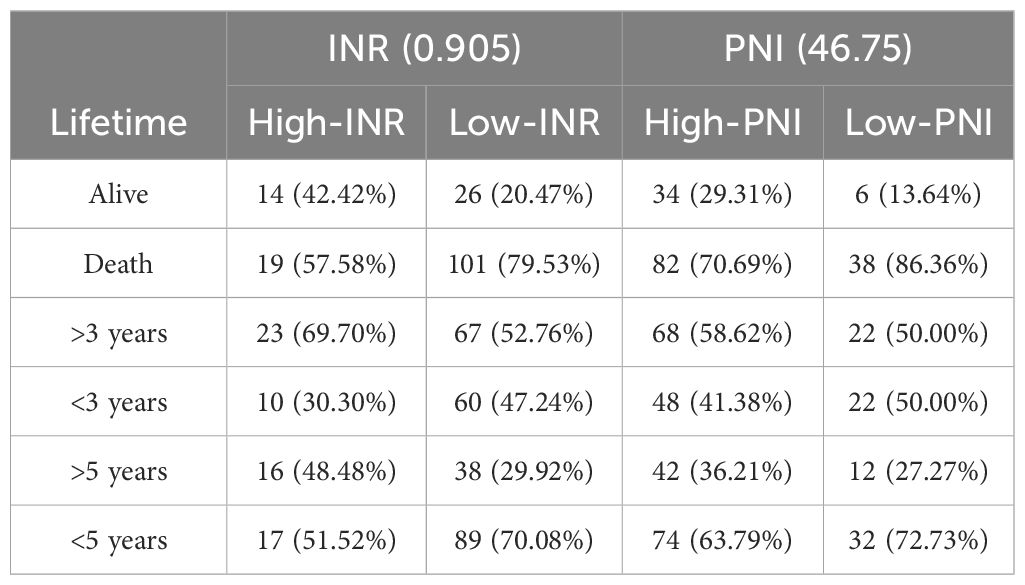
Table 7. Comparison of survival rate between PNI and INR in test group.
Further analysis by chi-square test found that both the INR concentration classification and the PNI concentration classification were significantly correlated with the survival classification P<0.05, detailed data are shown in Table 8), further verifying the importance of INR and PNI in evaluating the survival prognosis of esophageal cancer patients.
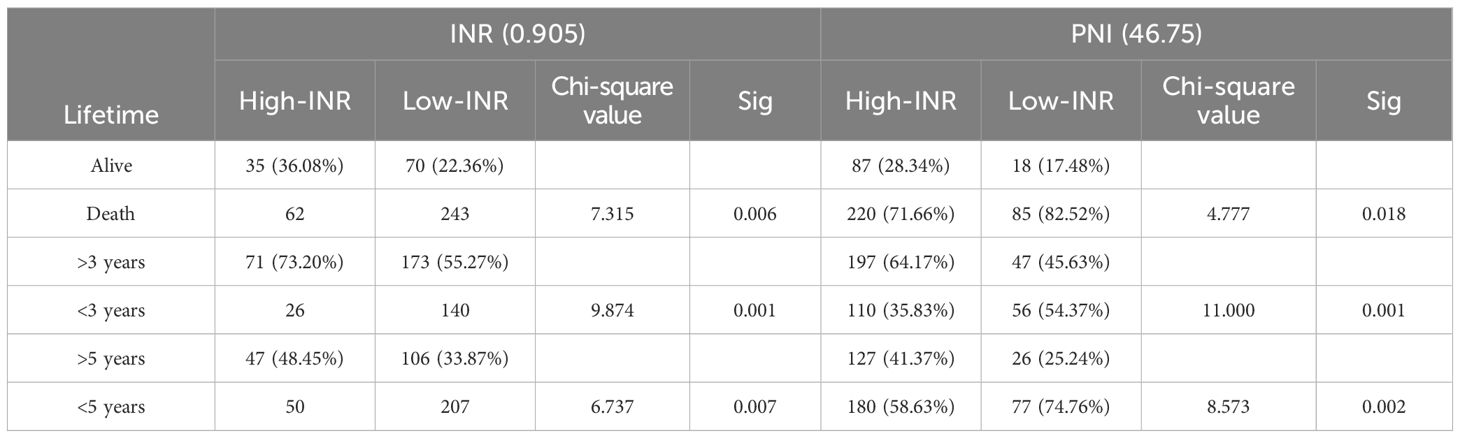
Table 8. Comparison of chi-square test between PNI and INR.
From a biological perspective, INR, as a crucial indicator reflecting blood coagulation function, plays a vital role in the tumor microenvironment. As shown in Figure 2, for different groups (high-INR, low-INR, high-PNI, low-PNI), the 3-year survival rate of the high-INR group was 73.20%, the 5-year survival rate was 48.45%, and the living rate was 36.08%; the 3-year survival rate of the low-INR group was 55.27%, the 5-year survival rate was 33.87%, and the living rate was 22.36%; the 3-year survival rate of the high-PNI group was 64.17%, the 5-year survival rate was 41.37%, and the living rate was 28.34%; the 3-year survival rate of the low-PNI group was 45.63%, the 5-year survival rate was 25.24%, and the living rate was 17.48%.
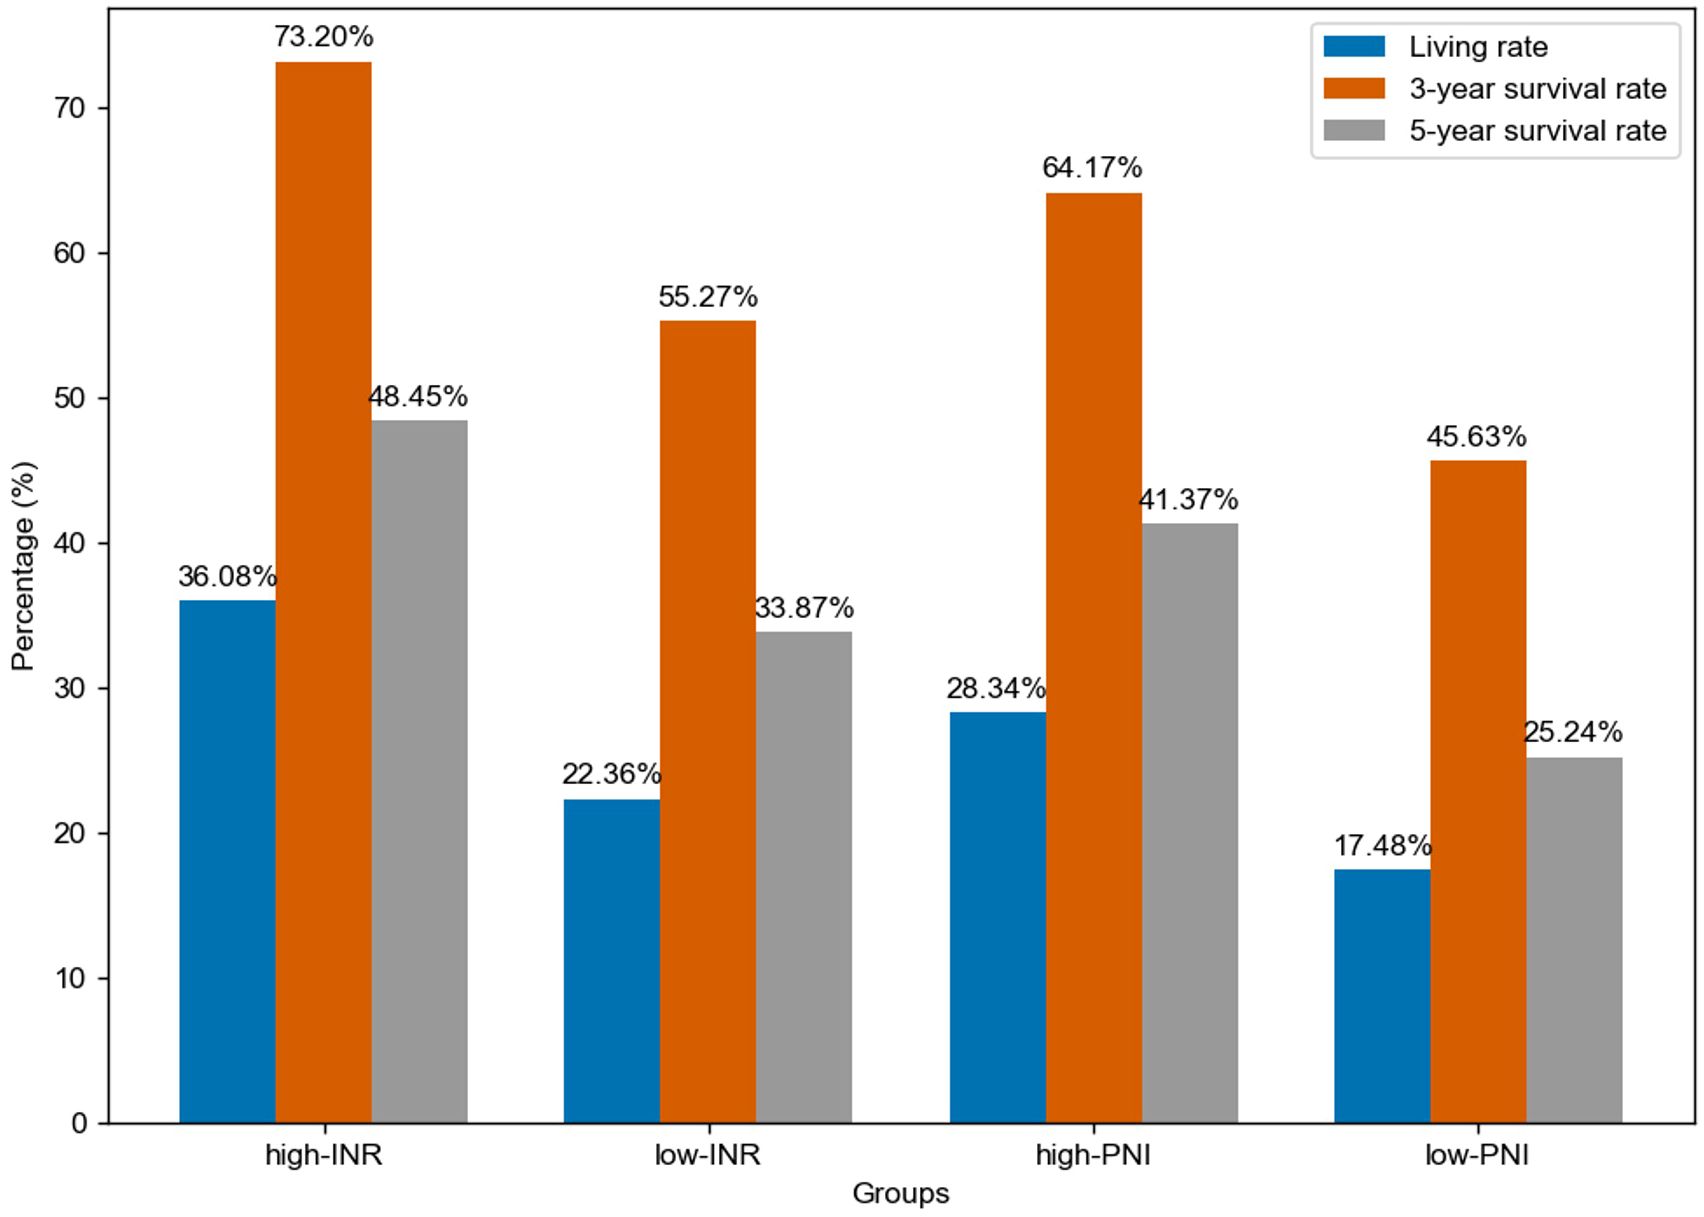
Figure 2. Comparison of survival rates between INR and PNI.
4 Discussion
Following the comparison of the survival rates associated with INR (International Normalized Ratio) and PNI (Prognostic Nutritional Index), further exploration of INR is warranted. A Kaplan-Meier (K-M) survival curve was plotted, as depicted in Figure 3. For the overall survival rate, there was significant difference between low-INR and high-INR (p = 0.030). The results indicated a significant correlation between INR classification and survival time.
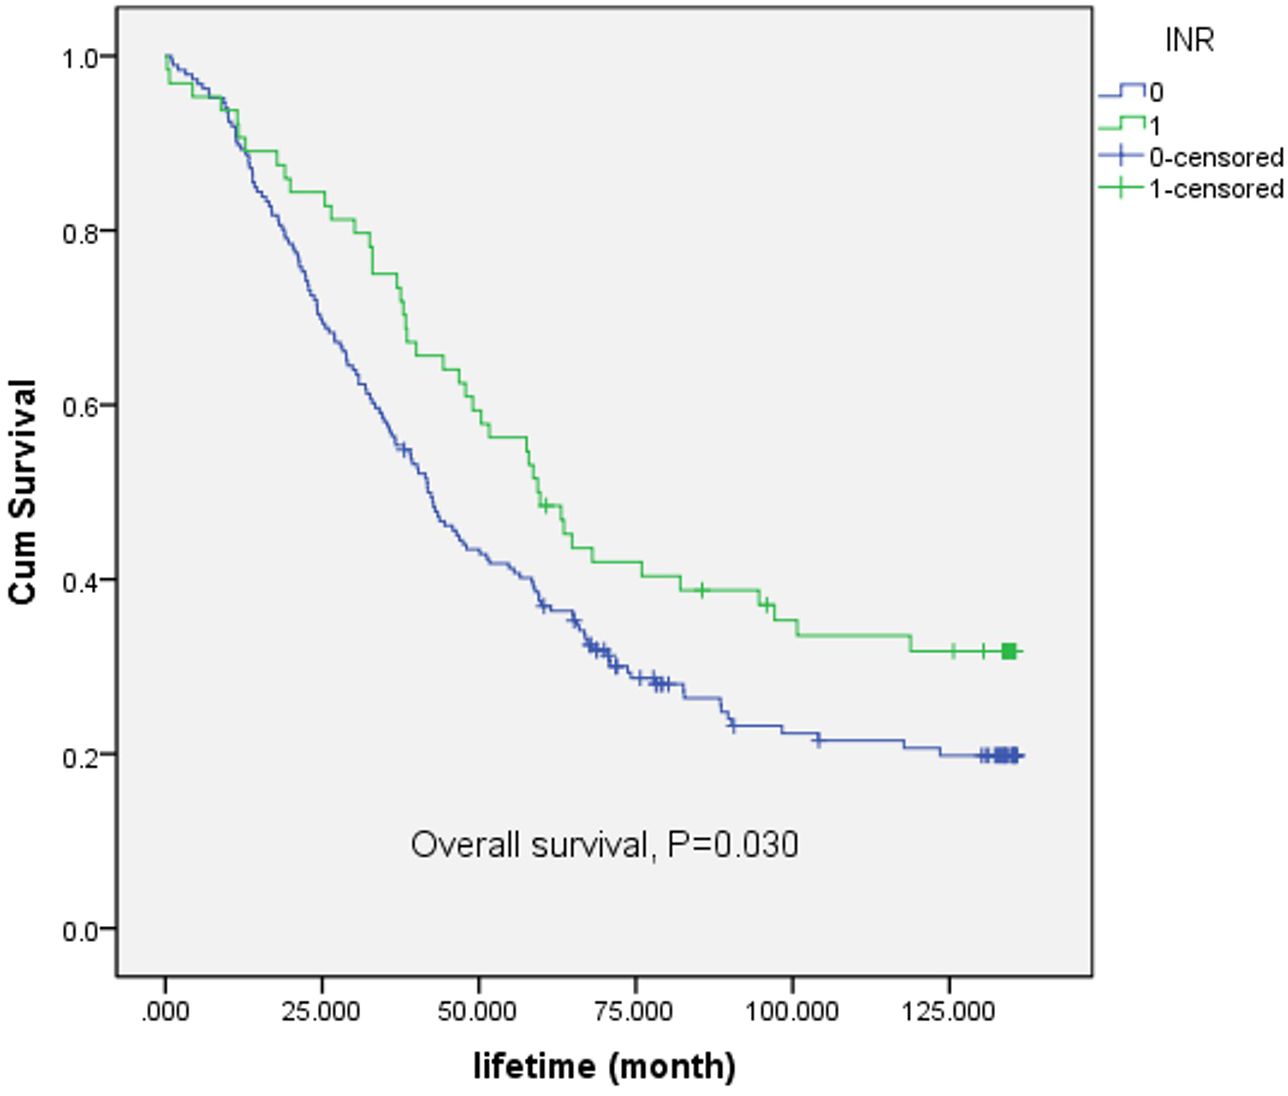
Figure 3. Survival analysis of INR. Low-INR is expressed by 0, high-INR is expressed by 1.
Based on the clinicopathological analysis of EC patients, clinicopathological characteristics were classified and cross-tested according to the high and low concentrations of INR, as presented in Table 9. Regarding staging of patients, TNM Staging was evaluated by postoperative histopathology. The results in Table 9 indicated that INR was significantly correlated with final differentiation, final infiltration, and final positive/negative status. When the test level was set at 90%, a significant correlation was also observed with the latest TNM stage of the eighth edition.
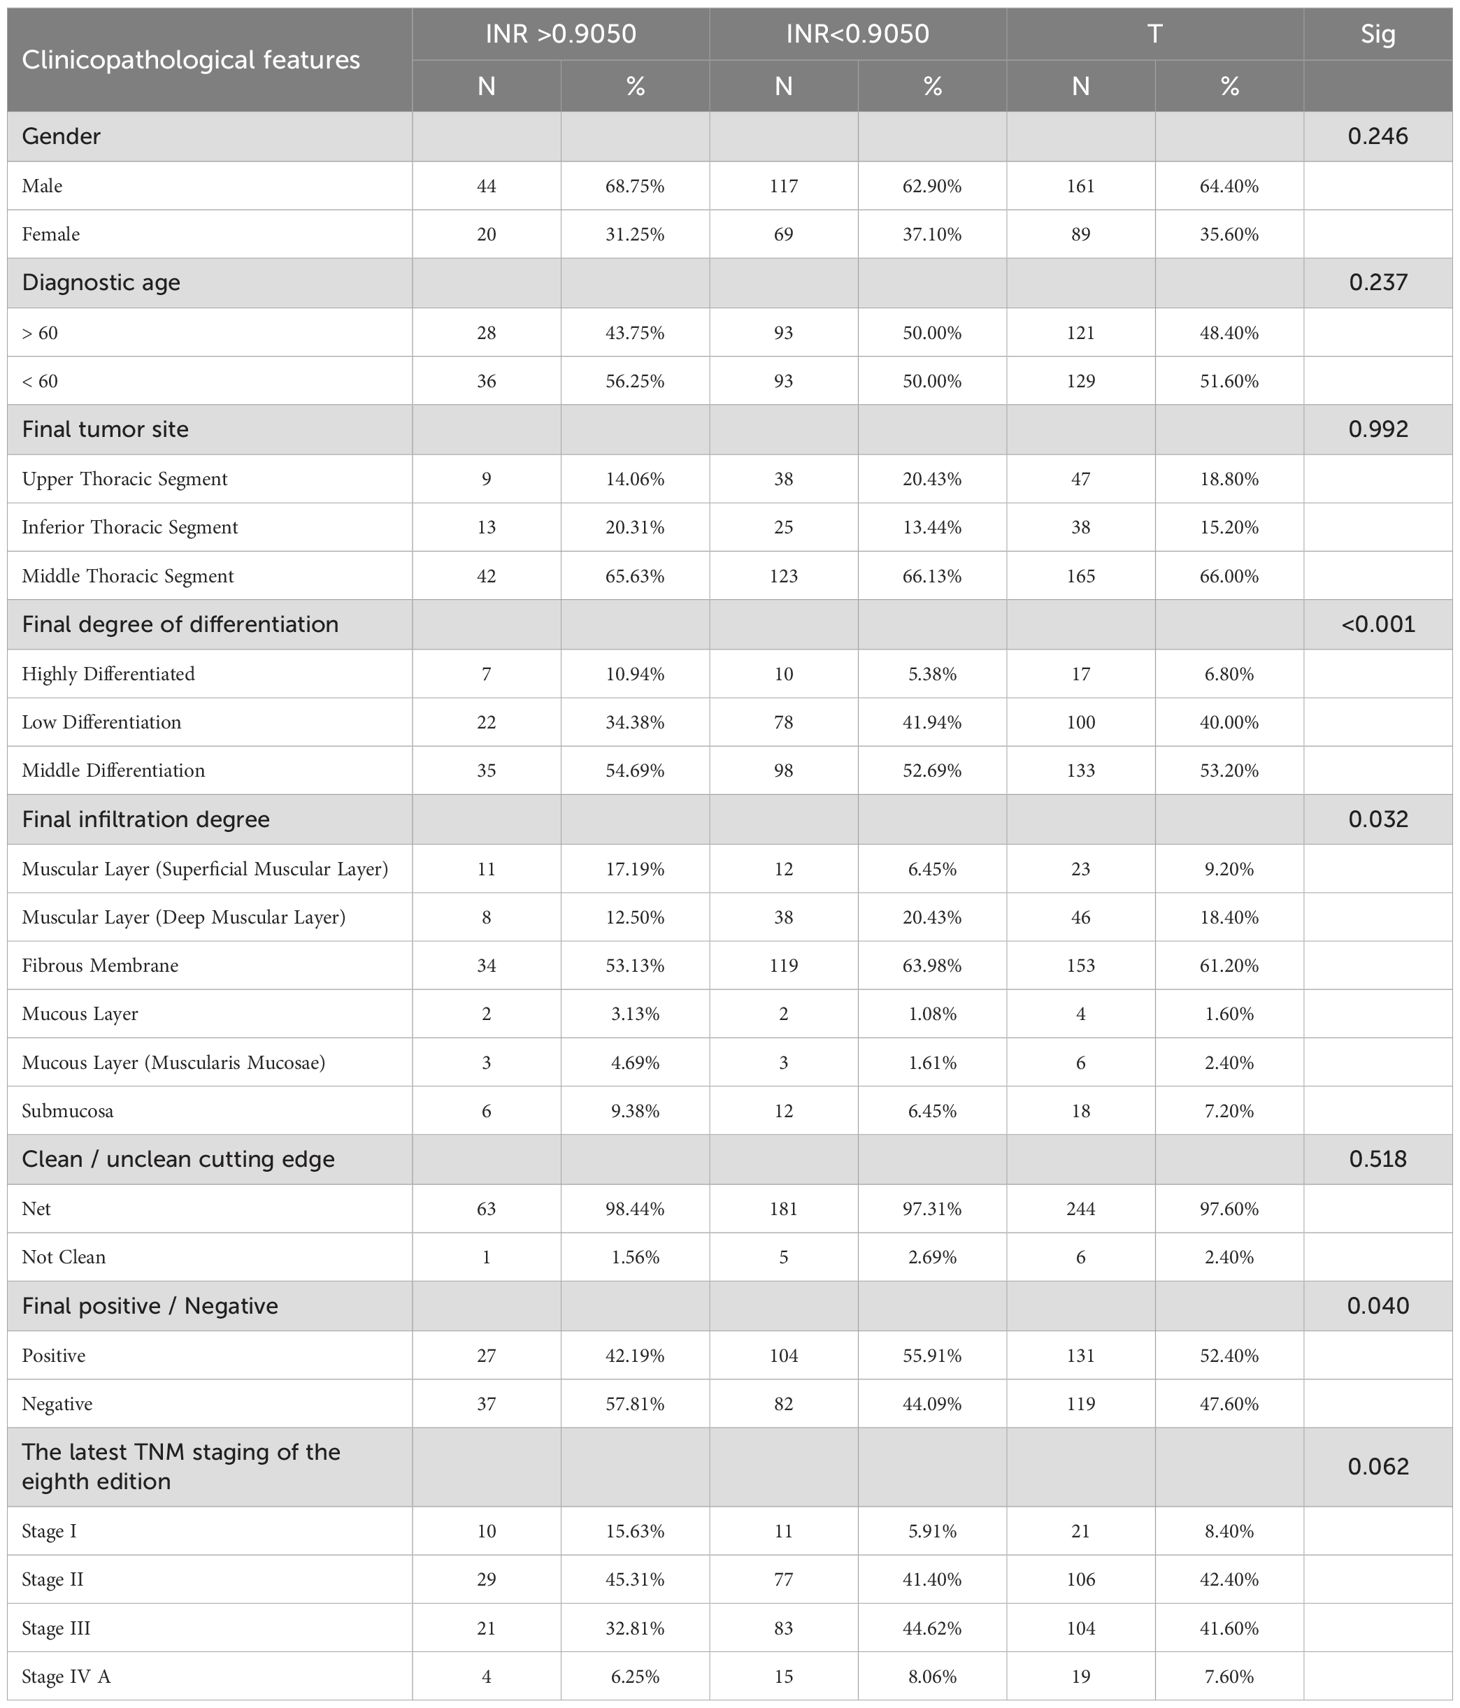
Table 9. Clinicopathological features of patients (INR).
Survival curves for final differentiation degree, final infiltration degree, and final positive/negative status were plotted, as shown in Figure 4. In Figure 4a, the survival rates of patients with high-grade differentiation exhibited greater fluctuations, while those with medium-grade and low-grade differentiation were relatively stable. Notably, the survival rate of patients with medium-grade differentiation was higher than that of those with low-grade differentiation. As depicted in Figure 4b, the survival rate of positive patients was lower than that of negative patients. In Figure 4c, 1–6 represent the fibrous membrane, muscular layer (superficial muscle layer), muscular layer (deep muscle layer), submucosa, mucosal layer (mucosal muscle layer), and mucosal layer, respectively.
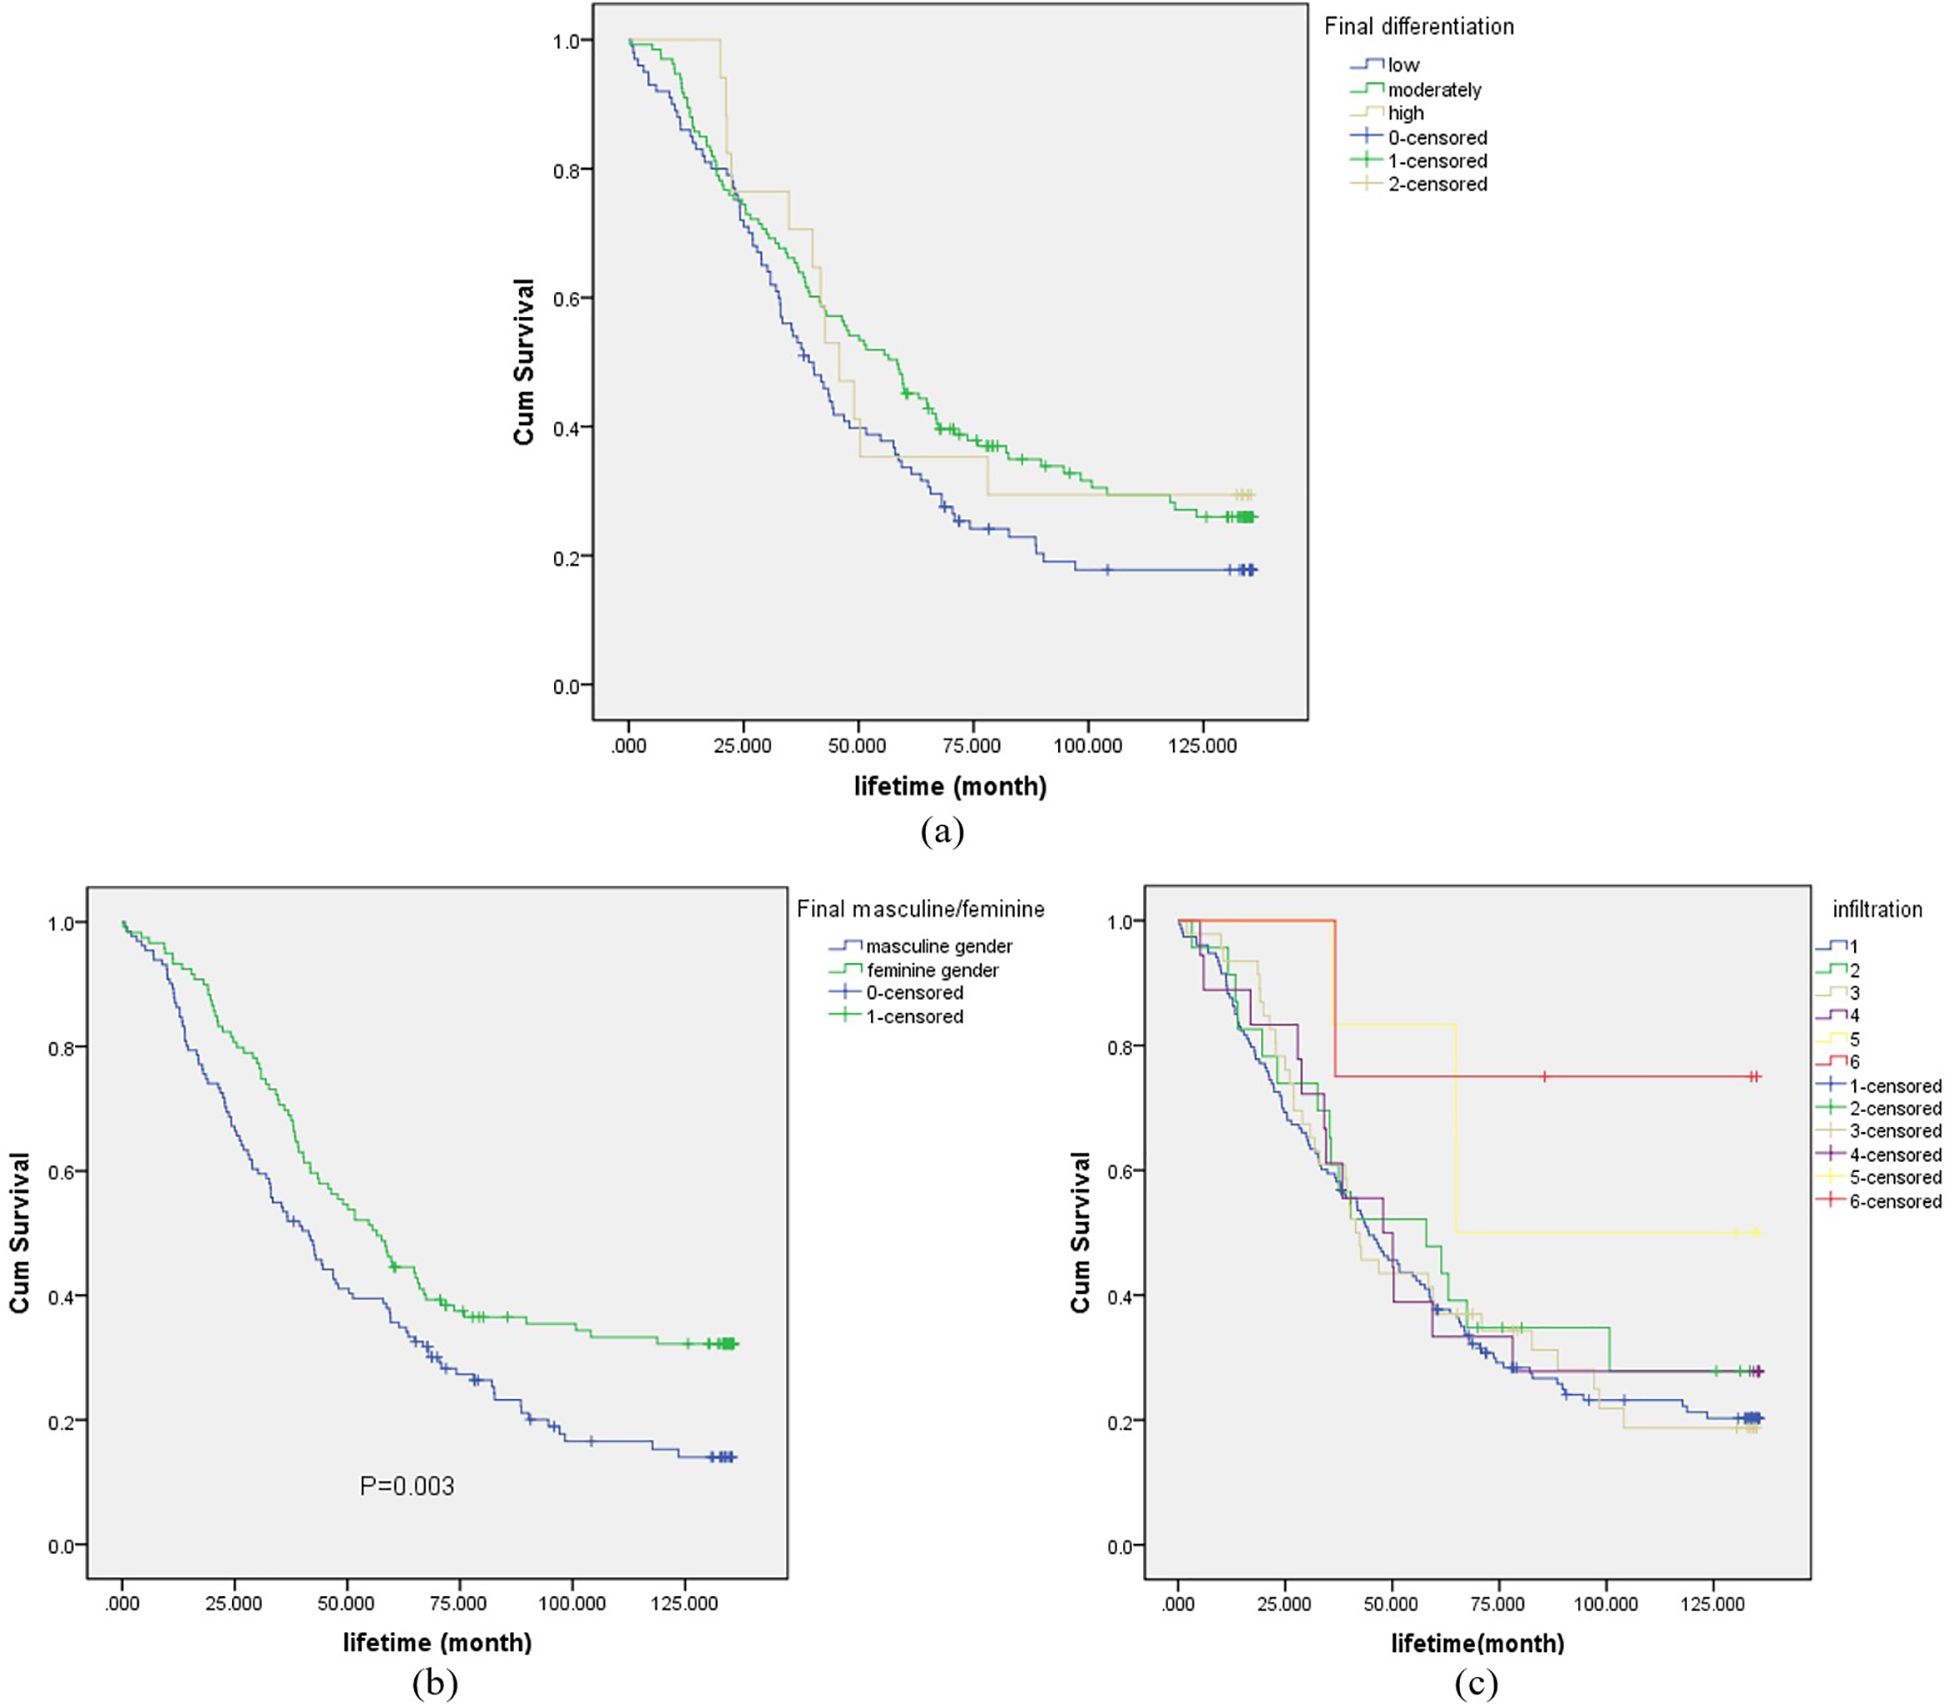
Figure 4. Survival curve for final differentiation degree (sub-figure a), final positive/negative (sub-figure b) and final infiltration degree (sub-figure c).
For the purpose of analysis, the fibrous membrane was designated as A, the muscular layer (superficial muscle layer) and the muscular layer (deep muscle layer) as B, and the submucosa, mucosal layer (mucosal muscle layer), and mucosal layer as C. As shown in Figure 5, the survival rate of layer C was the highest, with a significant value of p<0.001. When considering the TNM staging of EC and the degree of tumor invasion, it was evident that the survival rate of patients with early-stage EC was higher than that of patients with late-stage EC.
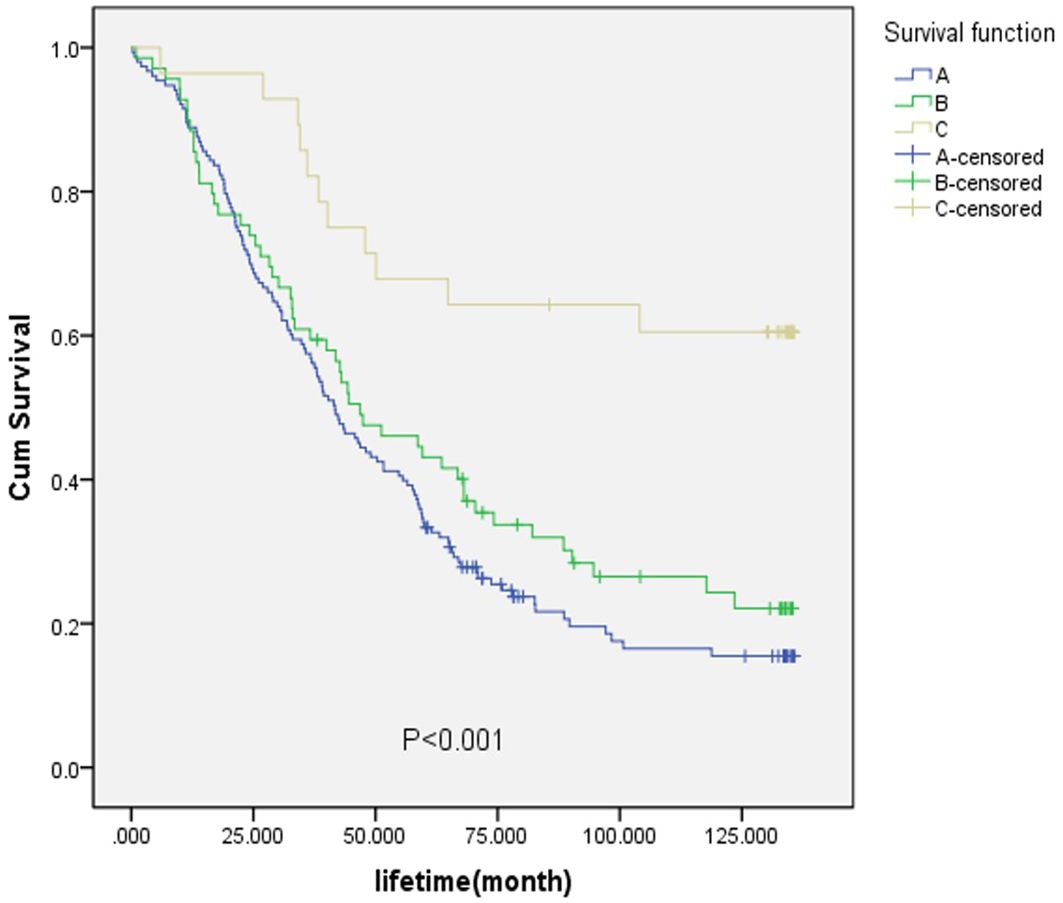
Figure 5. Ultimate infiltration degree graded survival curve.
The "Contrast figure" (Figure 6) illustrates the survival rates across six distinct grades, with lines representing the 3-year survival rate (in blue), the 5-year survival rate (in orange), and the living rate (in gray). The six-grade risk model presented in this study integrates key prognostic variables identified through adaptive Lasso and Cox regression. This semi-quantitative grading system was designed based on a combination of data-driven selection and clinical interpretability.
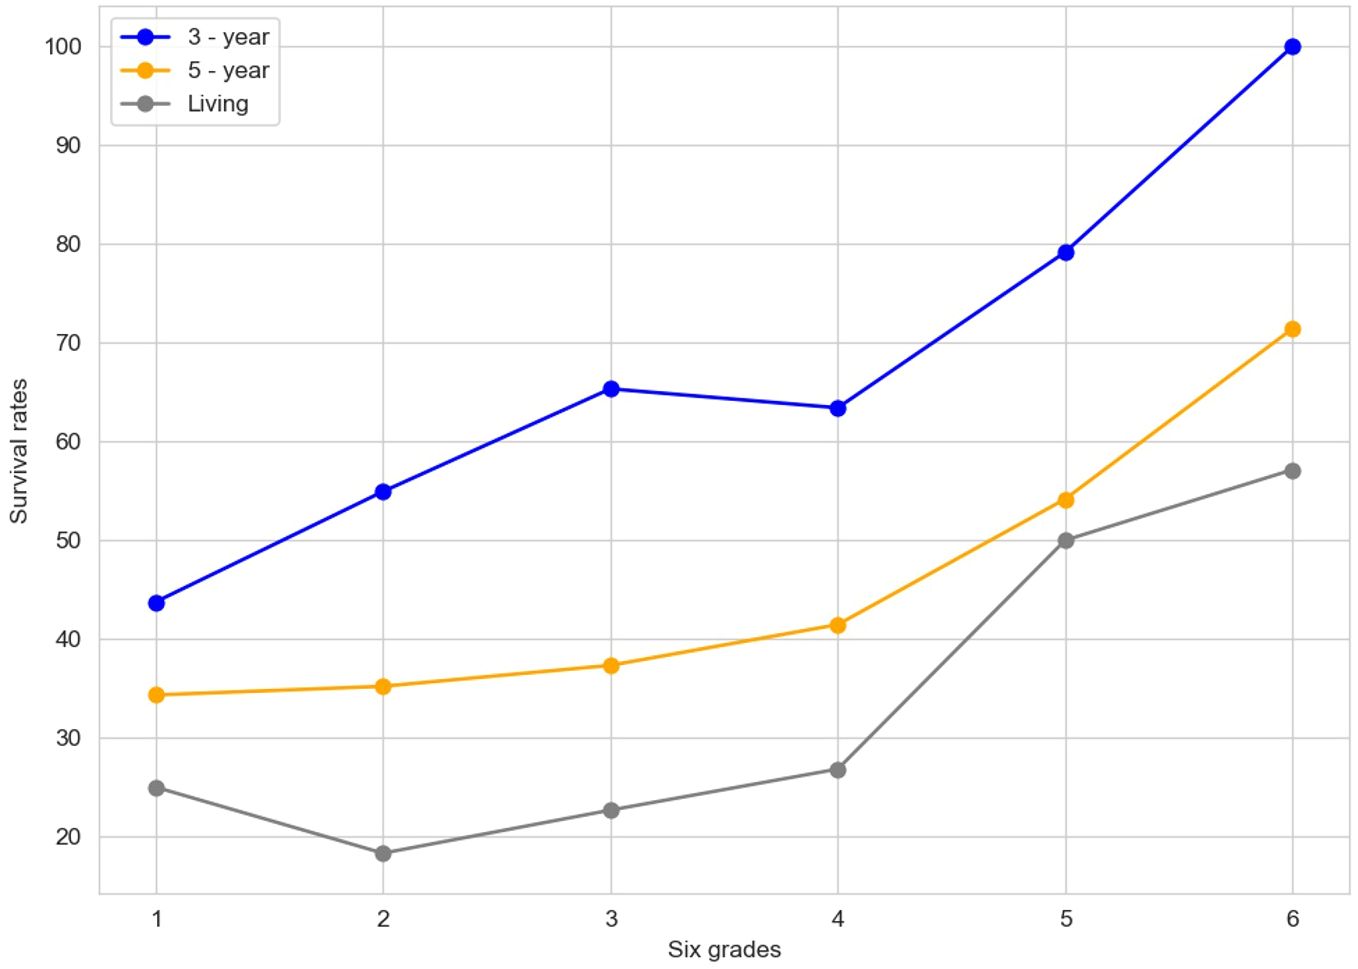
Figure 6. Lifetime grade line chart.
In the realm of constructing a risk model for esophageal cancer, as previously elaborated, several critical factors come into play. Variables such as the INR and the PNI have been central to our analysis. Through methodologies like the Adaptive Lasso and Cox regression analyses, INR has emerged as a key determinant significantly associated with patient survival time.
The six grades depicted in this figure likely encapsulate different strata of risk factors or clinicopathological features. For example, in the clinicopathological analysis of EC patients, elements such as final differentiation, final infiltration, and final positive/negative status, which exhibit a significant correlation with INR, could potentially underpin the definition of these grades.
The construction of these risk grades is likely a multifaceted process. INR, given its strong association with pivotal clinicopathological aspects like differentiation, infiltration, and positive/negative status, could play an important role. Generally, a higher INR is often associated with a more favorable risk grade. This is because a higher INR may align with better differentiation, reduced infiltration, and a negative status, all of which are typically linked to improved survival prospects. Additionally, other variables, such as PNI and various blood indicators initially considered in the model - building process, could contribute to the nuanced determination of these risk grades.
Visually, as we move from grade 1 to grade 6, the upward trend in the 3-year and 5-year survival rates, as well as the living rate, suggests that higher grades may signify a more favorable prognosis. This graphical representation provides a crucial visual cue for understanding how survival outcomes vary across different risk-grade categories, thereby facilitating the refinement and validation of the esophageal cancer risk model. It serves as a valuable tool for further research and clinical decision-making, enabling a more precise assessment of patient prognosis based on these risk-grade classifications.
It should be pointed out that although INR demonstrated statistical significance in survival prediction, the corresponding AUC values remained modest (mostly below 0.6), indicating limited discriminatory power. The INR-based model is intended as a complementary tool for risk stratification rather than a stand-alone decision-making metric. Due to the complexity and heterogeneity of EC prognosis, especially in surgical patients, even modest gains in discrimination may provide meaningful insights when combined with clinical judgment. This finding suggests that while INR holds prognostic value, it may be insufficient as a standalone marker. Future work should explore composite models that integrate INR with additional clinical, pathological, or molecular features to improve risk stratification performance.
5 Conclusion
In conclusion, this study aimed to construct a risk model for esophageal cancer by integrating the Adaptive Lasso and Cox regression models. Through a comprehensive analysis of 410 esophageal cancer patients' data, several significant findings were obtained.
The INR emerged as a key variable closely associated with the survival time of esophageal cancer patients. Multiple experimental analyses, including those using the Adaptive Lasso algorithm, consistently identified INR as a crucial factor. Clinicopathological analyses further revealed that INR was significantly correlated with important aspects such as final differentiation, final infiltration, and final positive/negative status of the tumors. This indicates that INR not only reflects the patient's coagulation function but also has profound implications for understanding the biological behavior of esophageal cancer.
Compared with the PNI, INR demonstrated unique advantages in predicting the survival prognosis of esophageal cancer patients, especially in high-concentration scenarios where the 3-year and 5-year survival rates of the INR group were higher. The Kaplan-Meier survival curve analysis also confirmed the significant correlation between INR classification and survival time, providing strong evidence for its role in prognosis evaluation.
However, it is important to acknowledge the limitations of this study. The sample size, although relatively large, may still have limitations in fully representing the diverse characteristics of the entire esophageal cancer patient population. The findings may not generalize to populations with different demographic or pathological characteristics, such as those in Western countries where adenocarcinoma predominates. Future research should strive to include a more extensive and diverse sample from different geographical regions and ethnic groups to enhance the generalizability of the findings. Moreover, due to the retrospective nature of the study and constraints in follow-up data, we used all-cause mortality rather than cancer-specific death as the endpoint. As such, the model predicts overall survival, which may be influenced by non-cancer-related comorbidities. Additionally, the current study focused mainly on blood-related indicators. Incorporating multi-omics data, such as gene expression and proteomics information, in future investigations could offer a more in-depth understanding of the molecular mechanisms underlying esophageal cancer development and further optimize the risk model.
Overall, this study has made a significant contribution by identifying INR as a potential biomarker for esophageal cancer risk assessment. The findings provide valuable insights for clinical practice, potentially enabling more accurate prognosis prediction and personalized treatment strategies for esophageal cancer patients. Continued research in this area is expected to further refine the risk model and improve the overall management of esophageal cancer.
Data availability statement
The raw data supporting the conclusions of this article will be made available by the authors, without undue reservation.
Ethics statement
The studies involving humans were approved by the Medical Ethics Committee of the First Affiliated Hospital of Zhengzhou University. The studies were conducted in accordance with the local legislation and institutional requirements. Written informed consent for participation was not required from the participants or the participants’ legal guardians/next of kin in accordance with the national legislation and institutional requirements.
Author contributions
XL: Conceptualization, Funding acquisition, Writing – original draft, Writing – review & editing. GH: Investigation, Software, Writing – review & editing. YY: Investigation, Methodology, Validation, Writing – review & editing. EL: Formal Analysis, Supervision, Visualization, Writing – review & editing, Writing – original draft.
Funding
The author(s) declare that financial support was received for the research and/or publication of this article. This work was supported in part by Henan Province Youth Project of Medical Science and Technology Research Plan (grant no. SBGJ202403026) and Henan Province Key Scientific Research Projects of Universities (grant no. 25A320067).
Conflict of interest
The authors declare that the research was conducted in the absence of any commercial or financial relationships that could be construed as a potential conflict of interest.
Generative AI statement
The author(s) declare that no Generative AI was used in the creation of this manuscript.
Publisher’s note
All claims expressed in this article are solely those of the authors and do not necessarily represent those of their affiliated organizations, or those of the publisher, the editors and the reviewers. Any product that may be evaluated in this article, or claim that may be made by its manufacturer, is not guaranteed or endorsed by the publisher.
References
1. Liu CQ, Ma YL, Qin Q, Wang PH, Luo Y, Xu PF, et al. Epidemiology of esophageal cancer in 2020 and projections to 2030 and 2040. Thorac Cancer. (2023) 14:3–11. doi: 10.1111/1759-7714.14745
2. Zhu H, Ma X, Ye T, Wang H, Wang Z, Liu Q, et al. Esophageal cancer in China: practice and research in the new era. Int J Cancer. (2023) , 152:1741–51. doi: 10.1002/ijc.34301
3. Kong X, Liu P, Wang G, Sun S, and Li L. Methods for diagnosing malnutrition in patients with esophageal cancer, and the association with nutritional and inflammatory indices: A cross−sectional study. Oncol Lett. (2025) 29:223. doi: 10.3892/ol.2025.14969
4. Yi HC and Hong BZ. High Prevalence of malnutrition and associated factors in newly diagnosed upper gastrointestinal cancer patients: A cross-sectional study. Asian Pacific J Cancer Care. (2024) 9:267–75. doi: 10.31557/apjcc.2024.9.2.267-275
5. Yagi T, Baba Y, Okadome K, Kiyozumi Y, Hiyoshi Y, Ishimoto T, et al. Tumour-associated macrophages are associated with poor prognosis and programmed death ligand 1 expression in oesophageal cance. Eur J Cancer. (2019) 111:38–49. doi: 10.1016/j.ejca.2019.01.018
6. Li Y, Pond G, Van Osch A, Reed R, Ung Y, Cheng S, et al. Enhancing nutrition support for esophageal cancer patients: Understanding factors influencing feeding tube utilization. Nutr Cancer. (2024) 76:271–8. doi: 10.1080/01635581.2024.2301796
7. Walterbos NR, Fiocco M, Neelis KJ, van der Linden YM, Langers AM, Slingerland M, et al. Effectiveness of several external beam radiotherapy schedules for palliation of esophageal cancer. Clin Trans Radiat Oncol. (2019) 17:24–31. doi: 10.1016/j.ctro.2019.04.017
8. Wang SM, Abnet CC, and Qiao YL. What have we learned from Linxian esophageal cancer etiological studies? Thorac Cancer. (2019) 10:1036–42. doi: 10.1111/1759-7714.13058
9. Huang G, Wang Q, and Tang X. Changes and relationship in nutrition impact symptoms, malnutrition during esophageal cancer treatment. Int J Radiat Oncology Biology Phys. (2023) 117:e394–5. doi: 10.1016/j.ijrobp.2023.06.1520
10. Gottlieb-Vedi E, Kauppila JH, Malietzis G, Nilsson M, Markar SR, and Lagergren J. Long-term survival in esophageal cancer after minimally invasive compared to open esophagectomy: a systematic review and meta-analysis. Ann Surg. (2019) 270:1005–17. doi: 10.1097/SLA.0000000000003252
11. Xu J, Cao J, Wang Y, Yao X, Wang Y, He Z, et al. Novel preoperative nutritional assessment tool and prognostic model for ESCC patients. J Cancer. (2019) 10:3883. doi: 10.7150/jca.31286
12. Liu C, Yang J, Dong W, and Yuan J. Effects of probiotics on gastrointestinal complications and nutritional status of postoperative patients with esophageal cancer: a protocol of randomized controlled trial. Medicine. (2021) 100:e25138. doi: 10.1097/MD.0000000000025138
13. Jia Y, Xing J, Li Y, Du J, and Li L. A systematic review and meta-analysis of nursing effect of fast-track recovery surgery on patients undergoing total endoscopic resection of esophageal cancer: fast-track recovery surgery vs. nursing care as usual. J Gastrointestinal Oncol. (2023) 14:35645–61. doi: 10.21037/jgo-23-101
14. Cao Y, Han D, Zhou X, Han Y, Zhang Y, and Li H. Effects of preoperative nutrition on postoperative outcomes in esophageal cancer: a systematic review and meta-analysis. Dis Esophagus. (2022) 35:.doab028. doi: 10.1093/dote/doab028
15. Hamed RI. Esophageal cancer prediction based on qualitative features using adaptive fuzzy reasoning method. J King Saud University-Computer Inf Sci. (2015) 27:129–39. doi: 10.1016/j.jksuci.2014.06.013
16. Huang J, Koulaouzidis A, Marlicz W, Lok V, Chu C, Ngai CH, et al. Global burden, risk factors, and trends of esophageal cancer: an analysis of cancer registries from 48 countries. Cancers. (2021) 13:141. doi: 10.3390/cancers13010141
17. Shang J, Dong W, Huang P, Sun Y, He Y, Li H, et al. Development of a nutritional screening and assessment indicator system for patients with esophageal cancer in China: Findings from the Delphi method. Cancer Med. (2023) 12:21240–55. doi: 10.1002/cam4.6703
18. Gu Y, Liu M, Wang A, He D, Sun H, Cui X, et al. Analysis of factors influencing hospitalization expenses of patients with gastric cancer in Shanghai, 2014-2021: Based on grey relational analysis and structural equation modeling. Value Health Regional Issues. (2024) 44:101029. doi: 10.1016/j.vhri.2024.101029
19. White A, Kucukak S, Lee DN, Mazzola E, Zhang Y, and Swanson SJ. Ivor Lewis minimally invasive esophagectomy for esophageal cancer: an excellent operation that improves with experience. J Thorac Cardiovasc Surg. (2019) 157:.783–789. doi: 10.1016/j.jtcvs.2018.10.038
20. Sahu PK and Fatma T. Optimized breast cancer classification using PCA-LASSO feature selection and ensemble learning strategies with optuna optimization. IEEE Access. (2025) 13:35645–61. doi: 10.1109/ACCESS.2025.3539746
21. Li Y, Lu F, and Yin Y. Applying logistic LASSO regression for the diagnosis of atypical Crohn's disease. Sci Rep. (2022) 12:11340. doi: 10.1038/s41598-022-15609-5
22. Wang S, Chen Y, Cui Z, Lin L, and Zong Y. Diabetes risk analysis based on machine learning LASSO regression model. J Theory Pract Eng Sci. (2024) 4:58–64. doi: 10.53469/jtpes.2024.04(01).08
23. Ullah T, Ullah SI, Ullah K, Ishaq M, Khan A, Ghadi YY, et al. Machine learning-based cardiovascular disease detection using optimal feature selection. IEEE Access. (2024) 12:16431–46. doi: 10.1109/access.2024.3359910
24. Guo Y, Li L, Zheng K, Du J, Nie J, Wang Z, et al. Development and validation of a survival prediction model for patients with advanced non-small cell lung cancer based on LASSO regression. Front Immunol. (2024) 15:1431150. doi: 10.3389/fimmu.2024.1431150
25. Sun S, Wang J, Yang B, Wang Y, Yao W, Yue P, et al. A nomogram for evaluation and analysis of difficulty in retroperitoneal laparoscopic adrenalectomy: a single-center study with prospective validation using LASSO-logistic regression. Front Endocrinol. (2022) 13:1004112. doi: 10.3389/fendo.2022.1004112
26. Hu J, Zhang J, Li D, Hu X, Li Q, Wang W, et al. Predicting hypovitaminosis C with LASSO algorithm in adult critically ill patients in surgical intensive care units: a bi-center prospective cohort study. Sci Rep. (2024) 14:5073. doi: 10.1038/s41598-024-54826-y
27. Wu Q, Yang C, Huang C, and Lin Z. Screening key genes for intracranial aneurysm rupture using LASSO regression and the SVM-RFE algorithm. Front Med. (2025) 11:1487224. doi: 10.3389/fmed.2024.1487224
28. Ogundimu EO. On Lasso and adaptive Lasso for non-random sample in credit scoring. . Stat Model. (2024) 24:115–38. doi: 10.1177/1471082x221092181
Keywords: risk modeling, esophageal cancer, post-surgical patients, adaptive Lasso, regression analysis
Citation: Li X, Han G, Yang Y and Liang E (2025) Risk modeling for esophageal cancer based on adaptive Lasso and Cox regression. Front. Oncol. 15:1609540. doi: 10.3389/fonc.2025.1609540
Received: 10 April 2025; Accepted: 11 July 2025;
Published: 01 August 2025.
Edited by:
Yan Zheng, Henan Provincial Cancer Hospital, ChinaReviewed by:
Connor J. Wakefield, Rush University, United StatesXiaoran Li, University of Texas MD Anderson Cancer Center, United States
Lingfei Wang, Harbin Engineering University, China
Copyright © 2025 Li, Han, Yang and Liang. This is an open-access article distributed under the terms of the Creative Commons Attribution License (CC BY). The use, distribution or reproduction in other forums is permitted, provided the original author(s) and the copyright owner(s) are credited and that the original publication in this journal is cited, in accordance with accepted academic practice. No use, distribution or reproduction is permitted which does not comply with these terms.
*Correspondence: Enhao Liang, ZW5oYW9saWFuZ19lZHVAMTYzLmNvbQ==