Abstract
Objective:
This study aimed to develop and validate a prognostic nomogram to identify uterine sarcoma (US) patients who may not require adjuvant therapy after surgery, based on data from the Surveillance, Epidemiology, and End Results (SEER) database and an external Asian cohort.
Methods:
Data from eligible uterine sarcoma patients in the USA (n = 1,626) who met the criteria of this study were collected from the SEER database and randomly divided into a training cohort (n = 1,138) and an internal validation cohort (n = 488). Multivariate Cox regression, Lasso regression, and crossvalidation were performed to select the optimal variables associated with survival. A nomogram-based model was then constructed to stratify the recurrence risk thresholds for the assessed patients. An external dataset from a separate cohort at our hospital (n = 90) was used to validate the accuracy and specificity of the nomogram model in discriminating patient risks, utilizing the consistency index (C-index), receiver operating characteristic (ROC) curves, calibration curves, and decision curve analysis (DCA).
Results:
Using the aforementioned classification aggregation methods, analysis of the training cohort identified diagnostic age, Fédération Internationale de Gynécologie et d'Obstétrique (FIGO) stage, grade, tumor size, and peritoneal cytology as independent predictors of overall survival (OS). The subsequent risk model demonstrated that patients with a threshold below 55 had a 10-year survival rate exceeding 80%, suggesting they may not require postoperative adjuvant therapy. Internal validation confirmed the reliability of this multiparameter model, as evidenced by a C-index of 0.77 and ROC AUC values of 0.812, 0.824, and 0.839 for 1-, 3-, and 5-year OS, respectively. Similarly, accuracy and specificity were confirmed by the external validation cohort, with a C-index exceeding 0.83, reaching a peak of 0.9, and ROC AUC values greater than 0.876. These results highlight that the stratified thresholds displayed by our nomogram outperformed FIGO staging in identifying low-risk recurrence patients.
Conclusion:
Our constructed multiparameter nomogram model appears to be superior to the FIGO staging system in identifying low-risk patients who do not require adjuvant therapy after surgery, although prospective data are required for further validation.
1 Introduction
Uterine sarcomas are rare mesenchymal malignant tumors; their incidence among uterine corpus cancers is only three to seven cases per 100,000 (1). There are several pathological types of uterine sarcoma, including leiomyosarcoma (LMS), low-grade endometrial stromal sarcoma (LG-ESS), high-grade endometrial stromal sarcoma (HG-ESS), undifferentiated endometrial sarcoma (UES), rhabdomyosarcoma (RMS), and adenosarcoma (MA), among others. Patients with different pathological types have distinct prognoses and treatments (2). Up to 58.8% of patients are diagnosed with malignant sarcoma through postoperative pathology, and clinical and radiological criteria often make it challenging to differentiate leiomyomas from malignant uterine tumors (3, 4).
Nowadays, surgical resection remains the most effective curative treatment. Patients typically undergo individualized therapy, which may include surgery and follow-up chemoradiotherapy (5). Omura et al. enrolled 156 postoperative uterine sarcoma (US) patients with stage I or stage II disease and administered Adriamycin for 6 months or no further treatment.
Unfortunately, no significant differences were observed in progression-free survival (PFS) and overall survival (OS) (6). In the SARCGYN phase III study, Pautier et al. compared polychemotherapy followed by pelvic radiotherapy and radiotherapy alone in 81 patients. There was no statistical significance in 3-year OS, and the combination treatment was associated with a higher incidence of grades 3–4 toxicity (7). Therefore, we aim to build a prognostic model to more accurately identify patients who do not require adjuvant therapy after surgery and those who need aggressive adjuvant therapy.
Zivanovic et al. found that, in patients with uterine leiomyosarcoma, American Joint Committee on Cancer and Fédération Internationale de Gynécologie et d'Obstétrique staging had their advantages in predicting the prognosis of patients with early- or late-stage disease, but neither was accurate enough. Inaccurate prognostic judgments can influence treatment choice, and the nomogram showed a more pronounced predictive advantage than traditional staging (8). A nomogram can more accurately assess the course of the disease and help physicians better identify patients who may achieve prolonged survival from postoperative adjuvant therapy (9). The increasing application of nomograms for predicting survival outcomes is becoming important across various types of tumors (10–14).
Thus far, some studies have developed nomograms for patients with uterine sarcoma. Cao et al. identified age, race, marital status, tumor primary site, stage, and grade as variables for building a nomogram (15). Li et al. constructed a nomogram using age at diagnosis, surgery status, Surveillance, Epidemiology, and End Results (SEER) stage, American Joint Committee on Cancer (AJCC) stage, histological grade, chemotherapy, insurance record, tumor size, race, radiotherapy, and marital status (16).
This study explored the impact of lymph node dissection during surgery, postoperative adjuvant treatment, and demographic factors on patient survival. We used only four variables to build a model that could predict the survival probability of 1-, 3-, and 5-year overall survival in Asians.
2 Materials and methods
2.1 Date sources
Our research was based on data from public databases and retrospective hospital records. The SEER database is a publicly accessible, authoritative tumor registry widely used in clinical research, containing information on millions of cancer patients in the USA, including age at onset, age at death, primary tumor site, surgical details, treatment information, and demographic characteristics. In this study, we extracted patient data from the SEER database using SEER*Stat software (version 8.4.0.1; http://seer.cancer.gov/), account number 15006-Nov2021, for cases diagnosed between 1 January 2010 and 31 December 2019. Additionally, we obtained an external validation set from Tongji Hospital, Huazhong University of Science and Technology (THAHUST), using the hospital’s electronic medical record system, for cases diagnosed between 1 January 2009 and 31 December 2018.
2.2 Patient selection
We retrieved a total of 1,626 available cases from the SEER database. We also identified 90 cases for an external validation set in THAHUST’s electronic medical record system. Patient data were collected based on the following criteria: (1) download data from the SEER database according to ICD-O-3.2 morphological code, including ICD-O-3 8714/3: perivascular epithelioid cell tumors, ICD-O-38896/3: mycinous leiomyosarcoma, ICD-O-3 8805/3: undifferentiated uterine sarcoma, ICD-O-38900/3: rhabdomyosarcoma, ICD-O-3 8890/3: leomyosarcoma, ICD-O-3 8891/3: epithelial leiomyosarcoma, ICD-O-3 8930/3: high-grade endometrial stromal sarcoma, ICD-O-3 8931/3: low-grade endometrial stromal sarcoma, ICD-O-3 8933/3: rhabdomyosarcoma. It should be noted that carcinosarcoma should not be included.
According to the WHO Classification of Tumors of the Female Genital Organs (fourth edition, 2014), carcinosarcoma is clearly classified as “metaplastic carcinoma” and placed under the category of endometrial cancer rather than mesenchymal tumors (17). (2) All patients were identified by pathological examination as first primary tumors, (3) underwent surgical resection, (4) had complete postoperative pathological data and general clinical characteristics, and (5) had complete follow-up data. The exclusion criteria were (1) not being the first or only primary malignancies and (2) patients with insufficient information.
2.3 Statistical analysis
Patient survival information was quantified using OS, which is defined as the time from the surgical pathological diagnosis to the date of last follow-up or death from any cause. The clinicopathological factors we collected, which may be related to patient survival, included age at diagnosis, FIGO stage, radiotherapy, chemotherapy, race, marital status, pathology, tumor grade, peritoneal cytology, pelvic lymph node log odds of positive lymph node (LODDS) grade, paraaortic lymph node LODDS grade, and tumor size. For constructing and validating the nomogram, the 1,626 patients collected from the SEER database were randomly assigned as the training set (n = 1,138) and internal validation set (n = 488) in a 7:3 split ratio, while a total of 90 cases collected from THAHUST served as an external validation set. Continuous variables, including age at diagnosis, tumor size, and lymph node LODDS grade, were analyzed using R Studio 4.2.2 (http://www.rstudio.com/) with the “survivalROC” and “survminer” packages to obtain optimal cut-off values in the training set. Categorical variables were presented as numbers with percentages. The demographic and clinical characteristic distributions between the training and validation sets were compared using the Chi-square test with SPSS. Modeling variables were obtained by univariate and multivariable Cox regression, as well as Lasso regression, and prognostic models based on the identified independent prognostic factors.
We calculated the consistency index (C-index), the area under the time-dependent receiver operating characteristic (ROC) curve (AUC) to evaluate the predictive accuracy of the nomogram. The predictive accuracy (discrimination) of a nomogram is measured by the C-index, which quantifies the level of agreement between the predicted probability and the actual probability of an event of interest occurring (18).
A C-index and AUC value above 0.90 indicate high predictive power, while values between 0.71 and 0.90 suggest moderate discrimination. We plotted a calibration curve to evaluate the model and assess potential overfitting using 1,000 bootstrap resamples. The DCA provides a clear answer to which model will bring the most significant clinical benefit, on average, to the right patient, comparing the constructed nomogram with the net clinical benefit of FIGO staging by the DCA.
Finally, the total score of each patient was calculated based on the variable scores in the nomogram. The patients were stratified into a high-risk group, a medium-risk group, and a low-risk group based on the 5-year survival probability. The Kaplan–Meier curve for OS was plotted according to risk grouping, and log-rank tests were conducted in the training and validation sets. The research process is shown in Figure 1.
Figure 1
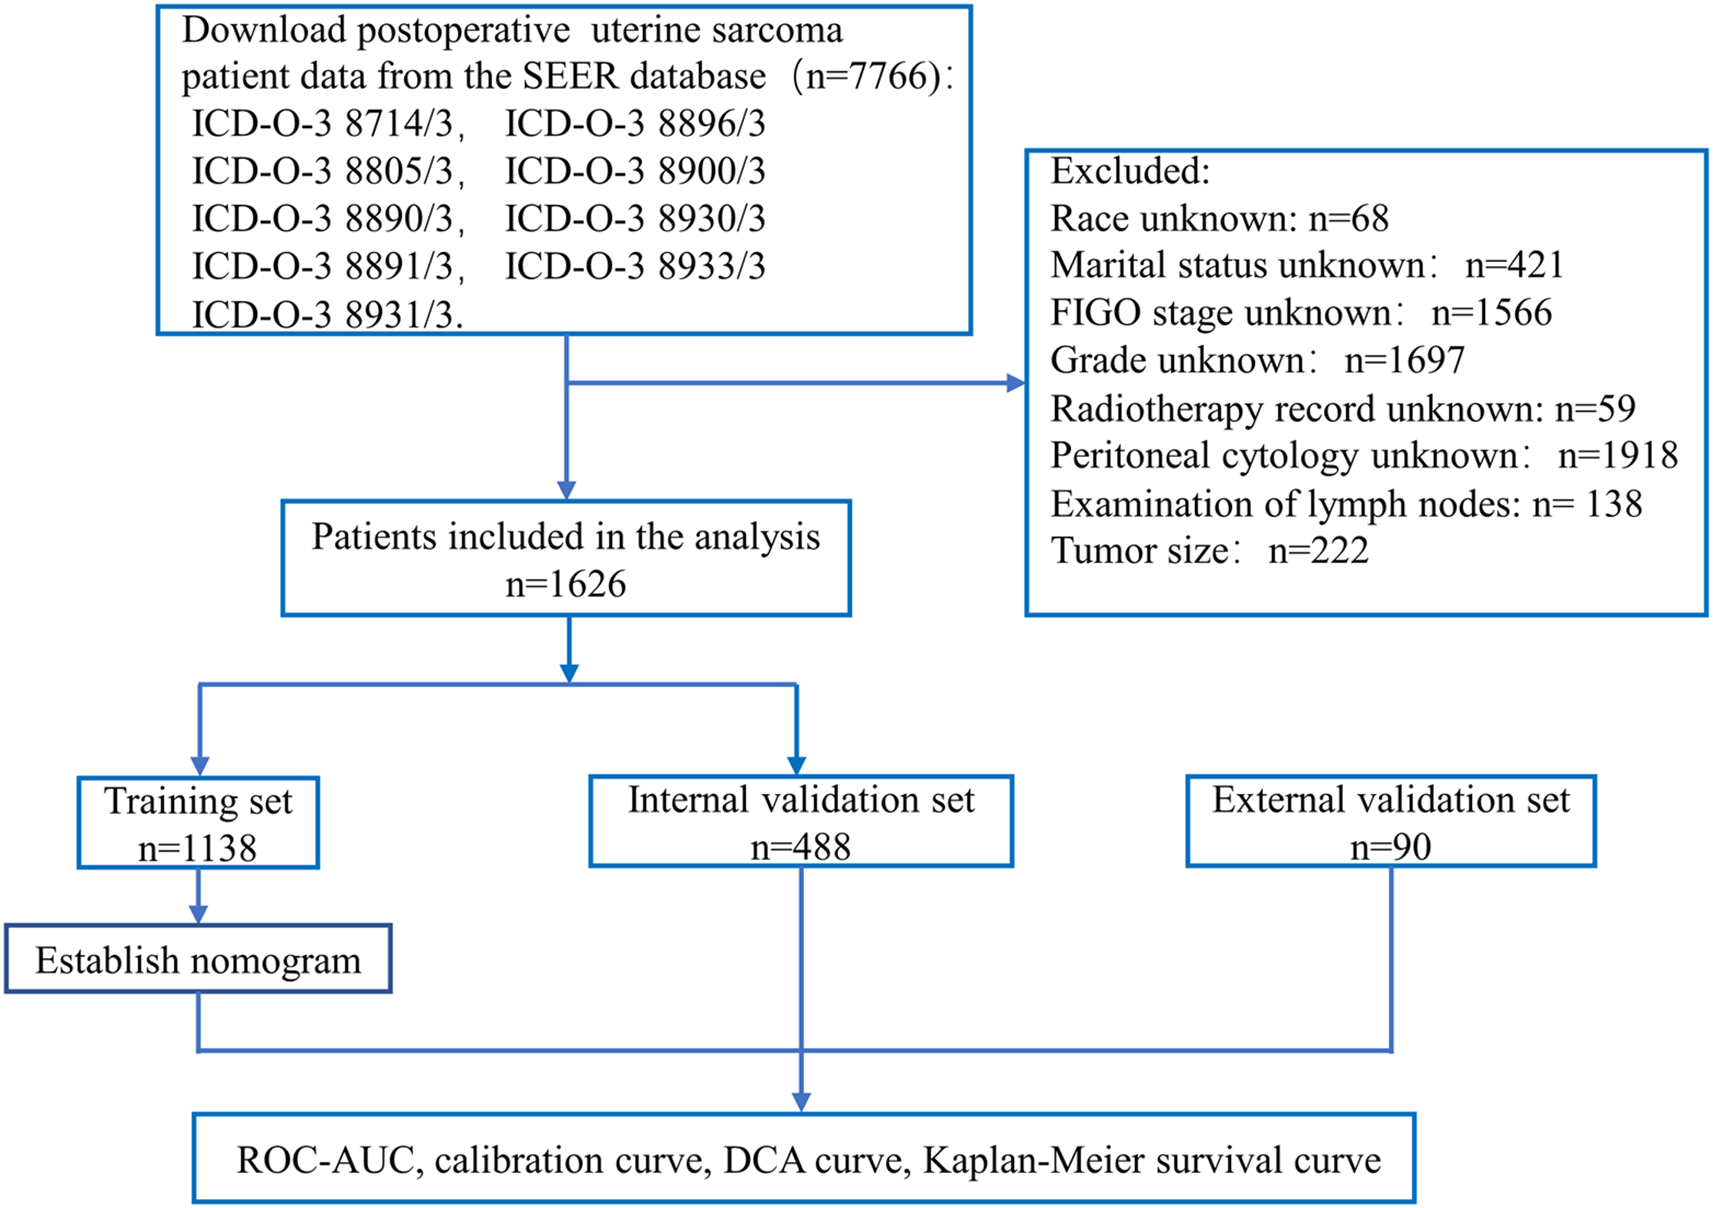
Flow chart for constructing a nomogram based on SEER database data and validating model performance.
3 Results
3.1 Optimal cut-off values result
We got the optimal cut-off values based on the training set in Table 1.
Table 1
| Variables | Cut-off value | Minimum | Maximum |
|---|---|---|---|
| Age (year) | 52 | 16 | 92 |
| Tumor size (mm) | 81 | 3 | 986 |
| Pelvic lymph node LODDS grade | − 0.9542425 | − 2.021189299 | 1.431363764 |
| Paraaortic lymph node LODDS grade | − 0.4771213 | − 1.799340549 | 1.113943352 |
The best cut-off values for continuous variables obtained using R software.
3.2 Patient characteristics
Collated clinical and demographic baseline characteristics for training sets, internal validation sets, and external validation sets are presented in Tables 2, 3. In the data from the SEER database, the median age at diagnosis was 55 years (quartile, 48–64 years). About half of the patients were diagnosed with stage I (55.54%).
Table 2
| Variables | Total (n = 1,626) | Training set (n = 1,138) | Internal validation set (n = 488) | p-value |
|---|---|---|---|---|
| Status | ||||
| Alive | 834 | 587 | 247 | |
| Dead | 792 | 551 | 241 | |
| Survival time (months; median [QR]) | 34.5 [13.00, 65.00] | 34.5 [13.75, 64.00] | 34.5 [12.00, 69.75] | |
| Age (n [%]; median [QR]) | 55 [48, 64] | 55 [48, 65] | 55 [48, 64] | 0.606 |
| < 52 years | 616 (37.88%) | 426 (37.43%) | 190 (38.93%) | |
| ≥ 52 years | 1,010 (62.12%) | 712 (62.57%) | 298 (61.07%) | |
| Race (n [%]) | ||||
| White | 1,176 (72.32%) | 830 (72.93%) | 346 (70.90%) | 0.6373 |
| Black | 276 (16.97%) | 191 (16.78%) | 85 (17.42%) | |
| Other | 174 (10.70%) | 117 (10.28%) | 57 (11.68%) | |
| Married status (n [%]) | ||||
| No | 388 (23.86%) | 268 (23.55%) | 120 (24.59%) | 0.6984 |
| Yes | 1,238 (76.14%) | 870 (76.45%) | 368 (75.41%) | |
| FIGO stage (n [%]) | ||||
| I | 903 (55.54%) | 635 (55.80%) | 268 (54.92%) | 0.1403 |
| II | 241 (14.82%) | 172 (15.11%) | 69 (14.14%) | |
| III | 41 (2.52%) | 22 (1.93%) | 19 (3.89%) | |
| IV | 441 (27.12%) | 309 (27.15%) | 132(27.05%) | |
| Pathology type (n [%]) | ||||
| LG-ESS | 287 (17.65%) | 204 (17.93%) | 83 (17.01%) | 0.4168 |
| LMS | 756 (46.49%) | 530 (46.57%) | 226 (46.31%) | |
| HG-ESS | 294 (18.08%) | 214 (18.80%) | 80(16.4%) | |
| UES | 61 (3.75%) | 41 (3.60%) | 20 (4.10%) | |
| RMS | 25 (1.54%) | 14 (1.23%) | 11 (2.25%) | |
| MA | 203 (12.48%) | 135 (11.86%) | 68 (13.93%) | |
| Tumor size (n [%]) | ||||
| < 81 mm | 762 (46.86%) | 536 (47.10%) | 226 (46.31%) | 0.812 |
| ≥ 81 mm | 864 (53.14%) | 602 (52.90%) | 262 (53.69%) | |
| Grade (n [%]) | ||||
| Grade 1 | 170 (10.46%) | 117 (10.28%) | 53 (10.86%) | 0.0488 |
| Grade 2 | 407 (25.03%) | 294 (25.83%) | 113 (23.16%) | |
| Grade 3 | 324 (19.93%) | 207 (18.19%) | 117 (23.98%) | |
| Grade 4 | 725 (44.59%) | 520 (45.69%) | 205 (42.00%) | |
| Peritoneal cytology (n [%]) | ||||
| Negative | 651 (40.04%) | 453 (39.81%) | 198 (40.57%) | 0.7102 |
| Positive | 71 (4.37%) | 47 (4.13%) | 24 (4.92%) | |
| Unknown | 904 (55.60%) | 638 (56.06%) | 266 (54.51%) | |
| Radiotherapy (n [%]) | ||||
| No | 1,367 (84.07%) | 961 (84.45%) | 406 (83.20%) | 0.5774 |
| Yes | 259 (15.93%) | 177 (15.55%) | 82 (16.80%) | |
| Chemotherapy (n [%]) | ||||
| No | 961 (59.10%) | 681 (59.84%) | 280 (57.38%) | 0.3835 |
| Yes | 665 (40.90%) | 457 (40.16%) | 208 (42.62%) | |
| Pelvic LODDS (n [%]) | ||||
| ≤ 0.9542 | 470 (28.91%) | 347 (30.49%) | 123 (25.20) | 0.0361 |
| ≥ − 0.9542 | 1,156 (71.09%) | 791 (69.51%) | 365 (74.80%) | |
| Paraaortic LODDS (n [%]) | ||||
| ≤ 0.4771 | 305 (18.76%) | 221 (19.42%) | 84 (17.21%) | 0.3293 |
| ≥ − 0.4771 | 1,321 (81.24%) | 917 (80.58%) | 404 (82.79%) | |
Summary of patient data collected from the SEER database.
Table 3
| Variables | External validation set (n = 90) |
|---|---|
| Status | |
| Alive | 48 (53.3%) |
| Dead | 42 (46.7%) |
| Survival time (months) | |
| Median (QR) | 56.5 [16.75, 108] |
| Age (n [%]; median [QR]) | 47 [39, 55.25] |
| Race (%) | |
| < 51 | 55 (61.11%) |
| ≥ 52 | 35 (38.99%) |
| Other | 90 (100.0%) |
| Married status (%) | |
| No | 3 (3.3%) |
| Yes | 12 (13.3%) |
| FIGO stage (n [%]) | |
| I | 51 (56.67%) |
| II | 11 (12.22%) |
| III | 16 (17.78%) |
| IV | 12 (13.33%) |
| Pathology (%) | |
| LG-ESS | 39 (43.3%) |
| LMS | 21 (23.3%) |
| HG-ESS | 13 (14.4%) |
| UES | 12 (13.3%) |
| RMS | 1 (1.1%) |
| MA | 4 (4.4%) |
| Tumor size (n [%]) | |
| < 81 mm | 62 (68.89%) |
| ≥ 81 mm | 28 (31.11%) |
| Grade (%) | |
| Grade 1 | 41 (45.6%) |
| Grade 2 | 22 (24.4%) |
| Grade 3 | 16 (17.8%) |
| Grade 4 | 11 (12.2%) |
| Peritoneal cytology (%) | |
| Negative | 84 (93.3%) |
| Positive | 6 (6.7%) |
| Radiotherapy (%) | |
| No | 73 (81.1%) |
| Yes | 17 (18.9%) |
| Chemotherapy (%) | |
| No | 30 (33.3%) |
| Yes | 60 (66.7%) |
| Pelvic LODDS (%) | |
| ≤ 0.4771 | 12 (13.3%) |
| ≥ − 0.4771 | 78 (86.7%) |
Summary of patient data collected from THAHUST.
Leiomyosarcoma has the highest incidence (46.49%), followed by endometrial stromal sarcoma (35.73%). A total of 40.9% of the patients received postoperative chemotherapy, and only 15.93% received radiotherapy. Only 4.37% of patients were positive for peritoneal cytology. In THAHUST, the median age at diagnosis was 47 years (quartile, 39–55.25 years old), and it had a longer median survival time (SEER: 34.5 vs. THAHUST: 56.5). THAHUST data also showed a higher proportion of patients receiving postoperative adjuvant therapy.
3.2 Lasso regression analysis and Cox regression analysis results
We first explored the optimal variables through Lasso regression, which identified four variables: age at diagnosis, FIGO stage, grade, and tumor size. The results of the Lasso regression are presented in Figure 2.
Figure 2
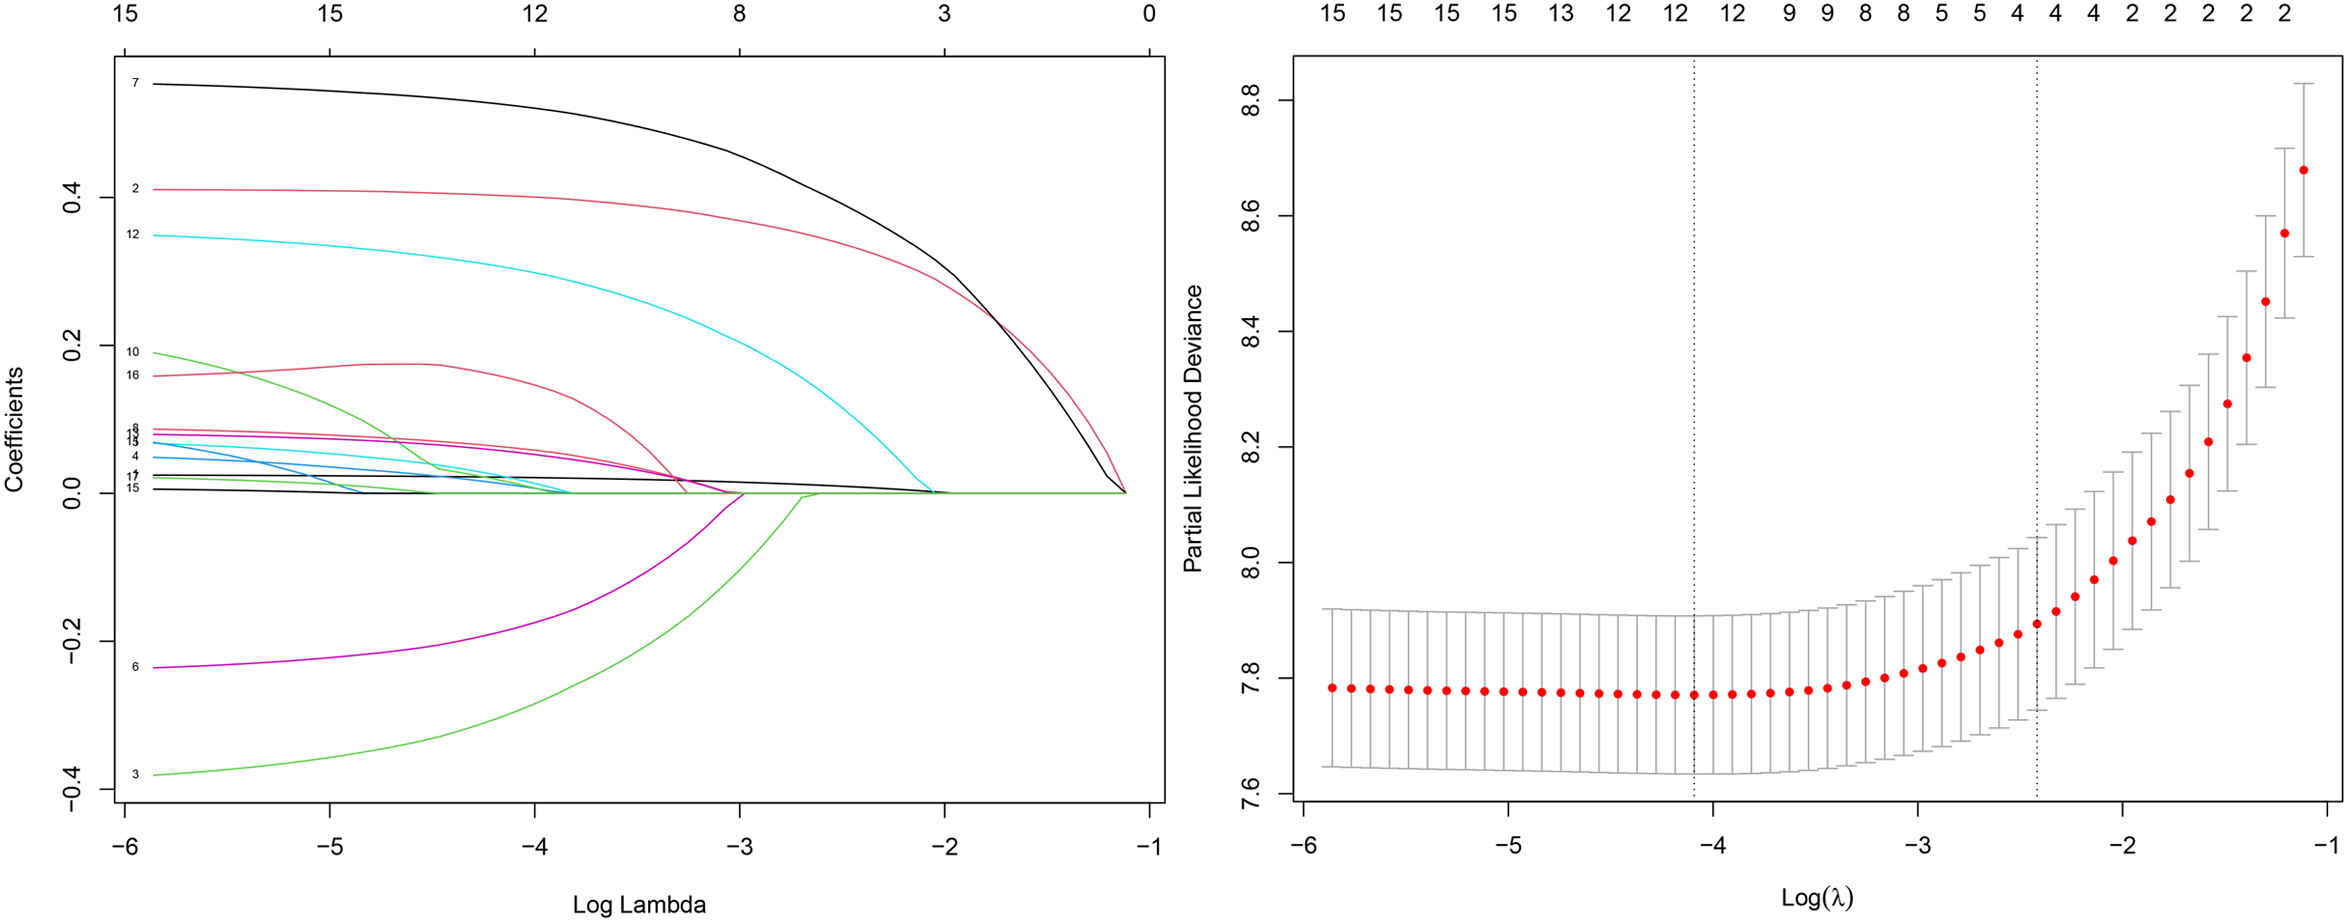
Lasso regression results.
According to univariate Cox regression analysis, eight variables were identified with a p-value < 0.05, including age at diagnosis, FIGO stage, chemotherapy, race, grade, peritoneal cytology, tumor size, and pathology. According to the multivariable Cox regression analysis, age at diagnosis, FIGO stage, race, grade, peritoneal cytology, pathology, and tumor size were independent prognostic factors. Age at diagnosis (hazard ratio (HR) = 1.625 vs. age younger than 52 years, p < 0.001), FIGO stage (stage II, HR = 1.93 vs. FIGO stage I, p < 0.001; stage III, HR = 1.899, p = 0.024; stage IV, HR = 3.463, p < 0.001), race being Black (HR = 1.513, p < 0.001), tumor grade (grade 3, HR = 2.903 vs. grade 1, p < 0.001; grade 4, HR = 2.855, p < 0.001). Consistent with other studies, Black race was an independent risk factor for uterine sarcoma (16). The results of univariate and multivariable Cox regression analyses are presented in Table 4.
Table 4
| Variables | Univariate analysis | Multivariable analysis | ||||
|---|---|---|---|---|---|---|
| HR (95% CI) | p-value | HR (95% CI) | p-value | |||
| Age (n [%]) | ||||||
| < 52 | Reference | Reference | ||||
| ≥ 52 | 2.265 (1.863, 2.754) | < 0.001 | 1.625 (1.330, 1.985) | < 0.001 | ||
| FIGO stage (n [%]) | ||||||
| I | Reference | Reference | ||||
| II | 2.307 (1.800, 2.957) | < 0.001 | 1.932(1.496, 2.495) | < 0.001 | ||
| III | 3.432 (2.026, 5.814) | < 0.001 | 1.899 (1.087, 3.317) | 0.024 | ||
| IV | 5.225 (4.309, 6.335) | < 0.001 | 3.463 (2.820, 4.253) | < 0.001 | ||
| Radiotherapy (n [%]) | ||||||
| No | Reference | |||||
| Yes | 0.891 (0.706, 1.125) | 0.333 | ||||
| Chemotherapy (n [%]) | ||||||
| No | Reference | |||||
| Yes | 2.508 (2.114, 2.975) | < 0.001 | ||||
| Race (n [%]) | ||||||
| White | Reference | Reference | ||||
| Black | 1.543 (0.836, 1.583) | < 0.001 | 1.513 (1.218, 1.879) | < 0.001 | ||
| Others | 0.729 (0.533, 0.995) | 0.047 | 0.874 (0.637, 1.199) | 0.403 | ||
| Marital status (n [%]) | ||||||
| No | Reference | |||||
| Yes | 0.904 (0.742, 1.101) | 0.316 | ||||
| Grade (n [%]) | ||||||
| Grade 1 | Reference | Reference | ||||
| Grade 2 | 1.202 (0.661, 2.187) | 0.546 | 0.947 (0.517, 1.735) | 0.860 | ||
| Grade 3 | 7.862 (4.533, 13.636) | < 0.001 | 2.903 (1.613, 5.223) | < 0.001 | ||
| Grade 4 | 8.198 (4.803, 13.993) | < 0.001 | 2.855 (1.609, 5.068) | < 0.001 | ||
| Peritoneal cytology (n [%]) | ||||||
| Negative | Reference | Reference | ||||
| Positive | 5.049 (3.591, 7.098) | < 0.001 | 2.815 (1.953, 4.056) | 0.049 | ||
| Unknown | 1.281 (1.070, 1.534) | 0.007 | 1.201 (1.001,1.441) | < 0.001 | ||
| Pelvic lymph node LODDS grade (n [%]) | ||||||
| ≤ 0.9542 | Reference | |||||
| ≥ − 0.9542 | 1.337 (1.106, 1.616) | 0.003 | ||||
| Paraaortic LODDS (n [%]) | ||||||
| ≤ 0.4771 | Reference | |||||
| ≥ − 0.4771 | 1.275 (1.021, 1.593) | 0.032 | ||||
| Tumor size (n [%]) | ||||||
| < 81 mm | Reference | Reference | ||||
| ≥ 81 mm | 2.575 (2.147, 3.090) | < 0.001 | 1.295 (1.065, 1.574) | 0.009 | ||
| Pathology (n [%]) | ||||||
| LE-ESS | Reference | Reference | ||||
| LMS | 15.510 (8.503, 28.293) | < 0.001 | 3.977 (2.037, 7.764) | < 0.001 | ||
| HG-ESS | 17.283 (9.319, 32.053) | < 0.001 | 4.742 (2.404, 9.355) | < 0.001 | ||
| UES | 23.738 (11.890, 47.393) | < 0.001 | 5.431 (2.529, 11.662) | < 0.001 | ||
| RMS | 32.320 (13.710, 76.191) | < 0.001 | 4.165 (1.645, 10.548) | 0.003 | ||
| MA | 8.150 (4.232, 15.696) | < 0.001 | 4.195 (2.091, 8.417) | < 0.001 | ||
Results of selected variables analyzed by univariate and multivariable Cox regression analyses.
In a comparison of the results of Cox regression and Lasso regression, age at diagnosis, FIGO stage, grade, peritoneal cytology, and tumor size were used to construct the nomogram for the following reasons: (1) we aimed to establish a model applicable to Asians, and Asian descent was a protective factor (HR = 0.874 [95% CI: 0.637, 1.199] vs. White, p < 0.001), with race excluded; (2) the AUC value of the model with added pathology did not show significant improvement.
3.3 Construction of the nomogram
Figure 3 shows a simple and efficient nomogram for predicting 1-, 3-, and 5-year OS probability. Factors of age at diagnosis, FIGO stage, grade, tumor size, and peritoneal cytology were used to construct a nomogram based on Lasso regression results. The tumor grade was set as a reference scale ranging from 0 to 100 because it had the largest absolute coefficient value. By adding the values above each variable, the total score was obtained. Drawing a vertical line down from the total score, the patient’s probability of survival at 1, 3, and 5 years can be obtained.
Figure 3
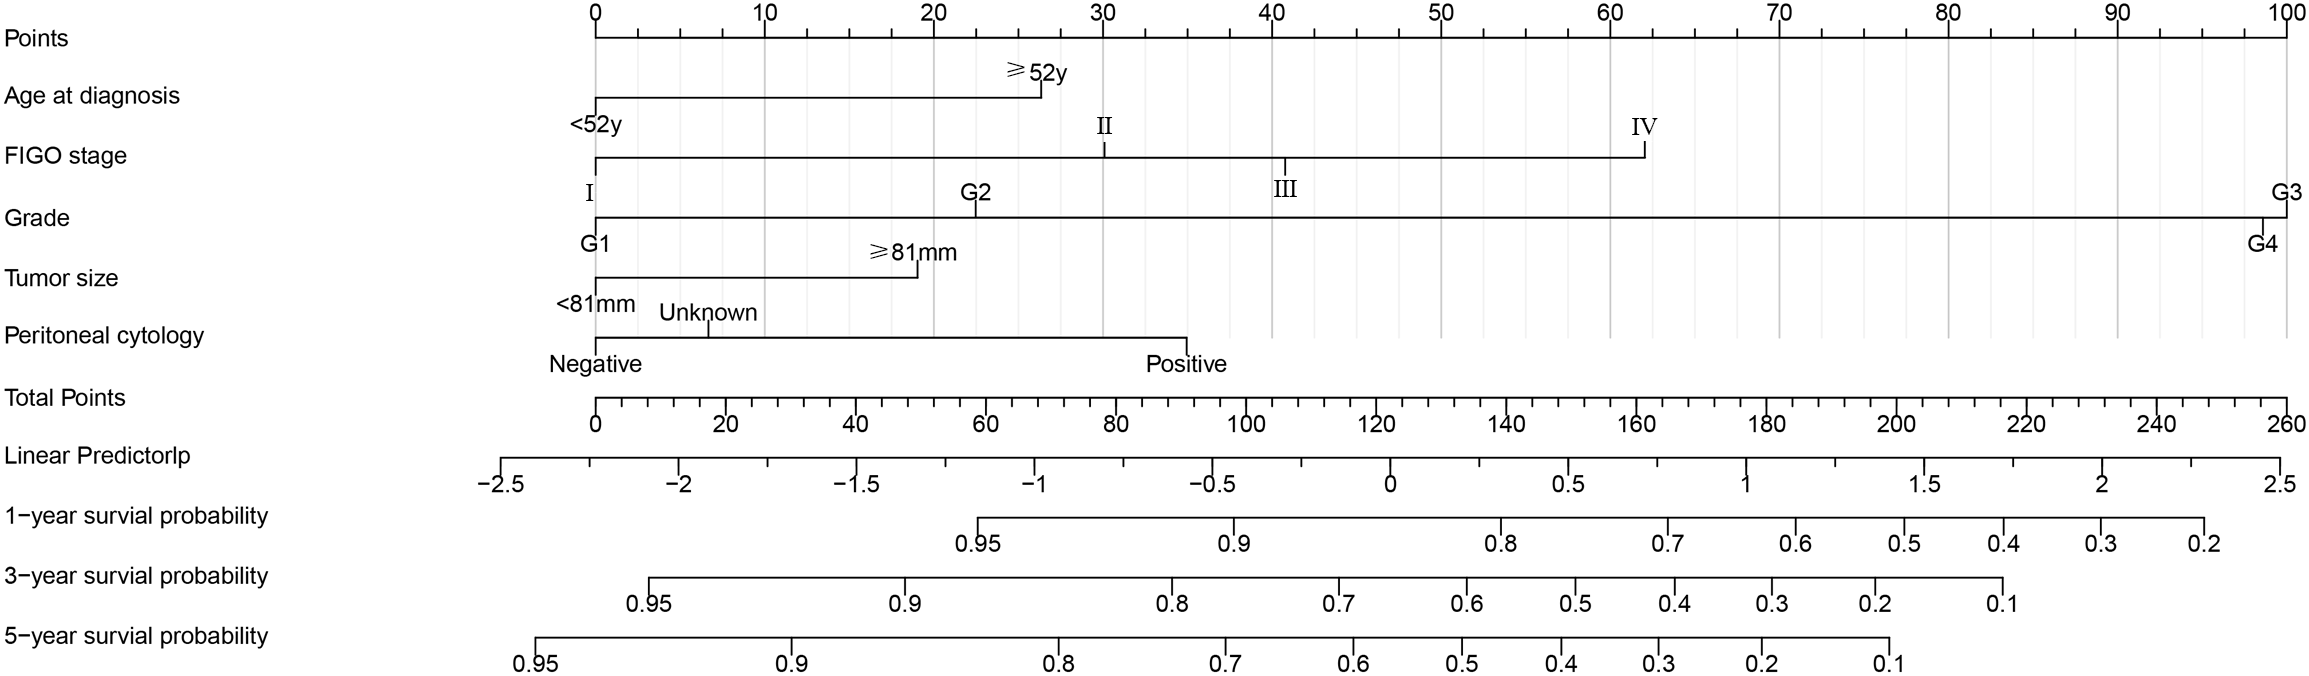
Postoperative survival nomogram established based on Lasso regression results for predicting 1-, 3-, and 5-year OS probability.
3.4 Evaluation and calibration of the nomogram
The C-indices in the training set, the internal validation set, and the external validation set were 0.78 [95% CI: 0.739, 0.823], 0.77 [95% CI: 0.697, 0.8255], and 0.84 [95% CI: 0.670, 0.928], respectively. The 1-, 3-, and 5-year ROC curves and AUC values were used to judge the discrimination ability of the model. In the training set (Figure 4A), the AUC values were 0.826, 0.847, and 0.839, respectively. The AUC values were similar in the internal validation set (Figure 4B). In the external validation set (Figure 4C), the AUC values were 0.905, 0.890, and 0.876. AUC values above 0.8 indicate strong predictive power; the external validation AUC peaked at 0.9, demonstrating excellent generalizability. Again, the calibration plots (Figures 4D–F) were close to the ideal 45° reference line, and the predicted values and actual results were similar.
Figure 4
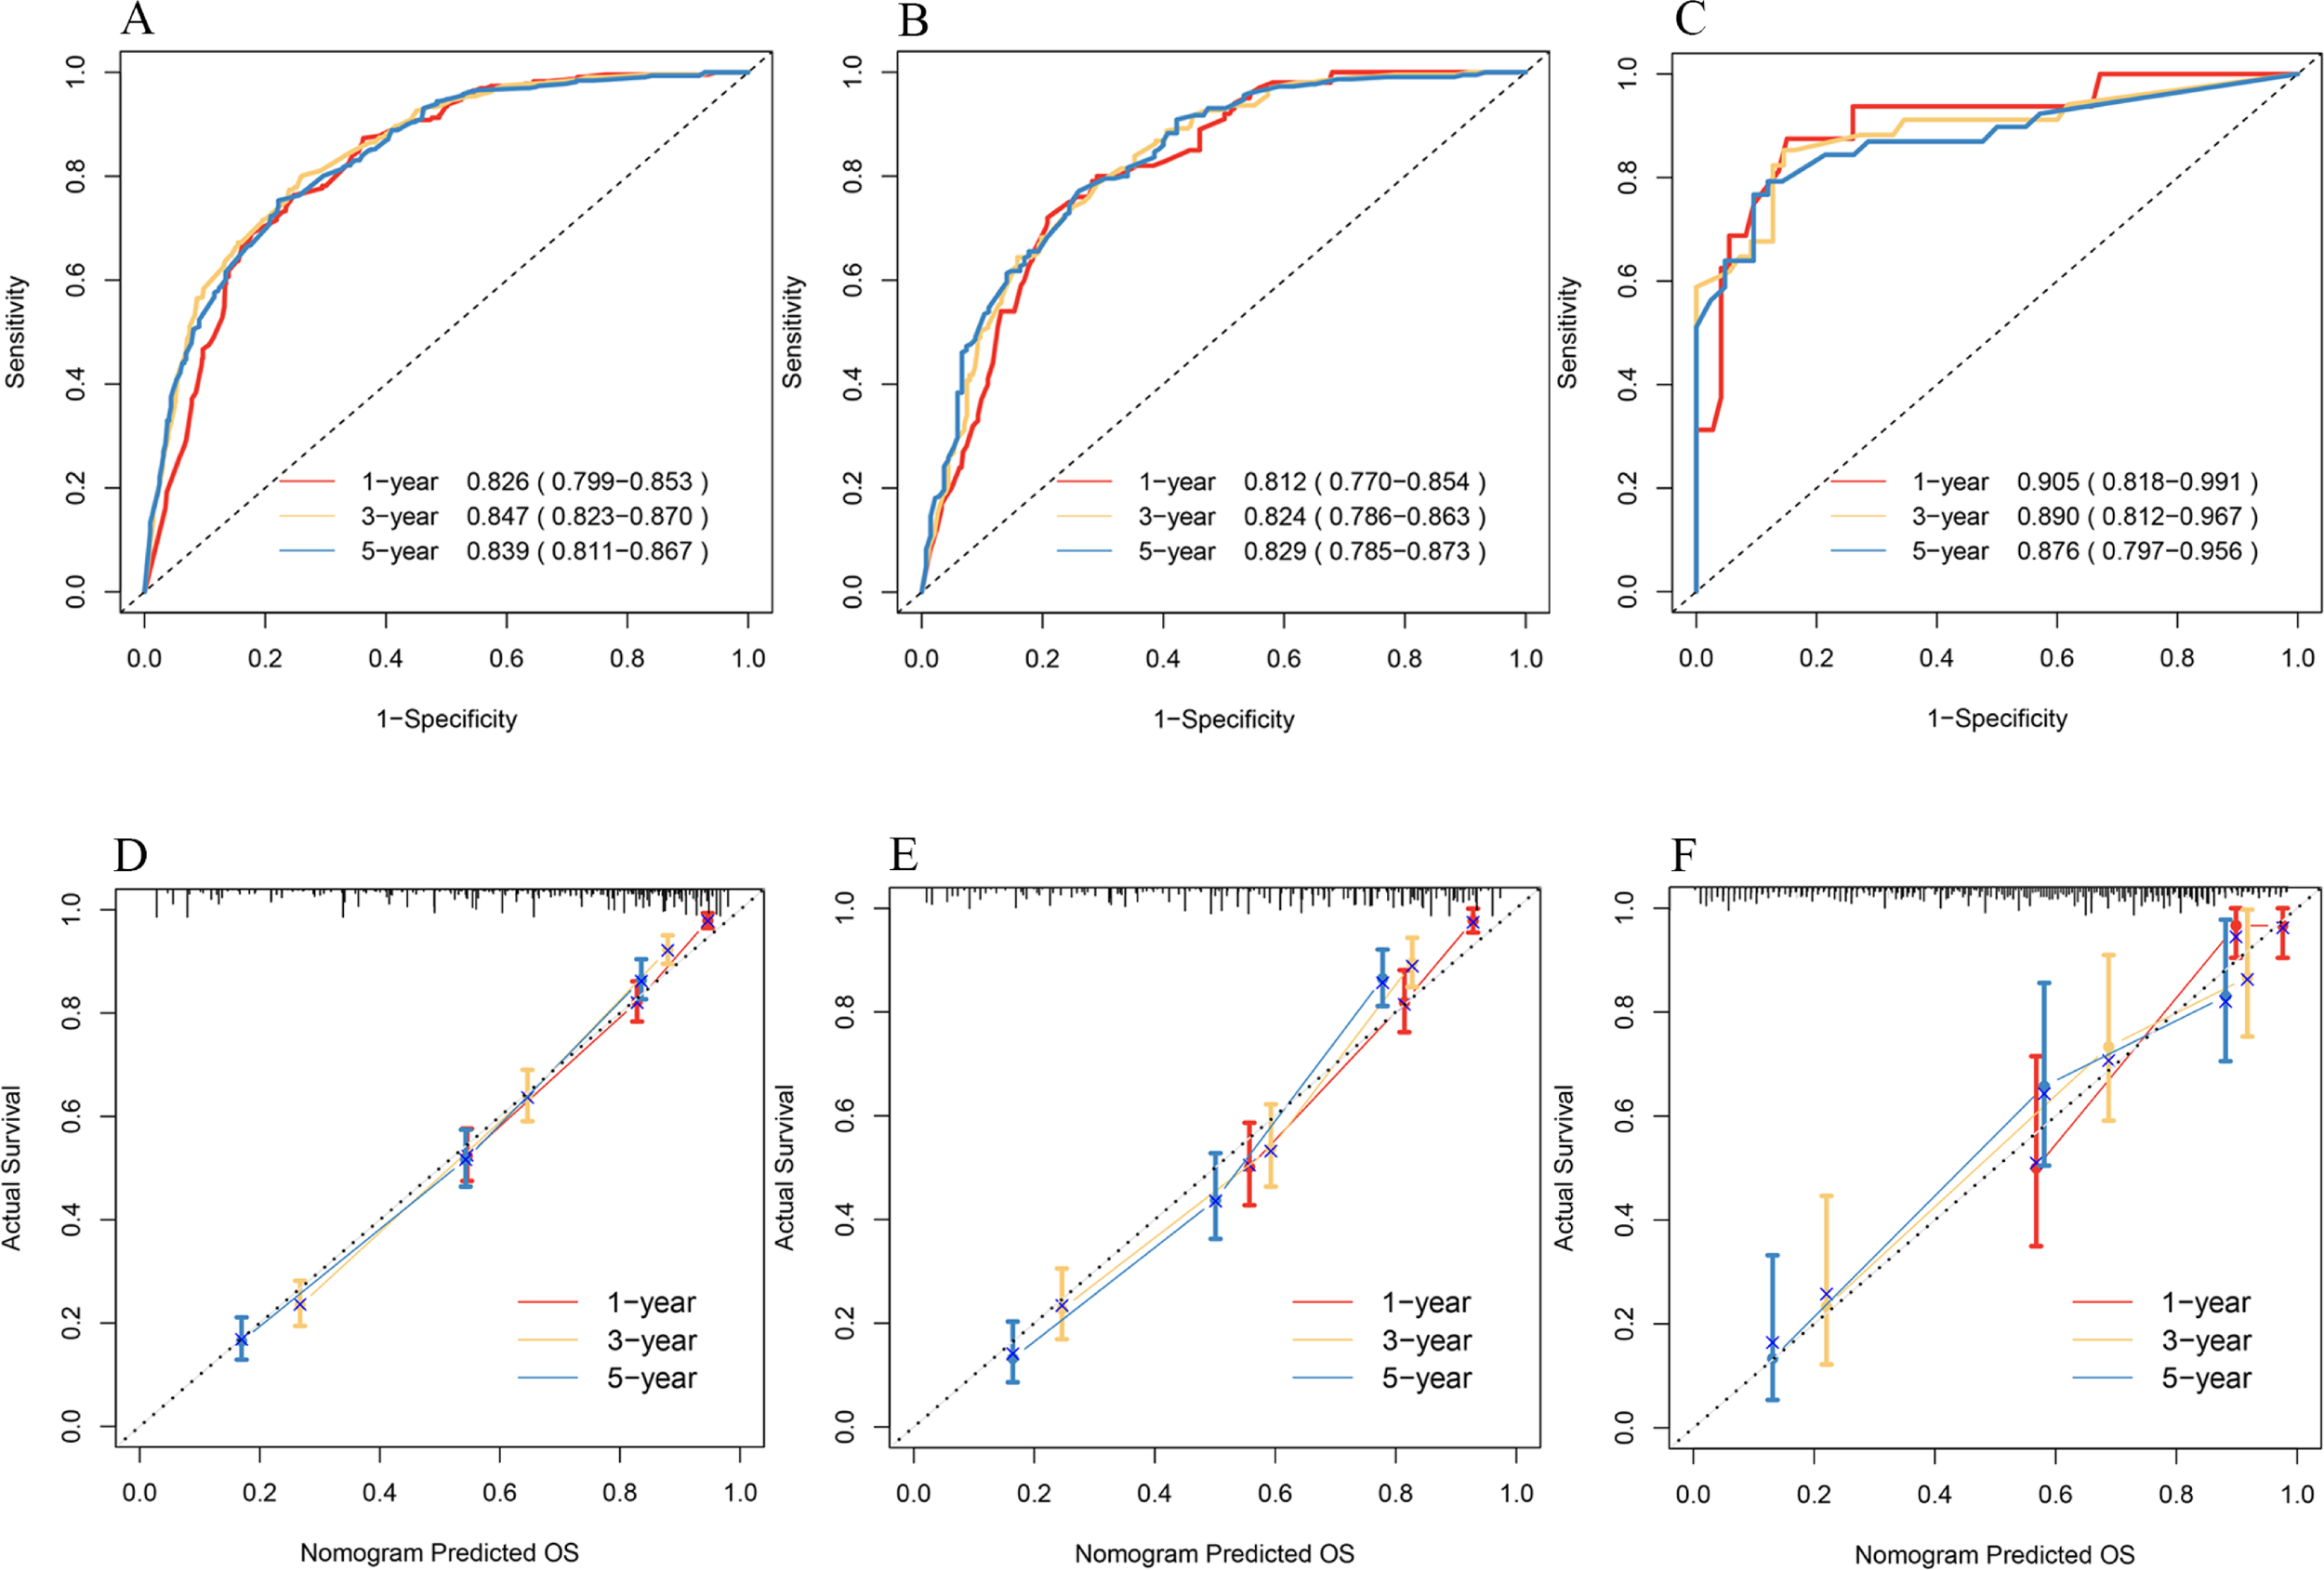
ROC curves for 1-, 3-, and 5-year OS of patients in the training set (A), internal validation set (B), and external validation set (C). Calibration plots for 1-, 3-, and 5-year OS of patients in the training set (D), internal validation set (E), and external validation set (F).
3.5 Clinical usefulness
DCA was a new method of evaluating alternative prognostic strategies that provided advantages over AUC. We compared the net clinical benefits of the model with FIGO staging, and the model showed clear advantages, especially in the external validation set (Figure 5).
Figure 5
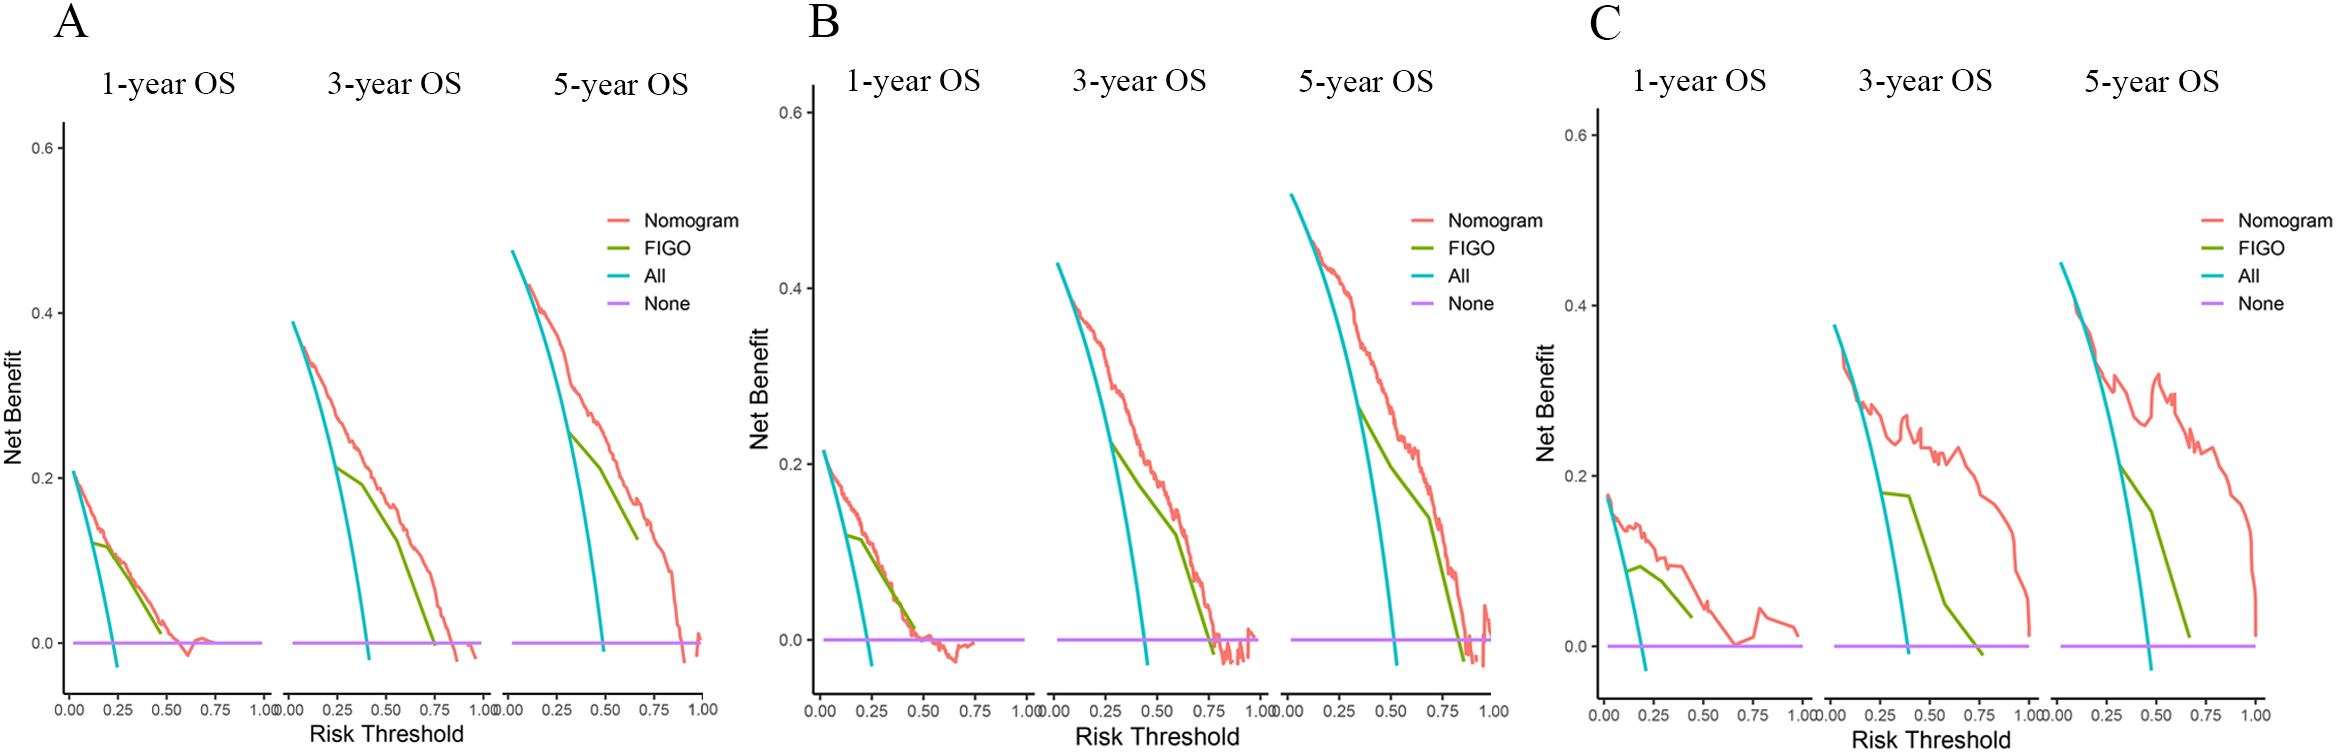
DCAs compared the nomogram with the FIGO stage for OS in the training set (A), internal validation set (B), and external validation set (C).
3.6 The performance of the nomogram in prognosis stratification
An appropriate threshold is set according to the patient’s 5-year OS as an inflection point of clinical treatment strategy (9). In general, an overall 5-year relative survival > 65% is good, 35%–65% is moderate, and less than 35% is very poor (19). Patients with uterine sarcoma with good 5-year OS do not always benefit from adjuvant therapy after surgery (1). In this model, a risk-averse cut-off point of 40%/80% was used for treatment decisions based on the patient’s 5-year OS. Within the clinical prognostic nomogram we constructed, each of the five predictors was assigned a standardized point score from 0 to 100, quantifying its relative contribution to the predicted outcome. The specific points for each variable, derived from the statistical algorithm using the R software, are detailed in Table 5.
Table 5
| Variables | Individual scores |
|---|---|
| Age at diagnosis | |
| < 52years | 0 |
| ≥ 52years | 26 |
| FIGO stage | |
| I | 0 |
| II | 30 |
| III | 41 |
| IV | 62 |
| Grade | |
| Grade 1 | 0 |
| Grade 2 | 22 |
| Grade 3 | 100 |
| Grade 4 | 99 |
| Tumor size points | |
| < 81 mm | 0 |
| ≥ 81 mm | 19 |
| Peritoneal cytology points | |
| Negative | 0 |
| Positive | 35 |
| Unknown | 7 |
The score for each variable in the nomogram.
By aggregating the points from all variables, a comprehensive risk score (total points) was derived for each patient in the cohort. The results are shown in Table 6.
Table 6
| Group | Total score | 5-Year survival probability |
|---|---|---|
| Low risk | ≤ 55 | ≥ 0.8 |
| Medium risk | − 117 | 0.5–0.7 |
| High risk | > 117 | ≤ 0.4 |
Divide risk groupings based on total scores.
All patients were divided into a high-risk group, a medium-risk group, and a low-risk group based on the tiered scores 55 and 117. The Kaplan–Meier curves and the log-rank test showed that patients with a lower total score of 55 had a higher 5-year survival probability of more than 80%, and by comparing the actual postoperative adjuvant treatment of these patients, we found that low-risk group patients did not require postoperative adjuvant therapy. Patients with a score of 55 to 117 were recommended for postoperative adjuvant treatment based on the patient’s willingness to treat. High-risk patients must undergo postoperative adjuvant therapy (p < 0.0001). The results are shown in Figure 6.
Figure 6
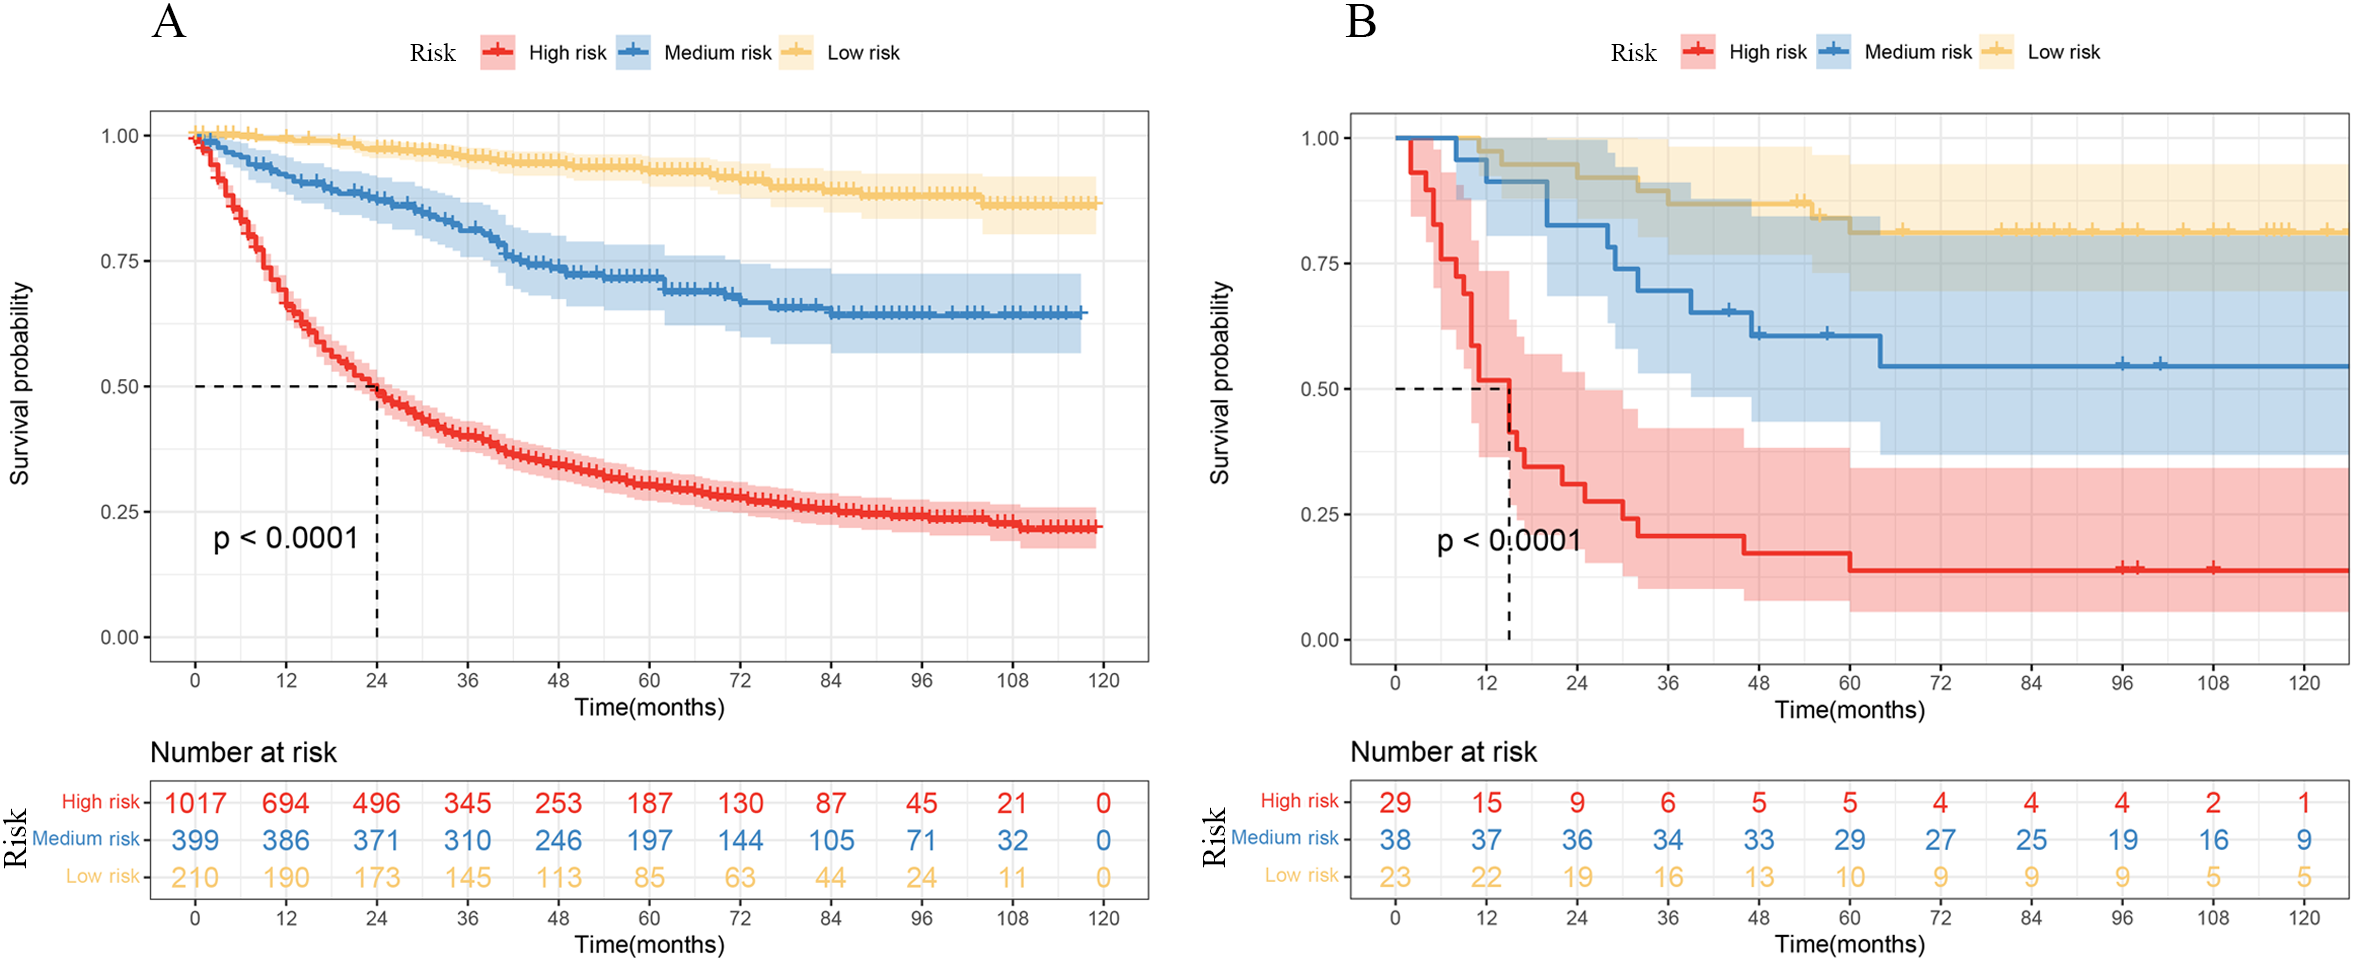
Kaplan–Meier curves of OS by risk groups based on the nomogram in the SEER data (A) and THAHUST data (B).
4 Discussion
At present, total hysterectomy or bilateral salpingo-oophorectomy (BSO) is still the standard surgical treatment for uterine sarcoma (3), and there is no uniform conclusion on the benefit of adjuvant therapy for uterine sarcoma patients after surgery, especially for patients with low-grade and early-stage disease (20–22). Even if patients are diagnosed at early stages, the prognosis is still not optimistic, and the 5-year survival rate is around 42% (1). LG-ESSs often present with long-term recurrence, and studies have shown limited benefit of adjuvant therapy, which presents a clinical challenge (23, 24). Our model supports the clinical decision to withhold adjuvant therapy in low-risk patients—e.g., a 50-year-old woman with FIGO stage II disease, tumor size of 60 mm, and grades 1–2 histology—while identifying high-risk individuals (grades 3–4) who may benefit from additional treatment.
Age at diagnosis, FIGO stage, grade, peritoneal cytology, and tumor size are readily accessible in clinical settings. We listed the scores for each variable and the corresponding hazard grouping, which is convenient for clinical application.
Postoperative adjuvant treatments, including radiotherapy and chemotherapy, were not considered protective prognostic factors. This means that uterine sarcoma is not sensitive to chemoradiotherapy and has little effect on OS. This is consistent with the results of a real-world study (4).
LODDS has been recognized in recent years as a novel prognostic factor. It has demonstrated a better prognosis than AJCC lymph node staging in a variety of cancers (17–19). However, lymphadenectomy is controversial in patients with uterine sarcoma (25, 26). Notably, our model shows that pelvic and paraaortic nodal LODDS grade was not associated with patient OS, which suggests that uterine sarcoma surgery does not require excessive lymph node dissection.
The two main limitations of this study are as follows. First, our findings may have introduced selection bias because of their retrospective nature. We excluded patients with incomplete data during the data collection process, which may have limited the generalizability or robustness of the conclusions. Second, important prognostic factors not captured in the SEER database include gene alterations (27, 28), history of uterine power morcellation (29), high parity (ten or more deliveries) (30), lymphovascular space invasion (LVSI), and hormonal therapy. A more comprehensive model of survival prognosis with optimal prognostic factors is expected to be established in the future.
5 Conclusions
This nomogram may help clinicians personalize adjuvant treatment decisions in uterine sarcoma, especially in low-risk Asian patients. Prospective validation is warranted.
Statements
Data availability statement
The original contributions presented in the study are included in the article/Supplementary Material. Further inquiries can be directed to the corresponding author.
Ethics statement
The studies involving humans were approved by Tongji Medical College, Huazhong University of Science and Technology. The studies were conducted in accordance with the local legislation and institutional requirements. The ethics committee/institutional review board waived the requirement of written informed consent for participation from the participants or the participants’ legal guardians/next of kin because EER database was publicly accessible, patient consent and institutional review board approval were not required, and the Ethics Committee and institutional review board of THAHUST approved our study. The institutional review board waived the requirement for informed consent because all data we collected were anonymized at all stages, including during the data cleaning and statistical analyses.
Author contributions
LL: Funding acquisition, Supervision, Writing – review & editing. WT: Writing – review & editing. ZO: Data curation, Methodology, Writing – original draft.
Funding
The author(s) declare that no financial support was received for the research, and/or publication of this article.
Acknowledgments
I wish to acknowledge the support and guidance from the faculty of Tongji Hospital, where this research was conducted during my master's degree program.
Conflict of interest
The authors declare that the research was conducted in the absence of any commercial or financial relationships that could be construed as a potential conflict of interest.
Generative AI statement
The author(s) declare that no Generative AI was used in the creation of this manuscript.
Any alternative text (alt text) provided alongside figures in this article has been generated by Frontiers with the support of artificial intelligence and reasonable efforts have been made to ensure accuracy, including review by the authors wherever possible. If you identify any issues, please contact us.
Publisher’s note
All claims expressed in this article are solely those of the authors and do not necessarily represent those of their affiliated organizations, or those of the publisher, the editors and the reviewers. Any product that may be evaluated in this article, or claim that may be made by its manufacturer, is not guaranteed or endorsed by the publisher.
Supplementary material
The Supplementary Material for this article can be found online at: https://www.frontiersin.org/articles/10.3389/fonc.2025.1609721/full#supplementary-material
References
1
Hosh M Antar S Nazzal A Warda M Gibreel A Refky B et al . Uterine sarcoma: analysis of 13,089 cases based on surveillance, epidemiology, and end results database. Int J Gynecological Cancer: Off J Int Gynecological Cancer Soc. (2016) 26:10981104. doi: 10.1097/IGC.0000000000000720
2
Toro JR Travis LB Wu HJ Zhu K Fletcher CD Devesa SS et al . Incidence patterns of soft tissue sarcomas, regardless of primary site, in the surveillance, epidemiology and end results program, 1978-2001: An analysis of 26,758 cases. Int J Cancer. (2006) 119:2922–30. doi: 10.1002/ijc.v119:12
3
Gronchi A Miah AB Dei Tos AP Abecassis N Bajpai J Bauer S et al . Soft tissue and visceral sarcomas: ESMOEURACAN-GENTURIS Clinical Practice Guidelines for diagnosis, treatment and follow-up. Ann Oncology: Off J Eur Soc For Med Oncol. (2021) 32:13481365. doi: 10.1016/j.annonc.2021.07.006
4
Li D Yin N Du G Wang S Xiao Z Chen J et al . A real-world study on diagnosis and treatment of uterine sarcoma in Western China. Int J Biol Sci. (2020) 16:388–95. doi: 10.7150/ijbs.39773
5
George S Serrano C Hensley ML Ray-Coquard I . Soft tissue and uterine leiomyosarcoma. J Clin Oncology: Off J Am Soc Clin Oncol. (2018) 36:144–50. doi: 10.1200/JCO.2017.75.9845
6
Omura GA Blessing JA Major F Lifshitz S Ehrlich CE Mangan C et al . A randomized clinical trial of adjuvant adriamycin in uterine sarcomas: a Gynecologic Oncology Group Study. J Clin Oncology: Off J Am Soc Clin Oncol. (1985) 3:1240–5. doi: 10.1200/JCO.1985.3.9.1240
7
Pautier P Floquet A Gladieff L Bompas E Ray-Coquard I Piperno-Neumann S et al . A randomized clinical trial of adjuvant chemotherapy with doxorubicin, ifosfamide, and cisplatin followed by radiotherapy versus radiotherapy alone in patients with localized uterine sarcomas (SARCGYN study). A study of the French Sarcoma Group. Ann Oncology: Off J Eur Soc For Med Oncol. (2013) 24:1099–104. doi: 10.1093/annonc/mds545
8
Zivanovic O Leitao MM Iasonos A Jacks LM Zhou Q Abu-Rustum NR et al . Stage-specific outcomes of patients with uterine leiomyosarcoma: a comparison of the international Federation of gynecology and obstetrics and american joint committee on cancer staging systems. J Clin Oncology: Off J Am Soc Clin Oncol. (2009) 27:2066–72. doi: 10.1200/JCO.2008.19.8366
9
Balachandran VP Gonen M Smith JJ DeMatteo RP . Nomograms in oncology: more than meets the eye. Lancet Oncol. (2015) 16:e173–80. doi: 10.1016/S1470-2045(14)71116-7
10
Iuamoto LR Meyer A . A commentary on "Construction of a nomogram to predict overall survival for patients with M1 stage of colorectal cancer: A retrospective cohort study" (Int J Surg 2019; Epub ahead of print). Int J Surg (London England). (2019) 72:241. doi: 10.1016/j.ijsu.2019.11.021
11
El Sharouni MA Varey AHR Witkamp AJ Ahmed T Sigurdsson V van Diest PJ et al . Predicting sentinel node positivity in patients with melanoma: external validation of a risk-prediction calculator (the Melanoma Institute Australia nomogram) using a large European population-based patient cohort. Br J Dermatol. (2021) 185:412–8. doi: 10.1111/bjd.v185.2
12
Raghav K Hwang H Jácome AA Bhang E Willett A Huey RW et al . Development and validation of a novel nomogram for individualized prediction of survival in cancer of unknown primary. Clin Cancer Research: an Off J Am Assoc For Cancer Res. (2021) 27:3414–21. doi: 10.1158/1078-0432.CCR-20-4117
13
Mao M Zhang A He Y Zhang L Liu W Song Y et al . Development and validation of a novel nomogram to predict overall survival in gastric cancer with lymph node metastasis. Int J Biol Sci. (2020) 16:1230–7. doi: 10.7150/ijbs.39161
14
Zhuang A Wu Q Tong H Zhang Y Lu W . Development and validation of a nomogram for predicting recurrence-free survival of surgical resected retroperitoneal liposarcoma. Cancer Manage Res. (2021) 13:6633–9. doi: 10.2147/CMAR.S321324
15
Cao S Liao X Xu K Xiao H Shi Z Zou Y et al . Development and validation of tumor-size-stratified prognostic nomograms for patients with uterine sarcoma: A SEER database analysis. Cancer Med. (2023) 12(2):1339–49. doi: 10.1002/cam4.5014
16
Li YJ Lyu J Li C He HR Wang JF Wang YL et al . A novel nomogram for predicting cancer-specific survival in women with uterine sarcoma: a large population-based study. BMC Women's Health. (2022) 22:175. doi: 10.1186/s12905-022-01739-5
17
International Agency for Research on Cancer . World health organization WHO classification of tumours of female reproductive organs. Int Agency Res Cancer. (2014) 4:135.
18
Iasonos A Schrag D Raj GV Panageas KS . How to build and interpret a nomogram for cancer prognosis. J Clin Oncology: Off J Am Soc Clin Oncol. (2008) 26:1364–70. doi: 10.1200/JCO.2007.12.9791
19
Gatta G Ciccolallo L Kunkler I Capocaccia R Berrino F Coleman MP et al . Survival from rare cancer in adults: a population-based study. Lancet Oncol. (2006) 7:132–40. doi: 10.1016/S1470-2045(05)70471-X
20
Desar IME Ottevanger PB Benson C van der Graaf WTA . Systemic treatment in adult uterine sarcomas. Crit Rev In Oncology/hematology. (2018) 122:10–20. doi: 10.1016/j.critrevonc.2017.12.009
21
Sait HK Anfinan NM El Sayed ME Alkhayyat SS Ghanem AT Abayazid RM et al . Uterine sarcoma. Clinico-pathological characteristics and outcome. Saudi Med J. (2014) 35:1215–22.
22
Cordoba A Prades J Basson L Robin YM Taïeb S Narducci F et al . Adjuvant management of operated uterine sarcomas: A single institution experience. Cancer Radiotherapie: J la Societe Francaise Radiotherapie Oncologique. (2019) 23:401–7. doi: 10.1016/j.canrad.2019.04.001
23
Zhou J Zheng H Wu SG He ZY Li FY Su GQ et al . Influence of different treatment modalities on survival of patients with low-grade endometrial stromal sarcoma: A retrospective cohort study. Int J Surg (London England). (2015) 23:147–51. doi: 10.1016/j.ijsu.2015.09.072
24
Matoso A Epstein JI . Epithelioid angiosarcoma of the bladder: A series of 9 cases. Am J Surg Pathol. (2015) 39:1377–82. doi: 10.1097/PAS.0000000000000444
25
Amant F De Knijf A Van Calster B Leunen K Neven P Berteloot P et al . Clinical study investigating the role of lymphadenectomy, surgical castration and adjuvant hormonal treatment in endometrial stromal sarcoma. Br J Cancer. (2007) 97:1194–9. doi: 10.1038/sj.bjc.6603986
26
Kapp DS Shin JY Chan JK . Prognostic factors and survival in 1396 patients with uterine leiomyosarcomas: emphasis on impact of lymphadenectomy and oophorectomy. Cancer. (2008) 112:820–30. doi: 10.1002/cncr.v112:4
27
Zhai YL Nikaido T Toki T Shiozawa A Orii A Fujii S et al . Prognostic significance of bcl-2 expression in leiomyosarcoma of the uterus. Br J Cancer. (1999) 80:1658–64. doi: 10.1038/sj.bjc.6690578
28
Zhou J-G Zhao H-T Jin S-H Tian X Ma H . Identification of a RNA-seqbased signature to improve prognostics for uterine sarcoma. Gynecologic Oncol. (2019) 155:499–507. doi: 10.1016/j.ygyno.2019.08.033
29
Mori KM Abaid LN Mendivil AA Brown JV Beck TL Micha JP et al . The incidence of occult Malignancy following uterine morcellation: A ten-year single institution experience retrospective cohort study. Int J Surg (London England). (2018) 53:239–42. doi: 10.1016/j.ijsu.2018.03.075
30
Högnäs E Kauppila A Pukkala E Tapanainen JS . Cancer risk in women with 10 or more deliveries. Obstetrics Gynecology. (2014) 123:811–6. doi: 10.1097/AOG.0000000000000182
Summary
Keywords
SEER, nomogram, uterine sarcoma, postoperative adjuvant therapy, external validation
Citation
Li L, Tao W and Ouyang Z (2025) Development and external validation of a nomogram for choosing postoperative adjuvant therapies in uterine sarcoma patients using real-world data. Front. Oncol. 15:1609721. doi: 10.3389/fonc.2025.1609721
Received
10 April 2025
Accepted
08 August 2025
Published
10 September 2025
Volume
15 - 2025
Edited by
Tullio Golia D’Augè, Sapienza University of Rome, Italy
Reviewed by
Jia-Ming Wu, Wuwei Cancer Hospital of Gansu Province, China
Shigao Huang, Air Force Medical University, China
Updates
Copyright
© 2025 Li, Tao and Ouyang.
This is an open-access article distributed under the terms of the Creative Commons Attribution License (CC BY). The use, distribution or reproduction in other forums is permitted, provided the original author(s) and the copyright owner(s) are credited and that the original publication in this journal is cited, in accordance with accepted academic practice. No use, distribution or reproduction is permitted which does not comply with these terms.
*Correspondence: Ze Ouyang, ouyz20@163.com
Disclaimer
All claims expressed in this article are solely those of the authors and do not necessarily represent those of their affiliated organizations, or those of the publisher, the editors and the reviewers. Any product that may be evaluated in this article or claim that may be made by its manufacturer is not guaranteed or endorsed by the publisher.