 Giuseppe Defazio1†‡
 Federico Scolari1‡
 Sara Fancelli2Simone Polvani1Daniele Lavacchi2
 Lucia Picariello1
 Alessandro Tubita3
 Michaela Luconi1
 Lorenzo Antonuzzo2,3
 Andrea Galli1§
 Serena Pillozzi1*§
- 1Department of Experimental and Clinical Biomedical Sciences “Mario Serio”, University of Florence, Florence, Italy
- 2Clinical Oncology Unit, Careggi University Hospital, Florence, Italy
- 3Department of Experimental and Clinical Medicine, University of Florence, Florence, Italy
The incidence and mortality of pancreatic adenocarcinoma (PC) are expected to increase in the coming years, with survival rates remaining poor due to limited treatment options. KRAS mutations, present in over 70% of PC cases, drive aggressive tumor behavior through metabolic reprogramming and immune evasion; however, clinically effective inhibitors for the most common mutations are still lacking. In this study, we analyzed RNA sequencing data from TCGA datasets, comparing tumor versus normal pancreatic tissues and stratifying samples based on KRAS mutation status. Our findings reveal significant dysregulation of the peroxisome proliferator-activated receptor (PPAR) signaling pathway in PC, particularly in the context of KRAS mutations. These findings were validated through RT-qPCR in an independent cohort of primary samples. Key genes, including CD36, FABP4, PLIN1, PLIN4, SCD5, and ACSLs, were consistently downregulated in tumor tissues, with further reductions observed in KRAS-mutated samples. Overall, this study highlights the critical role of PPAR pathway disruption in KRAS-mutated PC, which should be further addressed to improve current treatment strategies.
1 Introduction
In the next 20 years the incidence of pancreatic adenocarcinoma (PC) is set to double especially in developing countries, and mortality estimates more than doubling (1). The range of available treatment options is still restricted to polychemotherapy, which is frequently poorly tolerated due to the rapid deterioration in patients’ clinical conditions. Consequently, the survival rate in advanced PC remains poor, with a median survival time of less than one year (1).
According to the International Cancer Genome Consortium (ICGC) data portal project, substitutions in Kirsten rat sarcoma virus gene (KRAS) occur in 78% of PC, and of them 70% are single-base missense substitutions on codon 12, with G12D (40%), G12V (31%), and G12R (19%) being the three most common mutations (2). Retrospective analyses have shown non-univocal prognoses among KRAS mutations although G12D and G12R seem to have the worst (3–5). Moreover, except for G12C hotspot mutations that account roughly 1% of cases (6), there are no clinically successful inhibitors for the most common mutations. Multi-selective RAS inhibitors (e.g. RAS[ON] inhibitors) are currently under investigation in clinical trials (NCT05379985, NCT04678648). Different combinations of drugs involved in downstream pathway inhibition, such as SOS and SHP2 inhibitors, are able to reduce adaptive escape mechanisms via MAPK in KRAS mutant or amplified cancer cells in gastric cancer cell lines in vitro and in vivo. Moreover, KRAS mutations have been shown to promote immune escape in pancreatic cancer cells by suppressing both the number and activity of T cells, through specific immune-evading mechanisms associated with individual KRAS variants. Several experiences highlighted that, in addition to KRAS mutations, other factors, like changes in the tumor microenvironment (TME) supported by chronic inflammation, insulin resistance, a fatty diet, or factors associated with obesity, may increase KRAS activation and metabolic reprogramming (7). This reprogramming is fundamental in PC progression, involving several metabolic pathways, mainly glucose, glutamine, and fatty acid ones (8). At last, KRAS mutations also impact lipid metabolism. They can upregulate proteins such as FGL1, which alter lipid metabolism and enhance the proliferation of PC cells (9, 10). A high-fat diet has been shown to exacerbate the effects of KRAS mutations, further promoting the metabolic reprogramming of PC (11). KRAS mutations also affect other metabolic pathways, including the synthesis and utilization of acetyl coenzyme A and branched-chain amino acids. These alterations contribute to the aggressive nature of PC by supporting cellular proliferation and survival under nutrient-deprived conditions (8). Moreover, oncogenic KRAS reduces pancreatic FGF21 expression, a metabolic regulator that prevents obesity, partially through downregulating peroxisome proliferator-activated receptor (PPAR)G (12).
Despite its rarity, KRAS wild-type (WT) PC represents a distinct molecular subtype with unique features. Retrospective analyses have shown no difference in Overall Survival (OS) between KRAS-WT and KRAS mutant PCs, regardless of the chemotherapy regimen used (4, 13). Recent evidence has demonstrated a distinct genomic profile in KRAS-WT PCs, identifying specific subgroups; these include forms with extrinsic MAPK pathway activation (e.g. BRAF mutation), those with microsatellite instability (MSI)/defective DNA mismatch repair (dMMR), and PCs with kinase fusion genes (14–16). The recent study by Singhi et al. showed that MAPK signaling is activated in approximately one-third of KRAS-WT PCs (17). In this group, BRAF mutations were the most common, however V600 mutations account for about 20% of the total limiting the possible use of target therapies to few cases. Additional mechanisms involved in MAPK activation have been identified, including gene mutations or amplifications in the GNAS, EGFR, ERBB2, MET, ERBB3, and FGFR2 genes (18). MSI/dMMR PCs have a prevalence of 0.1 to 7% and exhibit a lower frequency of KRAS mutations than conventional PCs. MSI/dMMR PCs are more commonly observed in specific histotypes, including medullary carcinomas, mucinous/colloid variants, and IPMN-derived carcinomas (19). Additionally, approximately 8% of genetic alterations in all KRAS-WT PCs were identified as fusions of specific kinases, including those in FGFR2, RAF, ALK, RET, MET, NTRK1, and FGFR3. In patients with KRAS-WT PC and specific kinase fusions, targeted therapies such as afatinib for NRG1 fusion, crizotinib for MET fusion, and erdafitinib for FGFR2 fusion have been observed to elicit durable responses (15, 20).
In view of the considerable number of mechanisms involved in the development and progression of PC that are primarily driven by KRAS, we aimed to examine the transcriptomic distinctions between KRAS-mutated and KRAS-WT PCs using both a comprehensive transcriptomic approach on public datasets and quantitative real-time reverse transcription PCR (RT-qPCR) analysis on an independent cohort of primary PC.
2 Materials and methods
2.1 PC datasets
The RNA seqencing data used in the present manuscript were provided by The Cancer Genome Atlas (TGCA) as raw read counts obtained by the alignment of RNAseq reads against the Human reference genome (GRCh38) to obtain gene expression profiles. The data provider aligned RNAseq reads against reference using STAR (21) to infer raw read counts for mRNAs. To facilitate harmonization across samples, all RNA-Seq reads were treated as unstranded during analyses (22). The sample data and metadata were retrieved by using the Application Programming Interface (API) of Genomic Data Commons Data Portal (GDC, accessed on 17/11/2022) wrapped in a Python 3 in-house developed script (https://github.com/gdefazio/TCGA_pancreas). This allowed the selection of freely available datasets with “Pancreas” as primary site and labeled as “Primary Tumor” or “Solid Tissue Normal’’ (i.e. the tumor-adjacent normal tissue). Gene expression profiles for 367 tumor vs 72 adjacent normal tissue samples were locally collected. Furthermore, in order to investigate the difference in transcriptome profiles among KRAS mutated and KRAS-WT tumors the Whole Exome Sequencing (WES) data from GDC API were retrieved.
2.2 Unpaired, Paired and KRAS-related group analysis
Expression profile analyses were performed comparing either all the 367 tumor samples with all the 72 adjacent normal tissue samples (unpaired analysis) or in a subset of 42 patients comparing each tumor with its adjacent normal tissue samples (paired analysis). In the paired analysis, KRAS mutated versus WT tumor samples were also compared.
2.3 Identification of differentially expressed genes
A noise reduction strategy was implemented for gene expression data by eliminating genes with a read count ≤10 in more than half of the total samples.
The differential expression analysis was performed by using DESeq2 (v 1.34.0) R package (23). DESeq2 allows to indicate terms of comparison in the experimental design formula. In order to take into the account batch effect of data from different TCGA centres also this label was included in the experimental design formula as suggested in (24). For pairwise comparison only, patients’ case identifier was included in the experimental design formula and batch effect was not with the aim to avoid the “Model matrix not full rank” error (i.e. linear combination of terms) explained in (24).
P-values were adjusted with the Bonferroni method to avoid false-positive results and the 50 most up and down regulated genes with adjusted p-values ≤ 0.05 were taken as differentially expressed.
For DEGs heatmap graphical representation, before the z-score normalization, the batch effect was reduced by using the removeBatchEffect function in the limma (v 3.50.3) R package (25) on gene counts. This was performed only for the analyses in which batch effect was included in the experimental design formula.
2.4 KEGG enrichment analysis
Kyoto Encyclopedia of Genes and Genomes (KEGG) pathway analysis was performed on the lists of up- and down-regulated DEGs using ClusterProfiler (v. 4.2.2) R package (26). Benjamini-Hochberg adjusted p-value was computed and only significantly enriched pathways with more than 10 genes were selected.
2.5 Patients and biopsy processing
Surgical specimens were collected from 18 patients with pathologically confirmed PC who underwent surgical resection for operable disease and referred to the Clinical Oncology Unit, Careggi University Hospital, Florence (Italy). The recruitment period was from 23.03.2023 to 09.01.2024. All participants gave written informed consent before enrollment. Patients were excluded if they had metastatic or locally advanced inoperable disease or if they were under 18 years old.
2.6 Cell lines, drugs and viability assays
KRAS-WT, KRAS-p.G12C and KRAS-p.G12D PC cell lines (BxPC3, MiaPaca-2 and Panc-1 respectively) were obtained from the American Tissue Type Collection and cultured as previously reported (27). MiaPaca-2 and Panc-1 were maintained in Dulbecco’s Modified Eagle’s Medium (DMEM) with 10% foetal bovine serum (FBS), 2 mM glutamine, 50 U/mL penicillin and 50 mg/mL streptomycin (Euroclone, Milan, Italy) at 37°C and 5% CO2. The presence of mycoplasma was periodically tested by PCR. Cell viability was measured using Prestoblue™ Cell Viability reagent (Invitrogen, Waltham, MA, USA) according to the manufacturer’s protocol. The optical density (OD) was measured using a 560nm excitation filter and 590nm emission filter using the BioTek Synergy™ H1 hybrid multi-mode microplate reader (Agilent, CA, USA). The PPARG inhibitor used in this work was GW9662. The KRAS inhibitor used was Sotorasib. Cells were treated with these agents at the corresponding IC50 concentration (13nM for Sotorasib, 9µM for GW9662, both determined at 72h) alone or in combination for 48 hours. Sotorasib and GW9662 were purchased from MedChemExpress (Monmouth Junction, NJ, USA).
2.7 RNA extraction and RT-qPCR
A total of 18 tumor samples of enrolled patients and 13 pancreas tissue samples from healthy donors were used for the analysis of a panel of genes, namely CD36, FABP4, PPARA, PPARD, PPARG, PLIN1, PLIN4, SCD5 and ACSL4. Total RNA was extracted from FF cryosections using the Qiagen RNeasy FFPE extraction.
BxPC3, MiaPaca-2 and Panc-1 cell lines were also used for the analysis of the above genes. Total RNA was extracted from cells using TRIzol reagent (Life Technologies, MI, Italy).
The RNA quantity and purity were evaluated using a Nanodrop spectrophotometer. All mRNAs were retro-transcribed using the Reverse Transcriptase kit 2 (EXPERTEAM, VE, ITALY); RT-qPCR analysis was performed on ABI7000 (Applied Biosystem, Foster City, CA, USA) using QuantiNova SYBR Green PCR Kit (Qiagen, MI, Italy). The primers used were:
GAPDH (QuantiTect Primer Assay QT00079247, Qiagen); YWHAZ (QuantiTect Primer Assay QT00087962, Qiagen); CD36 (QuantiTect Primer Assay QT01974008, Qiagen); FABP4 forward (5’-ACGAGAGGATGATAAACTGGTGG-3’) reverse (5’- GCGAACTTCAGTCCAGGTCAAC-3’); PPARA forward (5’-TCGGCGAGGATAGTTCTGGAAG-3’) reverse (5’-GACCACAGGATAAGTCACCGAG.-3’); PPARD forward 5’-GGCTTCCACTACGGTGTTCATG-3’) reverse (5’-CTGGCACTTGTTGCGGTTCTTC-3’); PPARG (QuantiTect Primer Assay QT00029941, Qiagen); PLIN1 forward (5’-GCGGAATTTGCTGCCAACACTC-3’) reverse (5’-AGACTTCTGGGCTTGCTGGTGT-3’); PLIN4 forward (5’-GATGGCAGAGAACGGTGTGAAG-3’) reverse (5’-CAGGCATAGGTATTGGCAACTGC-3’); SCD5 forward (5’-GAGGAATGTCGTCCTGATGAGC-3’) reverse (5’- GCCAGGAGGAAGCAGAAGTAGG-3’); ACSL4 forward (5’- GCTATCTCCTCAGACACACCGA -3’) reverse (5’-AGGTGCTCCAACTCTGCCAGTA-3’). Each primer was used at 200nM concentration (400nM finale for pairs). Cycle conditions were as follows: initial activation/denaturation 95°C 1’; 40 cycles of: 95°C 15”, 60°C for 1’; standard melting cycle for Applied ABI 7000.
The relative quantification was performed using GAPDH and YWHAZ as housekeeping genes. ΔCt values in tumor and healthy tissue samples were compared with a Wilcoxon rank-sum test.
2.8 Ethics and regulatory considerations
The present study was approved by the Regional Ethics Committee for Clinical Trials of the Tuscany Region (Firenze, Italy; no. 23753_BIO). All informed consent documents were in compliance with the International Conference on Harmonization (ICH) guideline on good clinical practice (GCP). The study protocol was performed in accordance with the principles of the Declaration of Helsinki and in compliance with GCP and the applicable laws and regulations. Each patient was identified by a code instead of the patient’s name in order to protect the patient’s identity when reporting study-related data.
3 Results
3.1 Tumor versus normal pancreatic tissue unpaired analysis
Gene expression data of 367 primary tumors of PC and 72 normal tissue samples were retrieved from 4 different TCGA projects (Supplementary Table S1). A total of 21,412 DEGs including 6,727 up- and 14,685 down-expressed were identified by tumor versus normal tissue comparison. Of these, 55% were protein coding, 26% were lncRNA and 9% were processed pseudogenes. KEGG pathways over-representation analysis (ORA) was performed both on the up- and down-regulated genes, resulting in60 and 66 enriched pathways, respectively (Supplementary Table S2). The 50 most up- and down-regulated genes are reported in Figure 1A. One of the most significantly over-represented pathways in the down-regulated list was PPAR signaling pathway (p.adjusted < 0.001). Figure 1B shows a Volcano plot indicating the specific DEGs related to the PPAR signaling pathway in the tumor vs normal samples.
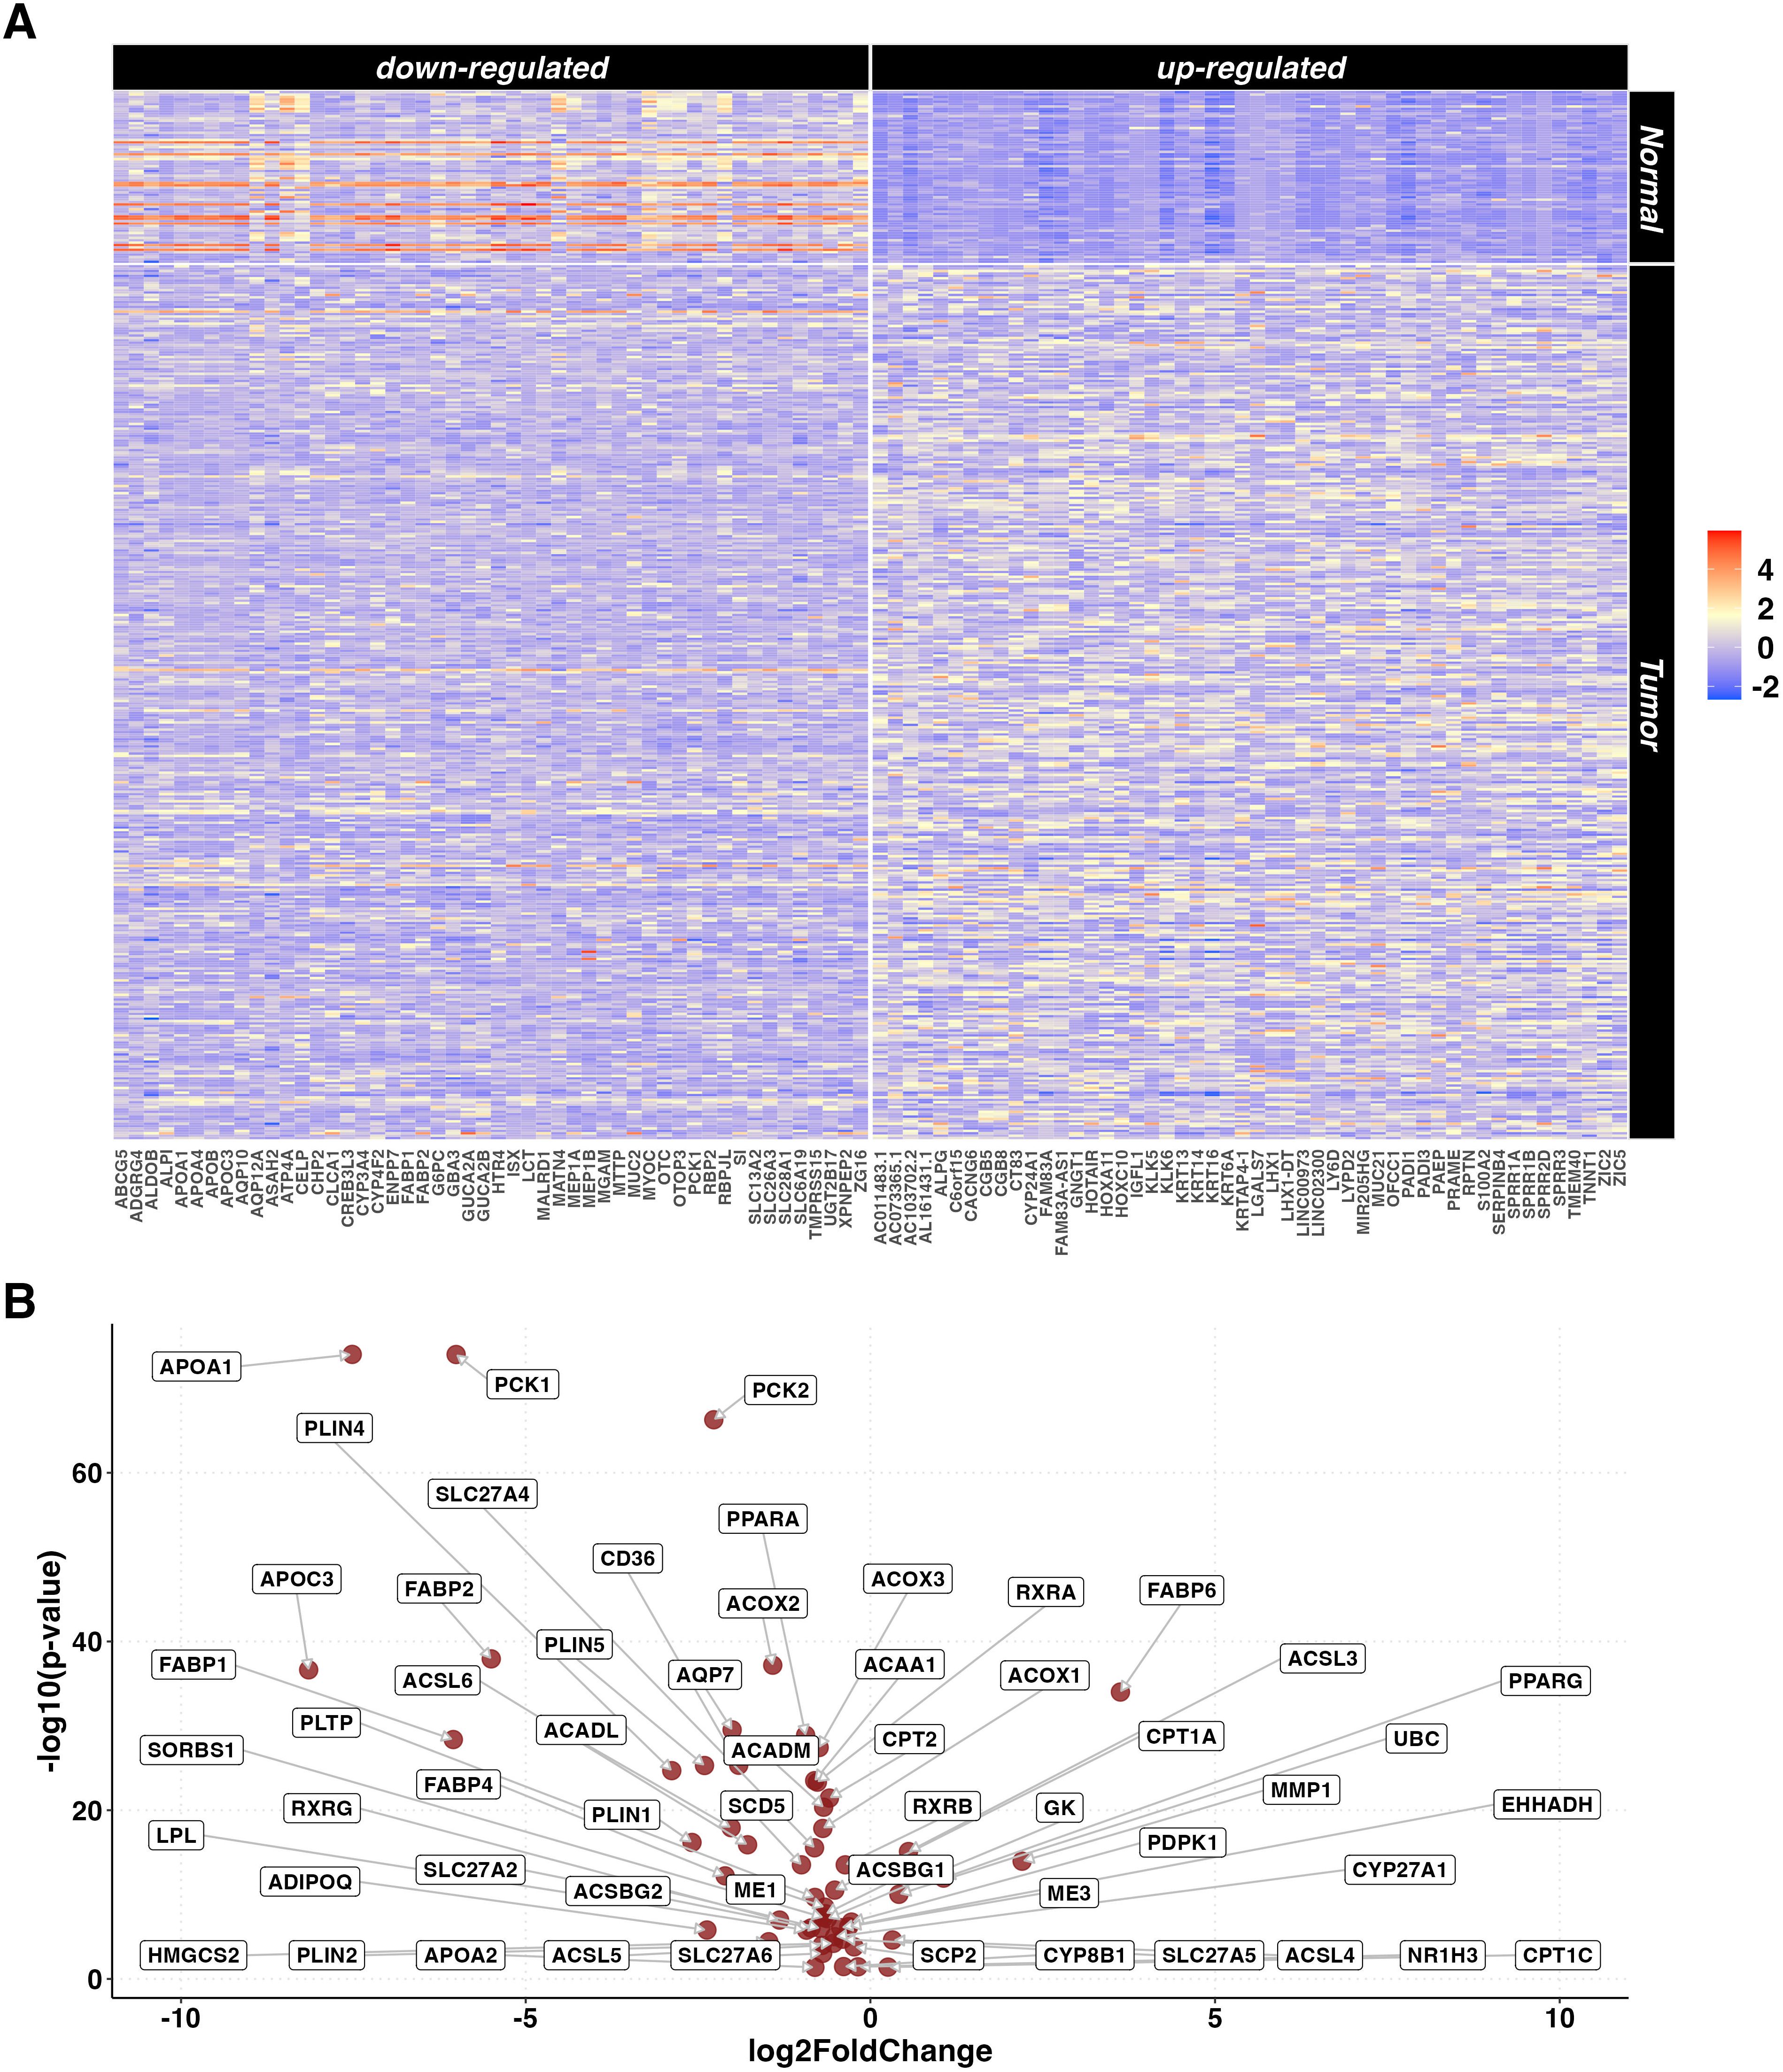
Figure 1. DEGs in tumor vs normal tissue unpaired analysis. (A) Heatmaps representing z-score transformed counts for the most 50 up- (right sided) and down- (left sided) regulated genes in the PC (n=367) vs normal tissue (n=72) unpaired comparison. (B) Volcano plot reporting only the differentially expressed genes related to the PPAR Signaling Pathway in the PC (n=367) vs normal tissue (n=72) unpaired comparison.
3.2 Tumor versus normal pancreatic tissues paired analysis
From the unpaired set, gene expression data of 84 samples (42 tumor and 42 adjacent normal tissue samples) belonging to 42 PC patients were selected. The paired comparison between tumor and adjacent normal tissue samples identified a statistically significant difference in the expression of 15,660 DEGs (6,608 up- and 9,052 down-regulated). Out of these, 63% were protein coding, 22% were lncRNA and 8% were processed pseudogenes. A heatmap representing the 50 most up- and down-regulated genes is reported in Figure 2A. KEGG pathway ORA revealed 64 enriched pathways for the upregulated genes and 35 for the downregulated genes (Supplementary Table S3), notably including PPAR signaling pathway (p=0.007). A Volcano plot showing the PPAR-related DEGs differentially expressed in the paired analysis is reported in Figure 2B.
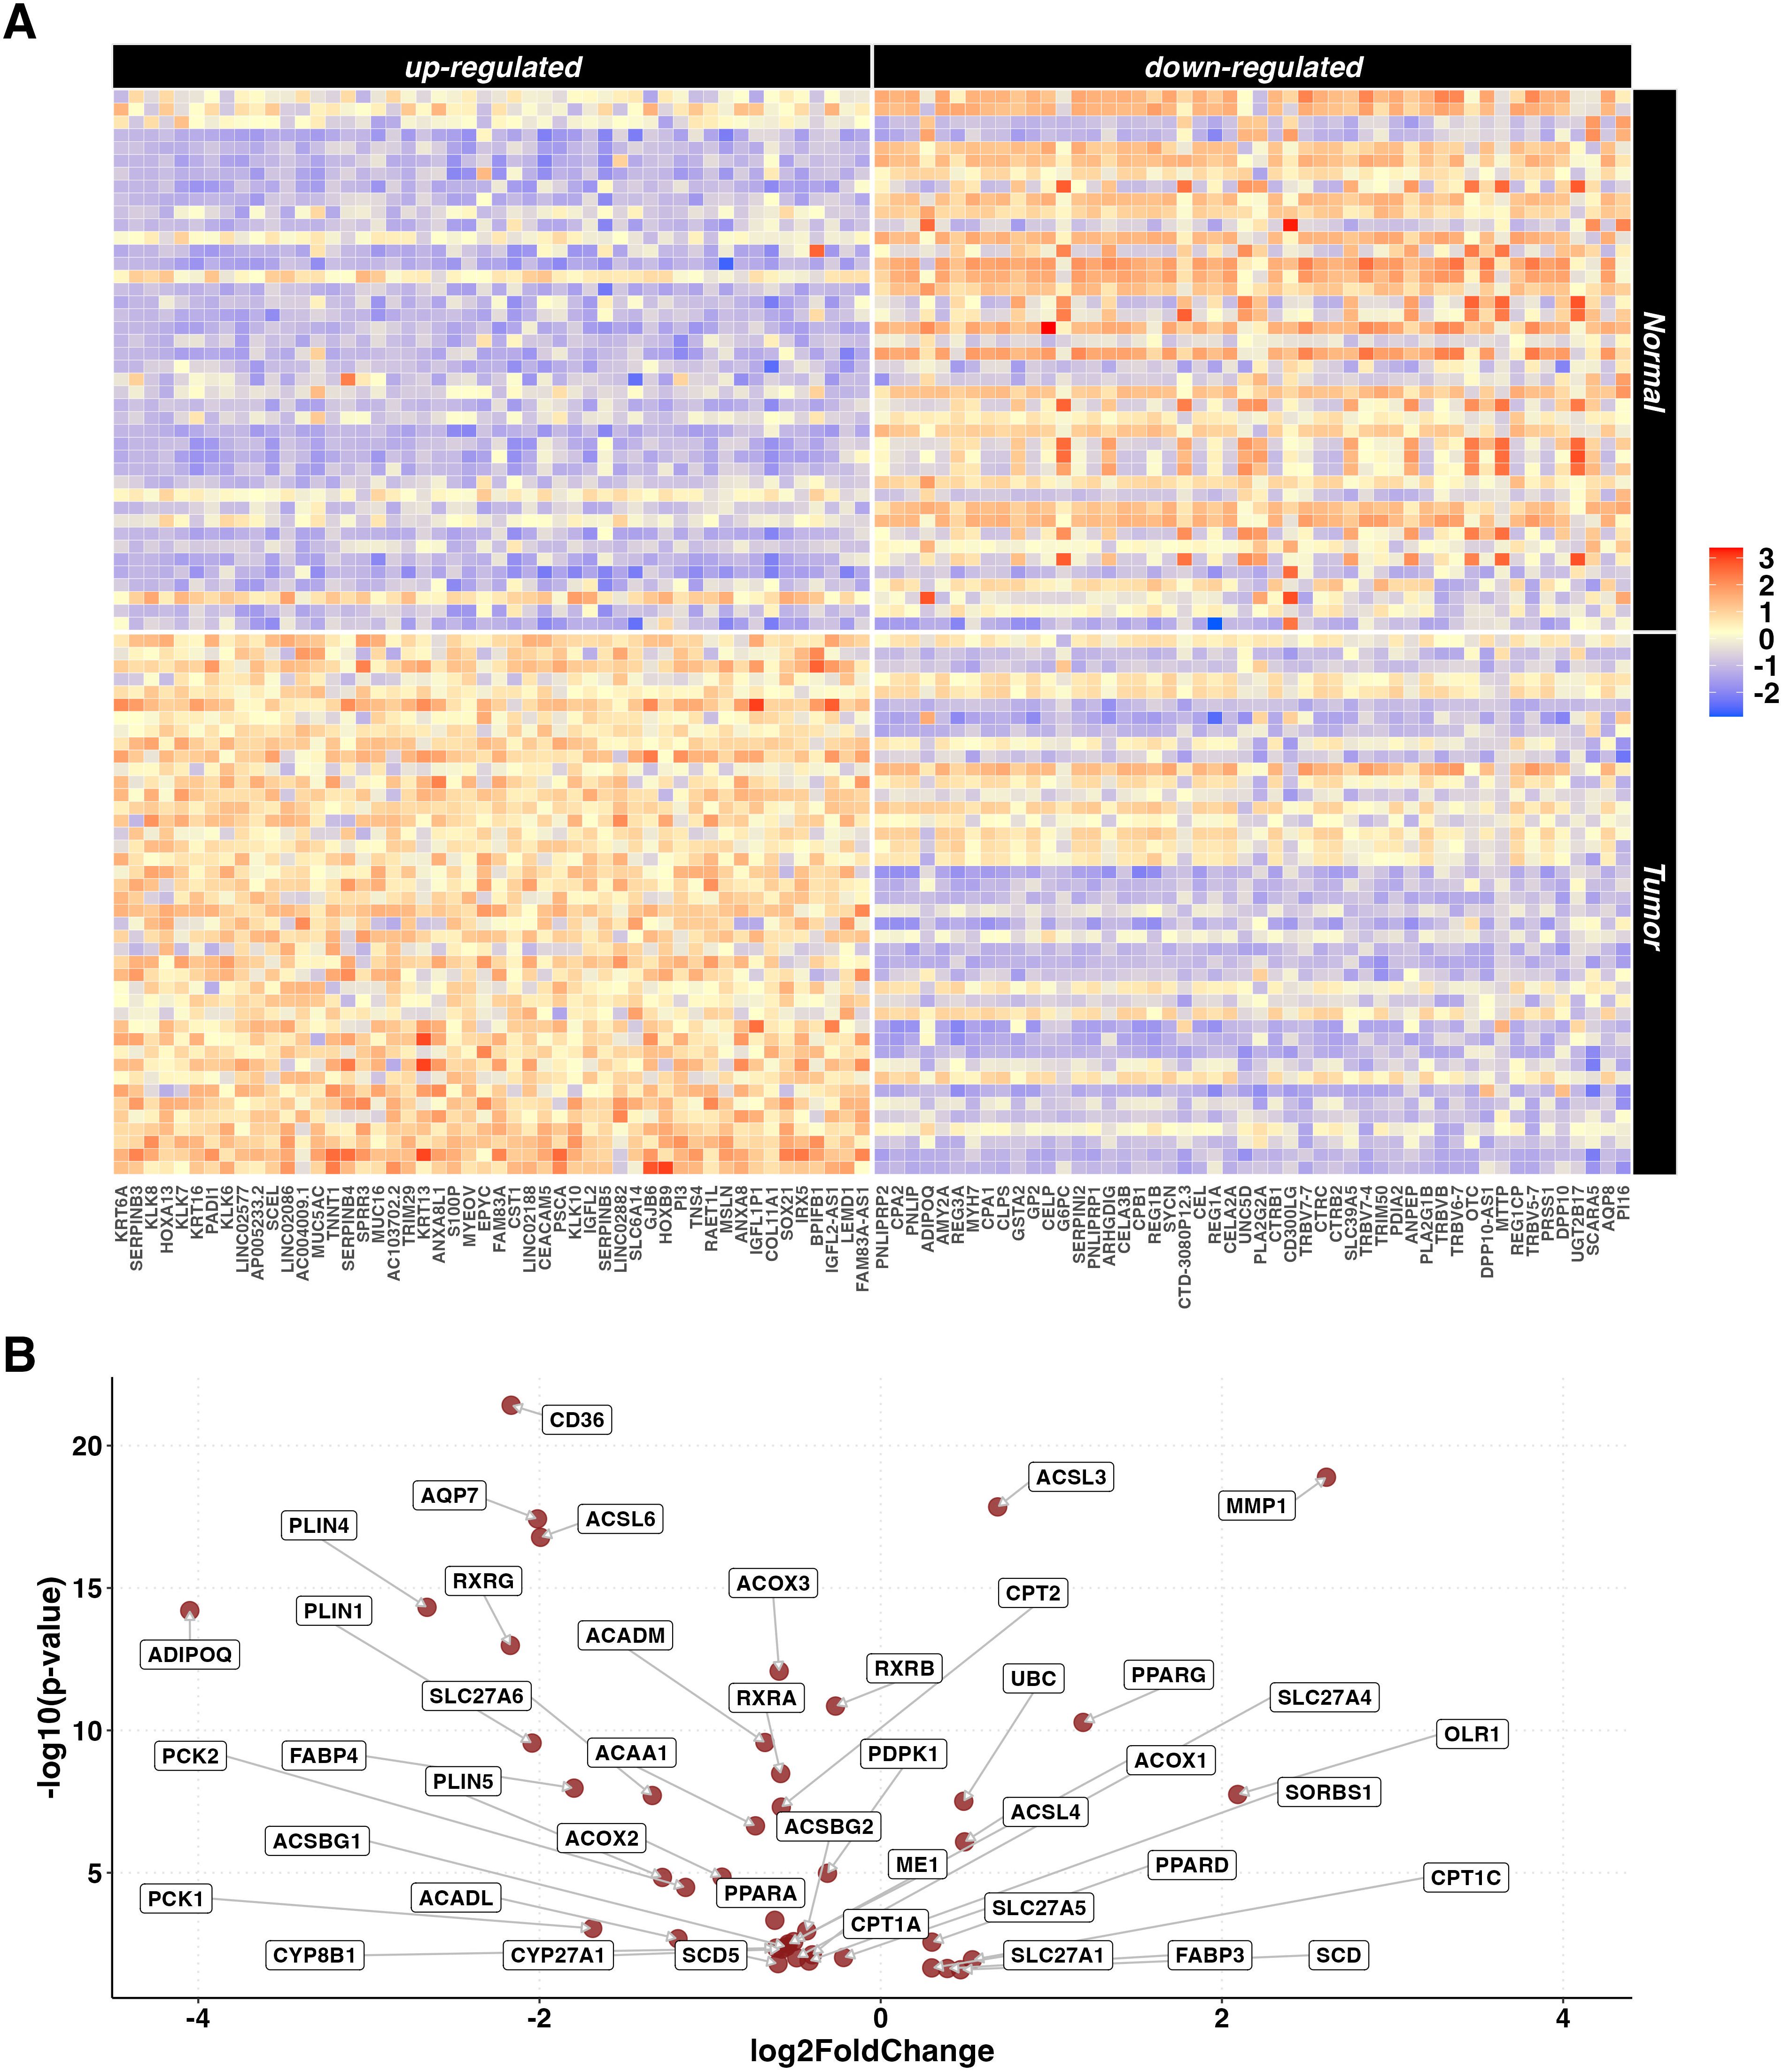
Figure 2. DEGs in paired tumor vs normal tissue analysis. (A) Heatmaps representing z-score transformed counts for the most 50 up- (left sided) and down- (right sided) regulated genes in the PC (n=42) vs normal (n=42) paired comparison. (B) Volcano plot reporting only the differentially expressed genes related to the PPAR Signaling Pathway in the paired PC (n=42) vs normal (n=42) comparison.
To further investigate the role of the PPAR pathway in PC, differences in the expression of the individual genes related to this pathway were evaluated. Results showed that some of the most relevant pathway’s regulators and effectors (CD36, FABP4, PLIN1, PLIN4, SCD5 and ACSL6) showed significantly lower expression in tumor tissue samples (p.adjusted < 0.01, data not shown). Conversely, PPARD and PPARG showed significantly higher expression in tumor tissue samples, however, only PPARG exceeded the threshold of LogFC>1.
3.3 RT-qPCR validation in an independent PC cohort
The differential expression signature identified by the bioinformatic analysis was validated by RT-qPCR analysis in an independent cohort of pancreatic tissue samples (19 primary tumors and 13 normal pancreatic tissue samples) obtained from 32 patients enrolled and operated at Careggi University Hospital. The comparative analysis was focused on the expression of a panel of genes related to the PPAR pathway, lipid metabolism and adipocyte differentiation, namely CD36, FABP4, PPARD, PLIN1, SCD5 and ACSL4. Most of the genes showed expression patterns similar to those observed in the TCGA cohort analysis. Specifically, CD36, FABP4, PLIN1, SCD5 and ACSL4 were significantly downregulated in tumor samples (p < 0.05). Results are reported in Figure 3. A schematic representation of the PPAR pathway, with a particular focus on the genes considered in this analysis, is presented in Figure 4.
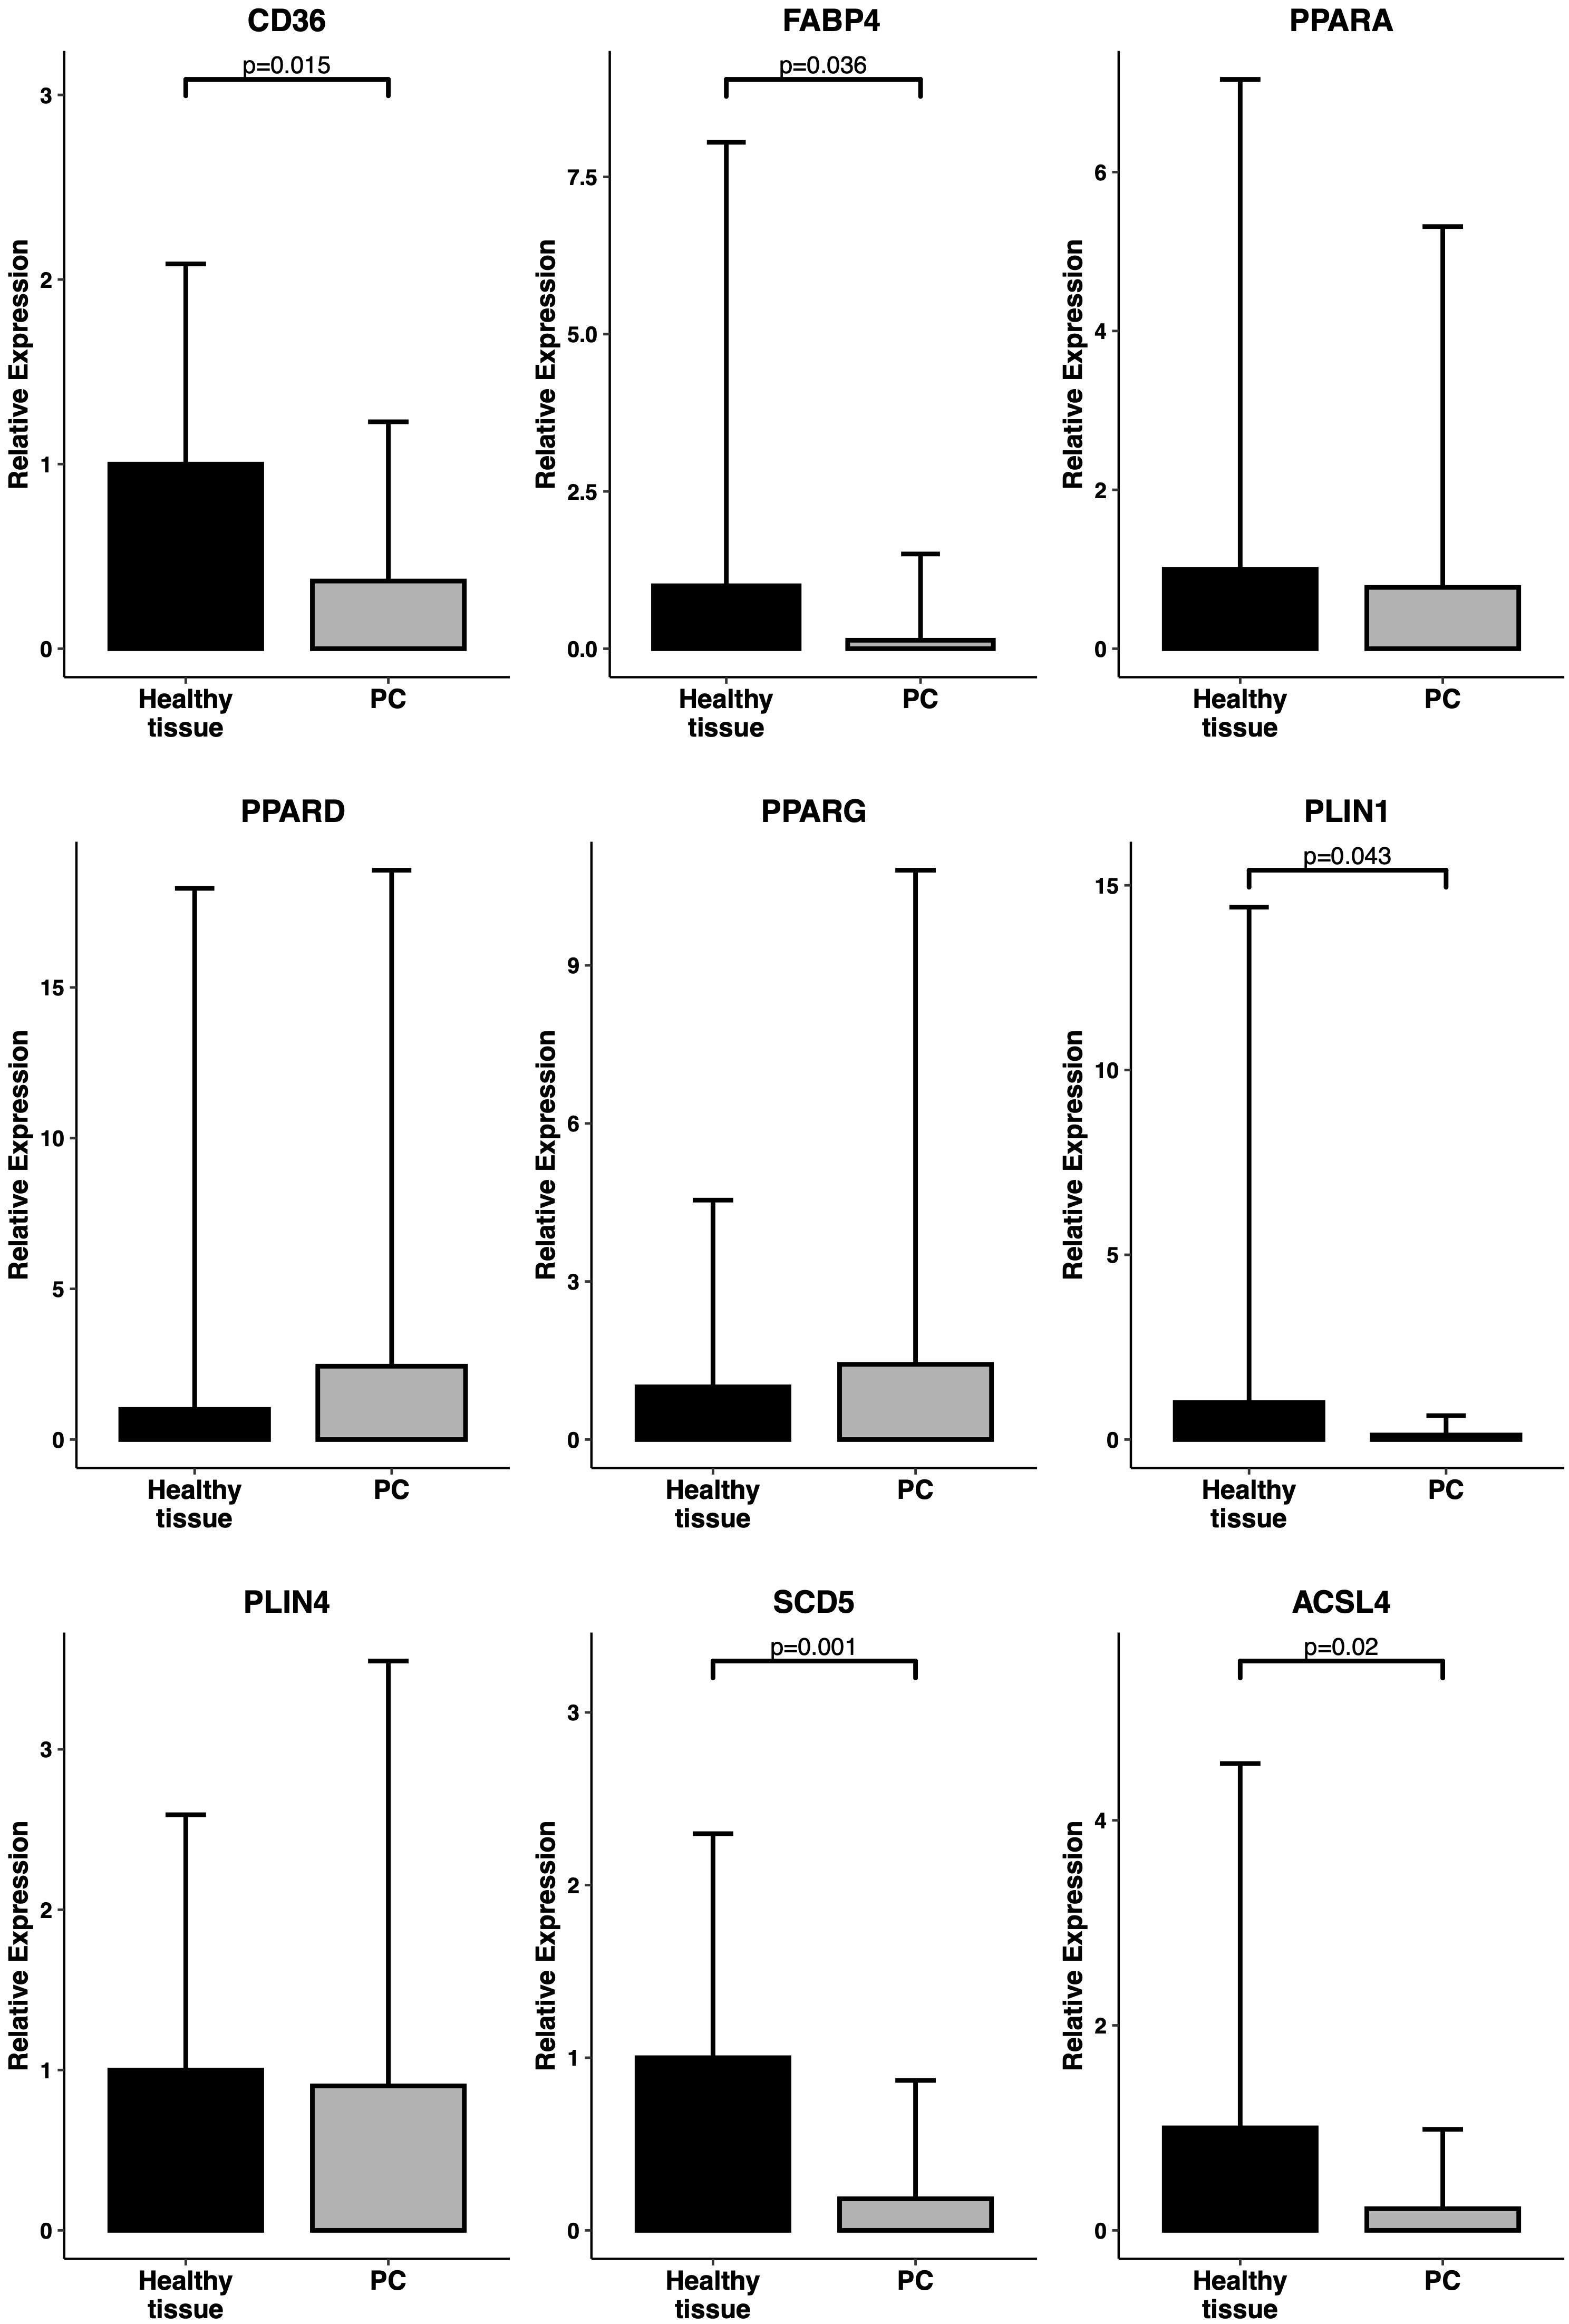
Figure 3. Expression levels of PPAR-related genes in primary samples. RT-qPCR analysis of a panel of PPAR-related genes (CD36, FABP4, PPARA, PPARD, PPARG, PLIN1, PLIN4, SCD5, ACSL4) in an independent cohort of 19 PC samples vs 13 healthy tissue samples. Relative expression is reported as 2^(-ddCT). P-values have been computed by comparison with a Welch’s t-test.
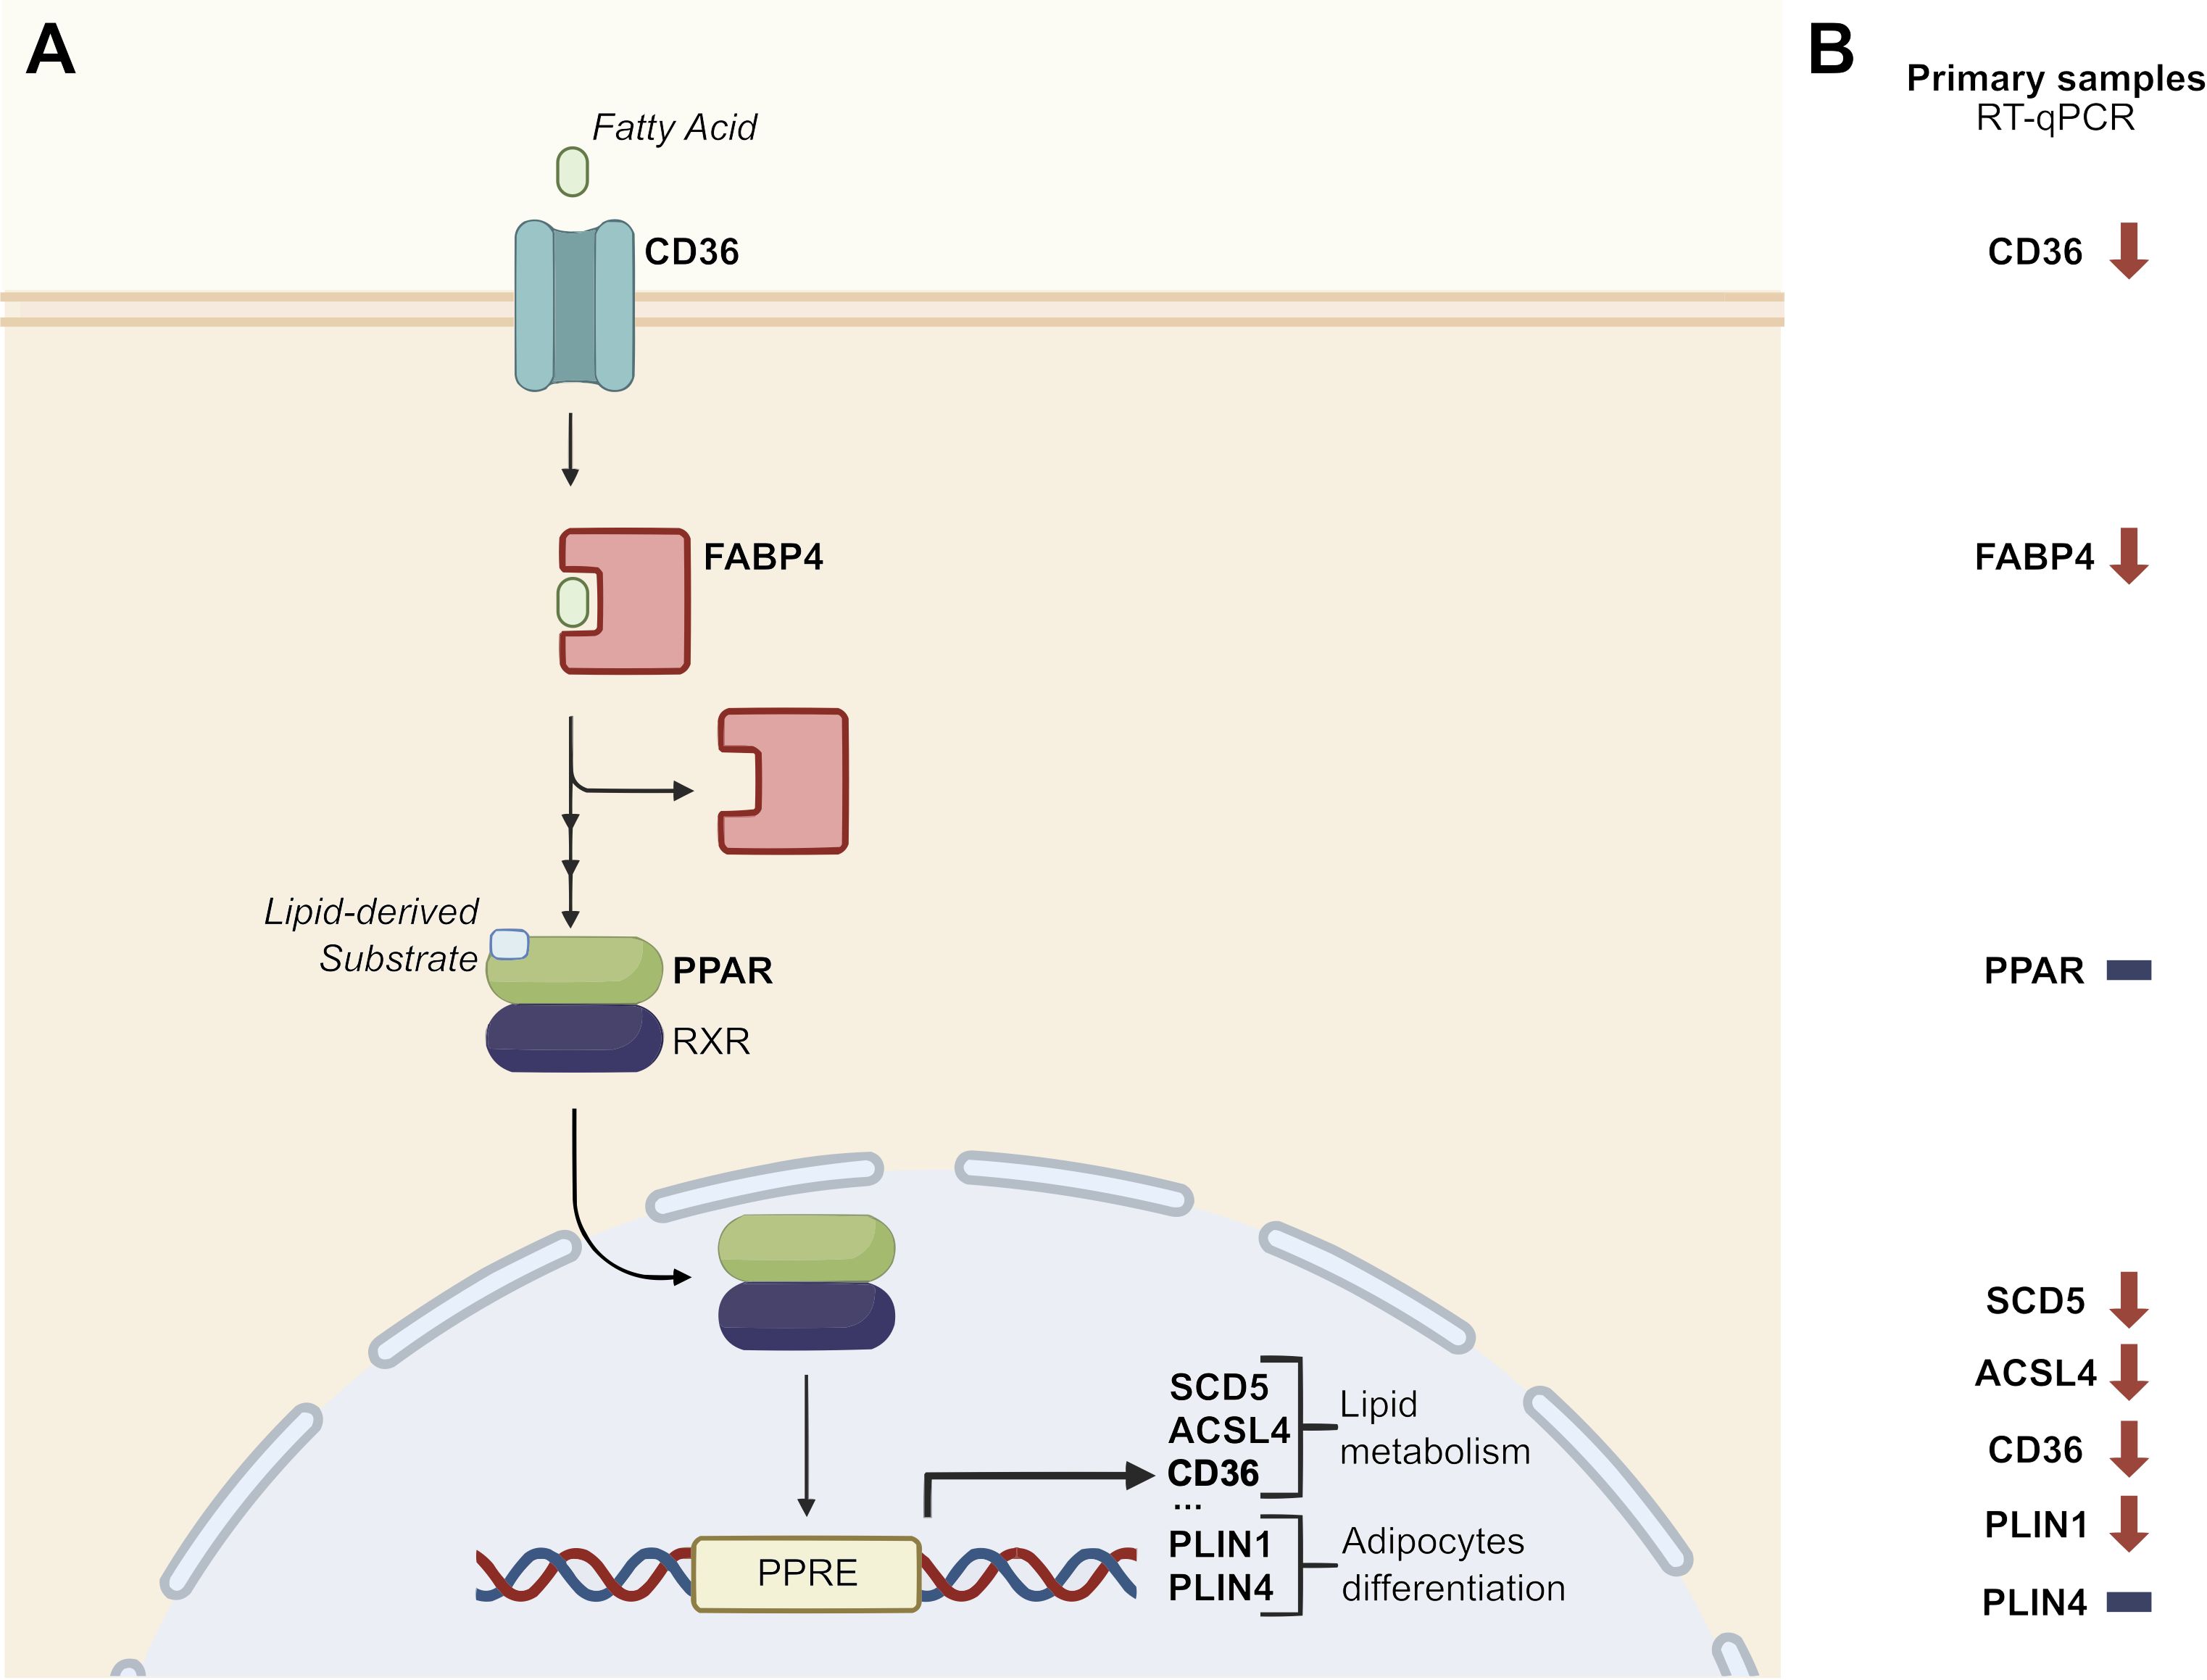
Figure 4. Disruption of PPAR signaling pathway. (A) Schematic representation of the role of a panel of PPAR-related genes in the PPAR signaling pathway (adapted from KEGG pathway hsa03320 – “PPAR signaling pathway – Homo sapiens”). (B) Focus on the relative expression of PPAR-related genes in an independent cohort of 19 PC samples vs 13 healthy pancreatic tissue samples. Downward arrows represent downregulation in tumor samples, horizontal lines represent no difference in tumor vs healthy tissue samples. PPRE: PPAR Response Element.
3.4 KRAS mutated versus WT PC analysis
Since KRAS mutation is considered a main oncogenic driver in the vast majority of PCs, we evaluated if the deregulation of the PPAR pathway could be associated with a specific KRAS mutation profile: Therefore, gene expression data of 6 KRAS-WT versus 36 KRAS-mutated tumor samples from the TCGA dataset were compared. The distribution of the hotspot mutations in the dataset was: n=16 p.G12D, n=10 p.G12V, n=7 p.G12R, n=2 p.Q61H and n=1 p.G12C. The number of DEGs between KRAS-mutated and KRAS-WT samples was 808: 388 genes were up- and 420 were down-regulated in the KRAS-mutated samples. Of these genes, 78% were protein coding, 13% were lncRNA and 3% were processed pseudogenes. Heatmaps showing the 50 most up- and down-regulated genes in KRAS-mutated samples are depicted in Figure 5A. KEGG pathway ORA showed one over-expressed pathway for the up-regulated genes and 5 pathways for the down-regulated genes (Supplementary Table S4). The PPAR signaling pathway was significantly over-represented in the down-regulated genes list (p=0.046).
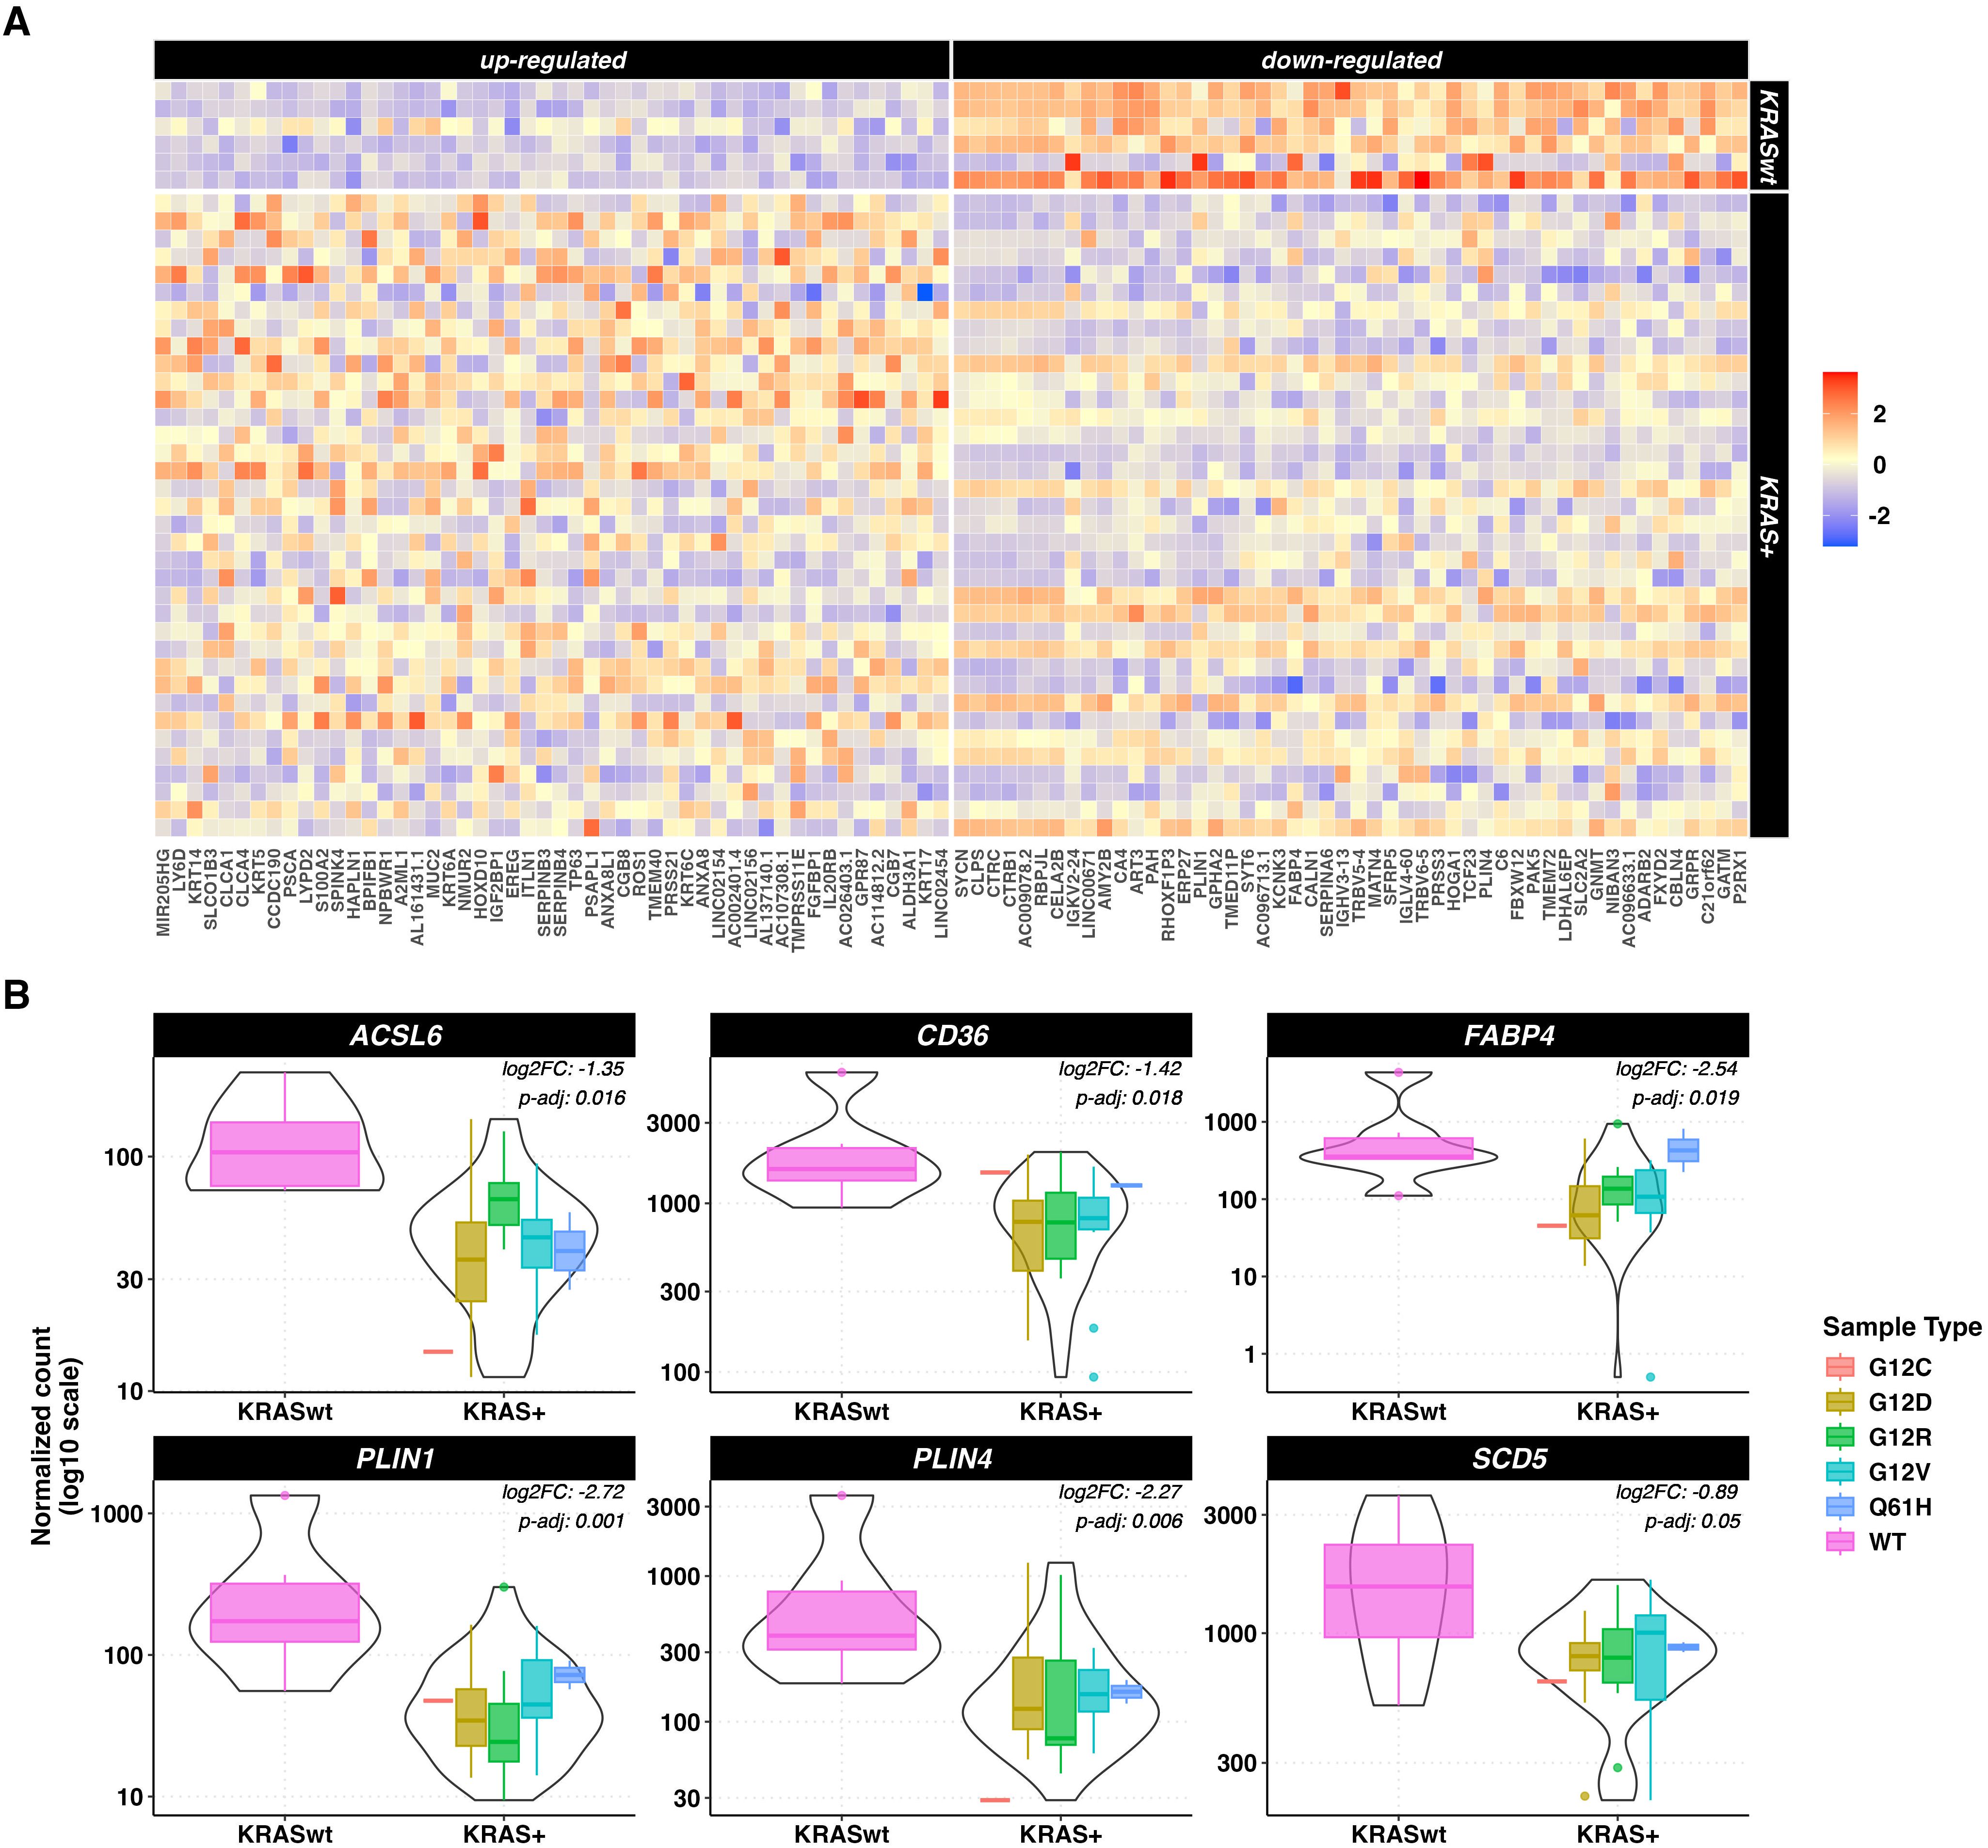
Figure 5. DEGs in tumor vs normal tissue unpaired analysis. (A) heatmaps representing z-score transformed counts for the most 50 up- (left sided) and down- (right sided) regulated genes between the KRAS-mutated (n=36) vs KRAS-WT (n=6) PC samples. (B) Expression levels of ACSL6, CD36, FABP4, PLIN1, PLIN4 and SCD5 in KRAS-mutated vs KRAS-WT pancreatic cancer samples measured as log10-scaled normalized counts. The KRAS mutated group is stratified according to the 5 different KRAS mutations. The p-values and log 2-Fold Changes (L2FC) refer to the KRAS mutated vs WT comparison.
Focusing on the PPAR signaling pathway related genes, 6 under-expressed genes were identified in KRAS-mutated versus KRAS-WT samples, namely ACSL6, CD36, FABP4, PLIN1, PLIN4 and SCD5 (p < 0.5). Results are shown in Figure 5B.
3.5 PPAR signature in PC cell line models
In order to confirm the results obtained from the KRAS-WT vs mutant analysis of PC, RT-qPCR analysis was performed on KRAS-WT, KRAS-p.G12C and KRAS-p.G12D PC cell lines. The influence of KRAS mutations on lipid metabolism and adipocyte differentiation was evaluated by analyzing the expression of PPAR pathway downstream effectors PLIN1, PLIN4 and SCL5. A statistically significant downregulation of PLIN4 and SCD5 was evident in KRAS-mutated vs WT cell lines (p=0.027), while PLIN1 showed no differences among all cell lines (Figure 6).
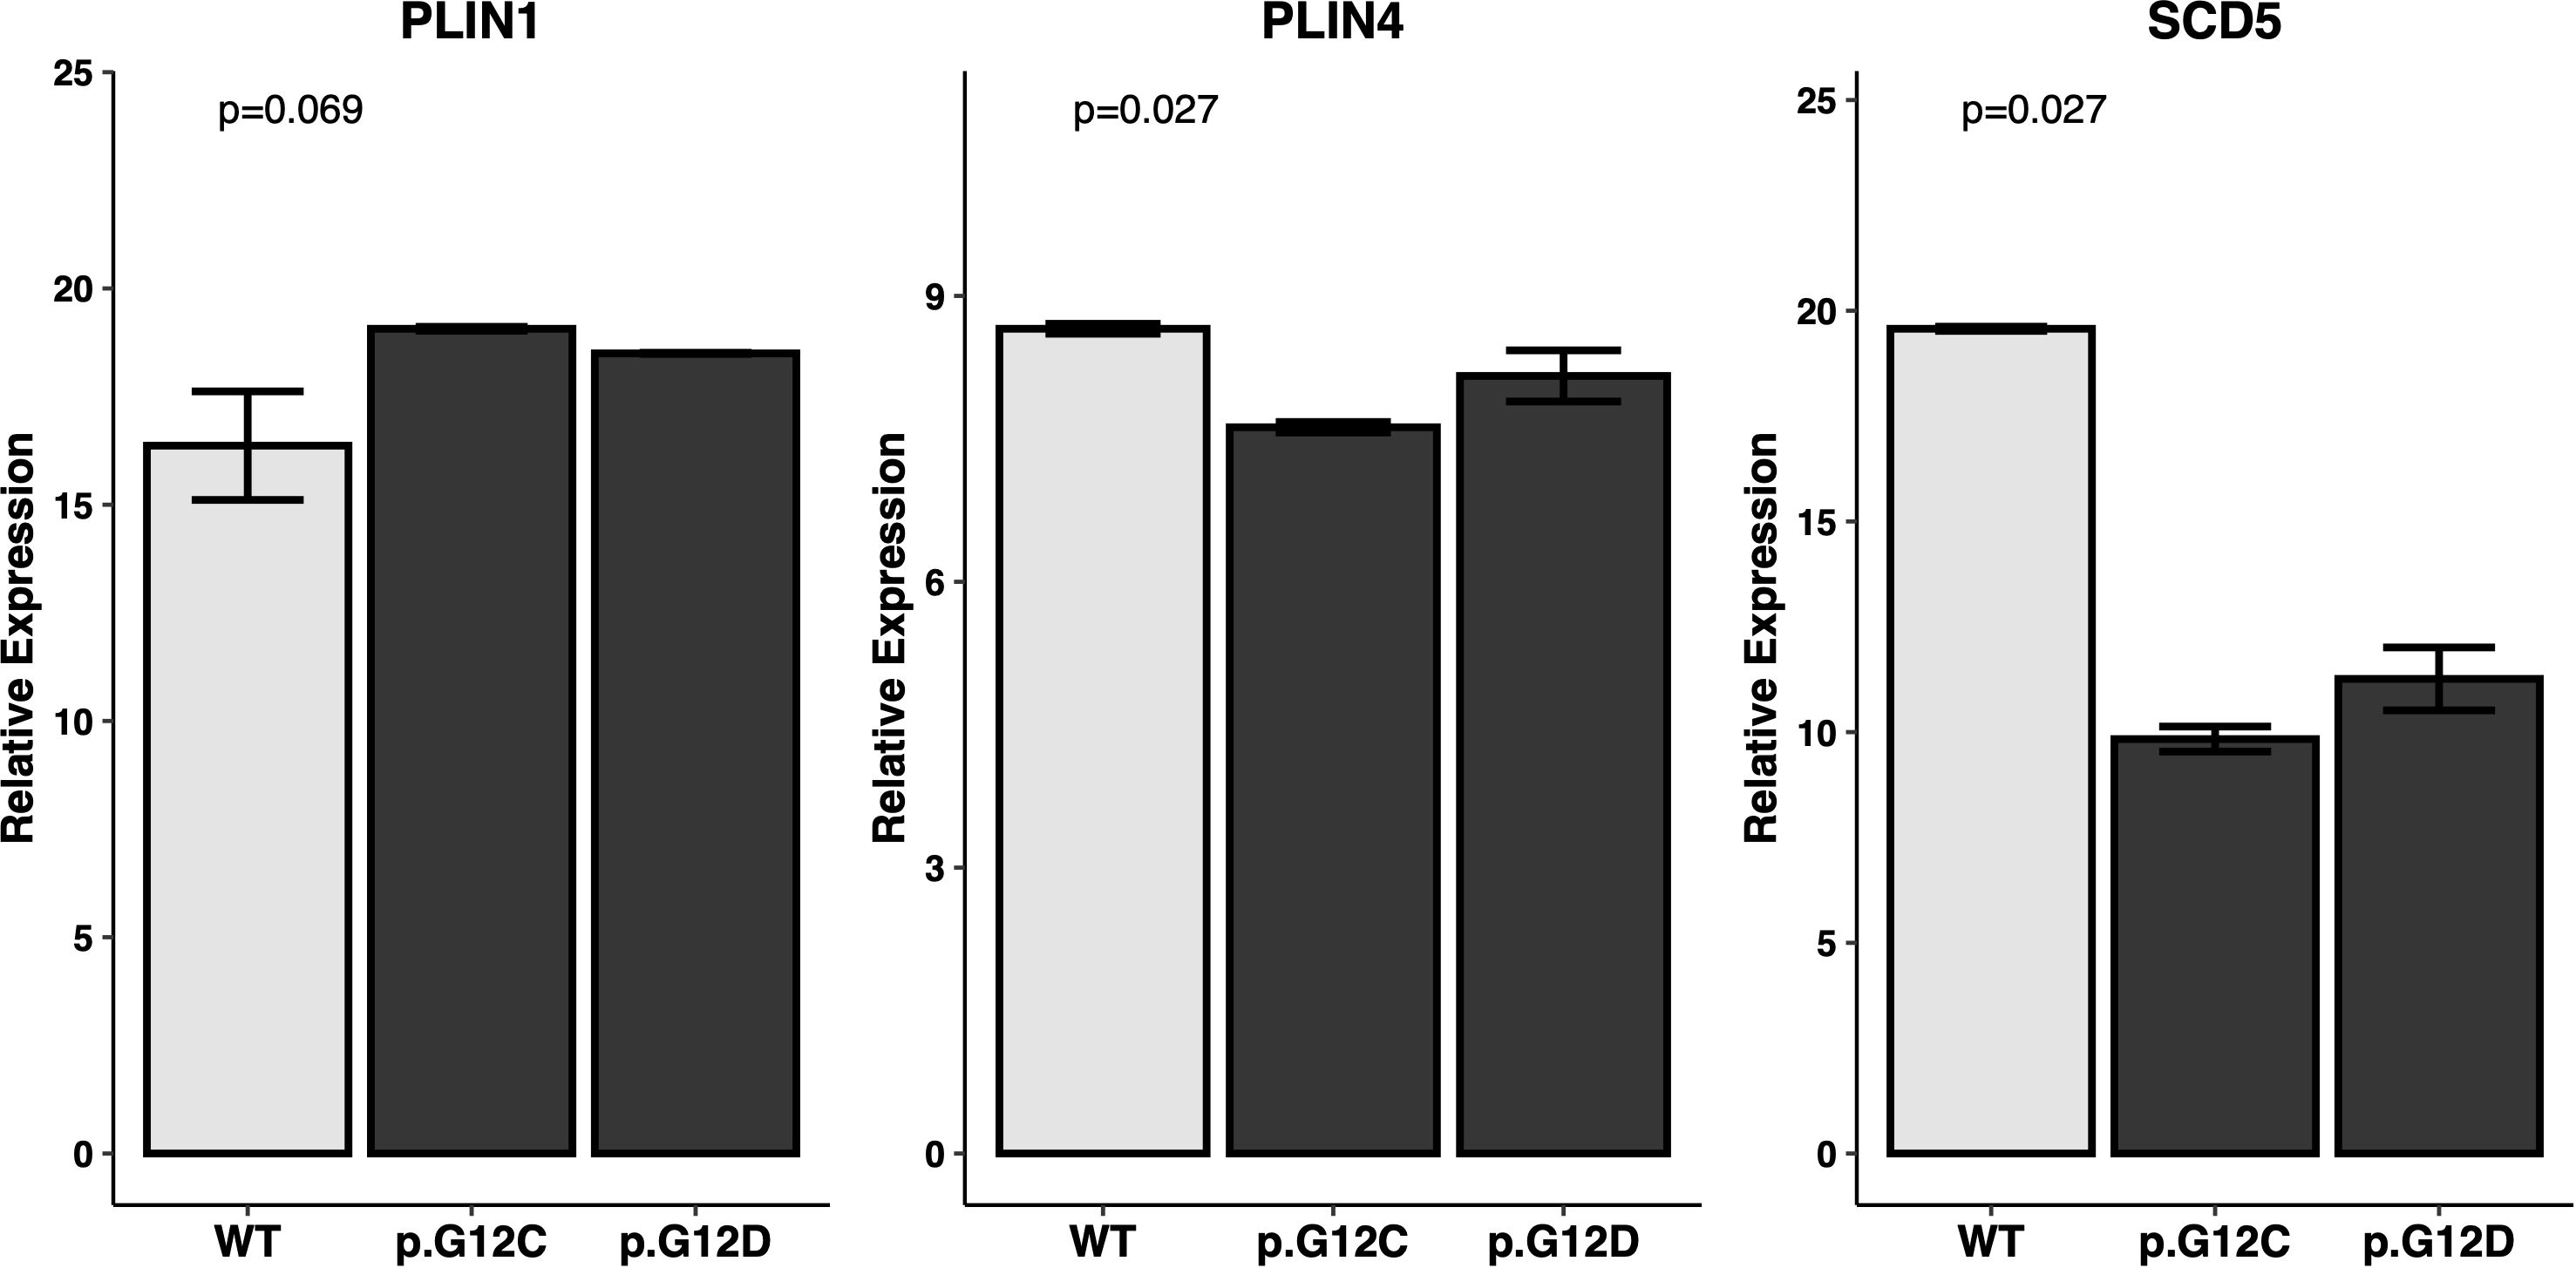
Figure 6. Expression levels of PPAR-related genes in PC cell lines. Expression of the PPAR-related genes of interest (PLIN1, PLIN4, SCD5) was assessed by RT-qPCR in a set of KRAS mutated and KRAS WT PC cell lines. Relative expression is reported as dCT against control genes. Statistical significance expressed by P value has been tested with Kruskall-Wallis’s test.
3.6 PPAR inhibitor in combination with KRAS p.G12C inhibitor reduces PC cell viability in vitro
To investigate the potential interaction between KRAS and PPAR signaling in PC, we evaluated the effect on cell viability in KRAS p.G12C and KRAS p.G12D mutated PC cell lines treated in vitro with the KRAS inhibitor Sotorasib alone or combined with the PPAR inhibitor GW9662. The results reported in Supplementary Figure S1 show that cell viability was significantly reduced in the KRAS p.G12C mutated PC cell line after 48 hours of Sotorasib treatment (p=0.026) and to a greater extent when Sotorasib was combined with GW9662 (p=0.020). A similar inhibitor effect was observed in the KRAS p.G12D mutated PC cell line only after the combined treatment with Sotorasib and GW9662 (p=0.01).
4 Discussion
PC is considered one of the deadliest malignancies worldwide, with limited therapeutic options and a poor prognosis. The addition of novel agents, including immune-checkpoint inhibitors or stroma-targeting drugs, to standard chemotherapy provided disappointing results. Understanding the PC molecular mechanisms and pathogenesis is critical for developing new and more effective treatments.
In our study, over 120 KEGG pathways were found to be differentially expressed in tumor vs healthy tissue samples from a TCGA PC cohort. The subsequent analysis focused on the PPAR signaling pathway, which was significantly deregulated in both unpaired and paired analysis of the TCGA dataset. These findings have also been validated with RT-qPCR analysis in an independent cohort of primary PC samples, further suggesting the disruption of this signaling pathway in PC. Specifically, we observed a significant down-regulation of some of the most relevant genes in the PPAR pathway (CD36, FABP4, PLIN1, PLIN4, SCD5 and ACSL4) in tumor tissue samples. A significant down-regulation of CD36, FABP4, PLIN1, SCD5 and ACSL4 in tumor samples has also been validated by RT-qPCR. These genes are involved in several mechanisms such as fatty acid transport, fatty acid metabolism and lipid droplet formation. Focusing on specific PPAR pathway receptors, we observed PPARG and PPARD upregulation in PC tumor tissue samples in the TCGA cohort. PPAR signaling dysregulation has been previously reported in various cancer types, including PC (28, 29). Several studies have provided insights into the role of specific PPAR genes in the context of metabolic reprogramming and tumor progression, but a consensus is still not defined. PPAR signaling pathway over-expression has been recently observed in metastatic vs primary PC samples of three different public datasets (30). Additionally, PPARD activation driven by metabolic stress and signals from tumor-associated macrophages (TAMs) has been shown to increase epithelial-mesenchymal transition (EMT) and enhance cancer cell invasiveness in in vitro and in vivo models (31); furthermore, PPARD activation by GOT2 regulation in in vitro models has been linked to tumor progression and immune suppression (10). Conversely, PPARD activation has been correlated with the reduction of cell invasion and metastasis related genes in PC cell lines (32). Our findings are in line with a tumor-related role of PPAR genes, but the overall downregulation of the PPAR downstream pathways in tumor samples may reflect a more intricate signaling mechanism. Our analyses were conducted on bulk tumor RNA, therefore the observed alterations may represent a composite effect across multiple cell types, including cancer cells and surrounding stromal or immune cells.
The dichotomy between PPAR receptor over-expression and the downregulation of downstream signaling in PC cells may be attributed to an altered availability of PPAR endogenous ligands. This alteration could result from the downregulation of FABP4 and CD36, both of which play critical roles in lipid uptake in PC cells.
The GTPase KRAS is activated in over 80% of PC and is a driver of tumorigenesis and metabolic reprogramming (33). KRAS mutations are known to drive PC tumorigenesis through various signaling pathways (8, 14). Recent findings obtained both in vitro and in vivo show that PPARD has a pivotal role in promoting the tumorigenesis of KRAS-mutated pancreatic lesions by increasing the recruitment of pancreatic macrophages and myeloid-derived suppressor cells (MDSCs), thus promoting an immunosuppressive TME (34). Conversely, the activation of PPARD leads to the development of a tumor suppressive TME by inhibiting Th2/M2 differentiation (35). Furthermore, KRAS mutations have been associated with the downregulation of PPARA and PPARG (12), reinforcing the interaction between these pathways.
Our study revealed a significant correlation between KRAS mutations and the downregulation of the PPAR signaling pathway. Specifically, a panel of PPAR-related genes (CD36, FABP4, PLIN1, PLIN4, SCD5, and ACSL4) were significantly under-expressed in KRAS-mutated samples compared to WT samples. In our in vitro experiments, we further validated the influence of KRAS mutations on PPAR signaling. RT-qPCR experiments conducted on KRAS WT, KRAS p.G12C, and KRAS p.G12D cell lines confirmed a significant downregulation of PLIN4 and SCD5 in KRAS-mutated cell lines.
KRAS has been thought to promote a shift to aerobic glycolysis and anabolic glucose metabolism (36). However, our understanding of KRAS-driven metabolic reprogramming has evolved to include alterations in scavenging pathways, amino acid metabolism, and lipid metabolism (37). Our findings align with previous research indicating that KRAS mutations modulate metabolic pathways, including lipid metabolism, to support the energetic and biosynthetic demands of rapidly proliferating cancer cells (38).
The deregulation of the PPAR pathway in the context of KRAS mutations presents potential therapeutic opportunities. A recent study explored the Hippo-FAM60A-PPAR axis as a key regulator of ferroptosis and a therapeutic target in KRAS-mutated PPAR cell lines (39). PPAR agonists such as thiazolidinediones (TZDs) have been explored for their anti-tumor effects in various cancer types (40, 41); however, the clinical use for PC treatment did not yield successful results in clinical trials (42), maybe due to drug regimen which has been optimized for type-2 diabetes indication or to alternative nongenomic mechanisms described for this multifunctional receptor (43).
In conclusion, our study provides evidence for the significant deregulation of the PPAR signaling pathway in PC, particularly in the context of KRAS mutations, in both a public cohort and an independent cohort of primary tumor samples. The consistent down-regulation of key PPAR-related genes involved in lipid metabolism underscores potential metabolic vulnerabilities in KRAS-mutated PC, which could be exploited to develop more effective treatment strategies.
Data availability statement
The original contributions presented in the study are included in the article/Supplementary Material. Further inquiries can be directed to the corresponding author.
Ethics statement
The studies involving humans were approved by Regional Ethics Committee for Clinical Trials of the Tuscany Region (Firenze, Italy; no. 23753_BIO). The studies were conducted in accordance with the local legislation and institutional requirements. The participants provided their written informed consent to participate in this study.
Author contributions
GD: Data curation, Formal Analysis, Writing – original draft. FS: Data curation, Formal Analysis, Writing – original draft. SF: Data curation, Writing – original draft. SPo: Writing – review & editing. DL: Writing – review & editing. LP: Data curation, Writing – review & editing. AT: Data curation, Writing – review & editing. ML: Writing – review & editing. LA: Funding acquisition, Writing – review & editing. AG: Funding acquisition, Writing – review & editing. SPi: Conceptualization, Supervision, Writing – review & editing.
Funding
The author(s) declare financial support was received for the research and/or publication of this article. This study was funded by Departments of Excellence award 2023-2027, Ministry of University and Research to Serena Pillozzi.
Conflict of interest
The authors declare that the research was conducted in the absence of any commercial or financial relationships that could be construed as a potential conflict of interest.
The author(s) declared that they were an editorial board member of Frontiers, at the time of submission. This had no impact on the peer review process and the final decision.
Generative AI statement
The author(s) declare that no Generative AI was used in the creation of this manuscript.
Publisher’s note
All claims expressed in this article are solely those of the authors and do not necessarily represent those of their affiliated organizations, or those of the publisher, the editors and the reviewers. Any product that may be evaluated in this article, or claim that may be made by its manufacturer, is not guaranteed or endorsed by the publisher.
Supplementary material
The Supplementary Material for this article can be found online at: https://www.frontiersin.org/articles/10.3389/fonc.2025.1613773/full#supplementary-material
References
1. Cancer Tomorrow. (2024). Available online at: https://gco.iarc.who.int/today/ (Accessed January 08, 2024).
2. ICGC Data Portal. (2024). Available online at: https://dcc.icgc.org/ (Accessed January 08, 2024).
3. Rachakonda PS, Bauer AS, Xie H, Campa D, Rizzato C, Canzian F, et al. Somatic mutations in exocrine pancreatic tumors: association with patient survival. PLoS One. (2013) 8:e60870. doi: 10.1371/journal.pone.0060870
4. Bournet B, Muscari F, Buscail C, Assenat E, Barthet M, Hammel P, et al. KRAS G12D mutation subtype is A prognostic factor for advanced pancreatic adenocarcinoma. Clin Transl Gastroenterol. (2016) 7:e157. doi: 10.1038/ctg.2016.18
5. Dai M, Jahanzaib R, Liao Y, Yao F, Li J, Teng X, et al. Prognostic value of KRAS subtype in patients with PDAC undergoing radical resection. Front Oncol. (2022) 12:1074538/full. doi: 10.3389/fonc.2022.1074538/full
6. Strickler JH, Satake H, George TJ, Yaeger R, Hollebecque A, Garrido-Laguna I, et al. Sotorasib in KRAS p.G12C-mutated advanced pancreatic cancer. N Engl J Med. (2023) 388:33–43. doi: 10.1056/NEJMoa2208470
7. Eibl G and Rozengurt E. KRAS, YAP, and obesity in pancreatic cancer: A signaling network with multiple loops. Semin Cancer Biol. (2019) 54:50–62. doi: 10.1016/j.semcancer.2017.10.007
8. Zhang Z, Zhang H, Liao X, and Tsai HI. KRAS mutation: The booster of pancreatic ductal adenocarcinoma transformation and progression. Front Cell Dev Biol. (2023) 11:1147676. doi: 10.3389/fcell.2023.1147676
9. Chiu CF, Hsu MI, Yeh HY, Park JM, Shen YS, Tung TH, et al. Eicosapentaenoic acid inhibits KRAS mutant pancreatic cancer cell growth by suppressing hepassocin expression and STAT3 phosphorylation. Biomolecules. (2021) 11:370. doi: 10.3390/biom11030370
10. Abrego J, Sanford-Crane H, Oon C, Xiao X, Betts CB, Sun D, et al. A cancer cell–intrinsic GOT2–PPARδ Axis suppresses antitumor immunity. Cancer Discovery. (2022) 12:2414–33. doi: 10.1158/2159-8290.CD-22-0661
11. Philip B, Roland CL, Daniluk J, Liu Y, Chatterjee D, Gomez SB, et al. A high-fat diet activates oncogenic Kras and COX2 to induce development of pancreatic ductal adenocarcinoma in mice. Gastroenterology. (2013) 145:1449–58. doi: 10.1053/j.gastro.2013.08.018
12. Luo Y, Yang Y, Liu M, Wang D, Wang F, Bi Y, et al. Oncogenic KRAS reduces expression of FGF21 in acinar cells to promote pancreatic tumorigenesis in mice on a high-fat diet. Gastroenterology. (2019) 157:1413–1428.e11. doi: 10.1053/j.gastro.2019.07.030
13. Boeck S, Jung A, Laubender RP, Neumann J, Egg R, Goritschan C, et al. KRAS mutation status is not predictive for objective response to anti-EGFR treatment with erlotinib in patients with advanced pancreatic cancer. J Gastroenterol. (2013) 48:544–8. doi: 10.1007/s00535-013-0767-4
14. Philip PA, Azar I, Xiu J, Hall MJ, Hendifar AE, Lou E, et al. Molecular characterization of KRAS wild type tumors in patients with pancreatic adenocarcinoma. Clin Cancer Res. (2022) 28:2704–14. doi: 10.1158/1078-0432.CCR-21-3581
15. Fusco MJ, Saeed-Vafa D, Carballido EM, Boyle TA, Malafa M, Blue KL, et al. Identification of targetable gene fusions and structural rearrangements to foster precision medicine in KRAS wild-type pancreatic cancer. JCO Precis Oncol. (2021) 5:PO.20.00265. doi: 10.1200/PO.20.00265
16. Topham JT, Tsang ES, Karasinska JM, Metcalfe A, Ali H, Kalloger SE, et al. Integrative analysis of KRAS wildtype metastatic pancreatic ductal adenocarcinoma reveals mutation and expression-based similarities to cholangiocarcinoma. Nat Commun. (2022) 13:5941. doi: 10.1038/s41467-022-33718-7
17. Singhi AD, George B, Greenbowe JR, Chung J, Suh J, Maitra A, et al. Real-time targeted genome profile analysis of pancreatic ductal adenocarcinomas identifies genetic alterations that might be targeted with existing drugs or used as biomarkers. Gastroenterology. (2019) 156:2242–2253.e4. doi: 10.1053/j.gastro.2019.02.037
18. Bailey P, Chang DK, Nones K, Johns AL, Patch AM, Gingras MC, et al. Genomic analyses identify molecular subtypes of pancreatic cancer. Nature. (2016) 531:47–52. doi: 10.1038/nature16965
19. Luchini C, Paolino G, Mattiolo P, Piredda ML, Cavaliere A, Gaule M, et al. KRAS wild-type pancreatic ductal adenocarcinoma: molecular pathology and therapeutic opportunities. J Exp Clin Cancer Res. (2020) 39:227. doi: 10.1186/s13046-020-01732-6
20. Jones MR, Williamson LM, Topham JT, Lee MKC, Goytain A, Ho J, et al. NRG1 gene fusions are recurrent, clinically actionable gene rearrangements in KRAS wild-type pancreatic ductal adenocarcinoma. Clin Cancer Res. (2019) 25:4674–81. doi: 10.1158/1078-0432.CCR-19-0191
21. Dobin A, Davis CA, Schlesinger F, Drenkow J, Zaleski C, Jha S, et al. STAR: ultrafast universal RNA-seq aligner. Bioinformatics. (2013) 29:15–21. doi: 10.1093/bioinformatics/bts635
22. Introduction - GDC Docs. (2024). Available online at: https://docs.gdc.cancer.gov/Data/Introduction/ (Accessed August 09, 2023).
23. Love MI, Huber W, and Anders S. Moderated estimation of fold change and dispersion for RNA-seq data with DESeq2. Genome Biol. (2014) 15:550. doi: 10.1186/s13059-014-0550-8
24. Love MI, Anders S, and Huber W. Bioconductor. In: DESeq2: Differential gene expression analysis based on the negative binomial distribution. Seattle (WA): Bioconductor Project (2023). Available online at: https://bioconductor.org/packages/devel/bioc/vignettes/DESeq2/inst/doc/DESeq2.html (Accessed August 09, 2023).
25. Ritchie ME, Phipson B, Wu D, Hu Y, Law CW, Shi W, et al. limma powers differential expression analyses for RNA-sequencing and microarray studies. Nucleic Acids Res. (2015) 43:e47. doi: 10.1093/nar/gkv007
26. Wu T, Hu E, Xu S, Chen M, Guo P, Dai Z, et al. clusterProfiler 4.0: A universal enrichment tool for interpreting omics data. Innovation (Camb). (2021) 2:100141. doi: 10.1016/j.xinn.2021.100141
27. Polvani S, Tarocchi M, Tempesti S, Mello T, Ceni E, Buccoliero F, et al. COUP-TFII in pancreatic adenocarcinoma: clinical implication for patient survival and tumor progression. Int J Cancer. (2014) 134:1648–58. doi: 10.1002/ijc.28502
28. Lecarpentier Y, Claes V, Vallée A, and Hébert JL. Thermodynamics in cancers: opposing interactions between PPAR gamma and the canonical WNT/beta-catenin pathway. Clin Transl Med. (2017) 6:14. doi: 10.1186/s40169-017-0144-7
29. Zeng W, Yin X, Jiang Y, Jin L, and Liang W. PPARα at the crossroad of metabolic–immune regulation in cancer. FEBS J. (2022) 289:7726–39. doi: 10.1111/febs.16181
30. Xu J, Liao K, Wang X, He J, and Wang X. Combining bioinformatics techniques to explore the molecular mechanisms involved in pancreatic cancer metastasis and prognosis. J Cell Mol Med. (2020) 24:14128–38. doi: 10.1111/jcmm.16023
31. Parejo-Alonso B, Barneda D, Trabulo S, Courtois S, Compte-Sancerni S, Ruiz-Cañas L, et al. PPAR-delta acts as a metabolic master checkpoint for metastasis in pancreatic cancer. bioRxiv. (2021). doi: 10.1101/2021.11.15.468579v1
32. Coleman JD, Thompson JT, Smith RW III, Prokopczyk B, and Vanden Heuvel JP. Role of peroxisome proliferator-activated receptor β/δ and B-cell lymphoma-6 in regulation of genes involved in metastasis and migration in pancreatic cancer cells. PPAR Res. (2013) 2013:121956. doi: 10.1155/2013/121956
33. Kerr EM, Gaude E, Turrell FK, Frezza C, and Martins CP. Mutant Kras copy number defines metabolic reprogramming and therapeutic susceptibilities. Nature. (2016) 531:110–3. doi: 10.1038/nature16967
34. Liu Y, Deguchi Y, Wei D, Liu F, Moussalli MJ, Deguchi E, et al. Rapid acceleration of KRAS-mutant pancreatic carcinogenesis via remodeling of tumor immune microenvironment by PPARδ. Nat Commun. (2022) 13:2665. doi: 10.1038/s41467-022-30392-7
35. Gutting T, Weber CA, Weidner P, Herweck F, Henn S, Friedrich T, et al. PPARγ-activation increases intestinal M1 macrophages and mitigates formation of serrated adenomas in mutant KRAS mice. Oncoimmunology. (2018) 7:e1423168. doi: 10.1080/2162402X.2017.1423168
36. Racker E, Resnick RJ, and Feldman R. Glycolysis and methylaminoisobutyrate uptake in rat-1 cells transfected with ras or myc oncogenes. Proc Natl Acad Sci U S A. (1985) 82:3535–8. doi: 10.1073/pnas.82.11.3535
37. Pupo E, Avanzato D, Middonti E, Bussolino F, and Lanzetti L. KRAS-driven metabolic rewiring reveals novel actionable targets in cancer. Front Oncol. (2019) 9:848/full. doi: 10.3389/fonc.2019.00848/full
38. Rozeveld CN, Johnson KM, Zhang L, and Razidlo GL. KRAS controls pancreatic cancer cell lipid metabolism and invasive potential through the lipase HSL. Cancer Res. (2020) 80:4932–45. doi: 10.1158/0008-5472.CAN-20-1255
39. Pan H, Sun Y, Qian LH, Liao YN, Gai YZ, Huo YM, et al. A nutrient-deficient microenvironment facilitates ferroptosis resistance via the FAM60A–PPAR axis in pancreatic ductal adenocarcinoma. Research. (2024) 7:0300. doi: 10.34133/research.0300
40. Mrowka P and Glodkowska-Mrowka E. PPARγ Agonists in combination cancer therapies. Curr Cancer Drug Targets. (2020) 20:197–215. doi: 10.2174/1568009619666191209102015
41. Takada I and Makishima M. Peroxisome proliferator-activated receptor agonists and antagonists: a patent review (2014-present). Expert Opin Ther Pat. (2020) 30:1–13. doi: 10.1080/13543776.2020.1703952
42. Polvani S, Tarocchi M, Tempesti S, Bencini L, and Galli A. Peroxisome proliferator activated receptors at the crossroad of obesity, diabetes, and pancreatic cancer. World J Gastroenterol. (2016) 22:2441–59. doi: 10.3748/wjg.v22.i8.2441
Keywords: pancreatic cancer, KRAS mutations, PPAR signaling pathway, transcriptomic analysis, lipid metabolism, molecular profiling
Citation: Defazio G, Scolari F, Fancelli S, Polvani S, Lavacchi D, Picariello L, Tubita A, Luconi M, Antonuzzo L, Galli A and Pillozzi S (2025) Transcriptomic analysis on pancreatic adenocarcinoma patients uncovers KRAS-mediated PPAR pathway alteration. Front. Oncol. 15:1613773. doi: 10.3389/fonc.2025.1613773
Received: 17 April 2025; Accepted: 17 July 2025;
Published: 11 August 2025.
Edited by:
Zoran Todorovic, University of Belgrade, SerbiaReviewed by:
Shalini Datta, Indian Statistical Institute, IndiaRaymond Konger, Indiana University Bloomington, United States
Copyright © 2025 Defazio, Scolari, Fancelli, Polvani, Lavacchi, Picariello, Tubita, Luconi, Antonuzzo, Galli and Pillozzi. This is an open-access article distributed under the terms of the Creative Commons Attribution License (CC BY). The use, distribution or reproduction in other forums is permitted, provided the original author(s) and the copyright owner(s) are credited and that the original publication in this journal is cited, in accordance with accepted academic practice. No use, distribution or reproduction is permitted which does not comply with these terms.
*Correspondence: Serena Pillozzi, c2VyZW5hLnBpbGxvenppQHVuaWZpLml0
†Present address: Giuseppe Defazio, Department of Biosciences, Biotechnology and Environment, University of Bari Aldo Moro, Bari, Italy
‡These authors have contributed equally to this work and share first authorship
§These authors have contributed equally to this work and share last authorship