 Zhiruo Cai
 Xue Guan
 Yunyun Xiao
 Hengqing An
 Ning Tao
- 1College of Public Health, Xinjiang Medical University, Urumqi, China
- 2Department of Urology, The First Affiliated Hospital of Xinjiang Medical University, Urumqi, China
Background: Prostate cancer (PCa) is a common malignancy among men worldwide, and its risk is strongly associated with obesity, especially visceral obesity. Visceral obesity has been assessed by the visceral adiposity index (VAI), cardiometabolic index (CMI), and lipid accumulation product (LAP), but their associations with PCa remain underexplored. This study investigated the relationship between these visceral obesity indicators and PCa risk.
Methods: Data for this cross-sectional study were obtained from the First Affiliated Hospital of Xinjiang Medical University from 2022-2023, and 730 participants were screened for the study. A total of 102 PCa patients were included as the PCa group and 102 healthy individuals as the control group using propensity score matching (PSM). We collected anthropometric data (height, weight, waist circumference) and blood biochemical parameters from participants to calculate the VAI, CMI and LAP. These indicators’ association and predictive efficacy with PCa were assessed by logistic regression, restricted cubic spline (RCS), and receiver operating characteristic (ROC) curve analysis. The robustness of these results was further examined through sensitivity analyses.
Results: VAI, CMI, and LAP were higher in the PCa group than in the control group (P<0.05). Logistic regression models showed that VAI, CMI, and LAP were positively associated with PCa. This association of VAI and CMI shows robustness in sensitivity analysis. Compared with the first quartile (Q1), the fourth quartile’s (Q4) VAI, CMI and LAP were linked to an increased risk of PCa (OR: 9.07, 95% CI: 3.21-25.65; OR: 11.10, 95% CI: 3.87-31.83; OR: 3.01, 95% CI: 1.17-7.76, respectively). RCS analysis showed that VAI and CMI were nonlinearly associated with PCa risk, and LAP was linearly associated with PCa risk. The area under the ROC curve (AUC) of VAI, CMI, and LAP was 0.721 (95% CI: 0.651-0.791), 0.711 (95% CI: 0.639-0.782), and 0.593 (95% CI: 0.515-0.671), respectively.
Conclusions: Visceral obesity indicators are closely associated with PCa, of which VAI and CMI show good predictive value and robustness, and can be used as potential biomarkers for assessing PCa risk.
1 Introduction
In 2022, prostate cancer (PCa) ranks as the second most prevalent cancer globally (incidence 14.2%) and the fifth most common cause of cancer death (mortality 7.3%) among men (1). A new report in The Lancet estimates that annual new instances of PCa will increase from 1.4 million in 2020 to 2.9 million by 2040 (2). PCa is the most common cancer diagnosed in men over the age of 50 (3). In recent years, with the aging of the global population, the incidence of PCa has increased year by year (4). PCa has become a major public health problem for men worldwide and carries a huge economic burden (5).
Factors influencing PCa include age and genetics (6, 7), while modifiable exogenous factors such as diet, metabolic syndrome, and obesity are also involved in the development of PCa (8–10). Among these, the relationship between obesity and PCa is in the spotlight due to the rising number of obese persons worldwide (11). Obesity is closely related to tumor development, particularly visceral obesity, which is more likely to cause cancer than total body fat (12). There is ample evidence that visceral obesity is associated with poor prognosis and risk of recurrence in a variety of tumors (13–15). Visceral obesity is a state of excessive accumulation of visceral adipose tissue (VAT) in the abdominal cavity, which can reflect the distribution of fat (16). Excess visceral fat is associated with a higher risk of cardiometabolic disorders, including hypertension, cardiovascular disease, and dyslipidemia (17, 18). Evidence suggests that increased visceral obesity is connected with poor prognosis in PCa (19). In addition, periprostatic adipose tissue (PPAT), which is white visceral adipose tissue close to the prostate, is an important component of the PCa tumor microenvironment (20). Research has shown that PPAT is implicated in PCa development, progression, invasion, and metastasis through the release of numerous active molecules (20). Obesity-induced changes in PPAT gene expression promote PCa progression by stimulating cell proliferation and inhibiting immune surveillance (21).
Waist circumference (WC), body mass index (BMI), and waist-to-height ratio (WHtR) are widely employed as evaluation markers to define obesity, but these indicators don’t accurately reflect the body fat content, distribution, and function (22, 23). Currently, computed tomography (CT) or magnetic resonance imaging (MRI) can quantify visceral obesity (24, 25). However, imaging-based assessment of visceral obesity is unsuitable for mass screening, considering radiation exposure, operational complexity, and high economic expenditures. In recent years, researchers have proposed some novel indexes that can reflect visceral obesity and metabolic disorders: visceral adiposity index (VAI), cardiometabolic index (CMI), and lipid accumulation product (LAP) (26, 27). VAI is an essential indicator of visceral adipose tissue dysfunction and is associated with the risk of tumorigenesis (28). LAP reflects metabolic status and is an effective indicator for predicting cardiometabolic conditions (29). CMI, a novel indicator of visceral obesity, was initially used to predict diabetes (30). However, recent research has concluded that CMI is a more precise and refined indicator for identifying individuals at risk for cardiometabolic disease (31). These visceral obesity indicators combine anthropometric and lipid parameters, are easily available and more economical than traditional single obesity indicators, and help identify visceral fat dysfunction (32, 33).
Currently, research on visceral obesity indicators is mainly focused on the cardiovascular disease field, and its study in oncology is still in the emerging phase. Additionally, investigations of visceral obesity indicators in the context of PCa remain relatively limited. This study intends to explore the association between visceral obesity indicators and PCa, thereby filling the void in this field. Furthermore, it provides support for visceral obesity indicators as prospective biomarkers for PCa risk, providing greater knowledge of the risk factors for PCa.
2 Methods
2.1 Data source
Data for this study were retrieved from the database of the Urology and Physical Examination Center at the First Affiliated Hospital of Xinjiang Medical University, comprising all medical records of examinations performed at the Department of Urology and the Medical Examination Center between 2022 and 2023. All research participants willingly consented to participate and provided informed consent, and the study was authorized by the Medical Ethics Committee of the First Affiliated Hospital of Xinjiang Medical University (Approval number: XJYKDXR20240521004).
This study included 5100 participants in total. These included 420 PCa patients who were pathologically diagnosed with PCa by prostate needle biopsies. Another 4,680 healthy individuals had a physical examination during the same period. Based on the inclusion and exclusion criteria, the study ultimately included 330 PCa patients and 400 non-PCa individuals. See Figure 1.
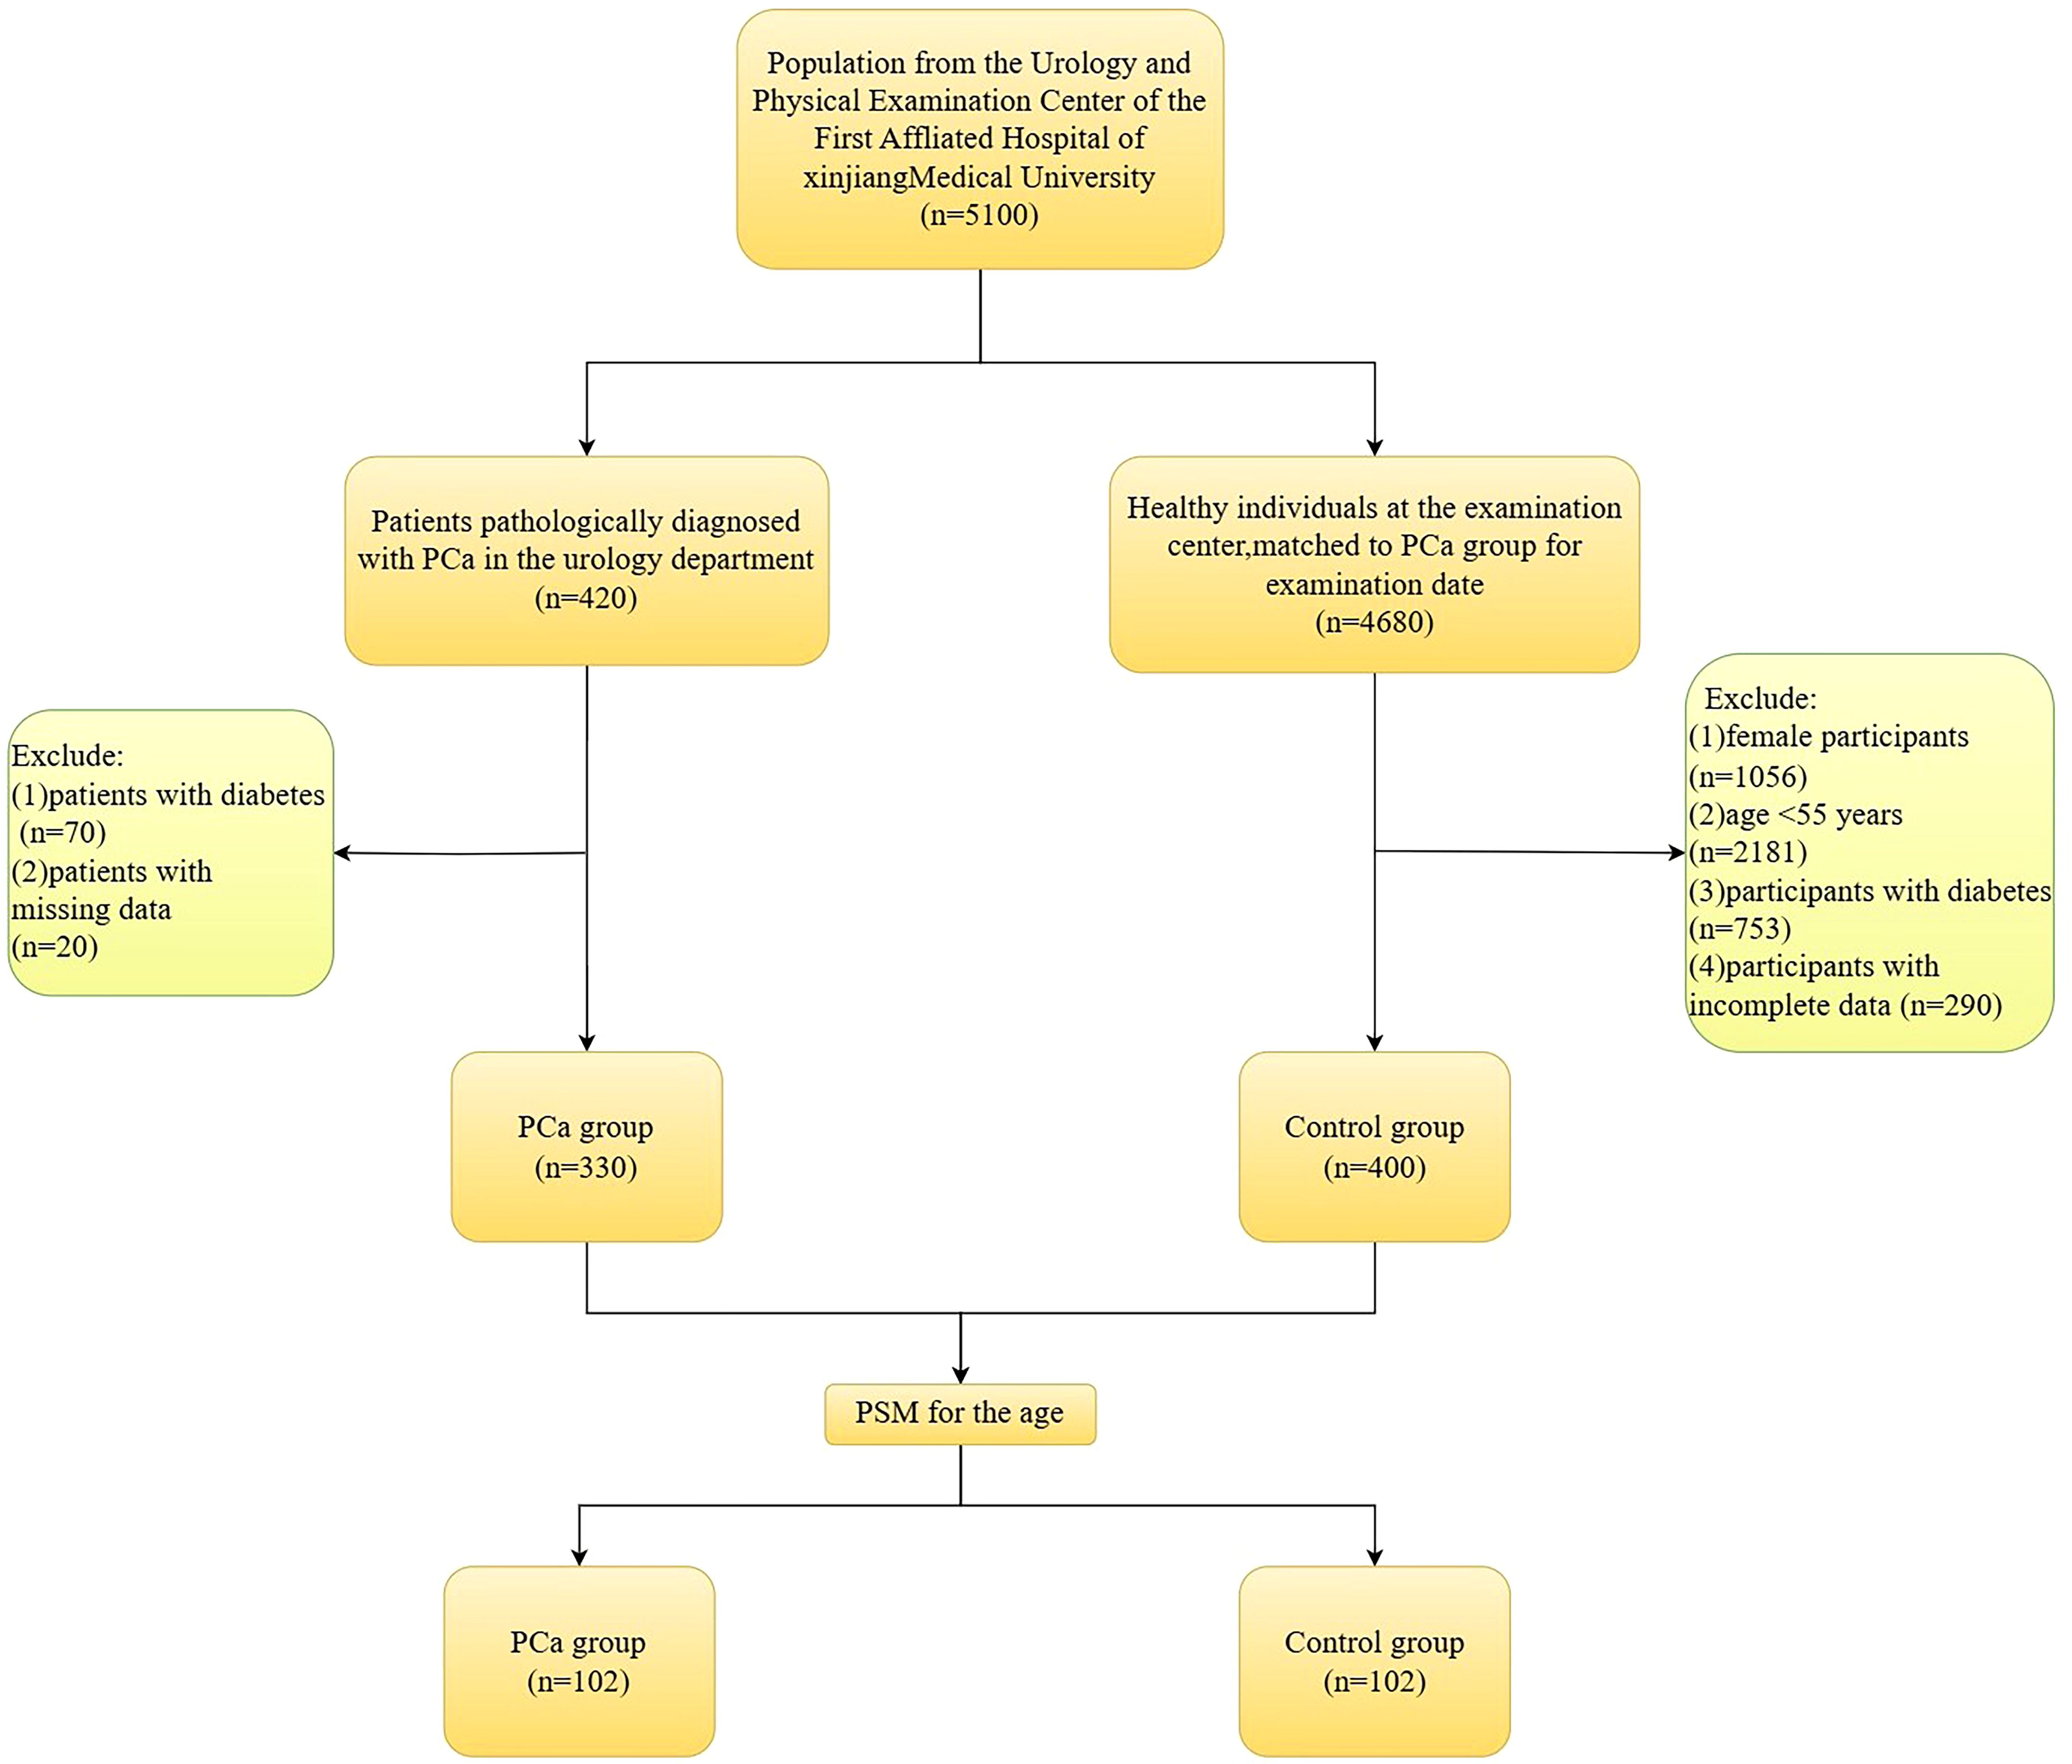
Figure 1. Flowchart of inclusion and exclusion of study participants.
Inclusion criteria for the PCa group: (1) meeting the indications for prostate needle biopsy; (2) patients who were diagnosed with PCa based on the pathological assessment of their initial prostate needle biopsy; (3) participants who had signed consent forms; (4) those with complete data linked to this study. Exclusion criteria for the PCa group: (1) patients with diabetes; (2) individuals with missing data.
Inclusion criteria for the control group: (1) participants matched to the PCa group for examination date; (2) complete physical examination data; (3) participants who had signed consent forms. Exclusion criteria for the control group: (1) female participants; (2) age ≤55 years; (3) participants with diabetes; (4) participants with incomplete data.
This research used propensity score matching (PSM) based on age to account for its possible influence on PCa risk, resulting in the inclusion of 102 PCa group and 102 control group for analysis.
2.2 Data collection and measurements
The participants’ medical histories and physical examinations were obtained during the medical examination to gather their anthropometric measurements (height, weight, WC), as well as blood biochemistry markers. All participants underwent physical examinations in the morning in a fasted state. Physicians with specialized training measured anthropometric parameters. Anthropometric parameters were measured after participants stood naturally and removed their shoes and thick clothing. Participants’ height and weight were obtained using an ultrasonic height and weight measuring device, with a height accuracy of 0.1 cm. WC was measured with a soft tape at the midpoint between the iliac crest and the lower rib margin.
Blood samples were collected from the antecubital vessels of participants the following morning after they had fasted for a minimum of 8 hours. The hospital’s clinical laboratory received the blood samples for the analysis of triglycerides (TG), total cholesterol (TC), high-density lipoprotein cholesterol (HDL-C), blood urea nitrogen (BUN), serum uric acid (SUA), and creatinine (Cr) using a Dimension AR/AVL analyzer (Dade Behring, USA).
2.3 Calculation of visceral adiposity indicators
(34)
(30)
(35)
2.4 Statistical analysis
Statistical analyses were performed using SPSS version 25.0 and R (version 4.4.1). Normally distributed measurement data were presented as mean ± standard deviation (SD) and compared by t-tests. Non-normally distributed measurement data were presented as median and interquartile range and examined with non-parametric tests. Categorical variables were presented as percentage frequencies (%). Differences between groups were assessed using the χ² test. PSM was used to balance the age difference between the two research groups using the closest neighbor matching technique (1:1) and the caliper value (0.02) with a two-sided test level of α < 0.05. The correlation between visceral obesity indicators and PCa was examined by logistic regression, both before and after PSM. Restricted cubic spline (RCS) models were used to analyze the dose-response relationship between visceral obesity indicators and PCa risk, and the difference was statistically significant at α < 0.05. Receiver operating characteristic (ROC) curve analysis was used to assess the predictive performance of visceral adiposity indicators for PCa risk. After removing outliers, sensitivity analyses were performed using logistic regression and Poisson regression to evaluate the stability of the results.
3 Results
3.1 Characteristics of Lipid and visceral obesity indicators in participants, and their association with PCa risk before PSM
Before PSM, a total of 730 people were enrolled in the study, 330 in the PCa group and 400 in the control group. There were statistically significant differences in Age, TG, HDL-C, TC, VAI, CMI, LAP, Cr, and SUA (P< 0.05) between the two groups. There was no statistically significant difference between the two groups in terms of BUN (P > 0.05). See Table 1. Compared with the lowest VAI, CMI, and LAP quartile, the OR (95% CI) for PCa prevalence in the highest quartiles was 11.47(95% CI 6.47-20.35), 8.74(5.03-15.17), 4.23 (2.52-7.12), respectively. See Table 2.
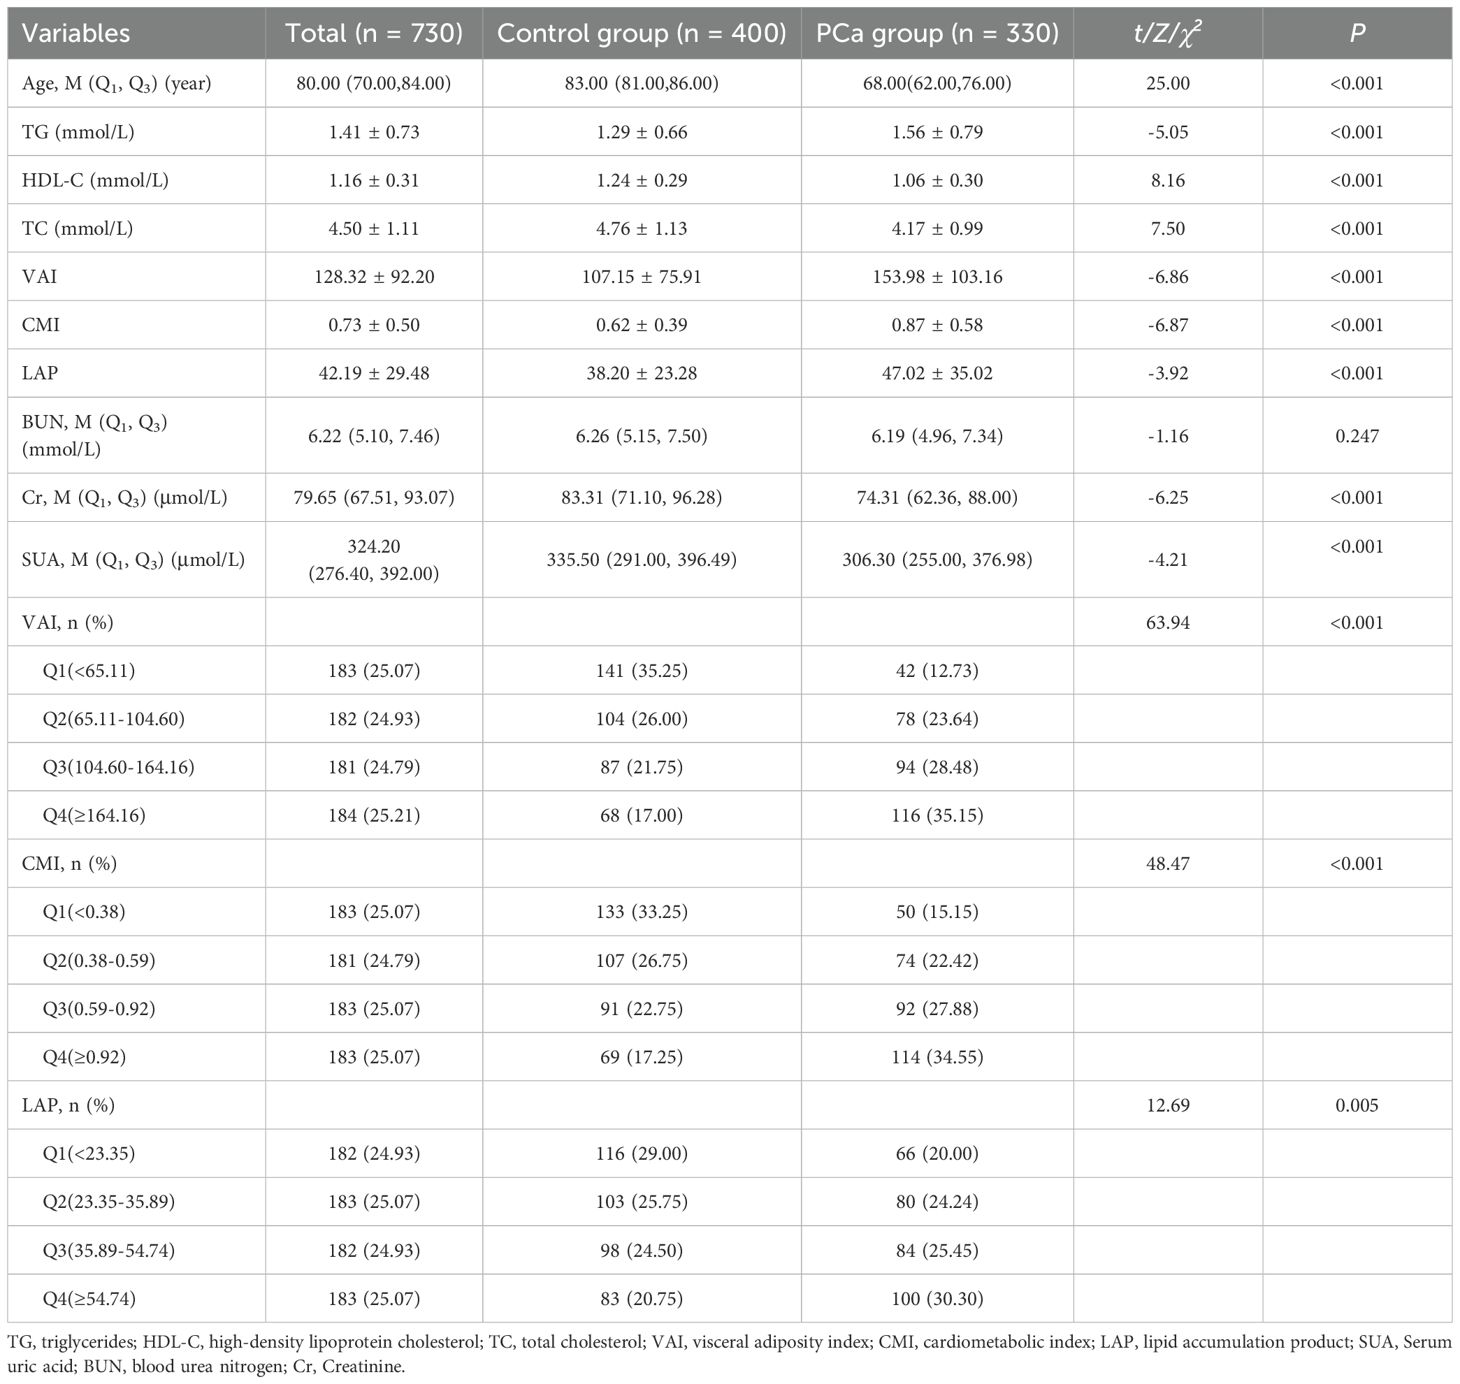
Table 1. Characterization of blood biochemical indices and visceral obesity indicators in PCa group and control group before PSM.
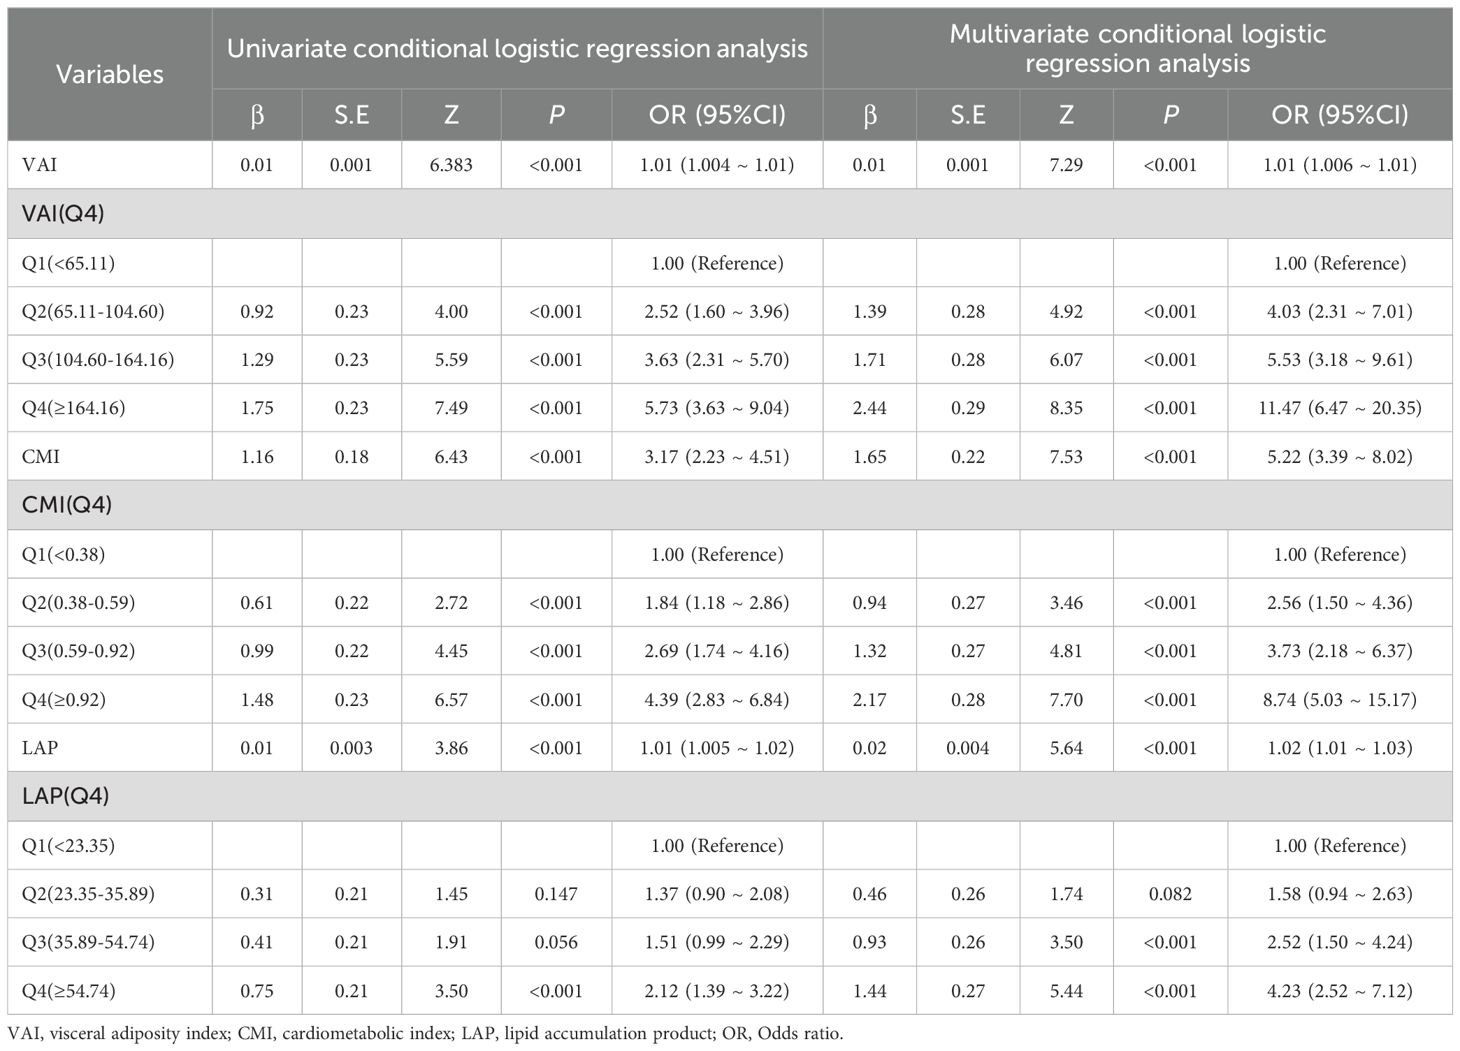
Table 2. The association between visceral obesity indicators and Pca risk: univariable and multivariable conditional logistic regression analyses before PSM.
3.2 Characteristics of lipid and visceral obesity indicators in participants, and their association with PCa risk after PSM
As preliminary analyses showed differences in age between the two groups, PSM (1:1 precise age matching) was performed in this study to ensure the two groups were comparable. In logistic regression analyses, VAI, CMI and LAP expressed as either continuous variables or quartiles. Multivariable logistic regression demonstrates that higher VAI, CMI, and LAP levels were independently associated with increased PCa odds. Compared with the lowest quartile (Q1) of VAI, the OR (95% CI) for the PCa risk in the second, third, and fourth quartiles of VAI was 3.44 (1.25-9.46), 8.76 (3.12-24.62) and 9.07 (3.21-25.65), respectively. Compared with the lowest quartile (Q1) of CMI, the OR (95% CI) for the PCa risk in the second, third, and fourth quartiles of CMI was 4.69 (1.67-13.20), 7.10 (2.58-19.54) and 11.10 (3.87-31.83), respectively. The OR (95% CI) values of LAP in the third and fourth quartile groups were 3.01 (1.16-7.83) and 3.01 (1.17-7.76), respectively, using the lowest quartile group as a reference. See Tables 3, 4.
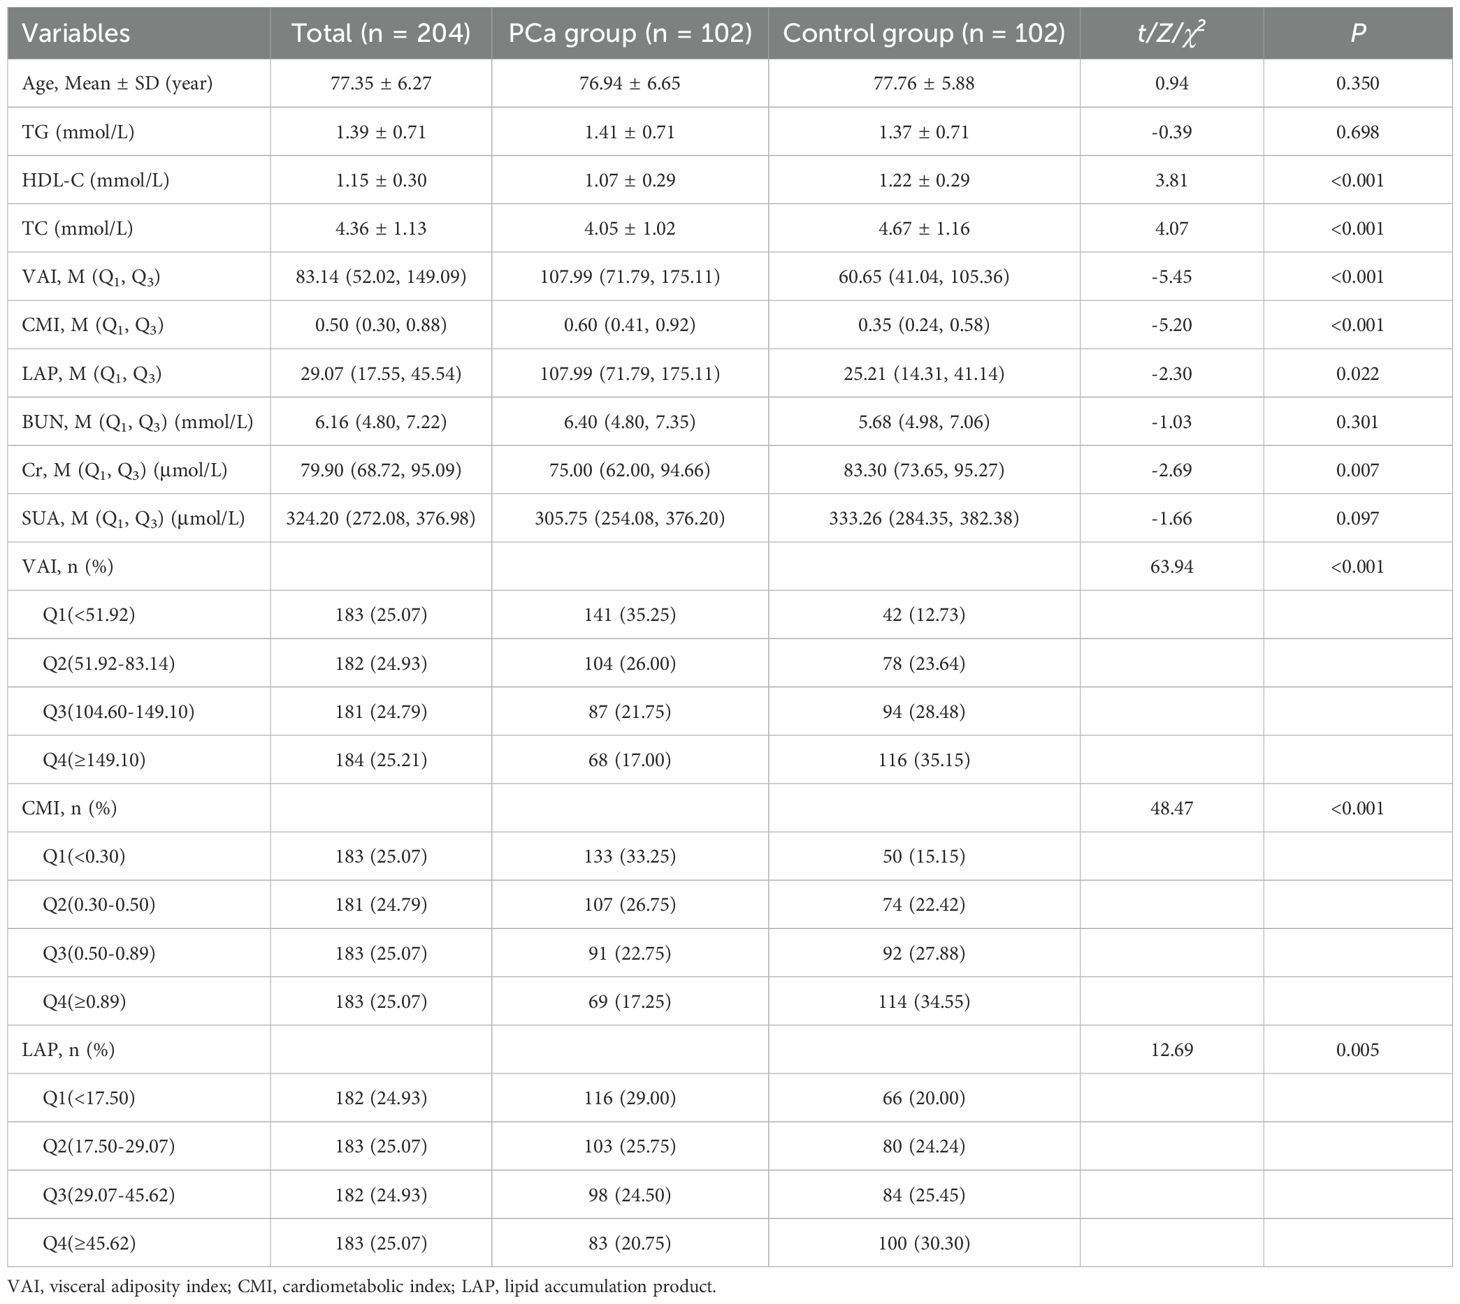
Table 3. Characterization of blood biochemical indices and visceral obesity indicators in PCa group and control group after PSM.
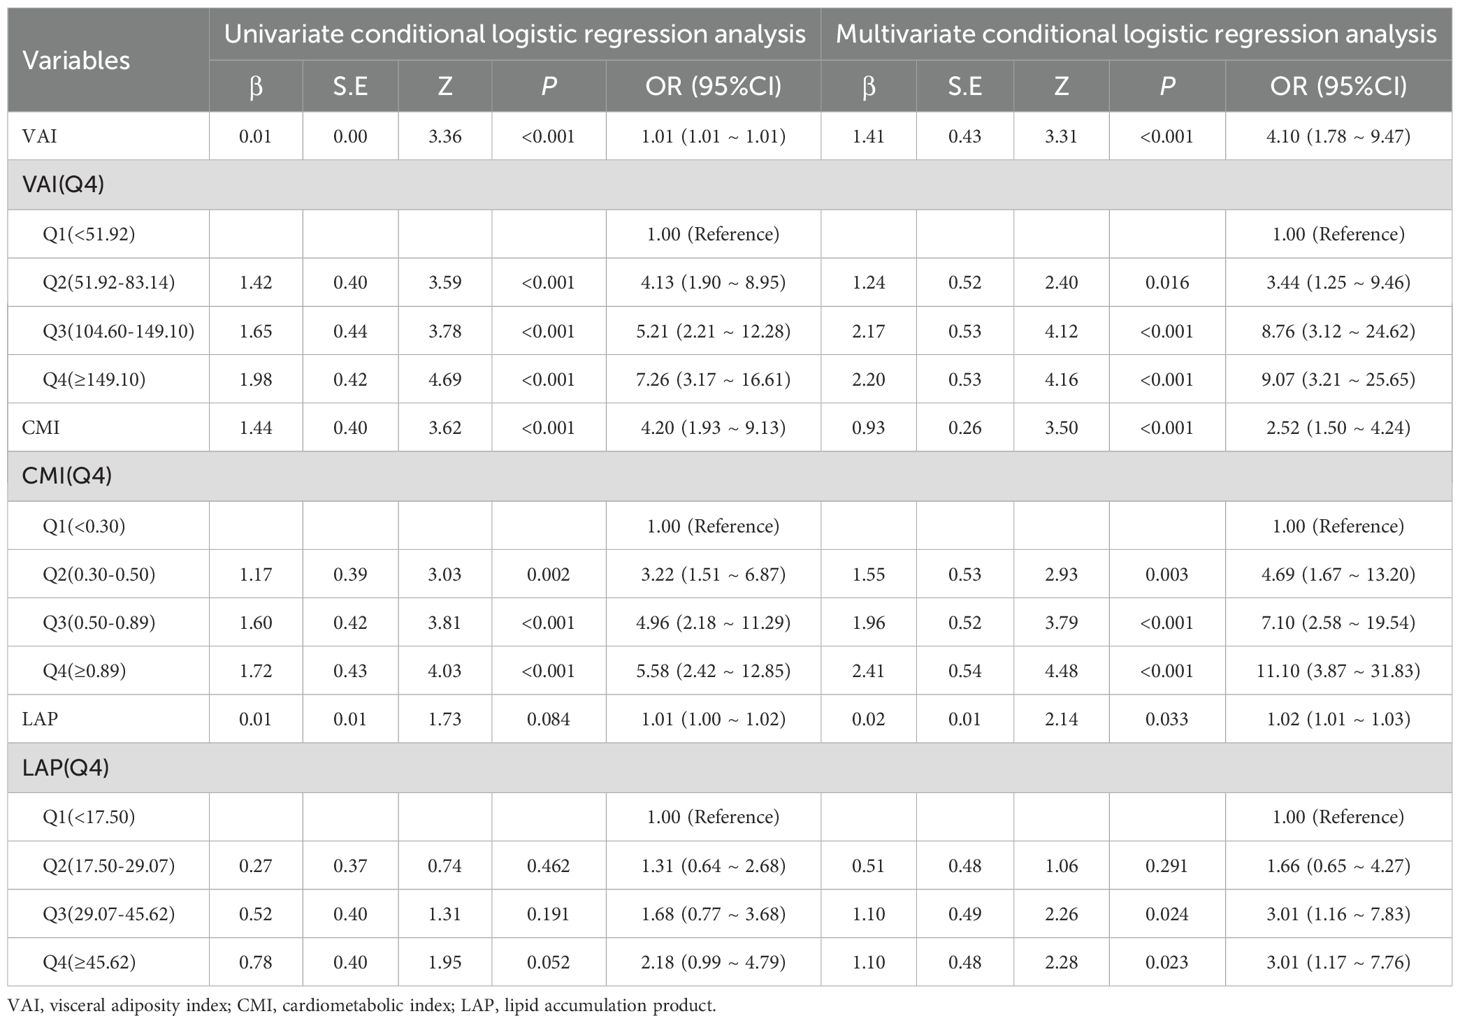
Table 4. The association between visceral obesity indicators and Pca risk: univariable and multivariable logistic regression analyses after PSM.
3.3 Dose-response relationship between visceral obesity indicators and PCa
Restricted cubic spline (RCS) models were used to analyze further the association between visceral obesity indices and PCa. The results showed that VAI and CMI exhibited a non-linear dose-response relationship with PCa risk (P for overall < 0.001, P for nonlinear < 0.05), while LAP exhibited a linear dose-response relationship with PCa risk (P for nonlinear > 0.05). See Figures 2A–C.
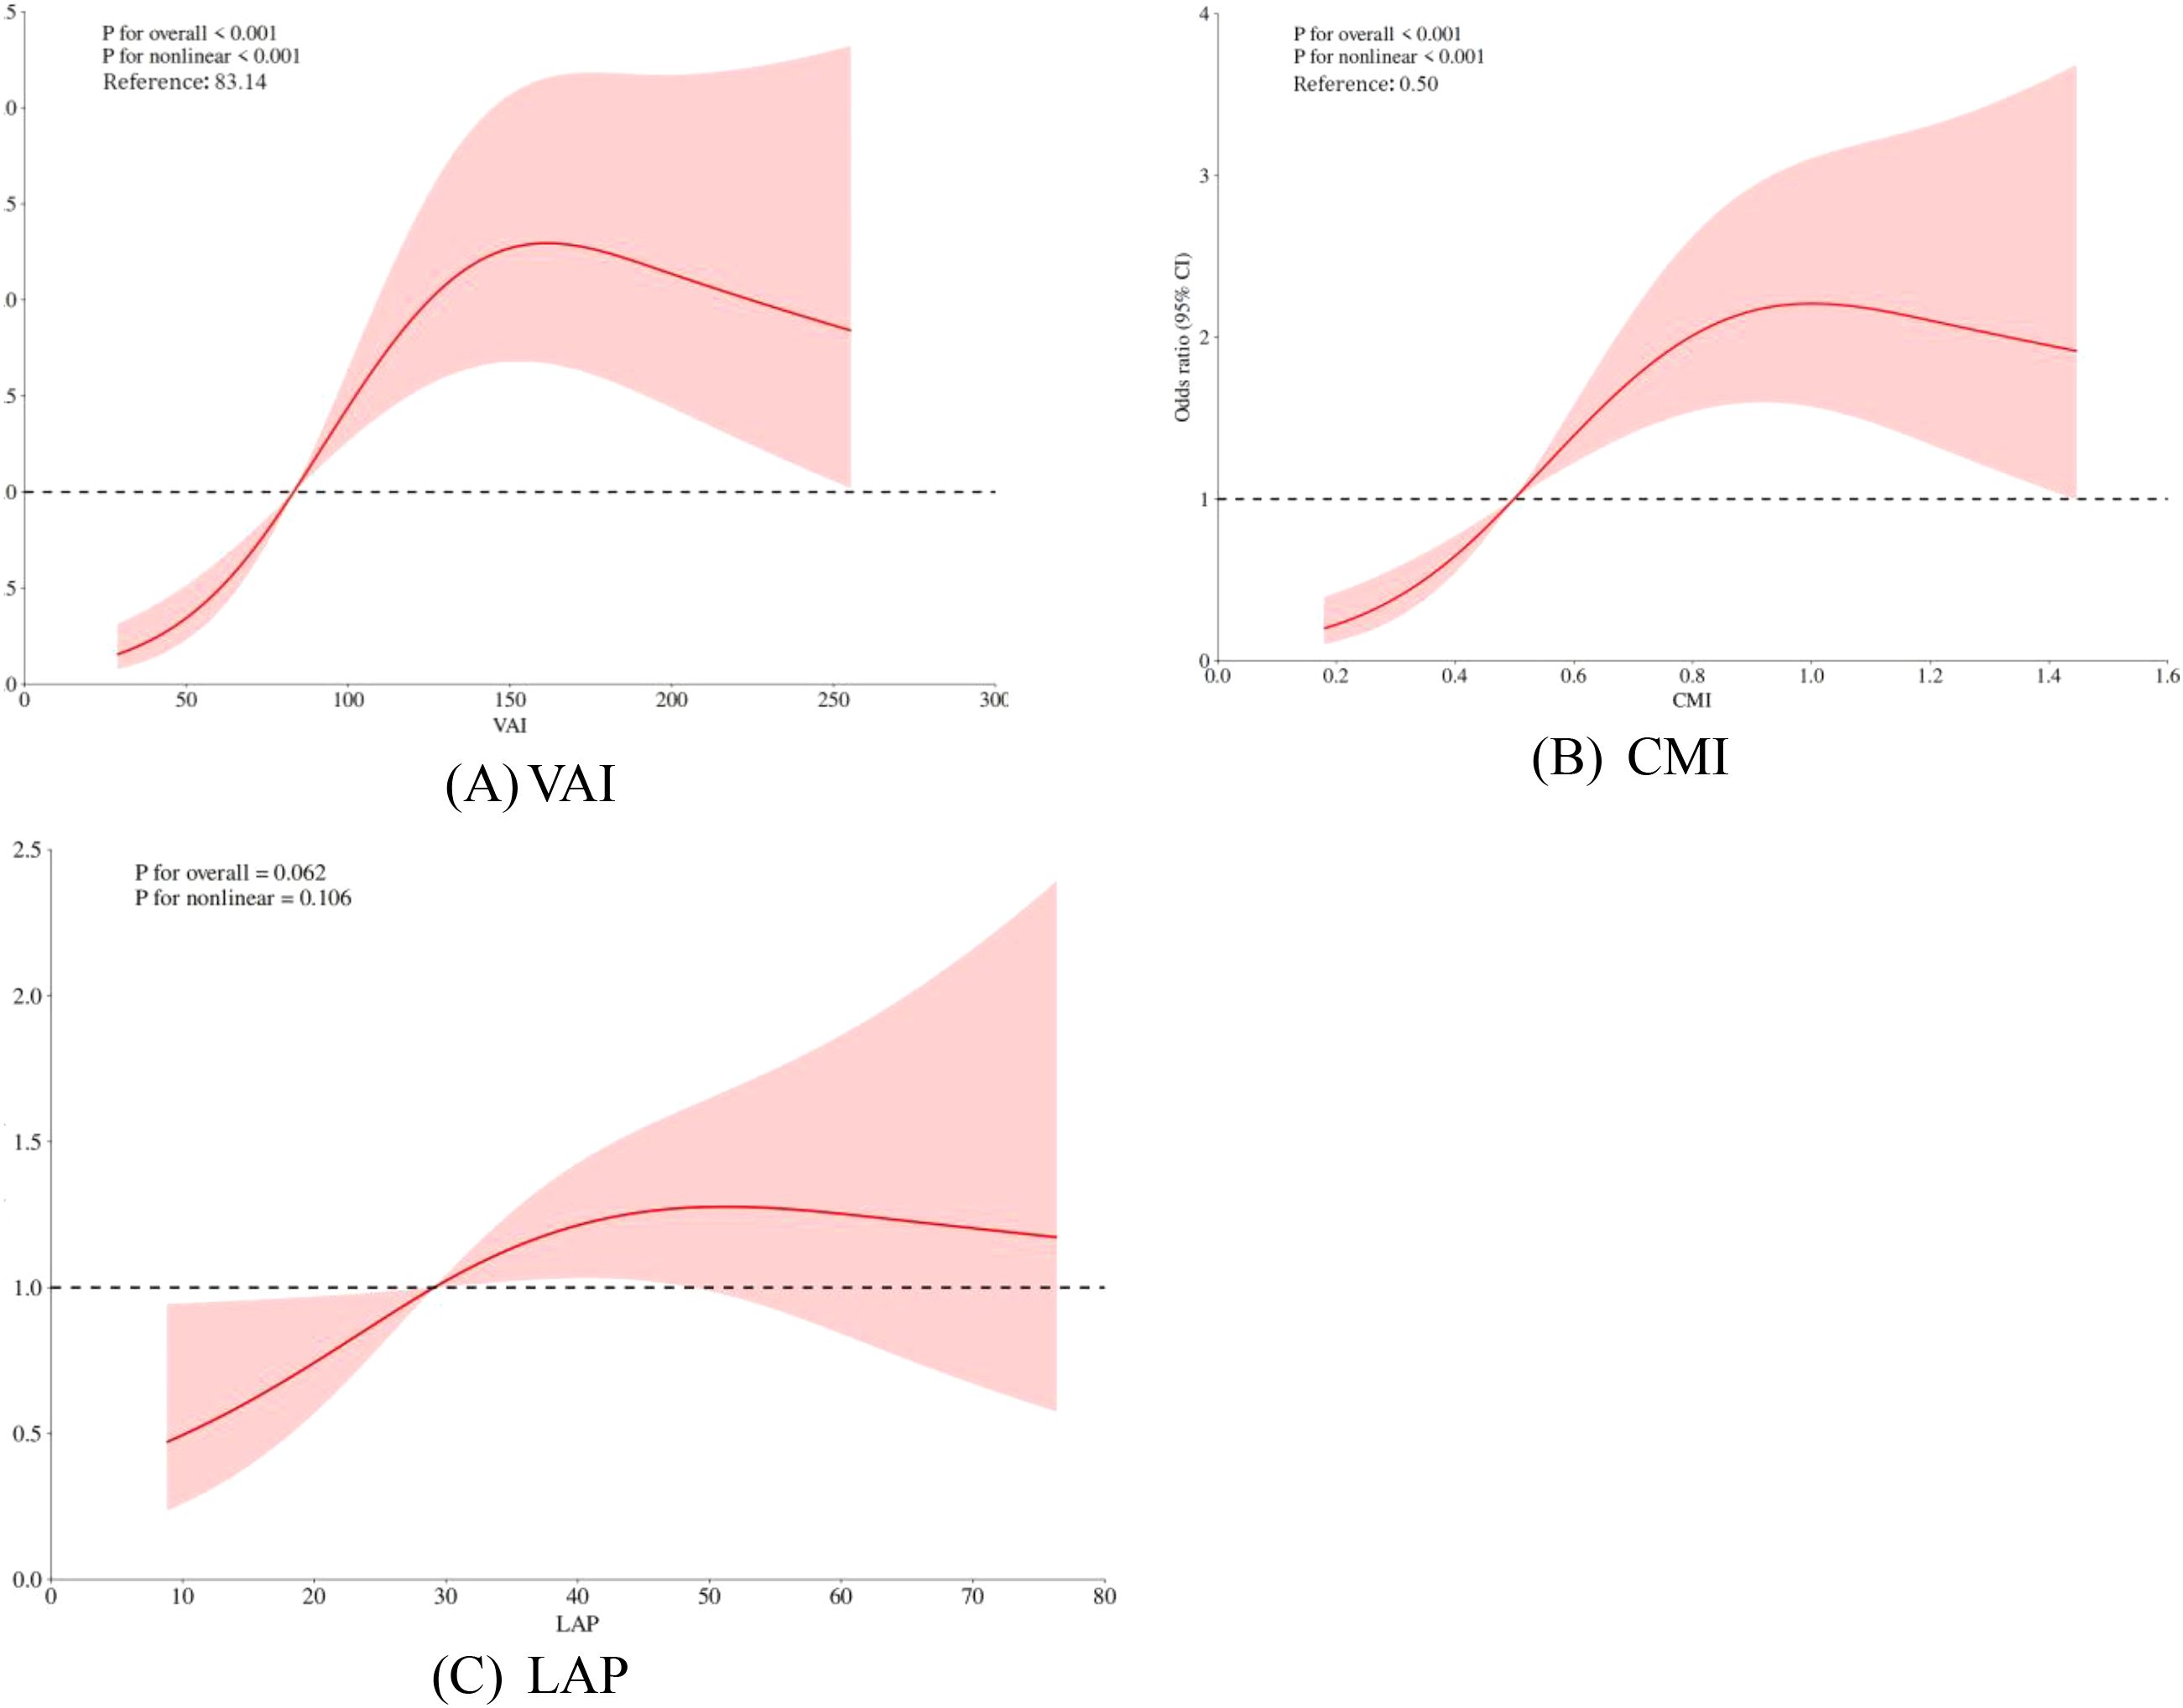
Figure 2. (A-C) Dose-response relationship between VAI, CMI, LAP and PCa prevalence.
The red solid line represents the odds ratio (OR), the red shaded area indicates the 95% confidence intervals (95% CI), and the horizontal dashed line marks the null line (OR = 1).
3.4 The predictive value of visceral obesity indicators in PCa risk assessment
ROC analysis demonstrated distinct predictive capacities among the visceral obesity indicators. The area under curve (AUC) of VAI, CMI, and LAP were 0.721 (95% CI: 0.651-0.791), 0.711 (95% CI: 0.639-0.782), and 0.593 (95% CI: 0.515-0.671), respectively. VAI had a relatively high predictive ability for PCa risk. See Figure 3.
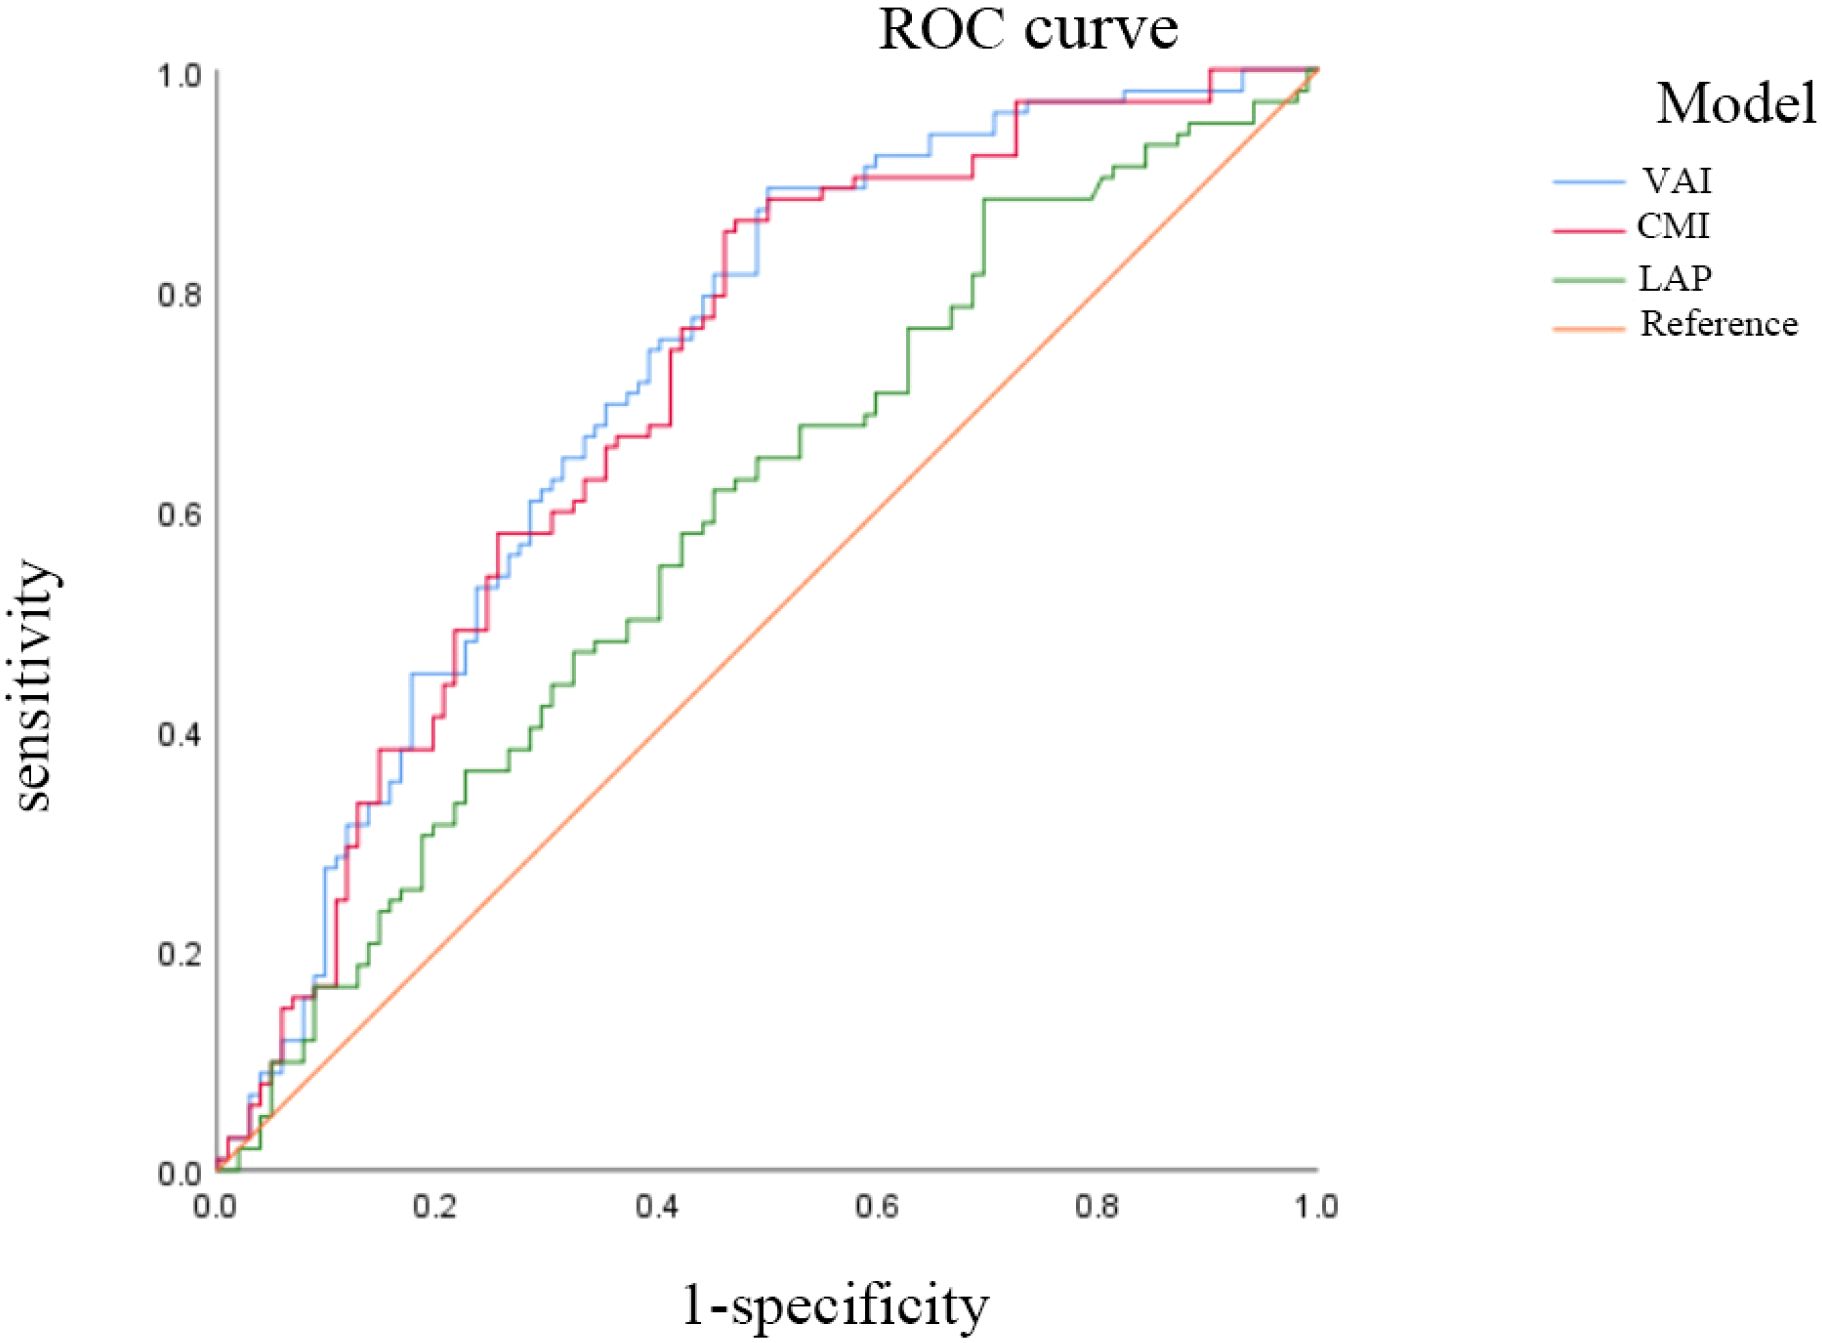
Figure 3. The ROC analysis of VAI, CMI and LAP on PCa. AUC: the area under the curve. ratio. VAI, visceral adiposity index; CMI, cardiometabolic index; LAP, lipid accumulation product.
3.5 Sensitivity analysis of visceral obesity indicators and PCa risk
The results revealed that the association between VAI, CMI, and PCa remained stable in both logistic regression and Poisson regression models. Treating VAI and CMI as categorical variables still yielded the conclusion that there is a positive correlation between VAI, CMI and the odds of PCa prevalence. Participants with higher VAI, CMI had higher odds of PCa, further increasing the reliability of our study conclusions. See Tables 5 and 6.
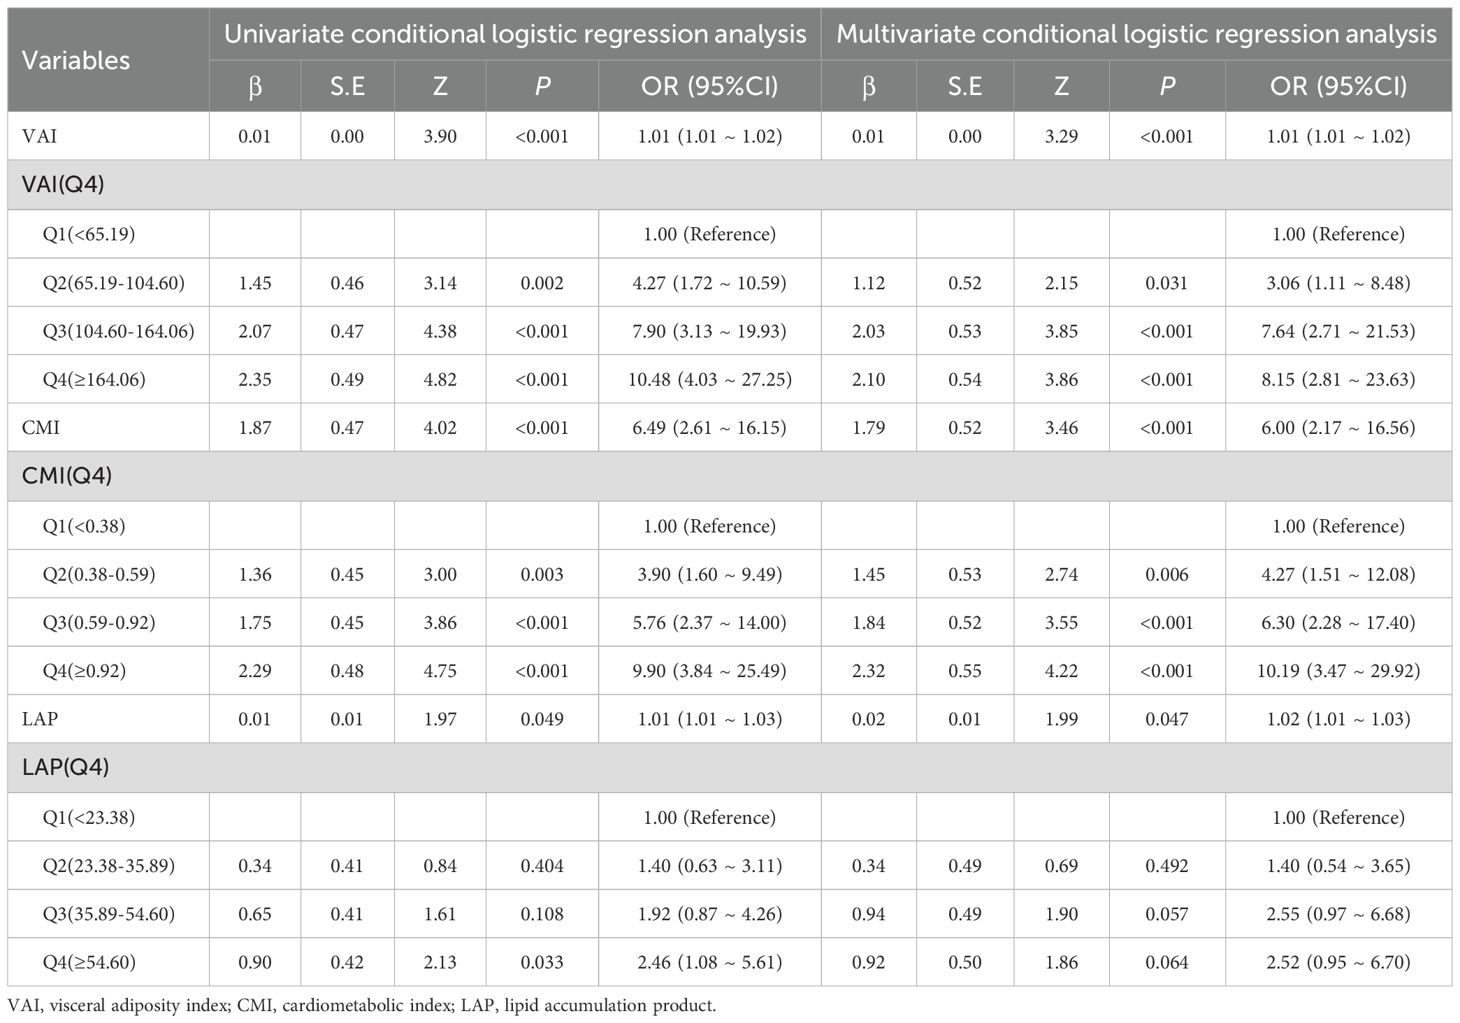
Table 5. Sensitive analysis on the association between visceral obesity indicators and PCa using logistic regression.
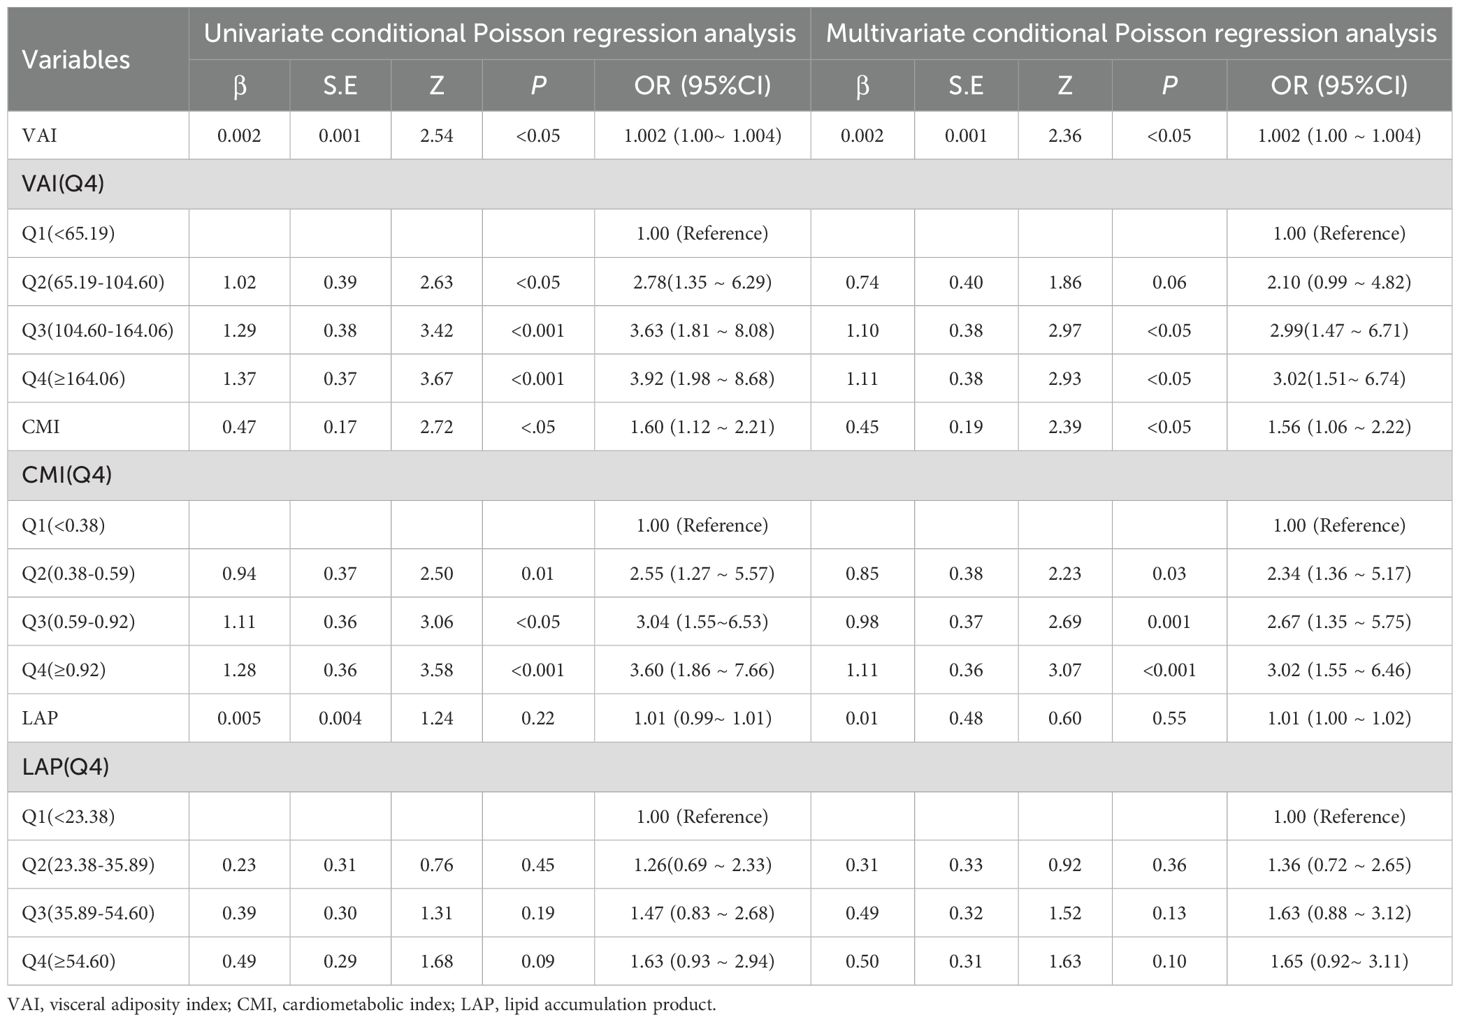
Table 6. Sensitive analysis on the association between visceral obesity indicators and PCa using oisson regression. .
4 Discussion
The majority of earlier research has focused on the relationship between overall obesity and PCa (36, 37). Recent studies using imaging techniques to quantify visceral obesity have shown a significant correlation with an increased risk of PCa (14, 38). Visceral obesity, accompanied by dyslipidemia, insulin resistance, increased oxidative stress, and chronic inflammation, is the main mechanism of tumor development. In our study, we used a relatively rapid and cost-effective indicator of visceral obesity to explore the association between visceral obesity and PCa risk, thereby providing new insights into the intrinsic link between PCa and visceral obesity. Existing research indicates that VAI exhibits a positive association with insulin, glucose, and tumor necrosis factor-alpha (TNF-α) and demonstrates a negative association with the adiponectin: leptin ratio (39). This suggests that visceral obesity is tightly connected to metabolic dysregulation and inflammatory responses, which may collectively promote the development and progression of PCa.
Visceral obesity is commonly accompanied by dyslipidemia, typically presenting as increased triglycerides (TG) and low-density lipoprotein cholesterol (LDL-C), along with decreased high-density lipoprotein cholesterol (HDL-C) (40). Prior research has established a link between visceral obesity indicators and a range of metabolic disorders, including atherosclerosis, metabolic syndrome, hyperuricemia, and hypertension (41–43). Studies of lipid-related risk factors for PCa have shown that elevated TG levels are associated with increased risk and severity of PCa (44). Furthermore, TG and HDL-C levels are also recognized as significant factors linked to higher PCa prevalence (6). Consistent with the previous findings, our study reveals that the PCa group had higher blood lipid levels than the control group. Meanwhile, its visceral obesity indicators are also higher than those of the control group. This is because the calculation of visceral obesity indicators incorporates TG and HDL-C, allowing these indicators to comprehensively reflect visceral fat accumulation and related lipid metabolic abnormalities, highlighting their potential value in PCa risk assessment. Low HDL-C levels are the most common type of dyslipidemia in the middle-aged and elderly population in China (45), and the calculation of LAP, which involves only WC and TG, may not adequately capture the risk posed by reduced HDL-C. Besides, studies have revealed that lower levels of HDL-C may be connected with an increased risk of PCa (46). The anti-inflammatory and antioxidant capabilities of HDL-C may limit the development and progression activities of PCa cells (46). In contrast, other visceral obesity indicators, such as VAI and CMI, may contain more information about fat distribution and lipid metabolism and thus show greater robustness in sensitivity analyses. Therefore, although LAP showed some potential value in this study, its ability to predict PCa risk was inadequate.
In our study, we recognized a positive correlation between visceral obesity indicators and PCa. Moreover, VAI and CMI, which are indicators of visceral obesity, were nonlinearly associated with PCa risk. The storage capacity of visceral fat is maintained in a controllable range when the levels of VAI and CMI are low (VAI<83.14, CMI<0.50). Compensatory mechanisms, such as adipocyte remodeling and inflammation regulation, can effectively maintain the body’s balance (47), resulting in a gradual increase in PCa risk. Nevertheless, the aforementioned compensatory mechanisms are rendered ineffective when VAI and CMI surpass the threshold (VAI>83.14, CMI>0.50), resulting in the overexpression of inflammatory cytokines and adipocyte dysfunction, which contribute to an accelerated increase in PCa risk. The reason for these results may be that, in the obese condition, visceral adipose tissue can influence the development of PCa by releasing more adipokines (48). Visceral obesity leads to dysfunction of visceral adipose tissue, causing elevated triglyceride levels, which may be a potential mechanism by which adipose tissue contributes to PCa progression (49). Excess triglycerides mean increased free fatty acids in the blood, consequently resulting in elevated reactive oxygen radicals and oxidative stress (50, 51). Oxidative stress can directly damage cellular DNA, increasing the risk of cellular carcinogenesis (52). Reactive oxygen radicals can also activate mitogen-activated protein kinase (MAPK) and nuclear factor kappa-B (NF-κB) pathways to promote tumor growth and metastasis (53). In addition, insulin resistance develops as a result of increased free fatty acids interfering with normal insulin signal transduction (54). Insulin resistance leads to elevated insulin levels in the blood. This activates the insulin/insulin-like growth factor-1 (IGF-1) axis and subsequently promotes PCa cell proliferation and survival through signaling pathways such as phosphatidylinositol 3-kinase (PI3K)/protein kinase B (Akt) and MAPK (55, 56). Therefore, early intervention at important inflection points of VAI and CMI to minimize PCa risk is required.
Notably, CMI, a novel measure of visceral obesity, was much more strongly associated with PCa risk than VAI and LAP. After propensity scoring, there was a 3.20-fold increase in PCa risk for each unit increase in CMI. CMI calculation integrates waist circumference, height, and metabolic indicators (HDL-C and TG), thus providing a comprehensive assessment of visceral adiposity and metabolic health (34, 57). In contrast, the calculation of LAP only considers waist circumference and TG; its ability to comprehensively assess may be limited. Studies demonstrate that CMI can reflect systemic inflammatory states (58). Chronic low-grade inflammation due to obesity is associated with PCa, and visceral adipose tissue is a major source of chronic inflammation in the obese state (59). As weight increases, when lipid accumulation exceeds the storage capacity of subcutaneous fat, lipids accumulate in visceral adipose, causing adipocyte hypertrophy, hypoxia, and eventual cell death (60, 61). In the process, adipocytes release chemokines and recruit immune cells, driving the production of pro-inflammatory cytokines that promote chronic inflammation (20, 62). Mounting evidence suggests that multiple chemokines play a crucial role in obesity-driven PCa progression. Under obese conditions, increased CXC chemokine ligand 1 (CXCL1) expression is associated with PCa aggressiveness (63); elevated CXC chemokine ligand 8 (CXCL8) and CXC chemokine ligand 12 (CXCL12) expression are positively correlated with PCa metastasis (64–66). Additionally, mature adipocytes can secrete CC-chemokine ligand 7 (CCL7), which directly promotes cancer cell migration by interacting with the CC-chemokine receptor 3 (CCR3) on PCa cells (67). In white adipose tissue, which contains the highest proportion of adipose tissue, macrophages are the predominant immune cells, and their numbers increase with the progression of obesity (68). In murine models of obesity, the number of macrophages in white adipose tissue increases, accompanied by a corresponding elevation in the secretion of pro-inflammatory cytokines (66).
In summary, visceral obesity, as a modifiable risk factor, plays a significant role in reducing the risk of PCa through early identification and effective management. This study provides new evidence for the association between visceral obesity and PCa using a relatively rapid and cost-effective indicator of visceral obesity. These findings lay a certain foundation for early screening and risk assessment of PCa and provide new clues for further investigation into the etiology of the disease.
5 Limitations
Firstly, this is a cross-sectional study, and the causal relationship between VAI, CMI, LAP, and PCa could not be analyzed. Therefore, further prospective studies are needed to determine the exact relationship between the visceral obesity indicators and the PCa Risk. Secondly, given the data are sourced from a single institution and the relatively small sample size, which limits the extrapolation of results to a larger population. Multicenter studies are still needed in the future to include more participants and validate the generalizability of the research findings. Thirdly, other factors that may affect the study results, such as lifestyle factors, were not considered in this study. Future studies should strive to account for these factors to reduce potential bias and more accurately assess the independent relationship between visceral obesity and PCa risk.
6 Conclusions
This study demonstrates that VAI, CMI, and LAP are significantly associated with the risk of developing PCa. Elevated levels of VAI and CMI correspond to an increased risk of PCa, with this association demonstrating notable robustness in sensitivity analyses. RCS analysis revealed a non-linear relationship between VAI and CMI with PCa risk, while LAP exhibited a linear relationship. These results further reveal the significant role of visceral obesity indicators in the pathogenesis of PCa.
Data availability statement
The data analyzed in this study is subject to the following licenses/restrictions: The data that support the findings of this study are available from the corresponding author upon reasonable request. Requests to access these datasets should be directed to NT Mzg1MTg0MTJAcXEuY29t.
Ethics statement
The studies involving humans were approved by The Ethics Committee of First Affiliated Hospital of Xinjiang Medical University. The studies were conducted in accordance with the local legislation and institutional requirements. The participants provided their written informed consent to participate in this study.
Author contributions
ZC: Methodology, Visualization, Conceptualization, Investigation, Validation, Formal Analysis, Writing – original draft. XG: Writing – original draft, Software, Formal Analysis, Data curation, Investigation. YX: Formal Analysis, Validation, Data curation, Software, Writing – original draft. HA: Writing – review & editing, Supervision, Software, Methodology, Resources, Data curation, Funding acquisition. NT: Funding acquisition, Validation, Supervision, Project administration, Conceptualization, Writing – review & editing, Methodology.
Funding
The author(s) declare that financial support was received for the research and/or publication of this article. This work is supported by the Autonomous Region Regional Collaborative Innovation Special Science and Technology Aid Program Projects in Xinjiang (Grant No. 2024E02054), Autonomous Region Regional Collaborative Innovation Special Science and Technology Aid Program Projects in Xinjiang the Excellence Youth Science Foundation of Xinjiang Uygur Autonomous Region (Grant No.2023D01E05), National Natural Science Foundation of China (Grant No. 82360476), Key Projects of Xinjiang Uyghur Autonomous Region (Grant No. 2022D01D39), Xinjiang Uygur Autonomous Region “Tianshan Talents” youth science and technology top talent project (Grant No. 2022TSYCCX0026), Innovation and Entrepreneurship Training Program for College Students (Grant No. S202310760037).
Acknowledgments
The authors express their sincere gratitude to all who provided support, assistance, and encouragement. Special thanks are extended to the nurses at the medical examination center for their invaluable assistance during the data collection process.
Conflict of interest
The authors declare that the research was conducted in the absence of any commercial or financial relationships that could be construed as a potential conflict of interest.
Generative AI statement
The author(s) declare that no Generative AI was used in the creation of this manuscript.
Publisher’s note
All claims expressed in this article are solely those of the authors and do not necessarily represent those of their affiliated organizations, or those of the publisher, the editors and the reviewers. Any product that may be evaluated in this article, or claim that may be made by its manufacturer, is not guaranteed or endorsed by the publisher.
Abbreviations
PCa, Prostate cancer; VAT, Visceral adipose tissue; PPAT, Periprostatic adipose tissue; VAI, Visceral adiposity index; CMI, Cardiometabolic index; LAP, Lipid accumulation product; WC, Waist circumference; TG, Triglycerides; HDL-C, High-density lipoprotein cholesterol; TC, Total cholesterol; BUN, Blood urea nitrogen; SUA, Serum uric acid; Cr, Creatinine; PSM, Propensity score matching.
References
1. Bray F, Laversanne M, Sung H, Ferlay J, Siegel RL, Soerjomataram I, et al. Global cancer statistics 2022: globocan estimates of incidence and mortality worldwide for 36 cancers in 185 countries. CA Cancer J Clin. (2024) 74:229–63. doi: 10.3322/caac.21834
2. James ND, Tannock I, N'Dow J, Feng F, Gillessen S, Ali SA, et al. The lancet commission on prostate cancer: planning for the surge in cases. Lancet. (2024) 403:1683–722. doi: 10.1016/S0140-6736(24)00651-2
3. Gonçalves MFM, Teresa P, Rita FÂ, Miranda IM, Martins SC, Gonçalves RA, et al. Microbiota of urine, glans and prostate biopsies in patients with prostate cancer reveals a dysbiosis in the genitourinary system. Cancers. (2023) 15(5):1423. doi: 10.3390/cancers15051423
4. Schafer EJ, Laversanne M, Sung H, Soerjomataram I, Briganti A, Dahut W, et al. Recent patterns and trends in global prostate cancer incidence and mortality: an update. Eur Urol. (2024) 87(3):302–13. doi: 10.1016/j.eururo.2024.11.013
5. Ellinger J, Alajati A, Kubatka P, Giordano FA, Ritter M, Costigliola V, et al. Prostate cancer treatment costs increase more rapidly than for any other cancer-how to reverse the trend? EPMA J. (2022) 13:1–7. doi: 10.1007/s13167-022-00276-3
6. Lee G, Han K, and Lee SS. Different effect of obesity and metabolic syndrome on prostate cancer by age group. Am J Cancer. (2022) 12(7):3198–207.
7. Belkahla S, Nahvi I, Biswas S, Nahvi I, and Ben Amor N. Advances and development of prostate cancer, treatment, and strategies: A systemic review. Front Cell Dev Biol. (2022) 10:991330. doi: 10.3389/fcell.2022.991330
8. Di Sebastiano KM, Pinthus JH, Duivenvoorden WCM, and Mourtzakis M. Glucose impairments and insulin resistance in prostate cancer: the role of obesity, nutrition and exercise. Obes Rev. (2018) 19:1008–16. doi: 10.1111/obr.12674
9. An H, Ma D, Mei Y, Wang L, Maimaitiyiming A, Zhuo T, et al. Metabolic syndrome and metastatic prostate cancer correlation study, a real-world study in a prostate cancer clinical research center, xinjiang, China. Front Endocrinol (Lausanne). (2022) 13:1090763. doi: 10.3389/fendo.2022.1090763
10. Li D, Zhou X, Xu W, Cai Y, Mu C, Zhao X, et al. High-fat diet promotes prostate cancer metastasis via rps27. Cancer Metab. (2024) 12:6. doi: 10.1186/s40170-024-00333-7
11. Yong W, Yu-Peng W, Min-Yi L, Shao-Hao C, Yun-Zhi L, Xiao-Dong L, et al. Impact of obesity on long-term urinary incontinence after radical prostatectomy: A meta-analysis. BioMed Res Int. (2018) 2018:8279523. doi: 10.1155/2018/8279523
12. Yao L, Haibo T, Peiyuan H, Jie W, Peizhi D, Yalan L, et al. Assessment of causal effects of visceral adipose tissue on risk of cancers: A mendelian randomization study. Int J Epidemiol. (2022) 51(4):1204–18. doi: 10.1093/ije/dyac025
13. Lee JW, Yoo ID, Hong SP, Kang B, Kim JS, Kim YK, et al. Prognostic impact of visceral adipose tissue imaging parameters in patients with cholangiocarcinoma after surgical resection. Int J Mol Sci. (2024) 25(7). doi: 10.3390/ijms25073939
14. Greco F, Piccolo CL, D'Andrea V, Scardapane A, Beomonte Zobel B, and Mallio CA. Fat matters: exploring cancer risk through the lens of computed tomography and visceral adiposity. J Clin Med. (2024) 13(2). doi: 10.3390/jcm13020453
15. Okumura S, Kaido T, Hamaguchi Y, Kobayashi A, Shirai H, Yao S, et al. Visceral adiposity and sarcopenic visceral obesity are associated with poor prognosis after resection of pancreatic cancer. Ann Surg Oncol. (2017) 24:3732–40. doi: 10.1245/s10434-017-6077-y
16. Tchernof A and Despres JP. Pathophysiology of human visceral obesity: an update. Physiol Rev. (2013) 93:359–404. doi: 10.1152/physrev.00033.2011
17. Nitsche L, Vedire Y, Kannisto E, Wang X, Seager RJ, Pabla S, et al. Visceral obesity in non-small cell lung cancer. Cancers (Basel). (2022) 14(14). doi: 10.3390/cancers14143450
18. Wang L, O'Brien MT, Zhang X, Chen Y, English WJ, Williams B, et al. Cardiometabolic improvements after metabolic surgery and related presurgery factors. J Endocr Soc. (2024) 8:bvae027. doi: 10.1210/jendso/bvae027
19. AlZaim I, Al-Saidi A, Hammoud SH, Darwiche N, Al-Dhaheri Y, Eid AH, et al. Thromboinflammatory processes at the nexus of metabolic dysfunction and prostate cancer: the emerging role of periprostatic adipose tissue. Cancers (Basel). (2022) 14(7). doi: 10.3390/cancers14071679
20. Cao H, Wang Y, Zhang D, Liu B, Zhou H, and Wang S. Periprostatic adipose tissue: A new perspective for diagnosing and treating prostate cancer. J Cancer. (2024) 15:204–17. doi: 10.7150/jca.89750
21. Mathiesen A, Haynes B, Huyck R, Brown M, and Dobrian A. Adipose tissue-derived extracellular vesicles contribute to phenotypic plasticity of prostate cancer cells. Int J Mol Sci. (2023) 24(2):20230108. doi: 10.3390/ijms24021229
22. Zhang ZQ, Deng J, He LP, Ling WH, Su YX, and Chen YM. Comparison of various anthropometric and body fat indices in identifying cardiometabolic disturbances in chinese men and women. PloS One. (2013) 8:e70893. doi: 10.1371/journal.pone.0070893
23. Pekgor S, Duran C, Berberoglu U, and Eryilmaz MA. The role of visceral adiposity index levels in predicting the presence of metabolic syndrome and insulin resistance in overweight and obese patients. Metab Syndr Relat Disord. (2019) 17:296–302. doi: 10.1089/met.2019.0005
24. Li C, Zeng L, Li M, Deng K, Zhou D, Liang R, et al. New sagittal abdominal diameter and transverse abdominal diameter based equations to estimate visceral fat area in type 2 diabetes patients. BMC Public Health. (2024) 24:1364. doi: 10.1186/s12889-024-18659-8
25. Suárez-García JG, Alonso BDC, Hernández-López JM, Hidalgo-Tobón SS, Dies-Suárez P, and So P-W. Automated mri quantification of pediatric abdominal adipose tissue using convolutional neural networks and novel total intensity maps. Biomed Signal Process Control. (2025) 102:107250. doi: 10.1016/j.bspc.2024.107250
26. He J and Chen L. Perspective from nhanes data: synergistic effects of visceral adiposity index and lipid accumulation products on diabetes risk. Sci Rep. (2025) 15:258. doi: 10.1038/s41598-024-84034-7
27. Wang Q, Wang Z, Tang Z, Liu C, Pan Y, and Zhong S. Association between cardiometabolic index and kidney stone from nhanes: A population-based study. Front Endocrinol (Lausanne). (2024) 15:1408781. doi: 10.3389/fendo.2024.1408781
28. Parra-Soto S, Boonpor J, Lynskey N, Araya C, Ho F, Pell JP, et al. Association between visceral adiposity index and cancer risk in the uk biobank cohort. Cancer. (2024) 131(1):e35576. doi: 10.1002/cncr.35576
29. Chen X, Zhao Y, Sun J, Jiang Y, and Tang Y. Identification of metabolic syndrome using lipid accumulation product and cardiometabolic index based on nhanes data from 2005 to 2018. Nutr Metab (Lond). (2024) 21:96. doi: 10.1186/s12986-024-00864-2
30. Wakabayashi I and Daimon T. The "Cardiometabolic index" as a new marker determined by adiposity and blood lipids for discrimination of diabetes mellitus. Clin Chim Acta. (2015) 438:274–8. doi: 10.1016/j.cca.2014.08.042
31. Wang J, Xiao L, and Li Z. Cardiometabolic index and mortality risks: elevated cancer and reduced cardiovascular mortality risk in a large cohort. Lipids Health Dis. (2024) 23:427. doi: 10.1186/s12944-024-02415-3
32. Ningjian W, Hualing Z, Bing H, Qin L, Yi C, Yingchao C, et al. Visceral fat dysfunction is positively associated with hypogonadism in chinese men. Sci Rep. (2016) 6:19844. doi: 10.1038/srep19844
33. Zhu Y, Huang Y, Sun H, Chen L, Yu H, Shi L, et al. Novel anthropometric indicators of visceral obesity predict the severity of hyperlipidemic acute pancreatitis. Lipids Health Dis. (2024) 23:120. doi: 10.1186/s12944-024-02112-1
34. Amato MC, Giordano C, Galia M, Criscimanna A, Vitabile S, Midiri M, et al. Visceral adiposity index: A reliable indicator of visceral fat function associated with cardiometabolic risk. Diabetes Care. (2010) 33:920–2. doi: 10.2337/dc09-1825
35. Kahn HS. The "Lipid accumulation product" Performs better than the body mass index for recognizing cardiovascular risk: A population-based comparison. BMC Cardiovasc Disord. (2005) 5:26. doi: 10.1186/1471-2261-5-26
36. Dickerman BA, Ahearn TU, Giovannucci E, Stampfer MJ, Nguyen PL, Mucci LA, et al. Obesity and risk of prostate cancer progression among men with clinically localized prostate cancer. Int J Cancer. (2017) 141(5):933–44. doi: 10.1002/ijc.v141.5
37. Céline L, Emilie CD, Fanny A, Xavier R, Pierre-Jean L, Brigitte T, et al. Body mass index trajectories and prostate cancer risk: results from the epicap study. Cancer Med. (2020) 9:6421–9. doi: 10.1002/cam4.v9.17
38. Mohammed S, Ruben U, Yubing T, Alex S, LD I, UJ K, et al. Peri prostatic adipose tissue (Ppat) mri radiomics derived features associated with clinically significant prostate cancer. J endourology. (2023) 37 (10):1156–61. doi: 10.1089/end.2023.0215
39. Katelyn S, Kristi C-W, Julie L, and Jamy A. Changes in the Visceral Adiposity Index (Vai) among Obese Older Adults after a 12-Month Exercise and Diet Intervention. Curr Developments Nutr. (2021) 5:1247–. doi: 10.1093/cdn/nzab055_057
40. Lu Y, Li N, Kamishima T, Jia P, Zhou D, Hind K, et al. Visceral obesity and lipid profiles in chinese adults with normal and high body mass index. Diagnostics (Basel). (2022) 12(10). doi: 10.3390/diagnostics12102522
41. Hamzeh B, Pasdar Y, Mirzaei N, Faramani RS, Najafi F, Shakiba E, et al. Visceral adiposity index and atherogenic index of plasma as useful predictors of risk of cardiovascular diseases: evidence from a cohort study in Iran. Lipids Health Dis. (2021) 20:82. doi: 10.1186/s12944-021-01505-w
42. Zhuo L, Lai M, Wan L, Zhang X, and Chen R. Cardiometabolic index and the risk of new-onset chronic diseases: results of a national prospective longitudinal study. Front Endocrinol (Lausanne). (2024) 15:1446276. doi: 10.3389/fendo.2024.1446276
43. Liu Y, Zhao W, Liu X, Jiang H, Wu Y, Luo L, et al. Identifying reliable obesity indices for hyperuricemia among middle-aged and elderly populations: A longitudinal study. Lipids Health Dis. (2024) 23:305–. doi: 10.1186/s12944-024-02296-6
44. Hayashi N, Matsushima M, Yamamoto T, Sasaki H, Takahashi H, and Egawa S. The impact of hypertriglyceridemia on prostate cancer development in patients aged ≥60 years. BJU Int. (2012) 109:515–9. doi: 10.1111/j.1464-410X.2011.10358.x
45. Song P, Zha M, Yang X, Xu Y, Wang H, Fang Z, et al. Socioeconomic and geographic variations in the prevalence, awareness, treatment and control of dyslipidemia in middle-aged and older chinese. Atherosclerosis. (2019) 282:57–66. doi: 10.1016/j.atherosclerosis.2019.01.005
46. Zhao R CG, Wang B, Qin C, Liu Y, Pan Y, Wang J, et al. Bmi and serum lipid parameters predict increasing risk and aggressive prostate cancer in chinese people. Oncotarget. (2017) 8:66051–60. doi: 10.18632/oncotarget.19790
47. Sakers A, De Siqueira MK, Seale P, and Villanueva CJ. Adipose-tissue plasticity in health and disease. Cell. (2022) 185:419–46. doi: 10.1016/j.cell.2021.12.016
48. Feng S, Lou K, Luo C, Zou J, Zou X, and Zhang G. Obesity-related cross-talk between prostate cancer and peripheral fat: potential role of exosomes. Cancers (Basel). (2022) 14(20). doi: 10.3390/cancers14205077
49. Prapimporn CS and Hataikarn N. Vitamin D and visceral obesity in humans: what should clinicians know? Nutrients. (2022) 14:3075. doi: 10.3390/nu14153075
50. Luo Y, Yu J, Lin Z, Wang X, Zhao J, Liu X, et al. Metabolic characterization of sphere-derived prostate cancer stem cells reveals aberrant urea cycle in stemness maintenance. Int J Cancer. (2024) 155:742–55. doi: 10.1002/ijc.34967
51. Laurent V, Toulet A, Attane C, Milhas D, Dauvillier S, Zaidi F, et al. Periprostatic adipose tissue favors prostate cancer cell invasion in an obesity-dependent manner: role of oxidative stress. Mol Cancer Res. (2019) 17:821–35. doi: 10.1158/1541-7786.MCR-18-0748
52. Gong Z, Platek ME, Till C, Goodman PJ, Tangen CM, Platz EA, et al. Associations between polymorphisms in genes related to oxidative stress and DNA repair, interactions with serum antioxidants, and prostate cancer risk: results from the prostate cancer prevention trial. Front Oncol. (2022) 11:808715–. doi: 10.3389/fonc.2021.808715
53. Rebillard A, Lefeuvre-Orfila L, Gueritat J, and Cillard J. Prostate cancer and physical activity: adaptive response to oxidative stress. Free Radical Biol Med. (2013) 60:115–24. doi: 10.1016/j.freeradbiomed.2013.02.009
54. Gong Y, Dou LJ, and Liang J. Link between obesity and cancer: role of triglyceride/free fatty acid cycling. Eur Rev Med Pharmacol Sci. (2014) 18:2808–20. Y G, L-J D, J L.
55. Wentao Z, Xueqing W, Yufei W, Guoqian S, Jia Z, and Zhuo L. Obesity and endocrine-related cancer: the important role of igf-1&13. Front Endocrinol. (2023) 14:1093257–. doi: 10.3389/fendo.2023.1093257
56. Makoto M, Kazutoshi F, Takuji H, Hisako K, Daisuke M, Hiroaki H, et al. Gut microbiota-derived short-chain fatty acids promote prostate cancer growth via igf-1 signaling. Cancer Res. (2021) 81:4014–26. doi: 10.1158/0008-5472.Can-20-4090
57. Di Gioia G, Ferrera A, Celeski M, Mistrulli R, Lemme E, Mango F, et al. Lipid accumulation product and cardiometabolic index as effective tools for the identification of athletes at risk for metabolic syndrome. Life (Basel). (2024) 14(11). doi: 10.3390/life14111452
58. Carvalho RL, Brito TRP, Amaral JB, Monteiro FR, Lima DB, Pereira TAM, et al. Unraveling the interaction between inflammation and the cardiometabolic index in older men: A pilot study. Nutrients. (2024) 16(15):20240802. doi: 10.3390/nu16152529
59. Lysaght J, van der Stok EP, Allott EH, Casey R, Donohoe CL, Howard JM, et al. Pro-inflammatory and tumour proliferative properties of excess visceral adipose tissue. Cancer Lett. (2011) 312:62–72. doi: 10.1016/j.canlet.2011.07.034
60. Hornung F, Rogal J, Loskill P, Loffler B, and Deinhardt-Emmer S. The inflammatory profile of obesity and the role on pulmonary bacterial and viral infections. Int J Mol Sci. (2021). doi: 10.3390/ijms22073456
61. Kuipers EN, Dam ADV, Ballak DB, Wit EAD, Dinarello CA, Stienstra R, et al. Il-37 expression reduces lean body mass in mice by reducing food intake. Int J Mol Sci. (2018) 19:2264–. doi: 10.3390/ijms19082264
62. Saha A, Kolonin MG, and DiGiovanni J. Obesity and prostate cancer - microenvironmental roles of adipose tissue. Nat Rev Urol. (2023) 20:579–96. doi: 10.1038/s41585-023-00764-9
63. Makito M, Steve G, Virginia U, and Evan GG. Expression of cxcl1 in human endothelial cells induces angiogenesis through the cxcr2 receptor and the erk1/2 and egf pathways. Lab investigation; J Tech Methods Pathol. (2013) 93:768–78. J RC. doi: 10.1038/labinvest.2013.71
64. Maynard JP, Ertunc O, Kulac I, Baena-Del Valle JA, De Marzo AM, and Sfanos KS. Il8 expression is associated with prostate cancer aggressiveness and androgen receptor loss in primary and metastatic prostate cancer. Mol Cancer Res. (2020) 18:153–65. doi: 10.1158/1541-7786.MCR-19-0595
65. Ullah A, Jiao W, and Shen B. The role of proinflammatory cytokines and cxc chemokines (Cxcl1-cxcl16) in the progression of prostate cancer: insights on their therapeutic management. Cell Mol Biol Lett. (2024) 29:73. doi: 10.1186/s11658-024-00591-9
66. Saha A, Ahn S, Blando J, Su F, Kolonin MG, and DiGiovanni J. Proinflammatory cxcl12-cxcr4/cxcr7 signaling axis drives myc-induced prostate cancer in obese mice. Cancer Res. (2017) 77:5158–68. doi: 10.1158/0008-5472.CAN-17-0284
67. Victor L, Adrien G, Catherine M, Sophie LG, Aurélie T, Laurence N, et al. Periprostatic adipocytes act as a driving force for prostate cancer progression in obesity. Nat Commun. (2016) 7:10230. doi: 10.1038/ncomms10230
Keywords: prostate cancer, visceral obesity indicators, cardiometabolic index, lipid accumulation product, visceral adiposity index
Citation: Cai Z, Guan X, Xiao Y, An H and Tao N (2025) Association of visceral obesity indicators with prostate cancer: a cross-sectional study from Xinjiang. Front. Oncol. 15:1614743. doi: 10.3389/fonc.2025.1614743
Received: 19 April 2025; Accepted: 11 June 2025;
Published: 09 July 2025.
Edited by:
Wenyi Jin, City University of Hong Kong, Hong Kong SAR, ChinaReviewed by:
Weiping Li, First Hospital of Lanzhou University, ChinaWei Li, The People’s Hospital of Guangxi, China
Yaqun Zhang, Second Hospital of Tianjin Medical University, China
Copyright © 2025 Cai, Guan, Xiao, An and Tao. This is an open-access article distributed under the terms of the Creative Commons Attribution License (CC BY). The use, distribution or reproduction in other forums is permitted, provided the original author(s) and the copyright owner(s) are credited and that the original publication in this journal is cited, in accordance with accepted academic practice. No use, distribution or reproduction is permitted which does not comply with these terms.
*Correspondence: Hengqing An, OTI2OTczNUBxcS5jb20=; Ning Tao, Mzg1MTg0MTJAcXEuY29t
†These authors have contributed equally to this work