 Conrado Guerrero Quiles1*
 Siobhan Fahy1
 Matej Bartak1†Julia Gonzalez Abalos2†Emilia Powell1T. Lodhi1Rachel Reed1Kim Reeves1
 Alex Baker3Nicholas D. James4
 Emma Hall4
 Robert A. Huddart4Nuria Porta4
 Peter Hoskin1
 Catharine West1Luisa V. Biolatti1†Ananya Choudhury1†
- 1Division of Cancer Sciences, The University of Manchester, The Christie Hospital National Health Service (NHS) Foundation Trust, Manchester, United Kingdom
- 2Institute Curie, Immunity and Cancer Unit (U932), Paris, France
- 3Cancer Research UK Manchester Institute, The University of Manchester, Manchester, United Kingdom
- 4Clinical Trials & Statistics Unit, The Institute of Cancer Research, London, United Kingdom
Muscle-invasive bladder cancer (MIBC) is a prevalent disease that can be treated with radiotherapy, but has a poor prognosis. Radiation-induced extracellular matrix (ECM) remodelling and fibrosis can induce tumour resistance and recurrence, but have not been studied in MIBC. Here, we aimed to characterise the impact of radiation on the ECM composition of MIBC. Three MIBC cell lines (T24, UMUC3, J82) were treated with fractionated radiation. We used proteomics to analyse the ECM composition produced by surviving cancer cells and immunofluorescence to investigate changes in the morphology and number of ECM fibres. We evaluated the RNA expression of identified ECM proteins (FN1, COL5A1, COL1A1, TNF6AIP6, FLG) in one cystectomy (TCGA-BLCA, n=397) and two radiotherapy (BC2001, n=313; BCON, n=151) cohorts. There were 613 proteins affected by radiation (padj<0.05, fold change >2 or <-2), 68 of which were ECM-associated proteins. There was a general increase in proteases and protease regulators but heterogeneity across cell lines. Enrichment analysis showed ECM organisation was the primary pathway affected. Immunofluorescence confirmed radiation affected ECM structure, generally, reducing the number, length and width of fibres. Five ECM genes of interest were identified (COL1A1, COL5A2, FN1, FLG, TNFAIP6), constituting an ECM signature. High FN1, COL1A1, TNF6AIP6 mRNA levels and ECM signature scores were independent poor prognostic markers, while FLG mRNA expression independently predicted radiotherapy benefit in a meta-analysis (n=861). We found high COL1A1 expression levels predicted hypoxia-modifying treatment benefit. Prognostic significance of COL5A2, FN1 and the ECM signature was dependent on patients harbouring TP53-mutations. Radiation alters the composition and structure of the ECM produced by MIBC. As a proof-of-concept, we showed that radiation-affected ECM genes are independent prognostic and predictive markers of radiotherapy benefit in MIBC. Future studies should validate these radiation-induced ECM changes in clinical samples, and explore the role of FLG in radioresistance.
1 Introduction
Bladder cancer is a prevalent disease with >550,000 new cases yearly worldwide which can be classified as non-muscle invasive (NMIBC) or muscle-invasive (MIBC). NMIBC has high 5-year survival rates, >95% for in situ and 75% for localised tumours (1). However, MIBC prognosis is poor, with a 21% 5-year overall survival rate in England (2). UK standard-of-care (SOC) treatment for MIBC is radical cystectomy or radiotherapy (55Gy, 2.75Gy daily over 4 weeks), which have similar outcomes (3, 4). However, although radiotherapy allows for bladder preservation, only 30% of MIBC patients in the UK choose this treatment (3, 4), highlighting a need for research to further improve radiotherapy outcomes.
Radiotherapy resistance mechanisms affect recurrence and poor outcomes for MIBC patients who chose radiotherapy over cystectomy. Many mechanisms are associated with radiotherapy resistance, such as DNA damage repair upregulation, cell-cycle arrest and hypoxia (5). One less explored mechanism is the development of tumour fibrosis and extracellular matrix (ECM) remodelling. The ECM is a complex and dynamic network of macromolecules which offers mechanical and structural support to surrounding cells. It plays a key role in several functions, including cell proliferation, growth, differentiation and migration (6). It is composed of over 1,000 different proteins, including collagen (COL), laminin (LAM), fibronectin (FN1) and cell-binding glycoproteins (7). During tumour progression, there is increased secretion and crosslinking of FN and COL, leading to desmoplasia and tumour fibrosis (6). Fibrosis is a poor prognostic marker in cancer, which promotes tumour progression (8), and evidence suggests it can directly impact radiotherapy resistance. Cordes et al. highlighted radiation increases integrin expression, leading to a 10-fold enhancement in adhesion to LAM and FN1 and increased radioresistance (9). Handschel et al. found increased integrin and cell adhesion molecule expression in head & neck cancer patients after radiotherapy (10). More recently, Jin et al. showed a direct association with ECM stiffness, with higher stiffness levels promoting radioresistance in cervical cancer cells by altering apoptotic processes (11).
The association of fibrosis with radioresistance is especially relevant during radiotherapy, as radiation induces fibrosis (12). This relationship is well-acknowledged; myofibroblasts in the tumour-adjacent tissue increase the deposition and crosslinking of ECM components (e.g. COL, FN1), impairing patient outcomes (12). For example, Streltsova et al. showed radiotherapy alters COL structures within the bladder in a cohort of 105 patients with cervix or endometrial cancer (13). Therefore, early radiotherapy-induced fibrosis has the potential to drive radioresistance, especially if occurring within the tumour. As a proof-of-concept, Politko et al. showed irradiation alters the expression of proteoglycan (versican, decorin) and glycosaminoglycan (brevican) in the ECM of glioblastoma mouse models (14). Targeting the ECM during radiotherapy has recently been proposed to improve treatment outcomes (15), but the implementation of ECM-targeted therapies is impaired by a lack of comprehensive studies of the ECM produced by cancer cells during radiotherapy. Therefore, we aimed to characterise the ECM composition produced by MIBC cells that survived fractionated radiation, partially mimicking SOC (27.5Gy, 2.75Gy daily over 2 weeks).
2 Methodology
2.1 Cell culture
T24, UMUC3 and J82 cells were acquired from the American Type Culture Collection (ATCC; Virginia, USA). Cells were grown in McCoy’s 5A with L-glutamine (Gibco, Waltham, USA), supplemented with 10% foetal bovine serum (FBS; Sigma-Aldrich, Missouri, USA). Cells were routinely authenticated and tested for mycoplasma. Cells were maintained in a tissue culture incubator (Leec Culture Safe CO2, Appleton Woods, Birmingham, UK) at 37°C and 5% CO2.
2.2 Irradiation
T24, J82 and UMUC3 cell lines were irradiated using an Xstrahl CIX3 irradiator (Xstrahl, Camberley, UK). The cells received 2.75Gy Monday to Friday at a voltage of 300Kv and a current of 10 mA for 2 weeks (total dose: 27.5Gy). The fractionated schedule was chosen to partially mimic the current UK SOC radiotherapy for MIBC (16). Non-irradiated control cells were simultaneously maintained and “mock-irradiated”. After irradiation, cells were maintained for four additional weeks in cell culture without any treatment to allow for recovery.
2.3 Production of cell-derived ECMs
After recovery, cells were grown for 7 days in normal tissue culture conditions. Cell-derived matrices (CDMs) were extracted as previously described (17). Briefly, decellularisation was performed with a decellularisation buffer (20 mM H4OH, 0.5% Triton X-100 in phosphate-buffered saline [PBS]) and CDM was recovered by scraping with 2X SDS buffer (4% (w/v) SDS, 10% (w/v) glycerol, 50 mM Tris HCl, 0.005% (w/v) bromophenol blue, 20% (v/v) mercaptoethanol). Protein concentration was increased as described previously (18) by adding four volumes of acetone and incubating samples at -80°C overnight. Supernatant was then removed, samples washed with the same volume of acetone, and the resulting pellet air-dried at room temperature. Samples were then resuspended in 2X SDS buffer in a thermomixer shaker (1000rpm, 20 min, 70°C). Protein concentration was determined using InstantBlue (Abcam, Cambridge, UK) after SDS-PAGE electrophoresis (45 min, 200 V; 4-12% Bis-Tris gels; Thermo Fisher Scientific), using protein samples of known standard concentrations as previously described (19).
2.4 Mass spectrometry
MS analysis was performed following previously described protocols (17, 20). In short, 5 µg of protein was loaded onto a 4-15% agarose gel (Thermo Fisher Scientific for SDS-PAGE electrophoresis (3 min, 200V; Thermo Fisher Scientific). Protein bands were stained with InstantBlue Coomassie (Abcam), sectioned, and in-gel trypsin digested before being analysed by tandem liquid chromatography-mass spectrometry (LC-MS/MS) using an UltiMate 3000 Rapid Separation LC system (Thermo Fisher Scientific) coupled with an Orbitrap Elite Mass Spectrometer (Thermo Fisher Scientific).
Following previously described protocols (20, 21), MS data was analysed using an in-house Mascot Server (v. 2.5.1; Matrix Sciences) with mass tolerances of 0.4 Da and 0.5 Da for precursor and fragment ions, respectively. Data was validated using Scaffold (v. 4.6.3; Thermo Fisher Scientific) with an identification threshold of 90% at the peptide level, with at least one unique validated peptide (0.1% estimated false discovery rate). Protein identification, normalisation, and fold-change and p-values calculations were performed with Protein Discoverer (v. 2.5.0.400; ThermoFisher Scientific).
2.5 Immunofluorescence
Non-previously irradiated cells were single-dose irradiated (8Gy; 300Kv, 10mA) using an Xstrahl CIX3 irradiator (Xstrahl). Non-irradiated control cells were simultaneously “mock-irradiated”. Cells were allowed to recover in a tissue-culture incubator overnight (37°C, 5% CO2) and fixed with 8% (w/v) paraformaldehyde solution (10 min, room temperature). Samples were blocked (1 h, room temperature) using blocking buffer (1% [w/v] BSA in PBS) and sequentially stained: (1) overnight incubation (4°C) with rabbit polyclonal antibodies for FN (Sigma-Aldrich, 1:300 dilution), COL5 (Novus Biological, 1:300 dilution), or COL1 (Novus Biological, 1:300 dilution) in blocking buffer; (2) permeabilisation with 0.3% (v/v) Triton-100X in PBS (30 min, room temperature), followed by overnight incubation (4°C) with vinculin (Sigma-Aldrich, 1/300 dilution) and PXN (BD Biosciences, New Jersey, USA; 1/300 dilution) monoclonal mouse antibodies in blocking buffer; (3) incubation with 488 nm Alexa Fluor anti-rabbit (Thermo Fisher Scientific; 1/500 dilution), Alexa Fluor 546 nm anti-mouse (Thermo Fisher Scientific; 1/500 dilution) secondary antibodies, in blocking buffer (2 h, room temperature); (4) nuclei staining (5 min, room temperature) with 300 mM DAPI (Thermo Fisher Scientific) in PBS. Samples were imaged using high-content screening (PerkinElmer Opera Phenix; PerkinElmer) using three confocal spinning disk lasers (405 nm 50mW, 488 nm 50mW, 561 nm 50mW) with a fixed light path system. Three Zyla sCMOS cameras, 2160x2160 pixels, 6.5um pixel size (Andor, Belfast, UK) were set up for each dedicated light path. Twenty fields of view were acquired with a Z range of 34.5µm in 1.5µm steps using the Zeiss W Plan-Apochromat X20 water objective NA 1.0 WD 1.17 mm. Images were analysed using the Harmony software (V. 4.9; PerkinElmer, Massachusetts, USA), reconstructing the acquired field-of-view images as a 2D maximum projection object. Fibres were defined as any object stained with anti-FN, COL1, or COL5 antibodies with roundness <0.8 and an intensity signal >70% of the threshold intensity background signal. DAPI staining was used to estimate the total amount of cells for each acquired image.
2.6 Clinical cohorts
Three MIBC cohorts with whole transcriptomic data were used: TCGA-BLCA (n=397), BC2001 (n=313) and BCON (n=151). TCGA-BLCA details were previously detailed (22). Transcriptomic and clinical data are publicly available and were downloaded from the cBioPortal repository (23). Patients reported to have had radiotherapy were removed (n=10), and the cohort was considered a cystectomy cohort. BC2001 (NCT00024349; assessing the addition of chemotherapy to radiotherapy) (24), and BCON (NCT00033436; assessing hypoxia-modifying therapy combined with radiotherapy) (25) are multicentre, randomised, phase 3 trials. Both trials followed local practice radiotherapy (64 Gy in 32 fractions over 6.5 weeks or 55 Gy in 20 fractions over 4 weeks). Whole-transcriptomic methodology and trial details were previously published for both cohorts (16, 24–26). For all cohorts, the primary endpoint was 5-year overall survival (OS), defined as the time from the date of randomisation to the date of death up to a 5-year cut-off.
Patients were stratified based on the cohort median expression for each gene of interest (FN1, COL5A2, COL1A1, FLG, TNFAIP6). An ECM signature score was generated as the median expression of the five genes. ECM signature scores were dichotomised by cohort signature score medians. For FLG and TNFAIP6 genes, we also explored use of cohort tertiles for stratification.
For meta-analysis, the clinical data for the three cohorts (BCON, BC2001, TCGA-BLCA) were combined as previously described (16). Patients were stratified as described above within each individual cohort.
2.7 Data acquisition and analysis
RNAseq (GENCODE annotation version 25) for 533 cancer cell lines were downloaded from the Cancer Cell Line Encyclopedia (CCLE) (27). Corresponding radiosensitivity measurements [integral survival (AUC)] were also available as previously described (28).
Data filtering, clustering, enrichment, prognostic and correlation analyses were carried out using RStudio (v. 1.5033) using the following packages from The Comprehensive R Archive Network (CRAN, https://cran.r-project.org/): org.Hs.eg.db, AnnotationDbi, ClusterProfiler, DOSE, ggplot2, enrichplot, ReactomePA, GoSemSIM, ggVennDiagram, tibble, survival, survminer, dplyr. To avoid data biases in the analysis from non-ECM contaminant proteins, data was filtered using the Matrisome Project database as a reference (29), excluding all non-ECM proteins from the analyses.
Immunofluorescence data analysis normality was tested using the Shaphiro-Wilks test and statistical differences were determined with a Kruskal-Wallis test with p. values correction. All measurements were normalised based on the total estimated number of cells, and fold changes were calculated using non-irradiated controls as a baseline reference. All significant values were estimated in comparison to the baseline non-irradiated controls. Analyses were performed using GraphPad Prism (v. 9.3.1; GraphPad, Massachusetts, USA).
3 Results
3.1 Fractionated radiation alters the extracellular matrix (ECM) composition of MIBC cells
Proteomics identified 1,408 proteins (n=1,357 in T24, n=1,062 in UMUC3, n=912 in J82). A total of 613 unique proteins were identified as altered by radiation across the three cell lines (padj<0.05, fold change > 2 or <-2). In T24, 45 proteins were upregulated and 73 downregulated (Figure 1A); UMUC3 had 121 upregulated and 165 downregulated proteins (Figure 1B); whilst J82 had 253 upregulated and 113 downregulated proteins (Figure 1C). Enrichment analysis confirmed CDM samples were significantly enriched in proteins associated with the ECM-related cellular compartment terms including “cell-substrate junction” (14.1% of proteins) and “focal adhesion” (14.2% of proteins). Enriched terms related to non-ECM proteins such as ribosomal and cytosolic subunit were also identified at a lower percentage than those associated with the ECM. Proteomic analysis confirmed that radiation alters ECM composition produced by bladder cancer cells.
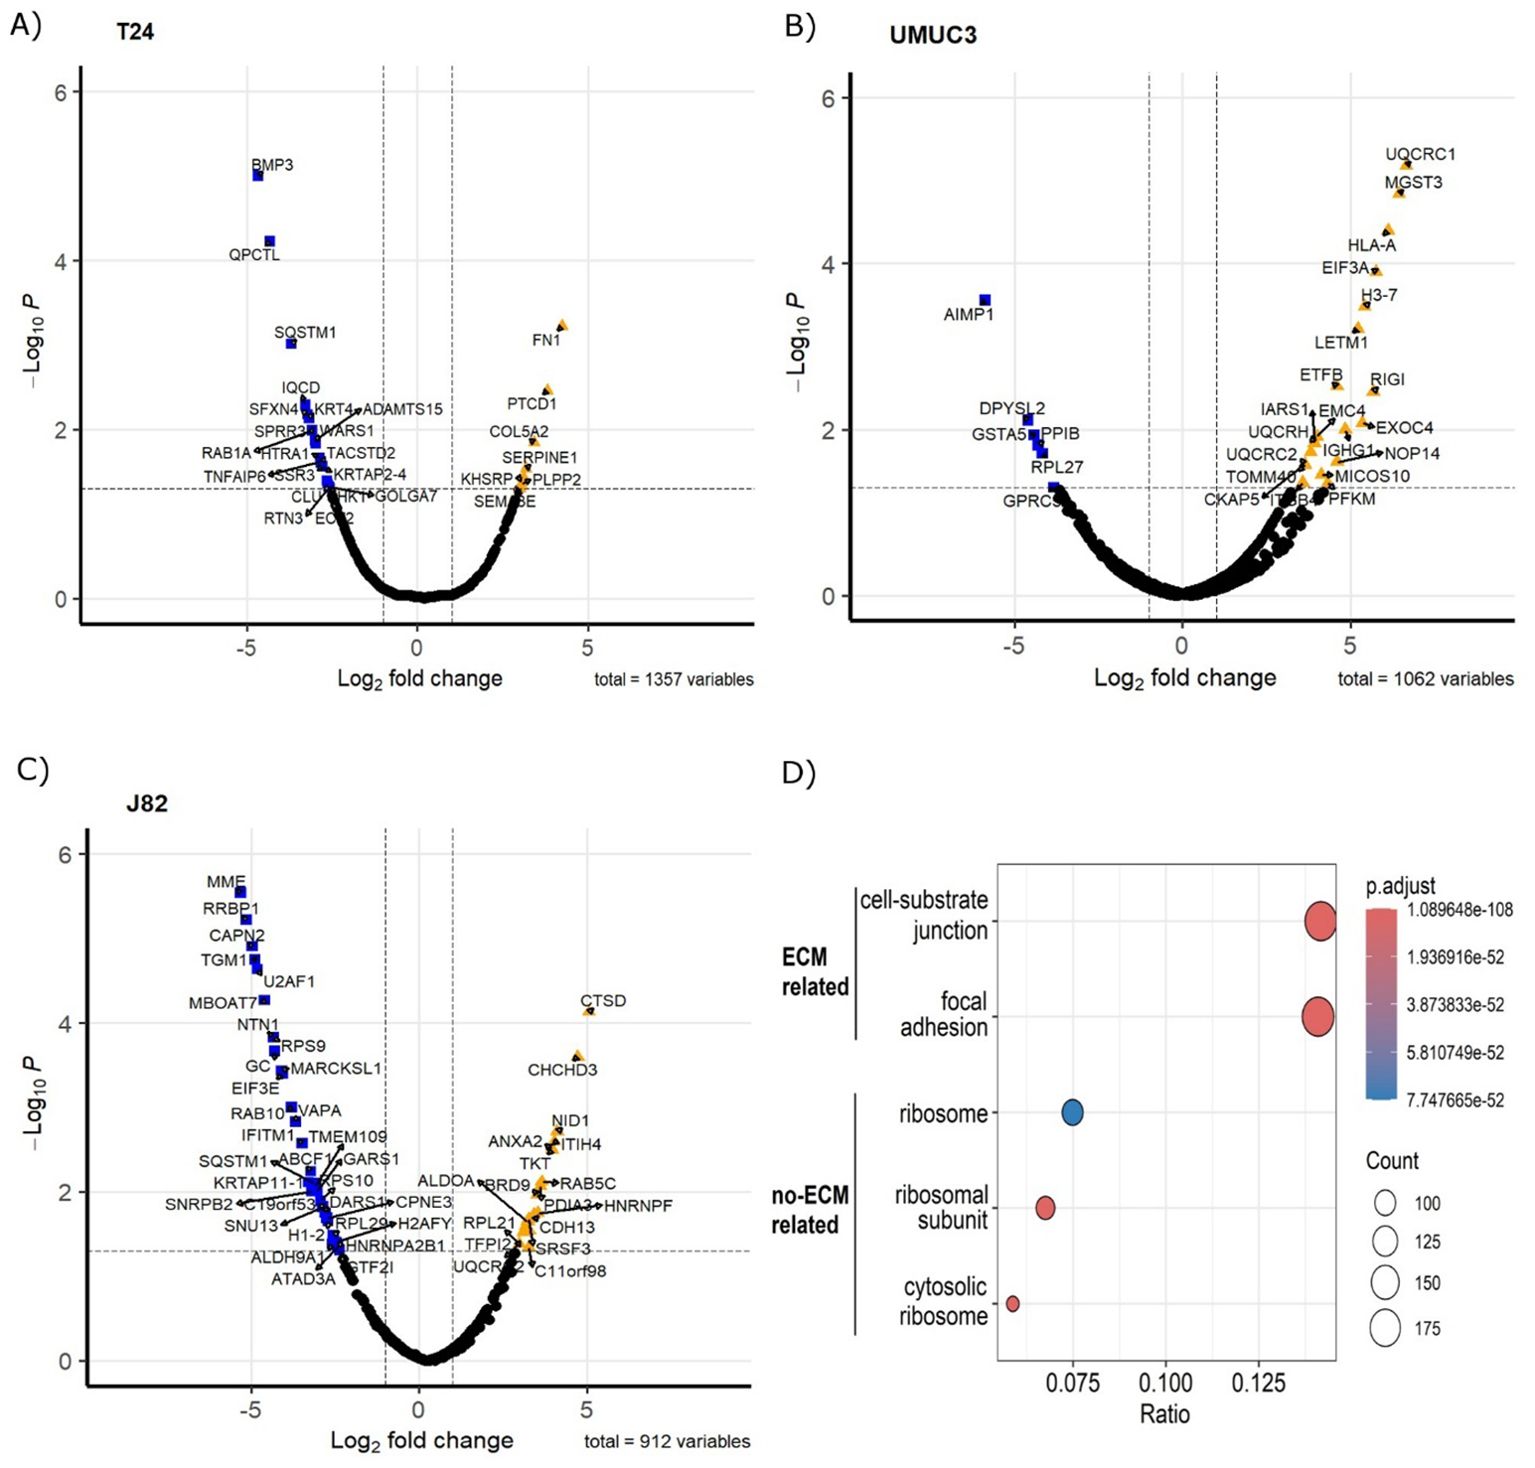
Figure 1. Fractionated radiotherapy partially mimicking SOC (27.5Gy, 2.75Gy daily over 2 weeks) alters the protein composition of the ECM produced by muscle-invasive bladder cancer cell lines. Volcano plots represent significantly upregulated (fold change >2, p.adj. <0.05) and downregulated (fold change <-2, p.adj. <0.05) proteins in cell-derived extracellular matrices (CDMs) for T24 (A), UMUC3 (B) and J82 (C) cell lines. Cellular compartment GO Term enrichment analysis (D) confirms CDMs protein fractions are enriched in ECM-liked proteins. Upregulated proteins are represented as orange triangles; downregulated proteins are represented as blue squares. Three biological repeats were analysed per cell line.
3.2 Fractionated radiation mainly affects the expression of ECM non-structural proteins
We used the Matrisome database as a reference to remove any non-ECM proteins from the generated datasets. After filtering, we identified with high confidence a total of 68 ECM proteins affected by radiation (Figure 2A). Non-structural ECM proteins were the most prevalent, which included growth factors (e.g. platelet-derived growth factor [PDGF] B, fibroblast growth factor [FGF] 5), cytokines (e.g. chemokine CXC motif ligand [CXCL] 1, CXCL2), proteases (e.g. adamalysin [ADAM] TS12, ADAMTS19) and proteases-regulators (e.g. serpin [SERPIN] E1, SERPINF2) (Figure 2A). However, we also observed changes in ECM structural proteins (e.g. COL5A2, FN1). Radiation-induced changes in the ECM composition were cell-line dependent, with only two significant in common across all three cell lines (Filaggrin [FLG] and tumour necrosis factor-alpha induced-protein 6 [TNFAIP6]) (Figure 2B). Of interest, although COL upregulation was observed (e.g. COL5A2 in T24), several collagen types (e.g. COL4A3 in UMUC3, COL7A1 in J82) were downregulated. Pathway enrichment analysis confirmed radiation mostly alters the “ECM organisation”, affecting >38% of all significant proteins (Figure 2C). Interestingly, molecular function enrichment highlighted “peptidase regulators” (19.4%) and “growth factors” (17.9%) as the most common types of radiation-altered proteins, with “ECM structural components” (16.4%) ranking third (Figure 2D). To confirm these results, we performed another enrichment analysis using the Matrisome database ontology terms designed specifically for ECM analysis. The analysis validated the previous results, with 76% of significant proteins being “ECM-associated”, whilst the “Core ECM” structure only comprised 24% of proteins (Figure 2E). A deeper analysis confirmed that “secreted factors” (37%) and “ECM regulators” (23%) were the most affected protein types following fractionated irradiation. “ECM-affiliated proteins” (13%) was the third most affected “ECM associated” protein type. Regarding the “Core ECM” proteins, “glycoproteins” (19%) were the main affected type, with only 6% and 1% of significant proteins being “collagens” and “proteoglycans”, respectively. GO molecular function enrichment validated these results, showing a consistent enrichment in growth factors, peptidase, and peptidase regulators (Supplementary Figure S1A). A general increase in peptidase and peptidase regulators was observed (Supplementary Figures S1B–D). In addition, a significant enrichment in cytokines and glycosaminoglycan binding molecules was also observed (Supplementary Figure S1). Overall, our analysis suggests fractionated radiation mostly affects the ECM organisation indirectly by altering the expression of ECM regulators rather than directly altering the expression of ECM structural proteins.
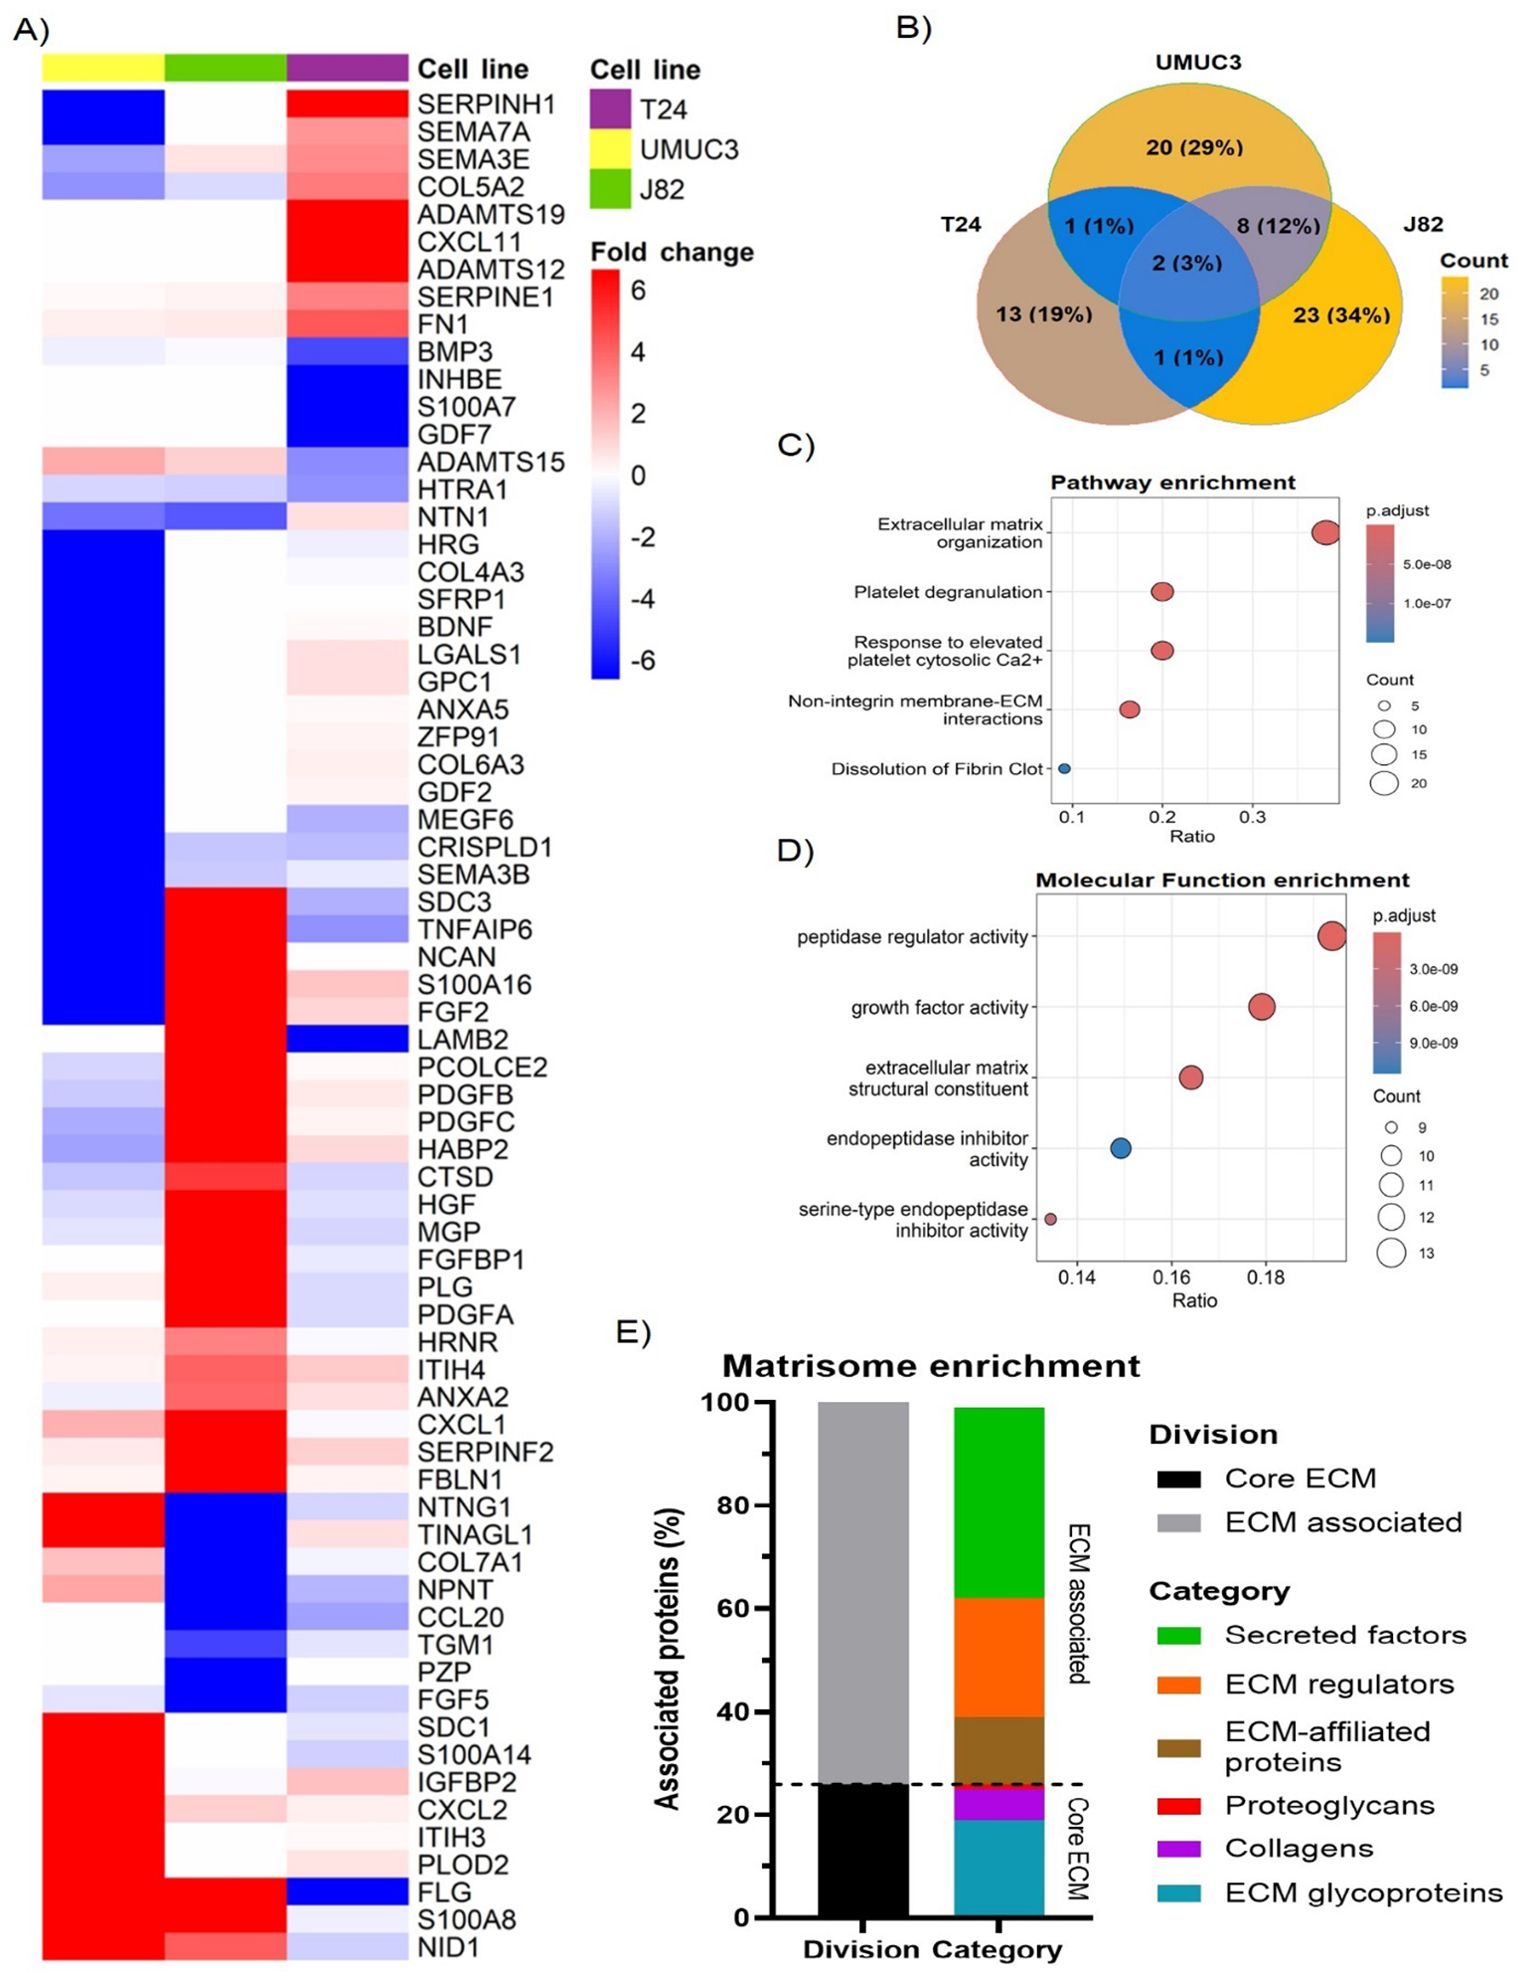
Figure 2. Fractionated radiotherapy partially mimicking SOC (27.5Gy, 2.75Gy daily over 2 weeks) alters the expression of 68 extracellular matrix (ECM) proteins, which are mostly associated with “peptidase regulator activity” and “ECM organisation”. Heatmap (A) represents the fold change for all identified ECM proteins significantly upregulated (fold change >2, p.adj. <0.05) and downregulated (fold change <-2, p.adj. <0.05) in T24, UMUC3 and/or J82 cell lines. Venn diagram (B) shows the overlapping among the significantly up and downregulated proteins identified in each cell line, highlighting cell line variability. Reactome pathway enrichment (C) shows radiotherapy mostly alters the ECM organisation. GO term molecular function enrichment analysis (D) shows radiotherapy mostly affects peptidase regulators, followed by growth factors and ECM structural components. Ratio (B, C) represents the % of total proteins associated with each term (0–1 scale). Matrisome terms enrichment (E) shows >70% of altered proteins are ECM-associated factors and protein regulators.
3.3 Fractionated radiation induces diverse ECM regulator mechanisms across cell lines
As the previous analysis highlighted high cell line variability, we performed individual gene enrichment analyses for each cell line to find commonly affected pathways. In all cases, the pathway enrichment analysis highlighted “ECM organisation” as the most affected pathway, linked to 40% of proteins in T24, 37.5% in UMUC3, and 42.9% in J82 (Figure 3A). “ECM proteoglycans”, “non-integrin membrane/ECM interactions”, as well as several beta galactosyl and glycosyltransferase pathways (e.g. B3GALT, B3GAT) were enriched in all cell lines, validating our previous results (Figure 3A). However, the pathway alterations are predicted to be induced by different proteins in each cell line. For example, SERPINs protein family signalling is predicted to regulate the “ECM organisation” in T24 and UMUC3 cell lines (Figures 3B, C), whilst platelet-derived growth factors are predicted regulators only in J82 (Figure 3D). Similarly, beta galactosyl and glycosyltransferase activity is regulated by ADAMs) in T24 (Figure 3B), but by syndecans (SDCs) in UMUC3 (Figure 3C). Our results suggest that radiation affects different ECM regulator mechanisms, which converge by affecting the same pathways.
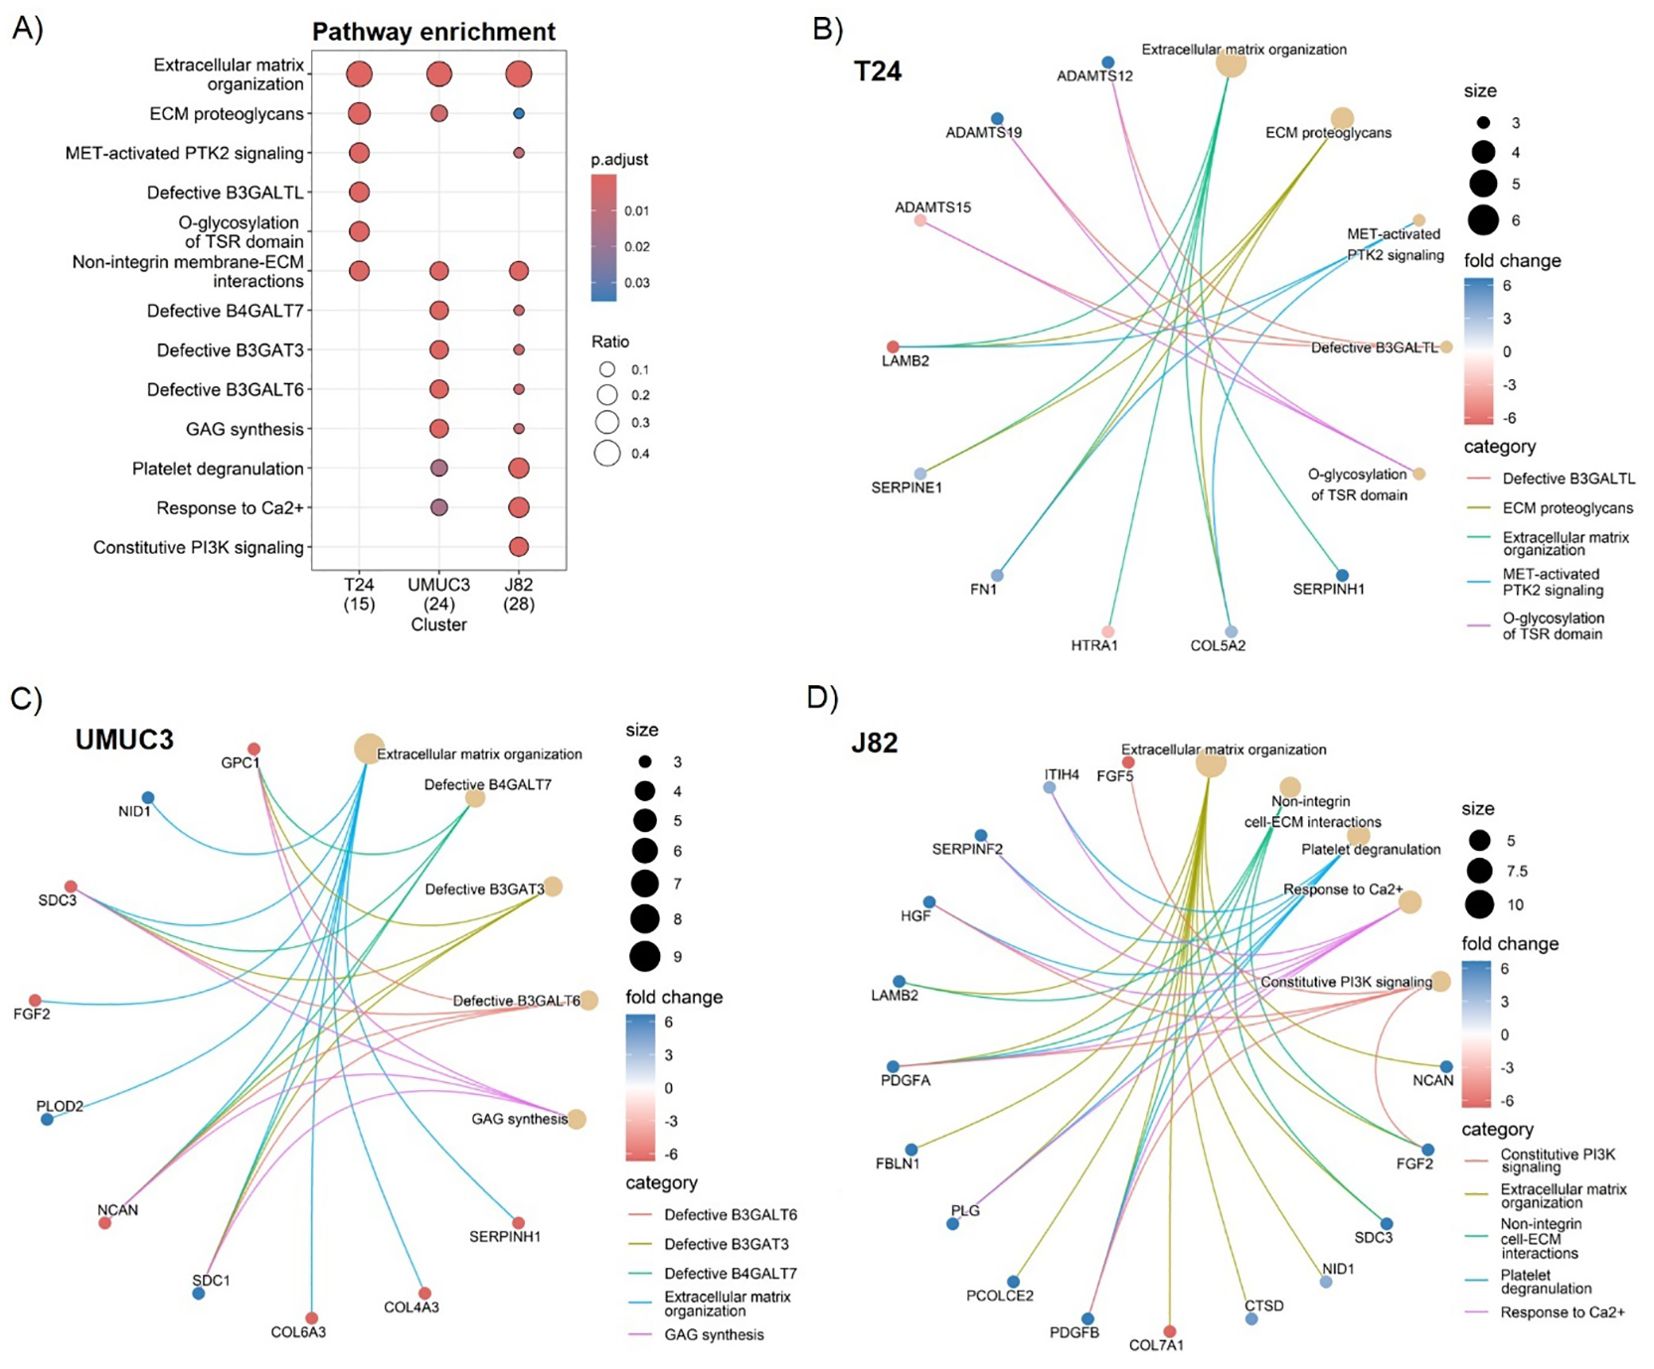
Figure 3. Fractionated radiotherapy partially mimicking SOC (27.5Gy, 2.75Gy daily over 2 weeks) consistently alters the extracellular matrix (ECM) organisation, ECM proteoglycans composition, and the non-integrin cell/ECM interactions across all cell lines. Comparative Reactome pathway enrichment analysis (A) of significantly up (fold change >2, p.adj. <0.05) and downregulated (fold change <-2, p.adj. <0.05) ECM proteins for each individual cell line (T24, UMUC3, J82). Cnetplots show specific associations among significantly up and downregulated proteins and their corresponding enrichment terms for T24 (B), UMUC3 (C) and J82 (D). Ratio (A) represents the % of total proteins associated with each term (0–1 scale). A total of n=3 biological repeats were analysed per cell line.
3.4 Irradiation alters structural ECM fibre number and morphology
As ECM organisation was the main affected pathway following irradiation, we studied how irradiation alters the number and morphology of ECM structural proteins that produce fibres (fibronectin [FN1], collagen 5 [COL5], collagen 1 [COL1]). Irradiation generally decreased FN1 (T24, J82), COL5 (T24, J82) and COL1 (UMUC3) fibre numbers in all cell lines (Figures 4A, B). Only T24 showed a significant 10-fold increase in the number of COL1 fibres (Figures 4A, B). Regarding morphology, the effect on fibre length was cell-line dependent; radiation increased fibre length in T24 (FN1, COL1), but reduced fibre length (COL5, COL1) in UMUC3 (Figures 4A, C). The most consistent effect was a decreased COL5 (T24, UMUC3, J82) and COL1 (UMUC3, J82) fibre width. There were no changes in the width of FN1 fibres (Figures 4A, D). Of note, we did not detect FN1 synthesis in UMUC3 cells. Altogether, these results show irradiation alters ECM fibre numbers and morphology, suggesting it affects ECM organisation.
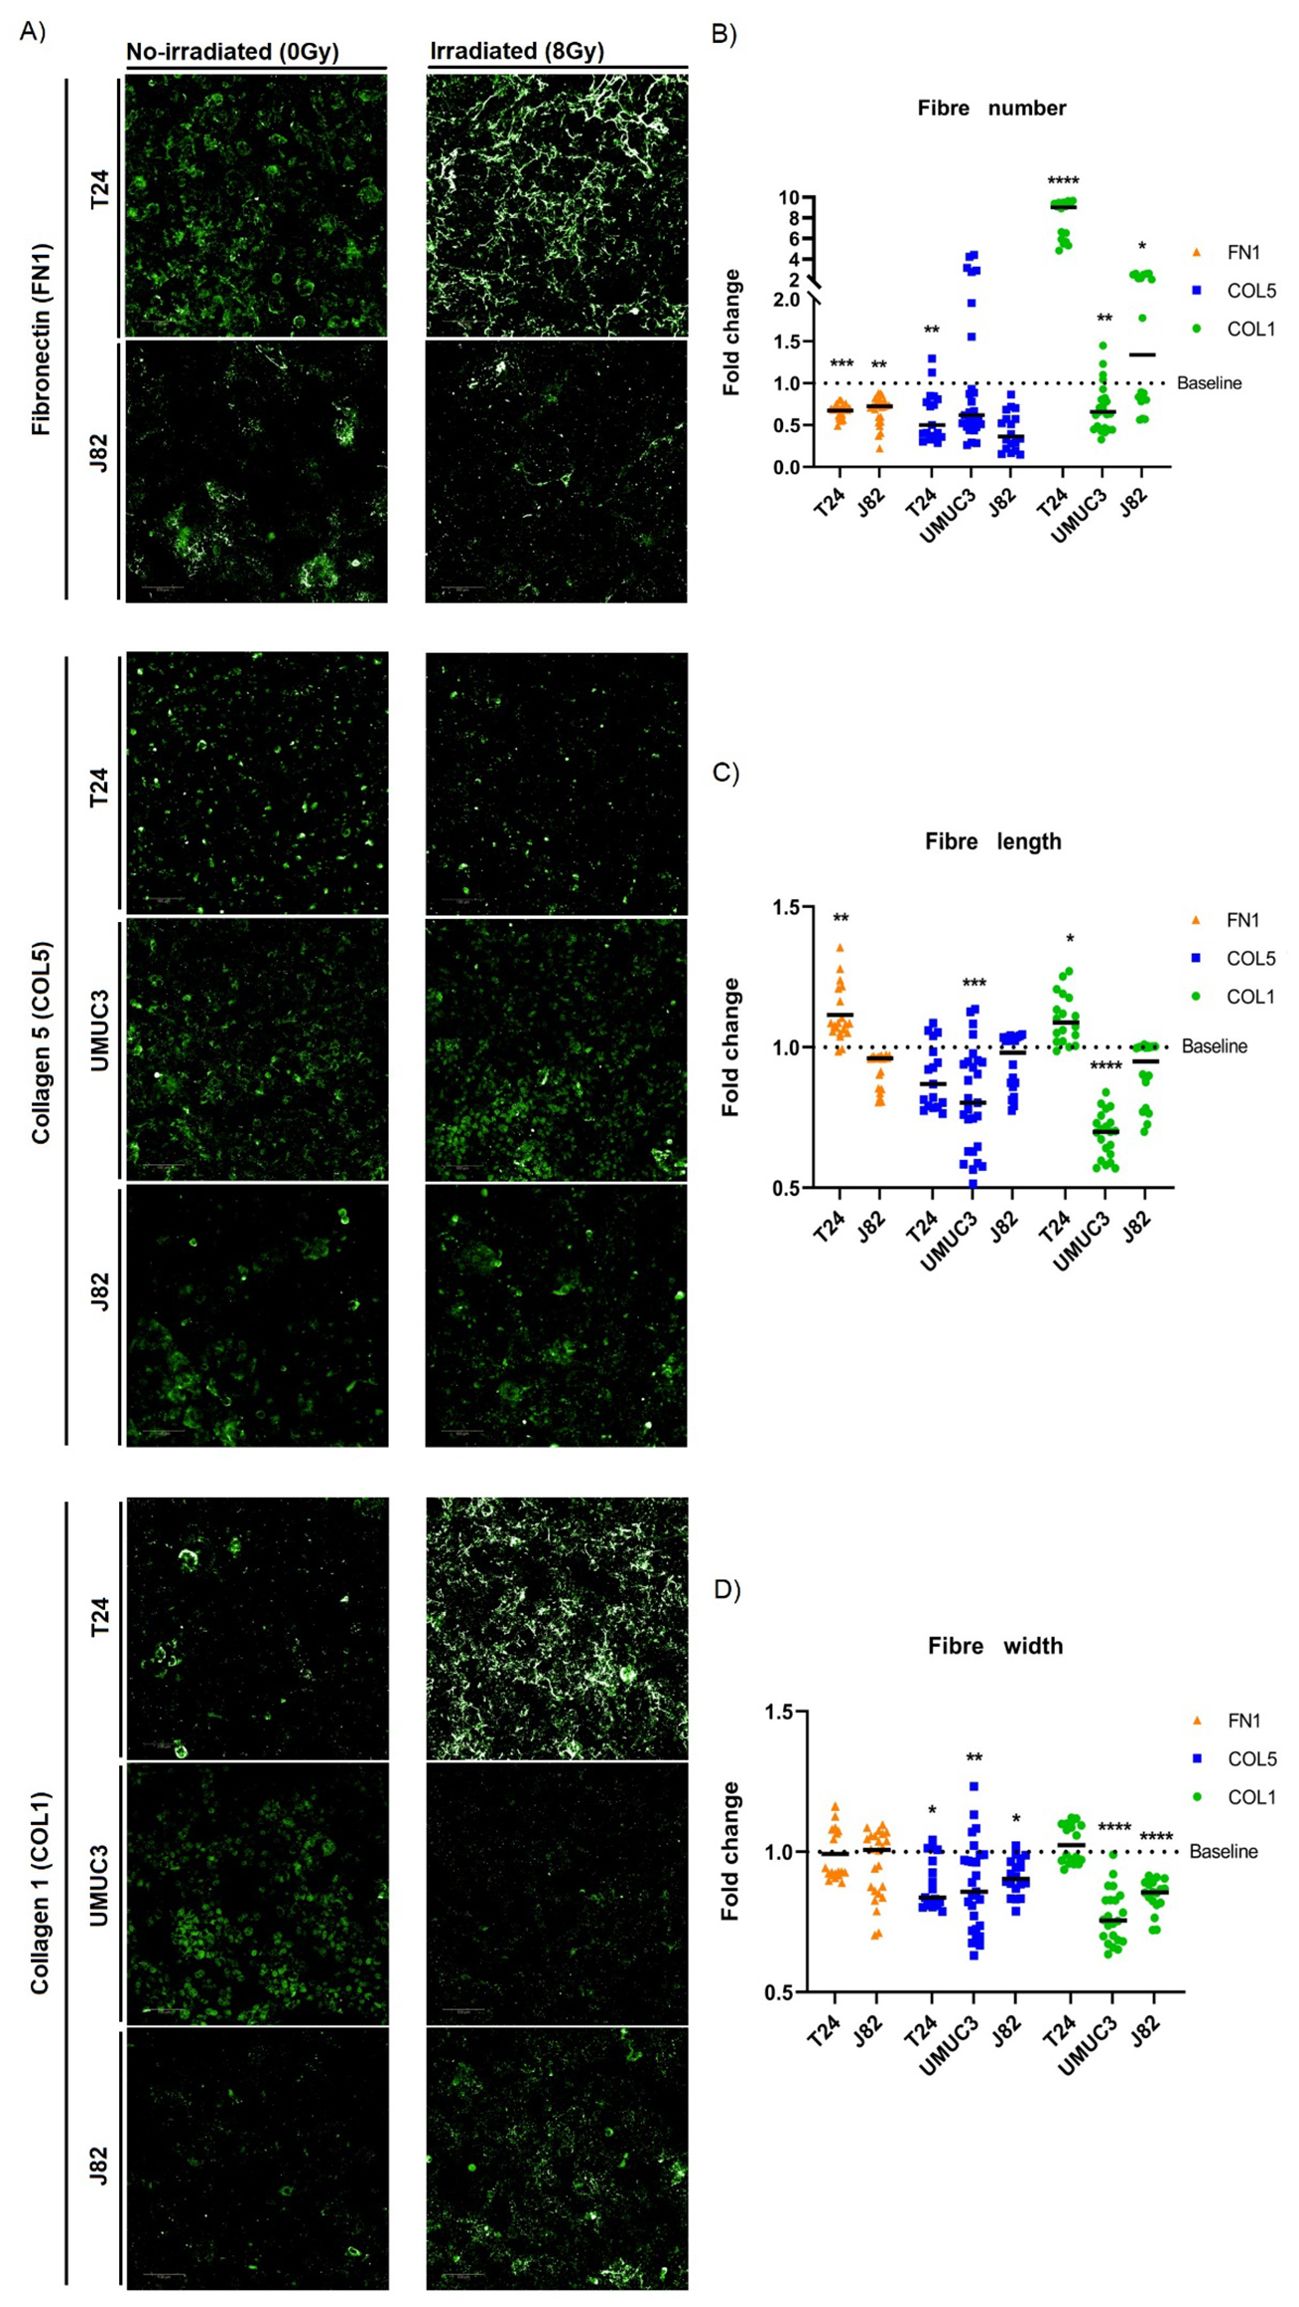
Figure 4. Single-dose radiation (8Gy) affects the morphology and number of ECM fibres. Immunofluorescence staining (A) of fibronectin (FN1), collagen 5 (COL5) and collagen 1 (COL1) fibres for T24, UMUC3 and J82 cell lines. Irradiation consistently decreased fibres numbers (B) for FN1 (T24, J82), COL5 (T24, J82) and COL1 (UMUC3), except for COL1 in T24 (significantly increased). Fibres length (C) alterations were cell-line dependent, with T24 showing a significant increase for FN1 and COL1, whilst UMUC3 had a significant decrease for COL5 and COL1. Fibres width (D) consistently had a significant decreased after irradiation for COL5 (T24, UMUC3, J82) and COL1 (UMUC3, J82) fibres. Significance is defined as p≤0.05, with * for p≤0.05, ** for p≤0.01, *** for p≤0.001 and **** for p≤0.0001. Fibres numbers were normalised to total cell number. A total of 3 biological repeats, each with a minimum of 6 technical repeats, were analysed per cell line.
3.5 FN1, COL5A2 and COL1A1 expression correlate in MIBC
As we observed a general reduction in FN1, COL5A2 and COL1A1 fibres after irradiation, we assessed whether their expression levels correlated in MIBC. Figure 5 shows that the expression of the three genes significantly correlated in all three cohorts (p<0.001). FN1 and COL1A1 expression showed the highest consistency in correlation strength, with r>0.8 in TCGA-BLCA (Figure 5C), r>0.5 in BC2001 (Figure 5F), and r>0.7 in BCON (Figure 5I). However, correlation strength variated across cohorts (Figures 5A–I). The range was highest in TCGA-BLCA (r=0.84-0.91), lower in BCON (r=0.62-0.74) and lowest in BC2001 (r=0.34-0.51). Overall, our data shows FN1, COL5A2 and COL1A1 expression correlates in MIBC, although the association may depend on the patient’s pathological characteristics.
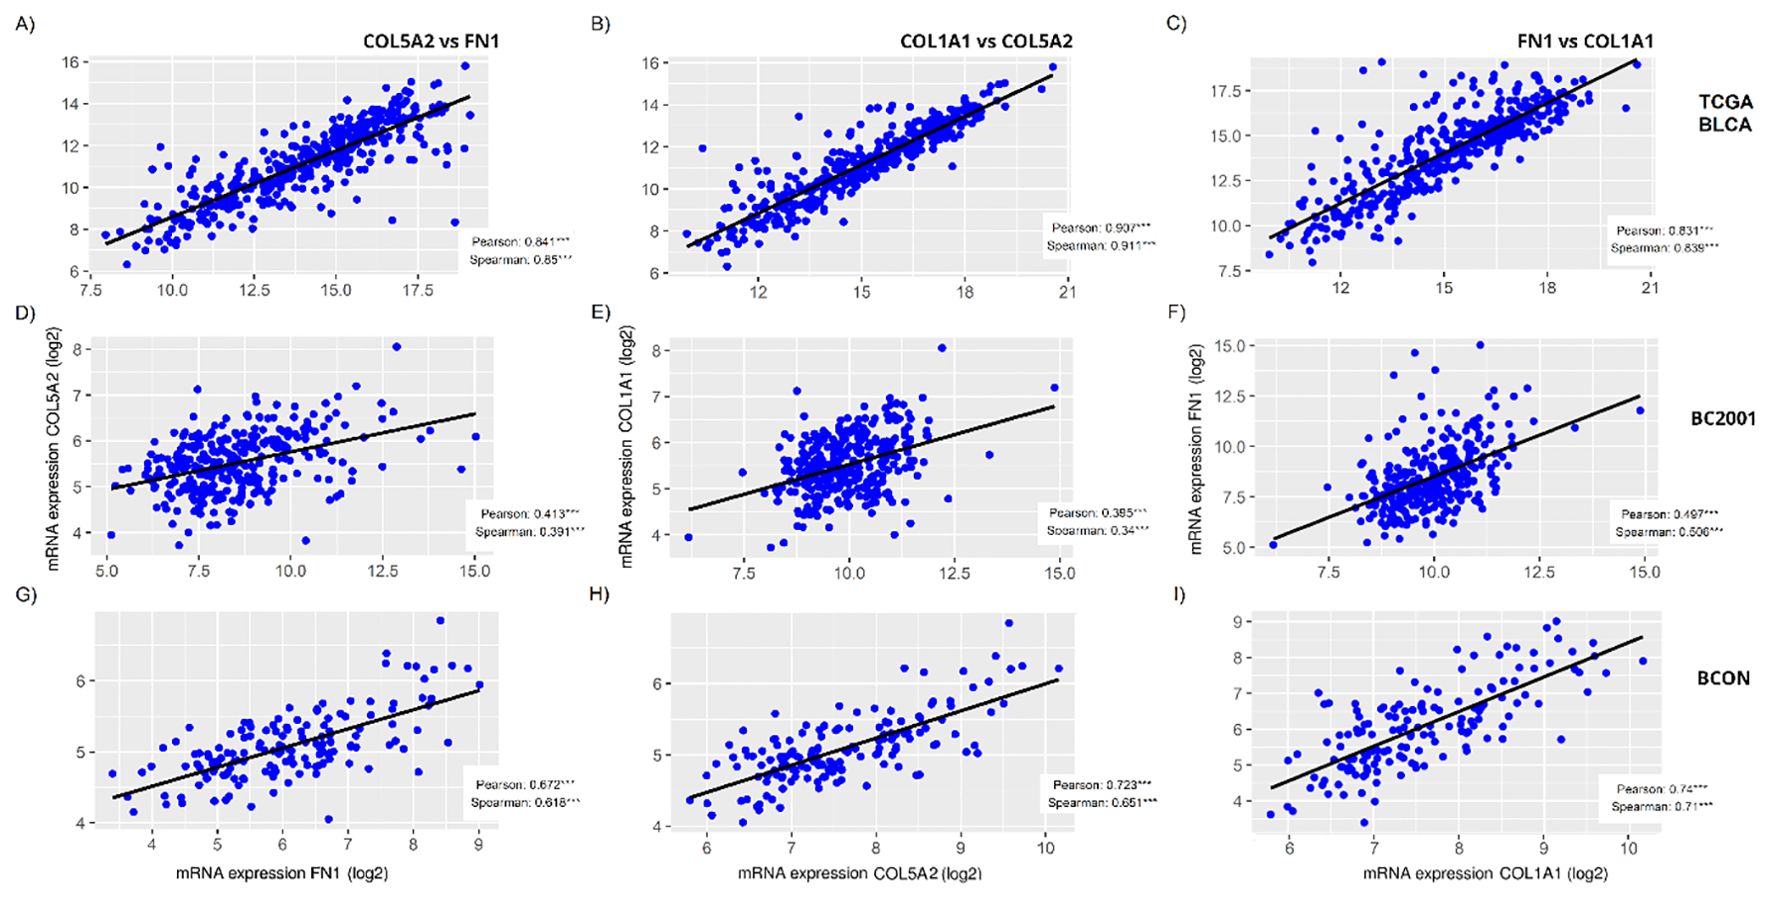
Figure 5. FN1, COL5A2 and COL1A1 expression correlates in muscle-invasive bladder cancer cohorts. The correlation among FN1, COL5A2 and COL1A1 mRNA expressions was measured for the TCGA-BLCA (A–C), BC2001 (D–F) and BCON (G–I) cohorts, showing significant a significant correlation in all cases. Both Pearson and Spearman correlation was measured. Significance is represented as * for p<0.05, ** for p<0.01 and *** for p<0.001.
3.6 ECM genes are independent prognostic and predictive markers of treatment response, significantly interacting with TP53 mutation status
Finally, as a proof-of-concept of the clinical relevance of the ECM proteins identified, we analysed the prognostic capacity of FN1, COL5A2, COL1A1, TNFAIP6 and FLG expression (Figures 6A–N). High FN1 expression was associated with a poor prognosis in both TCGA-BLCA (p<0.0001; Figure 6A) and BC2001 (p<0.05; Figure 6B). COL5A2 expression was only prognostic in TCGA-BLCA (p<0.001; Figure 6D). However, COL1A1 expression was prognostic in both TCGA-BLCA (p<0.05; Figure 6G) and BC2001 (p<0.05; Figure 6I) cohorts. No significance was found for TNFAIP6 and FLG expression when patients were stratified by cohort median values. However, univariate Cox hazard-risk analysis showed a linear relationship between TNFAIP6 and FLG expression with mortality risk (Supplementary Figure S2). After a tertile stratification into “High” (>67%), “Medium” (67–33%) and “Low” (<33%) expression groups, we identified patients with highly induced TNFAIP6 and FLG expression as a subgroup of patients with a potential increase in mortality risk (Supplementary Figure S2). “High” TNFAIP6 expression is a poor prognosis marker when compared to “low and medium” TNFAIP6 expression levels in the TCGA-BLCA (Figure 6J) and BC2001 (Figure 6K) cohorts. Similarly, “high” FLG expression was also significantly prognostic in the TCGA-BLCA (Figure 6M) cohort when compared to “low and medium” expression levels. No gene was prognostic in the BCON cohort. To address the potential impact of hypoxia-modifying treatment, we repeated the analyses after splitting the cohort into the two trial arms (Supplementary Figure S3). COL1A1 expression was prognostic in the non-CON treatment arm (Supplementary Figure S3E), suggesting that targeting hypoxia reduces the adverse prognostic effect of ECM genes.
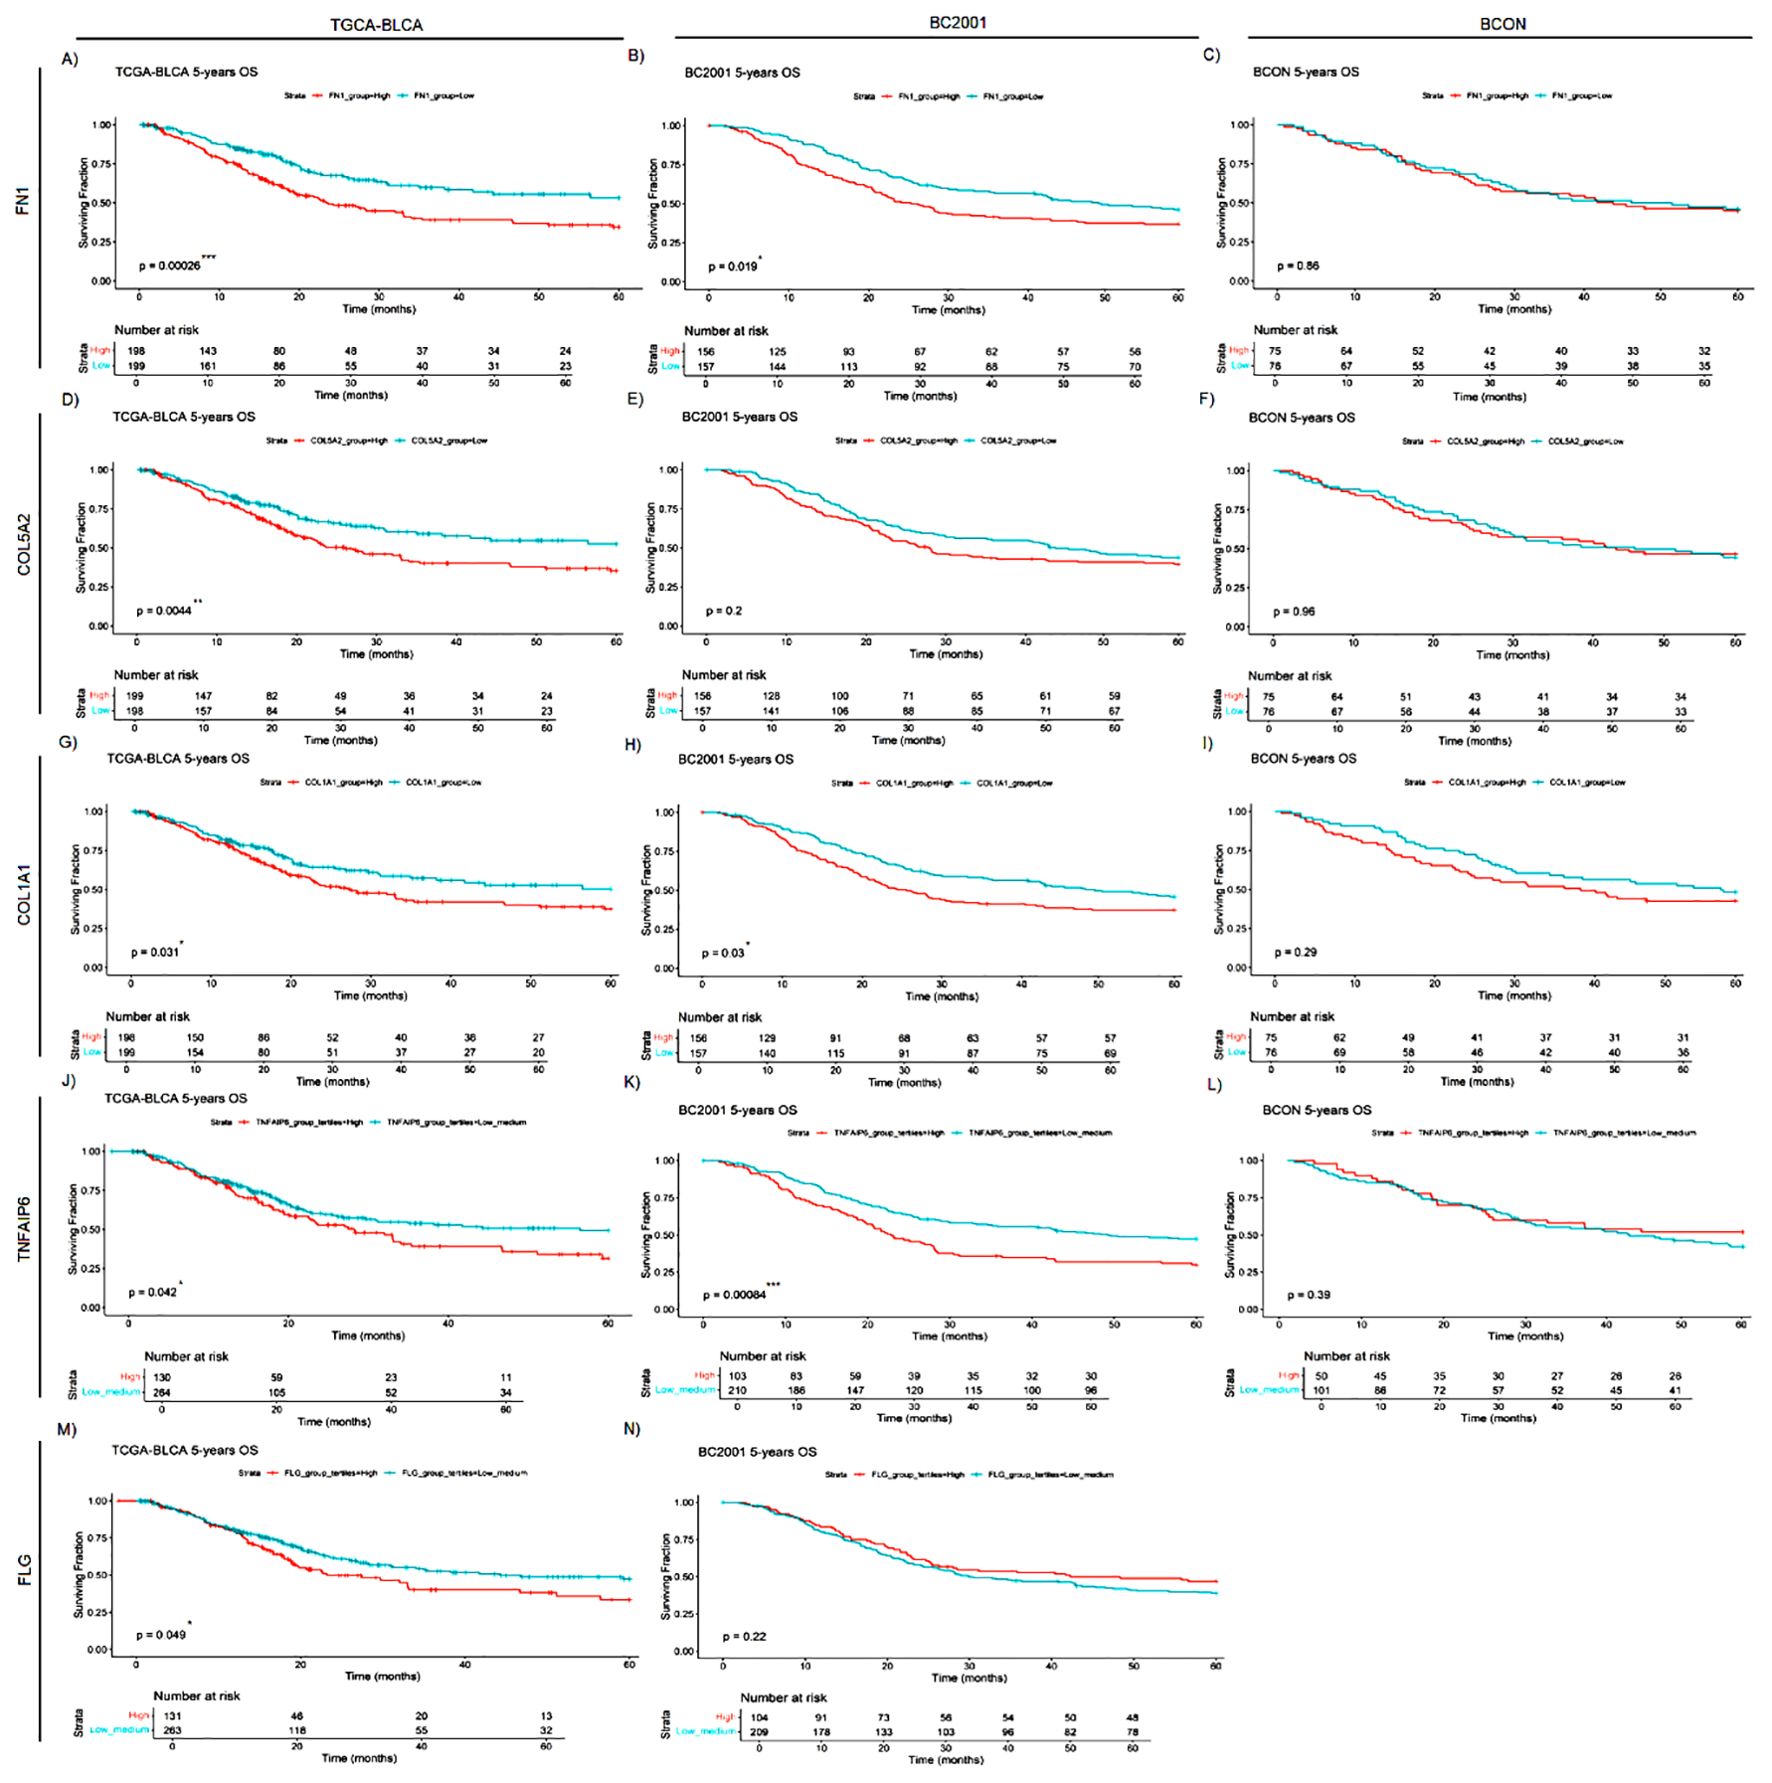
Figure 6. FN1, COL5A2, COL1A1, TNFAIP6 and FLG mRNA expression levels are general prognostic markers for muscle-invasive bladder cancer (MIBC). FN1 (A–C), COL5A2 (D–F), COL1A1 (G–I), TNFAIP6 (J–L) and FLG (M,N) expression was retrospectively validated in one cystectomy (TCGA-BLCA, n=397) and two radiotherapy (BCON [n=151]; BC2001 [n=313]) cohorts. FN1 expression had a significant prognosis in the TCGA-BLCA (A), and BC2001 (B) cohorts. COL5A2 expression was only significantly prognostic in the TCGA-BLCA (D) cohort. COL1A1 expression had a significant prognosis in both TCGA-BLCA (G) and BC2001 (H) cohorts. TNFAIP6 expression was significantly prognostic in the TCGA-BLCA (J) and BC2001 (K) cohorts. Finally, FLG expression was only prognostic in the TCGA-BLCA cohort. No FLG expression data was available for the BCON cohort. Patients were classified into “High” and “Low” based on each cohort’s median gene expression levels for FN1 (A–C), COL5A2 (D–F) and COL1A1 (G–I) analyses. Patients were classified into “High”, “Medium” or “Low” based on each cohort’s tertiles median gene expression for TNFAIP6 (J–L) and FLG (M, N) expression. Significance was defined as p ≤ 0.05, with * for p ≤ 0.05, ** for p ≤ 0.01, *** for p ≤ 0.001 and **** for p ≤ 0.0001.
We conducted a multivariable meta-analysis incorporating age, sex, stage and treatment (radiotherapy, chemotherapy, CON). High expression levels of COL1A1 (HR=1.29, 95% CI=1.06–1.56, p=0.012), FN1 (HR=1.39, 95% CI=1.14–1.69, p<0.001) and TNFAIP6 (HR=1.34, 95% CI=1.09–1.63, p=0.004) were independent adverse prognostic markers (Figures 7a–c). When all five genes were included in a meta-analysis, only FN1 (HR=1.40, CI=1.05-1.86, p=0.02; Supplementary File 1) retained independent prognostic value. An ECM signature including all five genes was also independently prognostic (HR=1.29, 95% CI=1.06–1.57, p=0.01; Figure 7d).
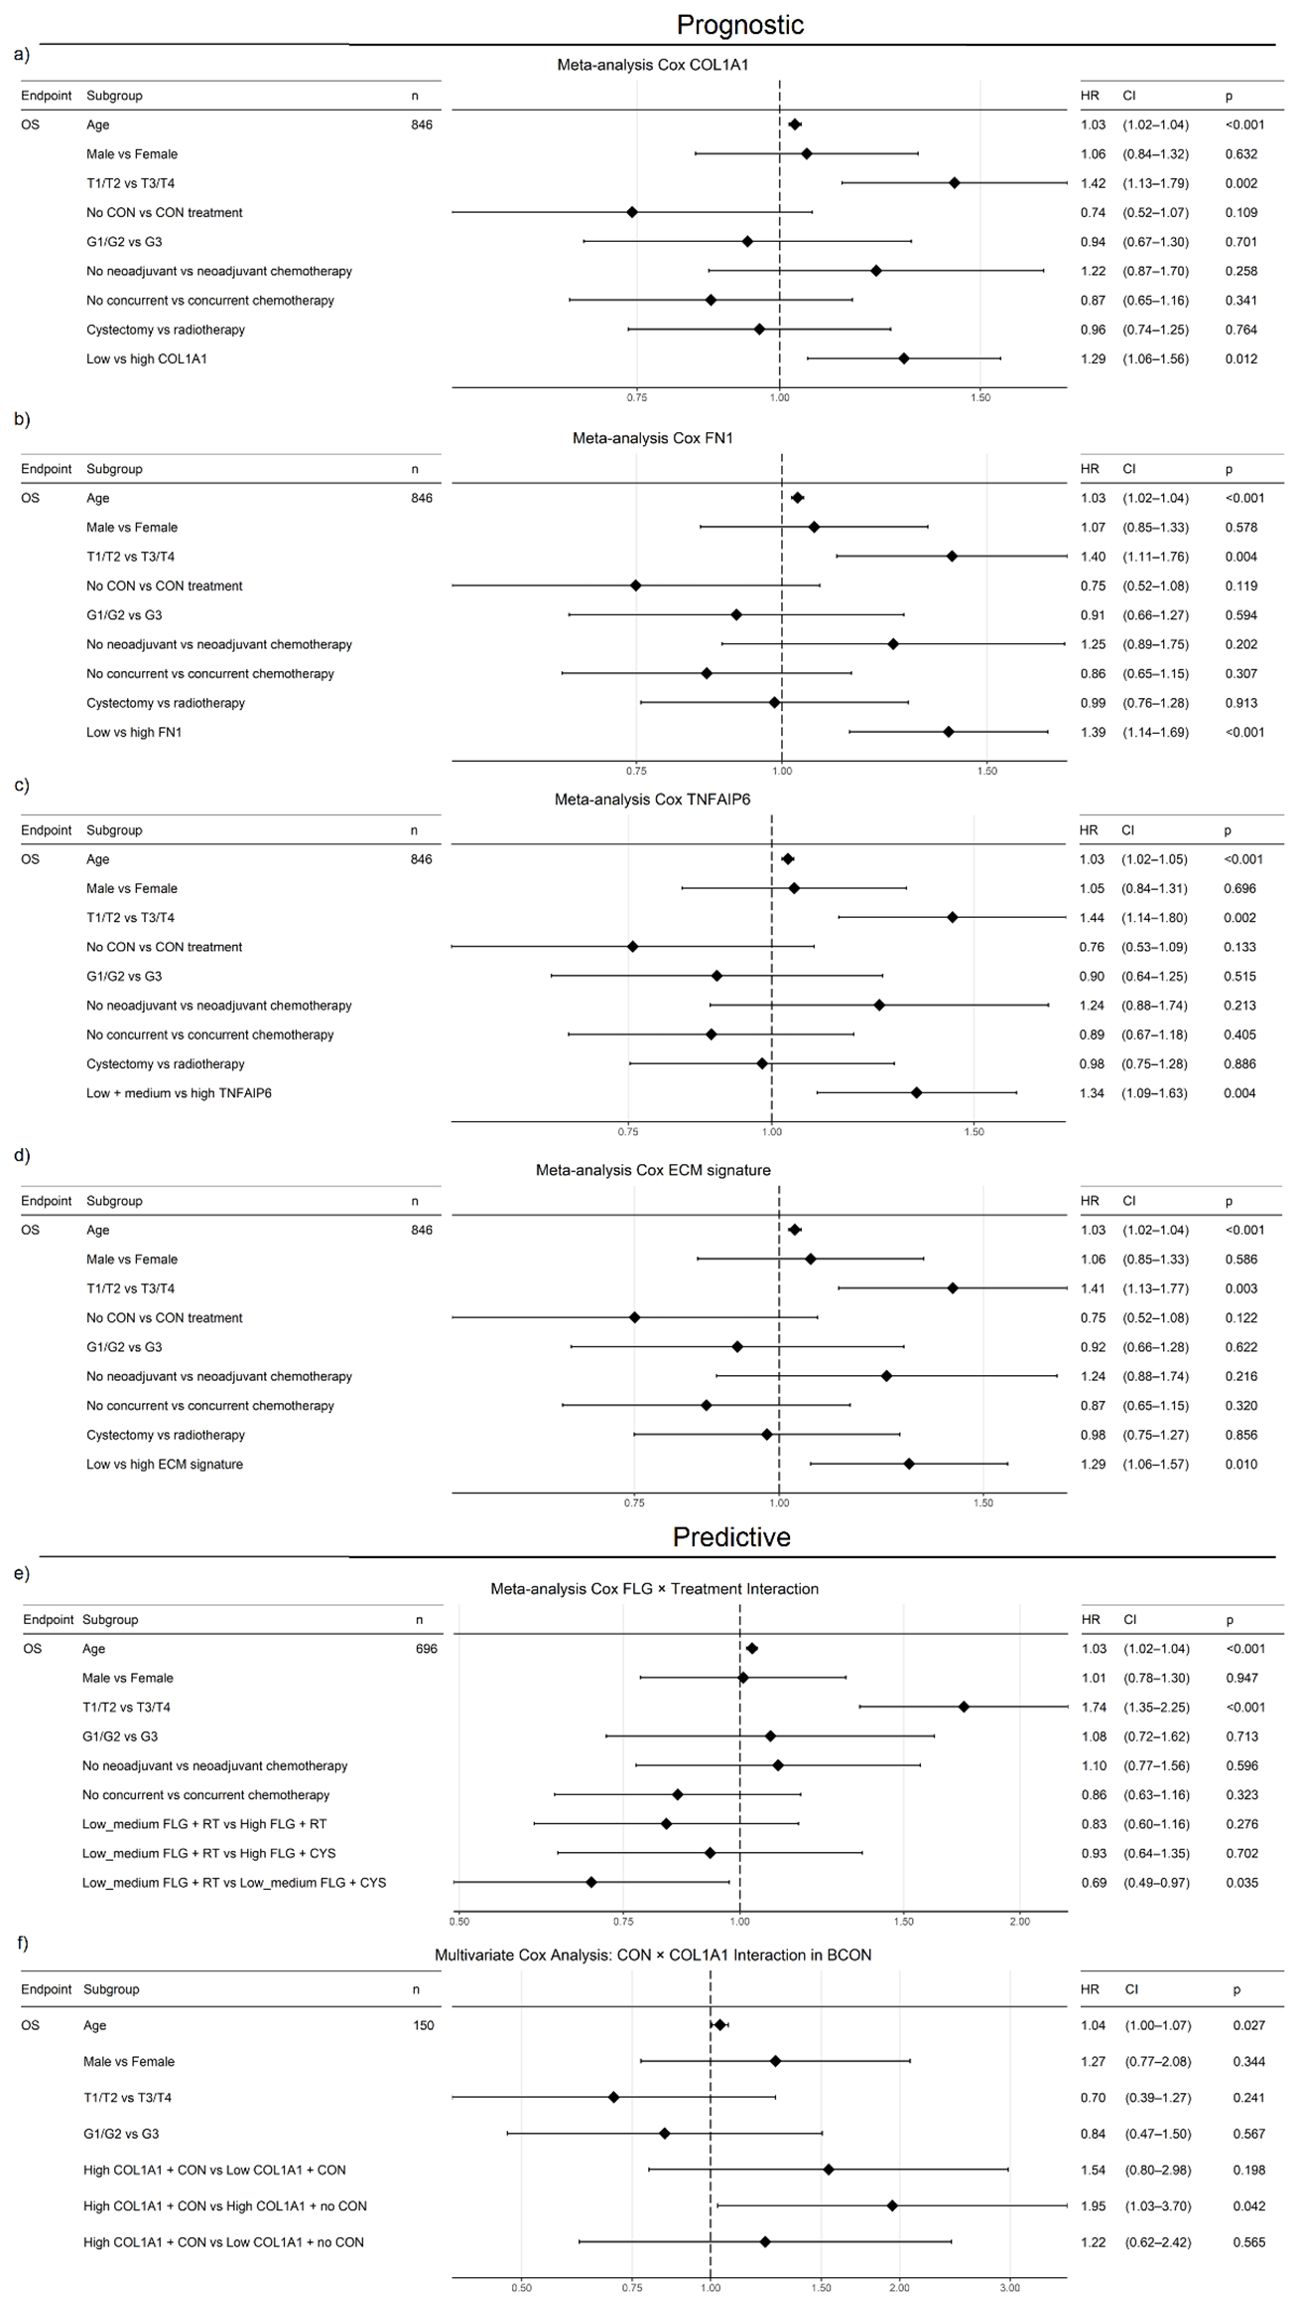
Figure 7. COL1A1, FN1, TNFAIP6 and an ECM signature (COL1A1, COL5A2, FN1, FLG, TNFAIP6) show independent prognostic value in a muscle-invasive bladder cancer (MIBC) meta-analysis (BCON, BC2001, TCGA-BLCA). High COL1A1 (HR=1.29, p=0.012; (a), FN1 (HR=1.39, p<0.001; (b), TNFAIP6 (HR=1.34, p=0.004; (c) and ECM signature scores (HR=1.29, p=0.12; (d) were associated with increased mortality, independent of treatment, stage, age, and sex. Furthermore, low-medium FLG expression predicted benefit from cystectomy over radiotherapy (HR=0.68, p=0.045; (e), while high COL1A1 expression predicted worse outcomes without CON treatment (HR=1.95, p=0.042; (f), independently of age, stage, and gender. FLG predictive capacity was also independent of chemotherapy. FLG data were unavailable for the BCON cohort. Advanced age and stage were consistently adverse prognostic factors. Patients were stratified either into “High” (≥50%) and “Low” (<50%) (COL1A1, FN1, ECM signature) or “High” (≥33%) and “low-medium” (<67%) groups. ECM scores were calculated as the median expression of signature genes, with the same dichotomisation. Significance: p ≤ 0.05 (*), p ≤ 0.01 (**).
To test the ECM genes’ association with radioresistance, we assessed their predictive value. Patients with “low–medium” FLG expression benefited from cystectomy over radiotherapy (HR=0.69, CI=0.49–0.97, p=0.035; Figure 7e). However, while patients with high COL1A1 (HR=1.33, CI=1.04–1.69, p=0.024) and TNFAIP6 (HR=1.39, CI=1.08–1.80, p=0.012) expression had poor outcomes following radiotherapy (Supplementary File 1), neither COL1A1 nor TNFAIP6 hold prognostic significance in the TCGA cystectomy cohort after a multivariate analysis including age, gender, stage, and grade (Supplementary File 1). When evaluating the genes in vitro, only FN1 showed a significant correlation (p=0.0256) with AUC radiosensitivity values in a panel of 535 cancer cell lines from the CCLE (Supplementary Figure S4).
We further investigated the interaction between COL1A1 expression and CON treatment in a multivariable analysis in the BCON cohort, finding COL1A1 expression predicted benefit from CON independently of age, sex, and stage. Patients with high COL1A1 expression had significantly worse outcomes when treated with radiotherapy alone (HR=1.95, CI=1.03–3.70, p=0.042; Figure 7f).
Finally, as a proof-of-concept for the influence of genomic background on ECM alterations, we assessed the association between TP53 mutation status and the candidate ECM genes/signature in the TCGA cohort. High expression of COL5A2 (HR=1.67, CI=1.01–2.76, p=0.044; Supplementary Figure S5a), FN1 (HR=2.15, CI=1.33–3.47, p=0.002; Supplementary Figure S5b), and elevated ECM signature scores (HR=1.83, CI=1.13–2.96, p=0.013; Supplementary Figure S5c) were independent adverse prognostic factors only in patients with tumours harbouring TP53-mutations.
Overall, our results show that the mRNA expression of the identified ECM genes has independent prognostic and predictive value.
4 Discussion
Here, we used a protein-fractionation approach to characterise the ECM produced by cancer cells. Our approach led to an enrichment of ECM-related proteins. Eleven per cent of the proteins identified (68 of 613) were ECM proteins, a proportion similar to other reports. For example, Naba et al. found 10-30% tissue-specific ECM proteins when characterising CDMs from lung and colon tissues (7). Similar proportions were identified in a review of other studies (30). Our analysis fits within the expected range and confirms the validity of the approach used.
We found high cell line variability in the ECM proteins affected by radiation, with only two significant in all cell lines (FLG, TNFAIP6). This variability can be associated with the distinctive genomic profile of each cell line. Mutations in ECM genes such as COL are common and directly influence the ECM structure (31). Furthermore, mutations in master oncogenic regulators like TP53 also regulate the ECM composition (31–33). Regarding the cell lines used in this study, no mutations in COL genes are reported for J82, whilst T24 (COL5, COL6, COL18) and UMUC3 (COL4, COL12, COL23, COL28) have distinct mutational profiles. Similarly, T24 cells have a non-sense mutation in TP53, while UMUC3 and J82 have miss-sense mutations. As TP53 regulates the ECM, and is not mutated in T24, it could explain its distinct ECM profile, sharing only 4% of its proteins with UMUC3 and J82, while UMUC3 and J82 shared up to 15%.
The high prevalence of TP53 mutations (50% of patients) (22) highlights its importance in bladder cancer. Indeed, when investigating this interaction, patients with TP53 mutations had a poorer prognosis associated with high FN1, COL5A2 expression and high ECM signature scores. TP53 mutation reduces SERPINB5, MMP1 and MMP2 secretion, directly modulating the structure of COL and FN1 fibres and promoting metastasis (34–36), providing context for the associations between TP53 mutation and COL5A2/FN1 expression. Due to TP53 signalling relevance, future studies should compare ECM differences in TP53 wild-type vs TP53 knock-outs in vitro and/or in vivo.
Our in vitro association of FN1 expression with radioresistance is not novel. FN1 have been suggested to promote radioresistance in head and neck (37), and it is known to increase cancer cell survival after radiation in clonogenic assays (38). FN1 radioresistance mechanisms can be link to enhancing the MAPK/Akt pathway through focal adhesions signalling, as previously reviewed (39). Regarding FLG and TNFAIP6, no previous association with radiotherapy has been reported. Bai et al. found that FLG expression regulates PI3K/AKT/mTOR-mediated drug-resistance mechanisms, with FLG expression correlating with drug sensitivity in head and neck cancer (40). The PI3K/AKT/mTOR pathway is well-known to induce both drug and radiotherapy resistance mechanisms (41). The PI3K/AKT/mTOR pathway is a well-known radioresistance driver as it modulates DNA repair pathways (42–44). Hence, FLG expression could promote radioresistance through PI3K/AKT/mTOR. Indeed, we found low and medium FLG expression associated with poor response to radiotherapy but with good outcomes following surgery. On the other hand, TNFAIP6 is a protein induced by TNF signalling (45). TNF signalling has already been reported to regulate radiosensitivity in several cancer cell lines (46). However, TNFAIP6 signalling has barely been explored. A recent pan-cancer meta-analysis showed TNFAIP6 signalling positively correlated with neutrophil infiltration, and was an adverse prognostic factor in multiple cancers (47). The positive association of TNFAIP6 with neutrophil infiltration suggests TNFAIP6 expression might be associated with a radiation-induced inflammatory response (48–50). Increased neutrophil infiltration and activity promote chemoradioresistance in bladder cancer (51–53). Hence, increased TNFAIP6 expression might promote radioresistance by enhancing neutrophil recruitment. Indeed, we found that high TNFAIP6 expression was an independent marker of a poor prognosis for MIBC undergoing radiotherapy. However, further validation through knock-out models and radiosensitivity assays is required to confirm the ability of FLG to induce radioresistance through PI3K/AKT/mTOR, whilst in vivo assays are needed to associate TNFAIP6-induced radioresistance with increased neutrophil infiltration and activity.
From a broader perspective, our analyses predicted radiation-induced changes in the ECM organisation, with results consistent with previous reports (12). Specifically, we found that more than one-third of the ECM proteins affected by radiation were structural. COLs, typically associated with fibrosis and desmoplasia (6), were minimally affected, accounting for only 6% of significant ECM proteins. Notably, the expression of glycoproteins (e.g., FN1) was highly impacted by radiation (19% of the significant ECM proteins). Politko et al. showed irradiation increases proteoglycans and glycoprotein expression in glioblastoma, supporting our findings (14). Furthermore, Tian et al. showed that cancer cells and fibroblasts produce distinct ECM profiles. While fibroblast ECMs contain 80-90% of COLs, cancer-cell ECMs have only 5-20% of COLs (54). Therefore, due to the limited capacity of cancer cells to produce COLs, proteoglycans likely have a more relevant role in any radiation-induced changes of ECM mechanical properties (e.g. stiffness). This concept is supported by our cell-line independent enrichment analysis, which predicted glycosaminoglycan synthesis, galactosyl and glucuronyl transferases as affected pathways. Post-translational modifications (e.g. glycosylation) are an important step of glycoprotein synthesis (55, 56), providing context for the radiation-induced changes in glycoprotein levels.
We found ECM regulators and growth factors (e.g. SERPINE1, FGF2, CXCL11) comprised two-thirds of the ECM significant proteins. From an immune perspective, the observed increase in expression of semaphorin (SEMA), S100A proteins, and cytokines (CXCL) suggests the activation of an inflammatory response (48–50), which is a well-described consequence of radiotherapy within the tumour microenvironment (57, 58). Regarding the ECM organisation, ECM fibre crosslinking and organisation are critical regulators of ECM mechanical properties (6). Here, we found increased expression of proteases from the ADAMs family and protease regulators from the SERPINs family in MIBC cells surviving fractionated irradiation. There is also previous evidence associating ADAMs and SERPINs with radiotherapy resistance. SERPIN overexpression induces radioresistance in lung cancer (59), and is a poor prognostic marker in bladder cancer (60), whilst ADAMs are upregulated after radiotherapy (61).
Both ADAM and SERPIN families regulate proteolysis of structural ECM proteins (e.g. COL, FN1) (62, 63), suggesting alterations in the ECM fibres’ number and morphology. Indeed, our immunofluorescence analyses showed a general decrease in ECM fibre (FN1, COL5, COL1) numbers, width and length. These results contradict the current knowledge of radiation being an inducer of fibrosis (12), as ECM fibre crosslinking is required for fibrosis (6). However, other reports showed similar contradictions. Strelstova et al. showed radiotherapy disorganised COL fibres in healthy bladder tissue (13), whilst increased COL fibres organisation is a key inducer of ECM stiffness and fibrosis (6, 64). It is therefore possible that radiotherapy may not always induce fibrosis, which may depend on additional variables (e.g. genomic background). For example, here we observed a 10-fold increase in COL1 fibre number in T24, which supports the suggestion that radiation induces fibrosis.
As discussed previously, T24 have a unique mutagenic profile, including a TP53 non-sense mutation. It is possible that specific genomic mutations may be required for cancer cells to induce COL1-mediated fibrosis. TP53 mutations reduce the secretion of COL1-degrading enzymes, promoting COL1-mediated fibrosis (34). Radiation-induced fibrosis has been mainly associated with fibroblasts and myofibroblasts (13), which produce rich COL-containing ECMs (54). Very dense ECM can act as physical barriers, limiting cell migration and metastasis (65). Compared to stromal cells, cancer cells express more ECM-associated proteins and remodelling enzymes (54). Cancer cells also acquire EMT-like traits post-irradiation (66), requiring ECM gaps and pores to prevent cell jamming (67, 68). Consequently, the increased secretion of ECM remodelling enzymes and reduced ECM fibres observed here may represent a compensatory mechanism to maintain ECM porosity and support migration. Both concepts are relevant, as radiotherapy would induce different tumour microenvironments depending on the genomic background of the cancer cells and the proportion of fibroblasts and cancer cells. However, these hypotheses require testing. Future radiogenomics studies should link specific genomic mutations with ECM alterations. How fibroblast-derived ECM changes post-irradiation, ideally in co-culture models, should also be explored. However, the use of cancer-associated fibroblasts is limited as they are mainly primary senescent cell lines, complicating longer-term radiobiology studies such as the one conducted here.
We also found a significant correlation between the expression of FN1, COL5A2 and COL1A1 in clinical cohorts, suggesting all three genes behave similarly. Indeed, the expression of all three genes is commonly associated with ECM remodelling and fibrosis (6). Furthermore, high expression of structural ECM genes may be associated with desmoplasia and ECM remodelling, an adverse prognosis factor in several cancer types (8, 69, 70). Similarly, we found high FN1, COL5A2, and COL1A1 expression associated with a poor prognosis in MIBC. TNFAIP6 and FLG were also prognostic. The association with a poor prognosis was seen in both the cystectomy (TCGA-BLCA) and radiotherapy (BC2001) cohorts, suggesting that high expression of ECM genes associates with a poor prognosis in MIBC irrespective of treatment modality. Our findings agree with those from others, as high COL10A1 expression was previously associated with a poor prognosis in five bladder cancer cohorts (54). Furthermore, Chen et al. found patients with mutant FLG and a sub-group with wild-type FLG have a poor prognosis (71). These reports support our results, which suggested a subgroup of patients with high FLG expression conferred a poor prognosis. Similarly, TNFAIP6 expression has been reported as an independent adverse prognosis marker in the GSE32894 bladder cancer cohort (72). Similar results were found in gastric cancer (73). In multivariable meta-analyses, COL1A1, FN1, TNFAIP6, and an ECM signature including all candidate ECM genes retained independent prognostic significance. However, when all candidates were included in a single multivariable meta-analysis, only FN1 retained significance. The fact that COL1A1 and COL5A2 were not independent prognostic markers is likely due to their high correlation with FN1, suggesting they provide no additional information.
Interestingly, COL1A1 was prognostic only in BCON patients treated with radiotherapy alone, with high COL1A1 expression predicting benefit from hypoxia-modifying CON. Hypoxia induces ECM remodelling, leading to radioresistance (64). Several reports have shown that hypoxia promotes COL1A1 expression levels (64, 74). We recently validated these findings in bladder cancer, showing lower COL1A1 protein and RNA levels in normoxia (21%O2) than in hypoxia (0.2% O2). We also highlighted that hypoxia-induced ECM remodelling synergises with radiotherapy, a mechanism likely prevalent across cancer types (75). These interactions may explain COL1A1’s predictive value, as CON re-oxygenation might impair hypoxia-driven ECM mechanisms, decreasing COL1A1 expression. Indeed, within the same study, we derived a hypoxic-ECM-associated signature, which was an independent adverse prognostic marker across five different cancer types, including bladder (75). However, these mechanisms remain poorly understood, with several reports showing that hypoxia decreases COL1A1 fibres numbers in breast (76, 77), prostate (77), vulval (78), head & neck (78), and bladder (75) cancers, despite an observed COL1A1 increase in RNA/protein levels. There is little literature evidence describing how targeting hypoxia-driven ECM remodelling processes might improve patient prognosis, a concept that should be further investigated.
Our study has several limitations. Fractionated irradiation was only applied to cancer cells, as long-term exposure in primary bladder cancer-associated fibroblasts is technically challenging. Although less representative of the cancer environment, future work could explore similar approaches in immortalised fibroblast lines. Another limitation was that we studied neither protein expression nor fibre numbers in the clinical cohorts and only had access to data derived from diagnostic biopsies. Nonetheless, our findings highlight the value of studying cancer cell-derived ECM post-irradiation, identifying candidate prognostic and predictive markers for radiotherapy and CON treatment.
The prognostic capacity of the genes reported here may be due to a general fibrotic process, which is well-associated with tumour progression (33). Our in vitro data suggest radiation can decrease ECM fibre number, hence impairing the fibrotic process (6). To address these apparent contradictions and clinically validate radiotherapy-induced ECM changes, we would need to access tumour samples taken during radiotherapy, which would be difficult. However, investigating ECM alterations in fibroblasts after fractionated irradiation is feasible and should be attempted in future studies, as it would provide context to clarify how fibrosis is induced by irradiation. Future studies should also evaluate the prognostic capacity of COL and FN1 fibres and expression levels in radiotherapy recurrence samples, to confirm the prognostic effect seen here is due to changes in the ECM structure. Those analyses will also be necessary to clinically confirm our in vitro mechanistic observations, in which radiation generally decreased ECM fibre numbers and size in tumour cells. Finally, decreased protein FLG expression levels in radiotherapy recurrence samples should be confirmed as proof-of-concept of FLG relevance in radioresistance.
5 Conclusion
We characterised for the first time the ECM produced by MIBC cells surviving fractionated irradiation. Our data showed radiation mostly impacts the levels of non-structural ECM proteins (e.g. cytokines, proteases). At the structural level, glycoprotein levels were the most affected. We also showed radiation can disorganise the ECM structure, destroying and shortening ECM fibres. We found heterogeneity between cell lines, likely affected by different genomic backgrounds, and future research should explore whether COL fibrogenesis after irradiation depends on specific genomic mutations. We also showed that the ECM proteins identified as affected by irradiation were prognostic and predictive of radiotherapy benefit when assessed at the RNA level in untreated diagnostic biopsies of MIBC. Future mechanistic analyses are needed to clarify the role of FLG in radioresistance and to better understand its clinical relevance. Future research should also explore changes in samples taken from tumours that recurred following radiotherapy to identify whether it might identify more radiation-specific effects. Last, we found that hypoxia-modifying treatment abrogated the prognostic capacity of the ECM genes studied, suggesting further research should study the effect of CON on radiation-induced changes in the ECM produced by cancer cells.
Data availability statement
Newly generated in vitro mass spectrometry data, including raw data and final data (protein identification, normalised protein counts, fold changes, p-values and adj. p-values) are publicly available at the ProteomeXchange repository under the accession number PXD066069.
Ethics statement
Ethical approval was not required for the studies on humans in accordance with the local legislation and institutional requirements because only commercially available established cell lines were used. Ethical approval was not required for the studies on animals in accordance with the local legislation and institutional requirements because only commercially available established cell lines were used.
Author contributions
CG: Methodology, Data curation, Investigation, Conceptualization, Writing – review & editing, Resources, Writing – original draft, Formal analysis. SF: Investigation, Writing – original draft, Writing – review & editing. MB: Writing – original draft, Investigation, Writing – review & editing. JA: Writing – original draft, Investigation, Writing – review & editing. EP: Investigation, Writing – original draft, Writing – review & editing. TL: Writing – review & editing, Data curation, Methodology, Formal analysis, Investigation. RR: Project administration, Writing – original draft, Supervision, Investigation, Writing – review & editing. KR: Resources, Project administration, Funding acquisition, Writing – review & editing. AB: Investigation, Formal Analysis, Writing – review & editing. PH: Writing – review & editing, Supervision, Resources. NJ: Writing – review & editing, Resources. EH: Writing – review & editing, Resources. RH: Writing – review & editing, Resources. NP: Writing – review & editing, Resources. CW: Supervision, Writing – review & editing, Conceptualization. LB: Conceptualization, Writing – review & editing, Supervision, Formal Analysis. AC: Conceptualization, Supervision, Writing – review & editing, Funding acquisition.
Funding
The author(s) declare that financial support was received for the research and/or publication of this article. The work was funded by the NIHR Manchester Biomedical Research Centre (NIHR129943). The work was also supported by Cancer Research UK Major Centre (C147/A25254) and project grant (C1098/A9437; C2094/A11365; C13329/A21671) funding. The mass spectrometers used in this study were purchased with grants from BBSRC, Wellcome Trust and the University of Manchester Strategic Fund.
Acknowledgments
The work was funded by the NIHR Manchester Biomedical Research Centre (NIHR129943). The work was also supported by Cancer Research UK Major Centre (C147/A25254) and project grant (C1098/A9437; C2094/A11365; C13329/A21671) funding. The support of D. Knight, E. Keevill and J.N. Selley at the Bio-MS mass spectrometry core facility (RRID: SCR_020987) in the Faculty of Biology, Medicine and Health at the University of Manchester is gratefully acknowledged. The mass spectrometers used in this study were purchased with grants from BBSRC, Wellcome Trust and the University of Manchester Strategic Fund. Work was carried out at The University of Manchester, Cancer Research UK – Manchester Institute, and the Manchester Cancer Research Centre, which provided infrastructure support and access to core facilities for the experiments performed in this study.
Conflict of interest
The authors declare that the research was conducted in the absence of any commercial or financial relationships that could be construed as a potential conflict of interest.
Generative AI statement
The author(s) declare that no Generative AI was used in the creation of this manuscript.
Publisher’s note
All claims expressed in this article are solely those of the authors and do not necessarily represent those of their affiliated organizations, or those of the publisher, the editors and the reviewers. Any product that may be evaluated in this article, or claim that may be made by its manufacturer, is not guaranteed or endorsed by the publisher.
Supplementary material
The Supplementary Material for this article can be found online at: https://www.frontiersin.org/articles/10.3389/fonc.2025.1616943/full#supplementary-material.
Supplementary Figure 1 | Fractionated radiotherapy partially mimicking SOC (27.5Gy, 2.75Gy daily over 2 weeks) consistently alters cytokines, glycosaminoglycan binding molecules, growth factors, peptidases and peptidase-regulators expression across all cell lines. Comparative molecular function pathway enrichment analysis (A) of significantly up (fold change >2, p.adj. <0.05) and downregulated (fold change <-2, p.adj. <0.05) ECM proteins for each individual cell line (T24, UMUC3, J82). Cnetplots show specific associations among significantly up and downregulated proteins and their corresponding enrichment terms for T24 (B), UMUC3 (C) and J82 (C). Ratio (A) represents the % of total proteins associated with each term (0–1 scale). A total of n=3 biological repeats were analysed per cell line.
Supplementary Figure 2 | High TNFAIP6 and FLG mRNA expression levels are associated with a linear increase in mortality risk in muscle-invasive bladder cancer (MIBC). TNFAIP6 (A–C) and FLG (D, M) expression was retrospectively validated in one cystectomy (TCGA-BLCA, n=397) and two radiotherapy (BCON [n=151]; BC2001 [n=313]) cohorts. Cut-off for patients with “High” (>67%), “Medium” (33 – 67%) or “Low” (<33%) hazard risk is based on each cohort’s tertiles median gene expression for TNFAIP6 (J–L) and FLG (M, N) expression. No FLG expression data was available for the BCON cohort.
Supplementary Figure 3 | COL1A1 mRNA expression level is a general prognostic marker for in muscle-invasive bladder cancer (MIBC) patients without carbogen and nicotinamide (CON) hypoxia-modifying treatment. FN1 (A, B), COL5A2 (C, D), COL1A1 (E, F) and TNFAIP6 (G, H) expression was retrospectively validated in the BCON cohort (n=151) after a split into the two CON treatment arms (n=75 not CON treatment; n=76 CON treatment). COL1A1 expression had significant prognostic value in patients without CON treatment (radiotherapy only) (E). No other gene had significant prognostic value, in either of the CON treatment arms of the BCON cohort. Patients were classified into “High” and “Low” based on each cohort’s median gene expression levels for FN1 (A, B), COL5A2 (C, D) and COL1A1 (E, F) analyses. Patients were classified into “High”, “Medium” or “Low” based on each cohort’s tertiles median gene expression for TNFAIP6 (G, H) expression. Significance was defined as p ≤ 0.05, with * for p ≤ 0.05, ** for p ≤ 0.01, *** for p ≤ 0.001 and **** for p ≤ 0.0001.
Supplementary Figure 4 | FN1 expression significantly correlates with radiosensitivity [integral survival (AUC)] across a panel of 535 cancer cell lines. Pearson correlation was measured between AUC radiosensitivity values and (a) COL1A1 (b) COL5A2, (c) FLG, (d) FN1, (e) TNFAIP6 and (f) an extracellular matrix (ECM) signature calculated as the median expression of all aforementioned genes. Only FN1 expression values significantly correlated (p=0.0256) with AUC radiosensitivity values.
Supplementary Figure 5 | TP53 mutations significantly interact with high COL5A2, FN1 expression or high ECM signature (COL1A1, COL5A2, FN1, FLG, TNFAIP6) scores, leading to poorer muscle-invasive bladder cancer (MIBC) patients prognoses. MIBC patients with TP53 mutation and high COL5A2 (HR=1.67, p=0.044; (a), high FN1 (HR=2.15, p=0.002; (b), or high ECM scores (HR=1.83, p=0.013; (c) have increased mortality risk independently of age, sex and stage, suggesting a relationship between TP53 status and extracellular matrix proteins expression. Analyses were conducted in a cystectomy cohort (TCGA-BLCA). Advanced age and stage were consistently adverse prognostic factors. Patients were stratified into “High” (≥50%) and “Low” (<50%) expression groups per gene. ECM scores were calculated as the median expression of signature genes, with the same dichotomisation. Significance: p ≤ 0.05 (*), p ≤ 0.01 (**), p ≤ 0.001 (***).
References
1. Halaseh SA, Halaseh S, Alali Y, Ashour ME, and Alharayzah MJ. A review of the etiology and epidemiology of bladder cancer: all you need to know. Cureus. (2022) 14(7):e27330. doi: 10.7759/CUREUS.27330
2. Catto JWF, Mandrik O, Quayle LA, Hussain SA, McGrath J, Cresswell J, et al. Diagnosis, treatment and survival from bladder, upper urinary tract, and urethral cancers: real-world findings from NHS England between 2013 and 2019. BJU Int. (2023) 131:734–44. doi: 10.1111/BJU.15970
3. Kimura T, Ishikawa H, Kojima T, Kandori S, Kawahara T, Sekino Y, et al. Bladder preservation therapy for muscle invasive bladder cancer: the past, present and future. Japanese J Clin Oncol. (2020) 50:1097–107. doi: 10.1093/JJCO/HYAA155
4. Kotwal S, Choudhury A, Johnston C, Paul AB, Whelan P, and Kiltie AE. Similar treatment outcomes for radical cystectomy and radical radiotherapy in invasive bladder cancer treated at a United Kingdom specialist treatment center. Int J Radiat Oncology Biology Phys. (2008) 70:456–63. doi: 10.1016/J.IJROBP.2007.06.030
5. Wu Y, Song Y, Wang R, and Wang T. Molecular mechanisms of tumor resistance to radiotherapy. Mol Cancer. (2023) 22(1):96. doi: 10.1186/S12943-023-01801-2
6. Winkler J, Abisoye-Ogunniyan A, Metcalf KJ, and Werb Z. Concepts of extracellular matrix remodelling in tumour progression and metastasis. Nat Commun. (2020) 11:1–19. doi: 10.1038/s41467-020-18794-x
7. Naba A, Clauser KR, Hoersch S, Liu H, Carr SA, and Hynes RO. The matrisome: in silico definition and in vivo characterization by proteomics of normal and tumor extracellular matrices. Mol Cell Proteomics: MCP. (2012) 11(4):M111.014647. doi: 10.1074/MCP.M111.014647
8. Piersma B, Hayward MK, and Weaver VM. Fibrosis and cancer: A strained relationship. Biochim Biophys Acta (BBA) - Rev Cancer. (2020) 1873:188356. doi: 10.1016/J.BBCAN.2020.188356
9. Cordes N, Blaese MA, Meineke V, and Van Beuningen D. Ionizing radiation induces up-regulation of functional beta1-integrin in human lung tumour cell lines in vitro. Int J Radiat Biol. (2002) 78:347–57. doi: 10.1080/09553000110117340
10. Handschel J, Prott FJ, Sunderkötter C, Metze D, Meyer U, and Joos U. Irradiation induces increase of adhesion molecules and accumulation of beta2-integrin-expressing cells in humans. Int J Radiat Oncology Biology Phys. (1999) 45:475–81. doi: 10.1016/S0360-3016(99)00202-3
11. Jin B, Kong W, Zhao X, Chen S, Sun Q, Feng J, et al. Substrate stiffness affects the morphology, proliferation, and radiosensitivity of cervical squamous carcinoma cells. Tissue Cell. (2022) 74:101681. doi: 10.1016/J.TICE.2021.101681
12. Yu Z, Xu C, Song B, Zhang S, Chen C, Li C, et al. Tissue fibrosis induced by radiotherapy: current understanding of the molecular mechanisms, diagnosis and therapeutic advances. J Trans Med. (2023) 21(1):708. doi: 10.1186/S12967-023-04554-0
13. Streltsova O, Kiseleva E, Dudenkova V, Sergeeva E, Tararova E, Kochueva M, et al. Late changes in the extracellular matrix of the bladder after radiation therapy for pelvic tumors. Diagnostics (Basel Switzerland). (2021) 11(9):1615. doi: 10.3390/DIAGNOSTICS11091615
14. Politko MO, Tsidulko AY, Pashkovskaya OA, Kuper KE, Suhovskih AV, Kazanskaya GM, et al. Multiple irradiation affects cellular and extracellular components of the mouse brain tissue and adhesion and proliferation of glioblastoma cells in experimental system in vivo. Int J Mol Sci. (2021) 22(24):13350. doi: 10.3390/IJMS222413350
15. Deng Y, Chen G, Xiao J, and Deng H. Role and potential therapeutic strategies of matrix mechanics for optimizing tumor radiotherapy. Mechanobiology Med. (2024) 2:100037. doi: 10.1016/J.MBM.2023.100037
16. Choudhury A, Porta N, Hall E, Song YP, Owen R, MacKay R, et al. Hypofractionated radiotherapy in locally advanced bladder cancer: an individual patient data meta-analysis of the BC2001 and BCON trials. Lancet Oncol. (2021) 22:246–55. doi: 10.1016/S1470-2045(20)30607-0
17. Humphries JD, Zha J, Burns J, Askari JA, Below CR, Chastney MR, et al. Pancreatic ductal adenocarcinoma cells employ integrin α6β4 to form hemidesmosomes and regulate cell proliferation. Matrix Biol. (2022) 110:16–39. doi: 10.1016/J.MATBIO.2022.03.010
18. Jones MC, Humphries JD, Byron A, Millon-Frémillon A, Robertson J, Paul NR, et al. Isolation of integrin-based adhesion complexes. Curr Protoc Cell Biol. (2015) 66: 9.8.1–9.8.15. doi: 10.1002/0471143030.cb0908s66
19. Robertson J, Humphries JD, Paul NR, Warwood S, Knight D, Byron A, et al. Characterization of the phospho-adhesome by mass spectrometry-based proteomics. Methods Mol Biol (Clifton N.J.). (2017) 1636:235–51. doi: 10.1007/978-1-4939-7154-1_15
20. Robertson J, Jacquemet G, Byron A, Jones MC, Warwood S, Selley JN, et al. Defining the phospho-adhesome through the phosphoproteomic analysis of integrin signalling. Nat Commun. (2015) 6:1–13. doi: 10.1038/ncomms7265
21. Byron A, Askari JA, Humphries JD, Jacquemet G, Koper EJ, Warwood S, et al. A proteomic approach reveals integrin activation state-dependent control of microtubule cortical targeting. Nat Commun. (2015) 6:1–14. doi: 10.1038/ncomms7135
22. Robertson AG, Kim J, Al-Ahmadie H, Bellmunt J, Guo G, Cherniack AD, et al. Comprehensive molecular characterization of muscle-invasive bladder cancer. Cell. (2017) 171:540–556.e25. doi: 10.1016/J.CELL.2017.09.007
23. de Bruijn I, Kundra R, Mastrogiacomo B, Tran TN, Sikina L, Mazor T, et al. Analysis and visualization of longitudinal genomic and clinical data from the AACR project GENIE biopharma collaborative in cBioPortal. Cancer Res. (2023) 3861–7. doi: 10.1158/0008-5472.CAN-23-0816
24. James ND, Hussain SA, Hall E, Jenkins P, Tremlett J, Rawlings C, et al. Radiotherapy with or without chemotherapy in muscle-invasive bladder cancer. New Engl J Med. (2012) 366:1477–88. doi: 10.1056/NEJMOA1106106/SUPPL_FILE/NEJMOA1106106_DISCLOSURES.PDF
25. Hoskin PJ, Rojas AM, Bentzen SM, and Saunders MI. Radiotherapy with concurrent carbogen and nicotinamide in bladder carcinoma. J Clin Oncology: Off J Am Soc Clin Oncol. (2010) 28:4912–8. doi: 10.1200/JCO.2010.28.4950
26. Yang L, Taylor J, Eustace A, Irlam JJ, Denley H, Hoskin PJ, et al. A gene signature for selecting benefit from hypoxia modification of radiotherapy for high-risk bladder cancer patients. Clin Cancer Res. (2017) 23:4761–8. doi: 10.1158/1078-0432.CCR-17-0038
27. Barretina J, Caponigro G, Stransky N, Venkatesan K, Margolin AA, Kim S, et al. The Cancer Cell Line Encyclopedia enables predictive modelling of anticancer drug sensitivity. Nature. (2012) 483:603–7. doi: 10.1038/NATURE11003
28. Yard BD, Adams DJ, Chie EK, Tamayo P, Battaglia JS, Gopal P, et al. A genetic basis for the variation in the vulnerability of cancer to DNA damage. Nat Commun. (2016) 7:11428. doi: 10.1038/NCOMMS11428
29. Shao X, Gomez CD, Kapoor N, Considine JM, Grams C, Gao YT, et al. MatrisomeDB 2.0: 2023 updates to the ECM-protein knowledge database. Nucleic Acids Res. (2023) 51:D1519–30. doi: 10.1093/NAR/GKAC1009
30. Byron A, Humphries JD, and Humphries MJ. Defining the extracellular matrix using proteomics. Int J Exp Path. (2013) 94:75–92. doi: 10.1111/iep.12011
31. Xu S, Xu H, Wang W, Li S, Li H, Li T, et al. The role of collagen in cancer: from bench to bedside. J Trans Med. (2019) 17:1–22. doi: 10.1186/S12967-019-2058-1
32. Kenny TC, Schmidt H, Adelson K, Hoshida Y, Koh AP, Shah N, et al. Patient-derived Interstitial Fluids and Predisposition to Aggressive Sporadic Breast Cancer through Collagen Remodeling and Inactivation of p53. Clin Cancer Research: Off J Am Assoc Cancer Res. (2017) 23:5446–59. doi: 10.1158/1078-0432.CCR-17-0342
33. Pickup MW, Mouw JK, and Weaver VM. The extracellular matrix modulates the hallmarks of cancer. EMBO Rep. (2014) 15:1243–53. doi: 10.15252/embr.201439246
34. Powell E, Piwnica-Worms D, and Piwnica-Worms H. Contribution of p53 to metastasis. Cancer Discov. (2014) 4:405–14. doi: 10.1158/2159-8290.CD-13-0136
35. Steffensen B, Chen Z, Pal S, Mikhailova M, Su J, Wang Y, et al. Fragmentation of fibronectin by inherent autolytic and matrix metalloproteinase activities. Matrix Biol. (2011) 30:34–42. doi: 10.1016/j.matbio.2010.09.004
36. Zhang X, Chen CT, Bhargava M, and Torzilli PA. A comparative study of fibronectin cleavage by MMP-1, -3, -13, and -14. Cartilage. (2012) 3:267–77. doi: 10.1177/1947603511435273
37. Tang X, Tang Q, Yang X, Xiao ZA, Zhu G, Yang T, et al. FN1 promotes prognosis and radioresistance in head and neck squamous cell carcinoma: From radioresistant HNSCC cell line to integrated bioinformatics methods. Front Genet. (2022) 13:1017762/PDF. doi: 10.3389/FGENE.2022.1017762/PDF
38. Cordes N and Meineke V. Cell adhesion-mediated radioresistance (CAM-RR): Extracellular matrix-dependent improvement of cell survival in human tumor and normal cells in vitro. Strahlentherapie Und Onkologie. (2003) 179:337–44. doi: 10.1007/S00066-003-1074-4
39. Eke I, Storch K, Krause M, and Cordes N. Cetuximab attenuates its cytotoxic and radiosensitizing potential by inducing fibronectin biosynthesis. Cancer Res. (2013) 73:5869–79. doi: 10.1158/0008-5472.CAN-13-0344
40. Bai Y, Zhao Z, Boath J, van Denderen BJ, and Darido C. The functional GRHL3-filaggrin axis maintains a tumor differentiation potential and influences drug sensitivity. Mol Therapy: J Am Soc Gene Ther. (2021) 29:2571–82. doi: 10.1016/J.YMTHE.2021.03.016
41. Rascio F, Spadaccino F, Rocchetti MT, Castellano G, Stallone G, Netti GS, et al. The pathogenic role of PI3K/AKT pathway in cancer onset and drug resistance: an updated review. Cancers. (2021) 13(16):3949. doi: 10.3390/CANCERS13163949
42. Chang L, Graham PH, Hao J, Ni J, Bucci J, Cozzi PJ, et al. PI3K/Akt/mTOR pathway inhibitors enhance radiosensitivity in radioresistant prostate cancer cells through inducing apoptosis, reducing autophagy, suppressing NHEJ and HR repair pathways. Cell Death Dis. (2014) 5(10):e1437. doi: 10.1038/CDDIS.2014.415
43. Glaviano A, Foo ASC, Lam HY, Yap KCH, Jacot W, Jones RH, et al. PI3K/AKT/mTOR signaling transduction pathway and targeted therapies in cancer. Mol Cancer. (2023) 22(1):138. doi: 10.1186/S12943-023-01827-6
44. Su YC, Lee WC, Wang CC, Yeh SA, Chen WH, and Chen PJ. Targeting PI3K/AKT/mTOR signaling pathway as a radiosensitization in head and neck squamous cell carcinomas. Int J Mol Sci. (2022) 23(24):15749. doi: 10.3390/IJMS232415749
45. Guo F and Yuan Y. Tumor necrosis factor alpha-induced proteins in Malignant tumors: progress and prospects. OncoTargets Ther. (2020) 13:3303–18. doi: 10.2147/OTT.S241344
46. Dennis DE, Beckett MA, Kufe D, and Weichselbaum RR. The interaction between recombinant human tumor necrosis factor and radiation in 13 human tumor cell lines. Int J Radiat Oncology Biology Phys. (1990) 19:69–74. doi: 10.1016/0360-3016(90)90136-8
47. Yang Y, Liu Z-G, Yang Y-Q, Zhang Z-G, Wang X-L, Li Y-L, et al. Role of tumor necrosis factor alpha-induced protein 6 (TNFAIP6) in tumors: a pan-cancer analysis. Oncol Trans Med. (2024) 10:22–9. doi: 10.1097/OT9.0000000000000017
48. Franzolin G and Tamagnone L. Semaphorin signaling in cancer-associated inflammation. Int J Mol Sci. (2019) 20(2):377. doi: 10.3390/IJMS20020377
49. Xia C, Braunstein Z, Toomey AC, Zhong J, and Rao X. S100 proteins as an important regulator of macrophage inflammation. Front Immunol. (2018) 8:1908. doi: 10.3389/FIMMU.2017.01908
50. Zhou C, Gao Y, Ding P, Wu T, and Ji G. The role of CXCL family members in different diseases. Cell Death Discov. (2023) 9(1):212. doi: 10.1038/S41420-023-01524-9
51. Meunier S, Frontczak A, Balssa L, Blanc J, Benhmida S, Pernot M, et al. Elevated baseline neutrophil count correlates with worse outcomes in patients with muscle-invasive bladder cancer treated with chemoradiation. Cancers. (2023) 15(6):1886. doi: 10.3390/CANCERS15061886
52. Shinde-Jadhav S, Mansure JJ, Rayes RF, Marcq G, Ayoub M, Skowronski R, et al. Role of neutrophil extracellular traps in radiation resistance of invasive bladder cancer. Nat Commun. (2021) 12(1):2776. doi: 10.1038/S41467-021-23086-Z
53. Wu CT, Huang YC, Chen WC, and Chen MF. The significance of neutrophil-to-lymphocyte ratio and combined chemoradiotherapy in patients undergoing bladder preservation therapy for muscle-invasive bladder cancer. Cancer Manage Res. (2020) 12:13125–35. doi: 10.2147/CMAR.S283954
54. Tian C, Clauser KR, Öhlund D, Rickelt S, Huang Y, Gupta M, et al. Proteomic analyses of ECM during pancreatic ductal adenocarcinoma progression reveal different contributions by tumor and stromal cells. Proc Natl Acad Sci United States America. (2019) 116:19609–18. doi: 10.1073/PNAS.1908626116/SUPPL_FILE/PNAS.1908626116.SD04.XLSX
55. Adams JC. Passing the post: roles of posttranslational modifications in the form and function of extracellular matrix. Am J Physiol. (2023) 324:C1179–97. doi: 10.1152/AJPCELL.00054.2023
56. Reily C, Stewart TJ, Renfrow MB, and Novak J. Glycosylation in health and disease. Nat Rev Nephrol. (2019) 15:346–66. doi: 10.1038/S41581-019-0129-4
57. McKelvey KJ, Hudson AL, Back M, Eade T, and Diakos CI. Radiation, inflammation and the immune response in cancer. Mamm Genome: Off J Int Mamm Genome Soc. (2018) 29:843–65. doi: 10.1007/S00335-018-9777-0
58. McLaughlin M, Patin EC, Pedersen M, Wilkins A, Dillon MT, Melcher AA, et al. Inflammatory microenvironment remodelling by tumour cells after radiotherapy. Nat Rev Cancer. (2020) 20:203–17. doi: 10.1038/S41568-020-0246-1
59. Zhang J, Wu Q, Zhu L, Xie S, Tu L, Yang Y, et al. SERPINE2/PN-1 regulates the DNA damage response and radioresistance by activating ATM in lung cancer. Cancer Lett. (2022) 524:268–83. doi: 10.1016/J.CANLET.2021.10.001
60. Chuang HW, Hsia KT, Liao J, Yeh CC, Kuo WT, and Yang YF. SERPINE2 overexpression is associated with poor prognosis of urothelial carcinoma. Diagnostics (Basel Switzerland). (2021) 11(10):1928. doi: 10.3390/DIAGNOSTICS11101928
61. Waller V and Pruschy M. Combined radiochemotherapy: metalloproteinases revisited. Front Oncol. (2021) 11:676583. doi: 10.3389/FONC.2021.676583
62. Bonnans C, Chou J, and Werb Z. Remodelling the extracellular matrix in development and disease. Nat Rev Mol Cell Biol. (2014) 15:786–801. doi: 10.1038/nrm3904.Remodelling
64. Gilkes DM, Wirtz D, and Semenza GL. Hypoxia and the extracellular matrix: drivers of tumour metastasis. Nat Rev Cancer. (2015) 14:430–9. doi: 10.1038/nrc3726
65. Pathak A and Kumar S. Independent regulation of tumor cell migration by matrix stiffness and confinement. Proc Natl Acad Sci United States America. (2012) 109:10334–9. doi: 10.1073/PNAS.1118073109
66. Kim RK, Kaushik N, Suh Y, Yoo KC, Cui YH, Kim MJ, et al. Radiation driven epithelial-mesenchymal transition is mediated by Notch signaling in breast cancer. Oncotarget. (2016) 7:53430–42. doi: 10.18632/ONCOTARGET.10802
67. Beunk L, Wen N, van Helvert S, Bekker B, Ran L, Kang R, et al. Cell jamming in a collagen-based interface assay is tuned by collagen density and proteolysis. J Cell Sci. (2023) 136(23):jcs260207. doi: 10.1242/JCS.260207
68. Brábek J, Mierke CT, Rösel D, Veselý P, and Fabry B. The role of the tissue microenvironment in the regulation of cancer cell motility and invasion. Cell Commun Signal. (2010) 8:22. doi: 10.1186/1478-811X-8-22
69. Quintela-Fandino M, Bermejo B, Zamora E, Moreno F, Garcia-Saenz JÁ, Pernas S, et al. High mechanical conditioning by tumor extracellular matrix stiffness is a predictive biomarker for anti-fibrotic therapy in HER2-negative breast cancer. Clin Cancer Research: Off J Am Assoc Cancer Res. (2024) 5094–104. doi: 10.1158/1078-0432.CCR-24-1518
70. Wang H, Yang R, Jin J, Wang Z, and Li W. Impact of concomitant idiopathic pulmonary fibrosis on prognosis in lung cancer patients: A meta-analysis. PloS One. (2021) 16(11):e0259784. doi: 10.1371/JOURNAL.PONE.0259784
71. Chen L, Huang X, Xiong L, Chen W, An L, Wang H, et al. Analysis of prognostic oncogene filaggrin (FLG) wild-type subtype and its implications for immune checkpoint blockade therapy in bladder urothelial carcinoma. Trans Andrology Urol. (2022) 11:1419–32. doi: 10.21037/TAU-22-573/COIF
72. Chan TC, Li CF, Ke HL, Wei YC, Shiue YL, Li CC, et al. High TNFAIP6 level is associated with poor prognosis of urothelial carcinomas. Urologic Oncol. (2019) 37:293.e11–293.e24. doi: 10.1016/J.UROLONC.2018.12.009
73. Zhang X, Xue J, Yang H, Zhou T, and Zu G. TNFAIP6 promotes invasion and metastasis of gastric cancer and indicates poor prognosis of patients. Tissue Cell. (2021) 68:101455. doi: 10.1016/J.TICE.2020.101455
74. Bigos KJA, Quiles CG, Lunj S, Smith DJ, Krause M, Troost EGC, et al. Tumour response to hypoxia: understanding the hypoxic tumour microenvironment to improve treatment outcome in solid tumours. Front Oncol. (2024) 14:1331355/BIBTEX. doi: 10.3389/FONC.2024.1331355/BIBTEX
75. Guerrero Quiles C, Julia Gonzalez A, Foussat AS, Olympitis A, Lodhi T, Smith V, et al. Hypoxia-induced extracellular matrix changes are conserved in cancer and directly impact radiotherapy benefit. bioRxiv. (2025) 2025:04.04.647191. doi: 10.1101/2025.04.04.647191
76. Goggins E, Kakkad S, Mironchik Y, Jacob D, Wildes F, Krishnamachary B, et al. Hypoxia inducible factors modify collagen I fibers in MDA-MB-231 triple negative breast cancer xenografts. Neoplasia (New York N.Y.). (2018) 20:131–9. doi: 10.1016/J.NEO.2017.11.010
77. Kakkad SM, Solaiyappan M, O’Rourke B, Stasinopoulos I, Ackerstaff E, Raman V, et al. Hypoxic tumor microenvironments reduce collagen I fiber density. Neoplasia. (2010) 12:608–17. doi: 10.1593/neo.10344
Keywords: radiotherapy, ECM - extracellular matrix, bladder cancer (BCa), radioresistance mechanisms, biomarker
Citation: Guerrero Quiles C, Fahy S, Bartak M, Gonzalez Abalos J, Powell E, Lodhi T, Reed R, Reeves K, Baker A, James ND, Hall E, Huddart RA, Porta N, Hoskin P, West C, Biolatti LV and Choudhury A (2025) Radiation-induced extracellular matrix remodelling drives prognosis and predicts radiotherapy response in muscle-invasive bladder cancer. Front. Oncol. 15:1616943. doi: 10.3389/fonc.2025.1616943
Received: 23 April 2025; Accepted: 04 July 2025;
Published: 28 July 2025.
Edited by:
Guang Hu, Soochow University, ChinaReviewed by:
Wenying Yan, Suzhou City University, ChinaChao Han, Tavotek Biotherapeutics, United States
Copyright © 2025 Guerrero Quiles, Fahy, Bartak, Gonzalez Abalos, Powell, Lodhi, Reed, Reeves, Baker, James, Hall, Huddart, Porta, Hoskin, West, Biolatti and Choudhury. This is an open-access article distributed under the terms of the Creative Commons Attribution License (CC BY). The use, distribution or reproduction in other forums is permitted, provided the original author(s) and the copyright owner(s) are credited and that the original publication in this journal is cited, in accordance with accepted academic practice. No use, distribution or reproduction is permitted which does not comply with these terms.
*Correspondence: Conrado Guerrero Quiles, Y29ucmFkby5ndWVycmVyb3F1aWxlc0BtYW5jaGVzdGVyLmFjLnVr
†These authors have contributed equally to this work