 Yanhong Lin1,2†
 Dinghang Chen1,2†
 Jieming Lu1,2†
 Yicheng Huang1,2Ziyang Han1,2,3,4,5*
 Mingqiang Kang1,2,3,4,5*
- 1Department of Thoracic Surgery, Fujian Medical University Union Hospital, Fuzhou, Fujian, China
- 2Key Laboratory of Cardio-Thoracic Surgery, Fujian Medical University, Fuzhou, Fujian, China
- 3Key Laboratory of Gastrointestinal Cancer, Fujian Medical University, Ministry of Education, Fuzhou, Fujian, China
- 4Fujian Key Laboratory of Tumor Microbiology, Department of Medical Microbiology, Fujian Medical University, Fuzhou, Fujian, China
- 5Clinical Research Center for Thoracic Tumors of Fujian Province, Fuzhou, Fujian, China
Introduction: Surgery remains the primary treatment for patients with esophageal cancer (EC), yet postoperative prognosis is often unsatisfactory. Accurate prediction of cancer-specific survival (CSS) can assist clinicians in personalized treatment planning. This study aimed to develop an interactive web-based tool to estimate CSS in patients with T1~3N0~2M0 EC after surgery, based on the log odds of negative lymph nodes/T stage ratio (LONT).
Methods: A total of 2,221 patients with T1~3N0~2M0 EC were identified from the Surveillance, Epidemiology, and End Results (SEER) database. Patients were randomly divided into training and testing sets. Univariate Cox regression analysis was conducted to identify factors associated with CSS. Cox regression and random survival forest (RSF) models were used to compare the predictive performance of LONT and N stage. Model performance was evaluated using receiver operating characteristic (ROC) curves, decision curve analysis (DCA), and calibration curves. An interactive web-based tool was then constructed for individualized survival prediction.
Results: Univariate analysis revealed that age, sex, T stage, N stage, chemotherapy, and LONT were significantly associated with CSS. ROC curve comparisons showed that LONT outperformed N stage in predictive accuracy, particularly for 1-year CSS. DCA and calibration curves indicated that the model had high predictive accuracy in both training and testing sets.
Discussion: The developed interactive web-based tool provides effective estimation of 1-, 3-, and 5-year CSS, as well as survival trends, in postoperative patients with T1~3N0~2M0 EC. This tool may aid clinical decision-making by enabling more accurate individualized prognosis prediction.
Introduction
Epidemiological studies indicate that esophageal cancer (EC) ranks seventh in global cancer incidence and sixth in cancer-related mortality (1). Early-stage EC often presents with nonspecific symptoms, resulting in many patients being diagnosed at advanced stages and missing the optimal window for surgical treatment (2). Surgery remains the primary treatment for EC, however, the survival rate for patients undergoing surgery is still suboptimal (3). Therefore, identifying reliable prognostic factors for surgically treated EC is essential. The American Joint Committee on Cancer (AJCC) TNM stage system, particularly the pT and pN classifications, is widely used to stage tumors. However, the N stage is based solely on the number of positive lymph nodes (PLN), without accounting for the number of negative lymph nodes (NLN), which may limit its ability to accurately reflect tumor burden and affect staging precision and comparability (4–6). Studies have shown that the number of NLN holds prognostic significance in EC and serves as an independent predictor in patients undergoing curative esophagectomy (7). Additionally, T stage is strongly correlated with both prognosis and tumor biology (8, 9). However, few prognostic indicators simultaneously incorporate both T stage and NLN count. In recent years, the log odds of negative lymph nodes/T stage ratio (LONT), a metric combining T stage and NLN data, has emerged as a superior predictor of survival compared to T, N, or TNM stage alone (10). LONT has demonstrated strong prognostic utility in several cancers, including colorectal (10, 11), thyroid (12), and bladder cancers (13). However, its prognostic value in EC remains largely unexplored. Therefore, this study investigates the prognostic significance of LONT in postoperative patients with T1~3N0~2M0 EC and introduces a web-based dynamic survival prediction tool based on LONT to enhance personalized prognosis assessment.
Methods
Data sources and patients
The patient data used in this study were obtained from the Surveillance, Epidemiology, and End Results (SEER) database, a population-based cancer registry covering approximately 34.6% of the U.S. population. Using SEER*Stat software (version 8.4.4), we retrospectively extracted data from 2000 to 2021 across 17 registries. Eligible cases included patients with primary site codes C15.3–C15.5 (upper to lower esophagus), histological types 8070/3 (squamous cell carcinoma) or 8140/3 (adenocarcinoma), clinical stages T1~3N0~2M0, and who underwent surgical treatment. The inclusion criteria were: (1) esophageal cancer (EC) patients who received surgical treatment; (2) pathologically confirmed T1~3N0~2M0 adenocarcinoma or squamous cell carcinoma; and (3) EC as the only primary tumor at diagnosis. The exclusion criteria were: (1) unknown or incomplete pathological data; (2) missing lymph node information; (3) EC not being the first primary tumor; and (4) missing survival data. A total of 2,221 patients from the SEER database met the criteria and were included in this retrospective study. Ethical approval and informed consent were not required for this study, as the SEER database provides de-identified, publicly available data and is therefore exempt from institutional review board (IRB) oversight. The complete data selection process is illustrated in Figure 1.
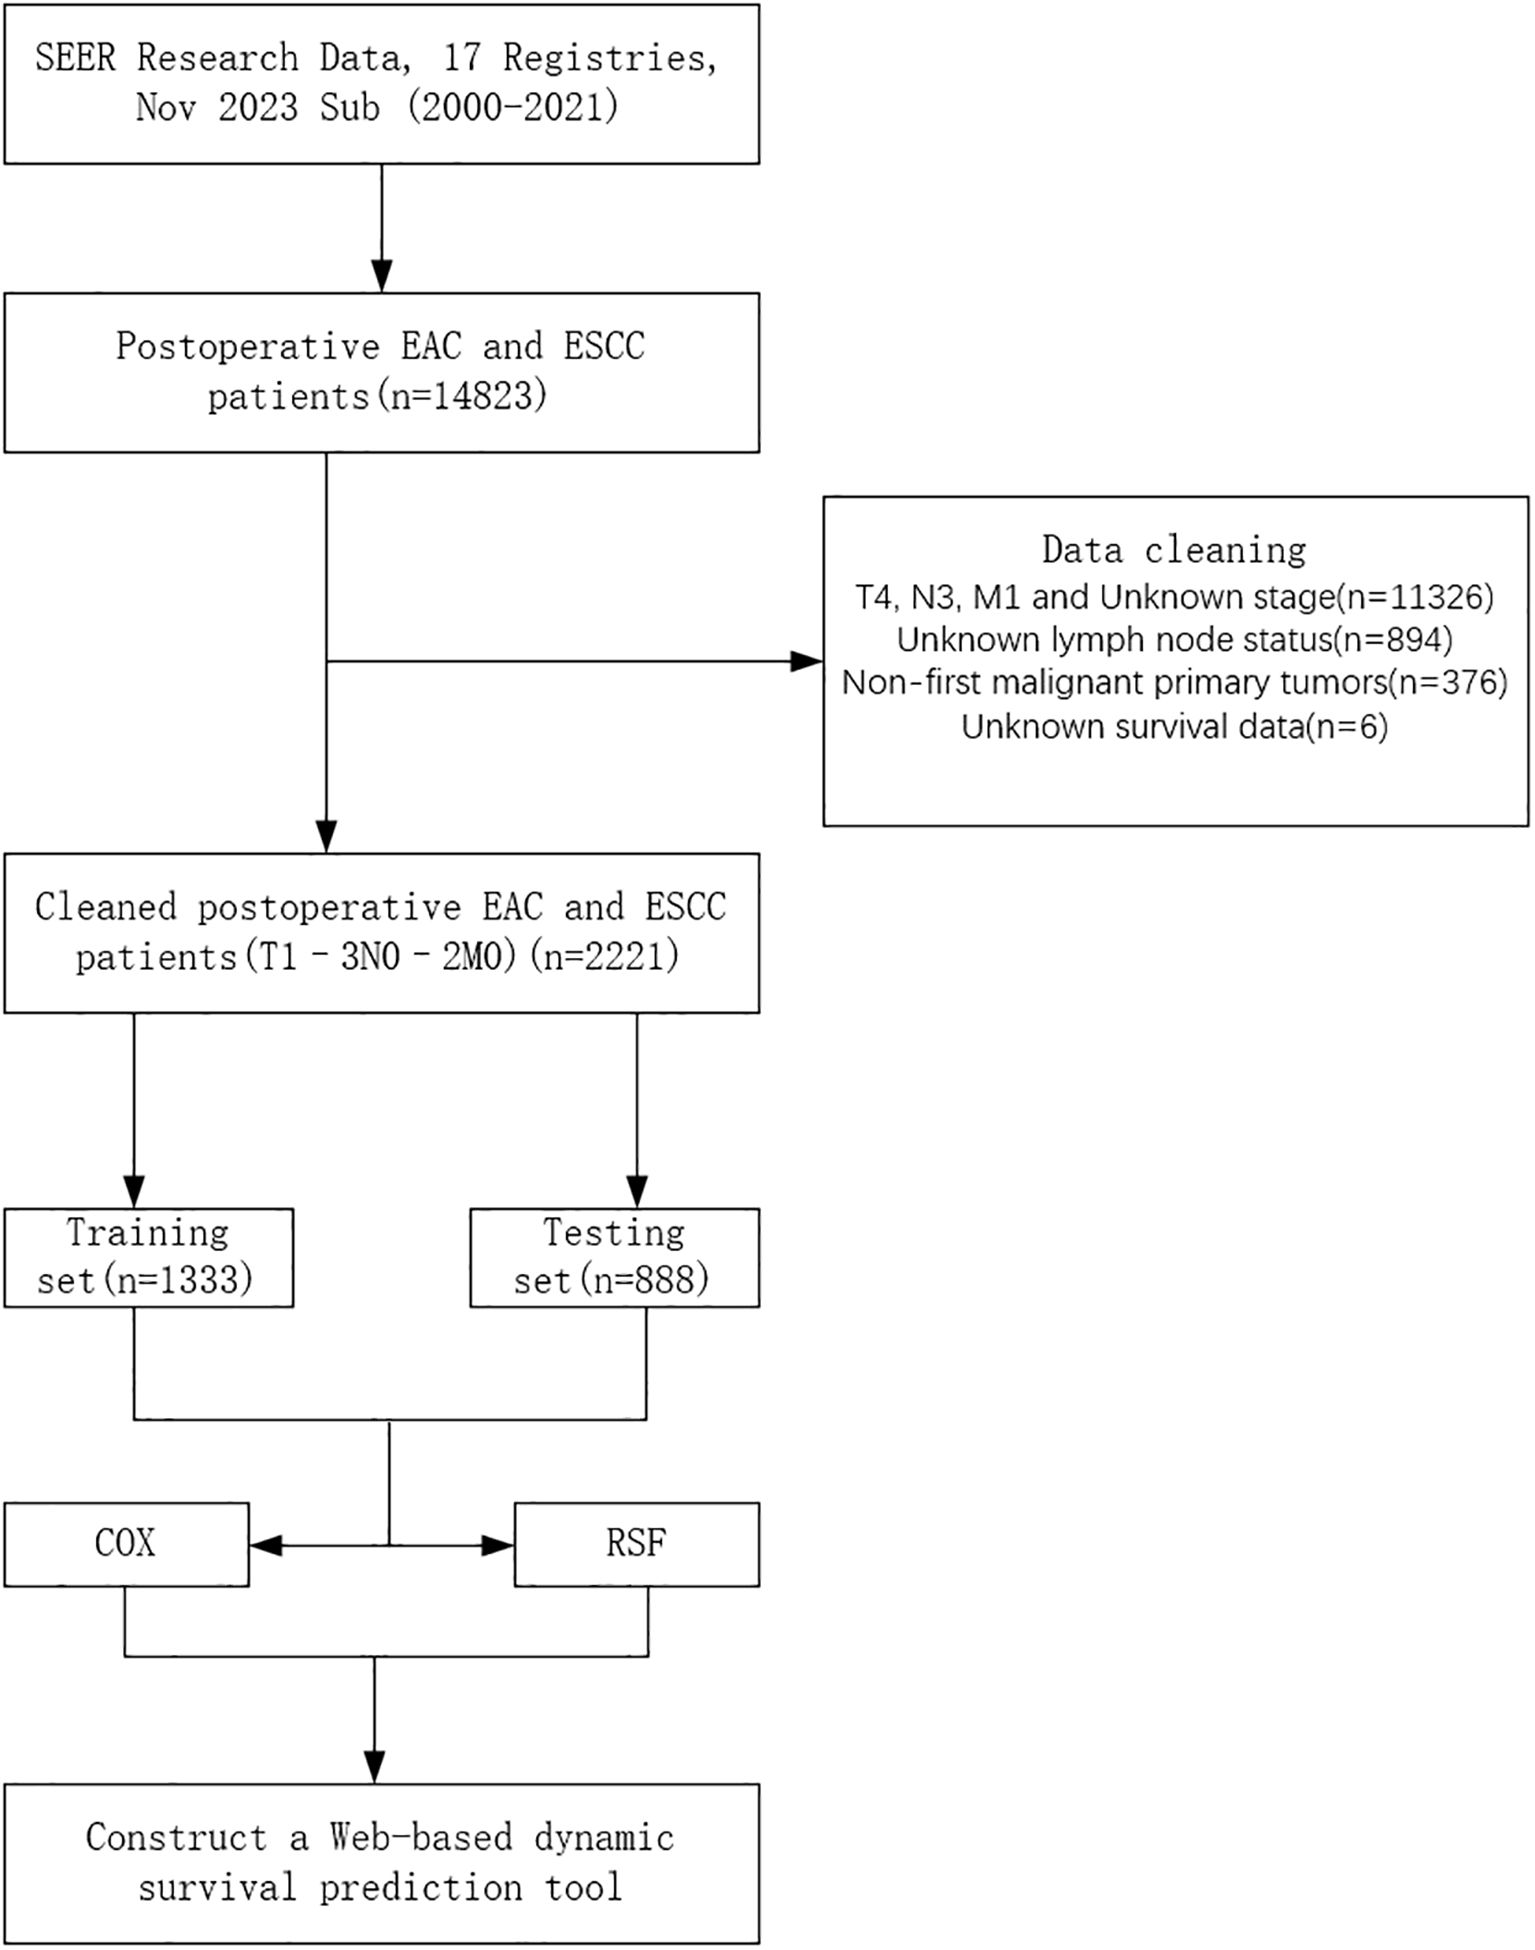
Figure 1. Flowchart of patient selection. EAC, Esophageal Adenocarcinoma; ESCC, Esophageal Squamous Cell Carcinoma; COX, Cox Proportional Hazards Model; RSF, Random Survival Forest.
Selection and definition of variables
The variables extracted from the SEER database for this study included age, sex, histology, tumor location, T stage, N stage, chemotherapy, and log odds of negative lymph nodes/T stage ratio (LONT). LONT was defined as log((NLN +1)/T stage). NLN was calculated by subtracting the number of positive lymph nodes (PLN) from the number of examined lymph nodes (ELN), and one was added to avoid division by zero. T1, T2, and T3 stages were assigned numeric values of 1, 2, and 3, respectively. The optimal cutoff values for age and LONT were determined using X-tile software and were identified as 52 and 71 years for age (Supplementary Figure S1), and 1.0 and 2.3 for LONT (Supplementary Figure S2).
Cox proportional hazards and random survival forest models
The Cox proportional hazards model is one of the most widely used tools in survival analysis. In this study, we performed univariate Cox regression analyses for all variables and considered those with a p-value < 0.05 as prognostic factors for cancer-specific survival (CSS). We then conducted two separate multivariate Cox regression analyses: Model 1 focused on LONT, while Model 2 emphasized N stage. Random survival forest (RSF) was constructed using an ensemble of binary decision trees and are effective in identifying predictors closely associated with time-to-event outcomes. RSF introduces dual randomization during model construction: bootstrapping is used to sample the data, and a random subset of covariates is selected at each node for splitting (14). In this study, RSF models were trained based on Model 1 (LONT) and Model 2 (N stage), each including seven variables. The terminal node size was set to 10, and two variables were randomly selected for splitting at each node. The RSF models offered an effective method for systematically identifying key clinical factors associated with CSS, providing a theoretical foundation for personalized survival prediction and risk stratification.
Statistical analysis
In this study, we performed comprehensive statistical analyses using R software (version 4.4.1) and X-tile software (version 3.6.1). X-tile was used to determine the optimal cutoff values for age and LONT. Demographic and clinical variables were analyzed using the chi-square test, and baseline characteristics were reported as counts and percentages (n, %). The primary endpoint was CSS. Univariate and multivariate Cox regression analyses were performed using the “survival” and “autoReg” packages in R, with multivariate models developed separately based on LONT and N stage. ROC curves for Cox and RSF models were generated using the “pROC” and “timeROC” packages to compare the predictive performance of Model 1 (LONT) and Model 2 (N stage). The RSF model was constructed using the “randomForestSRC” package. Decision curve analysis (DCA) and calibration curves were plotted using the “ggDCA” and “rms” packages, respectively. Calibration curves assessed the agreement between predicted probabilities and actual outcomes, while DCA evaluated the net clinical benefit across a range of risk thresholds, highlighting the model’s clinical utility. Survival curves were plotted using the “survminer” and “survival” packages. Finally, an interactive web-based tool was developed based on LONT to enable personalized survival prediction.
Results
Baseline characteristics
Based on the inclusion and exclusion criteria, a total of 2,221 postoperative esophageal cancer (EC) patients with T1~3N0~2M0 stage were included from the Surveillance, Epidemiology, and End Results (SEER) database. The patients were randomly assigned to training and testing sets in a 6:4 ratio. The demographic and clinicopathological characteristics of the training and testing sets are summarized in Table 1. In the overall set, 84.4% of the patients were male, and 72.2% were aged between 52 and 71 years. Additionally, the majority of patients were diagnosed with esophageal adenocarcinoma (EAC) (82.9%), had tumors located in the lower third of the esophagus (87.0%), were classified as T3 stage (56.7%), or had N0 stage (46.1%). Regarding treatment, a higher proportion of patients received chemotherapy (77.2%).
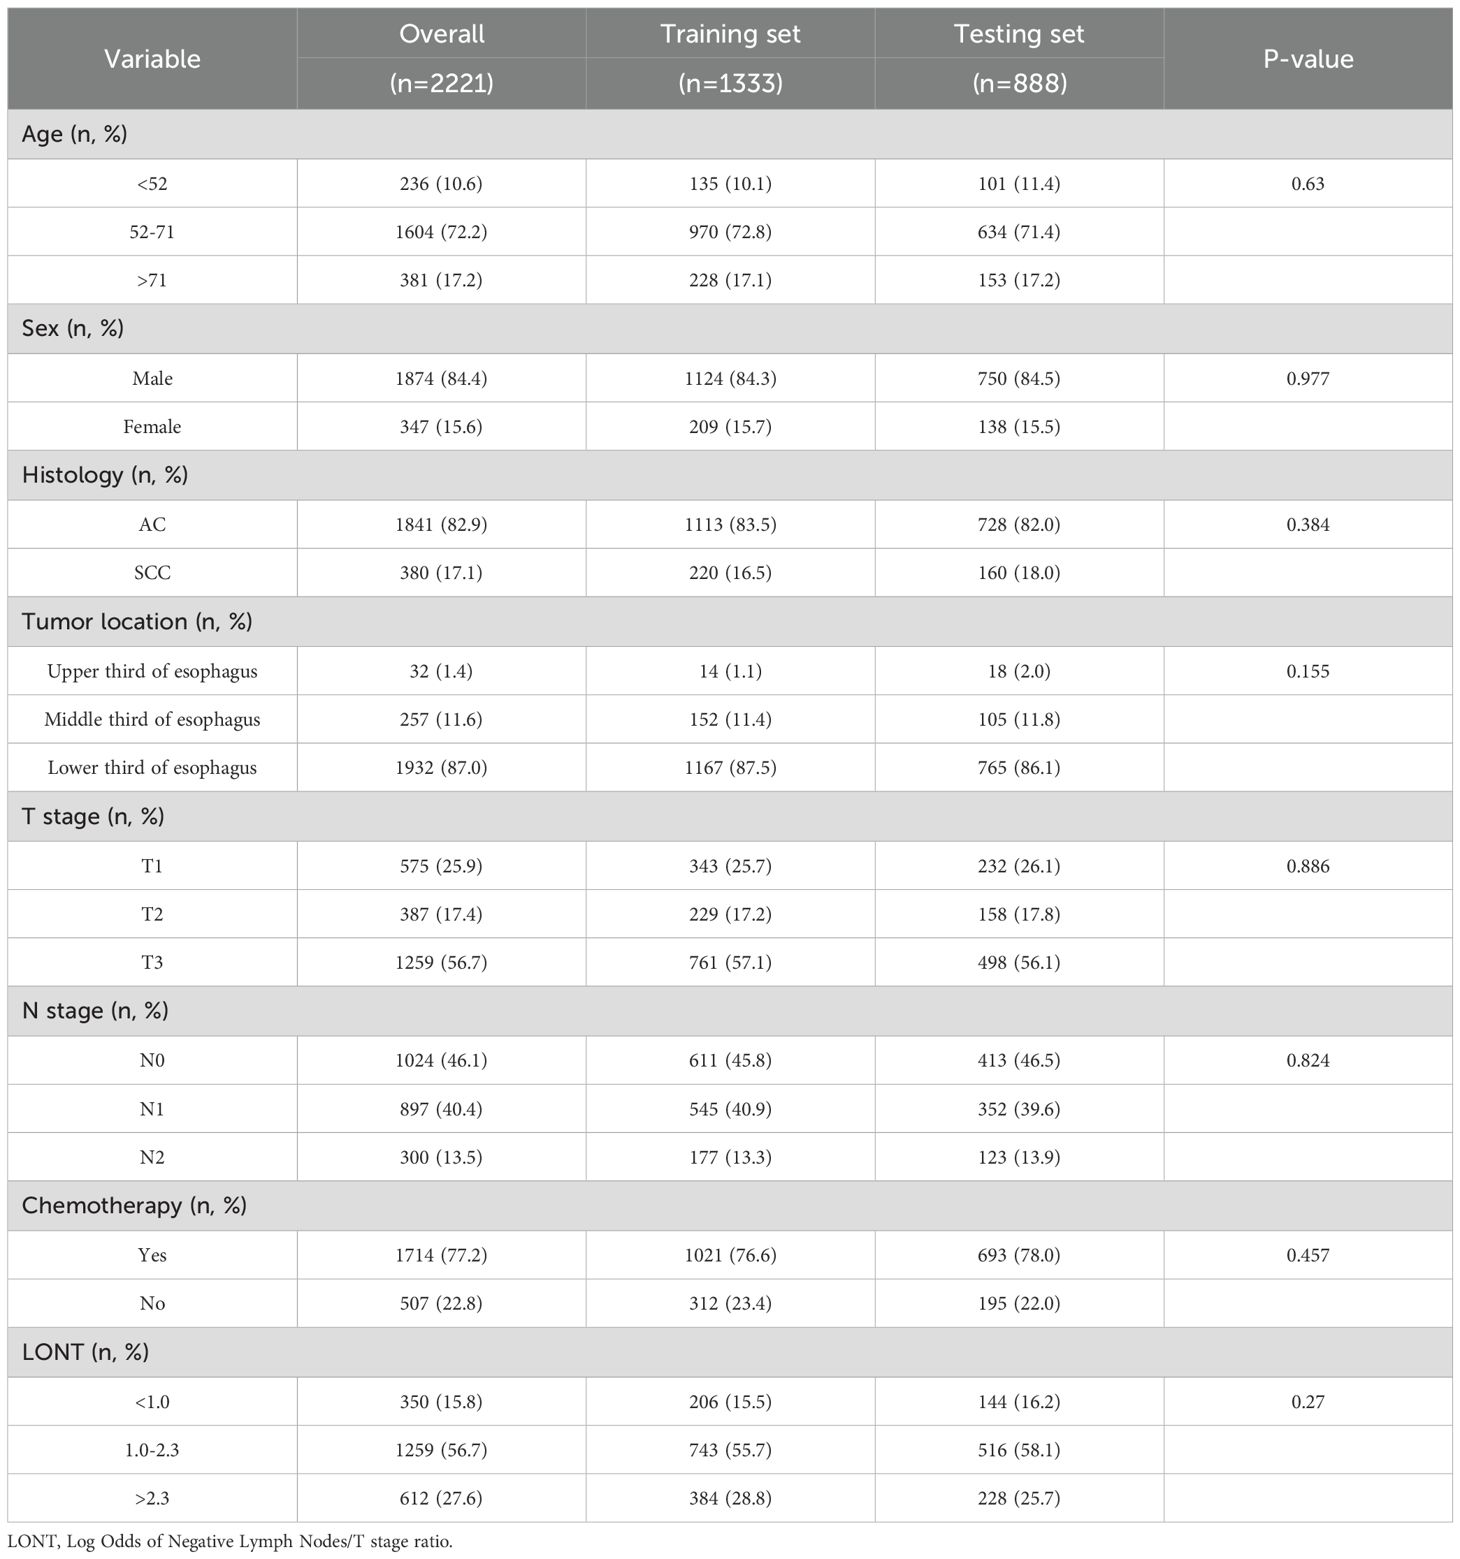
Table 1. Demographic and clinicopathological characteristics of the training and testing sets.
identification of independent Prognostic Factors for CSS
We used Cox regression analysis to identify independent prognostic factors for CSS in EC patients. Univariate Cox analysis revealed that age, sex, T stage, N stage, chemotherapy, and LONT were significantly associated with CSS (Table 2). Subsequently, we performed two multivariate Cox regression analyses based on LONT and N stage, respectively (Table 3). ROC curve analysis of the multivariate Cox models showed that Model 1 (LONT) demonstrated superior predictive performance compared to Model 2 (N stage), with AUCs of 0.603 at 1 year, 0.663 at 3 years, and 0.676 at 5 years (Figure 2).
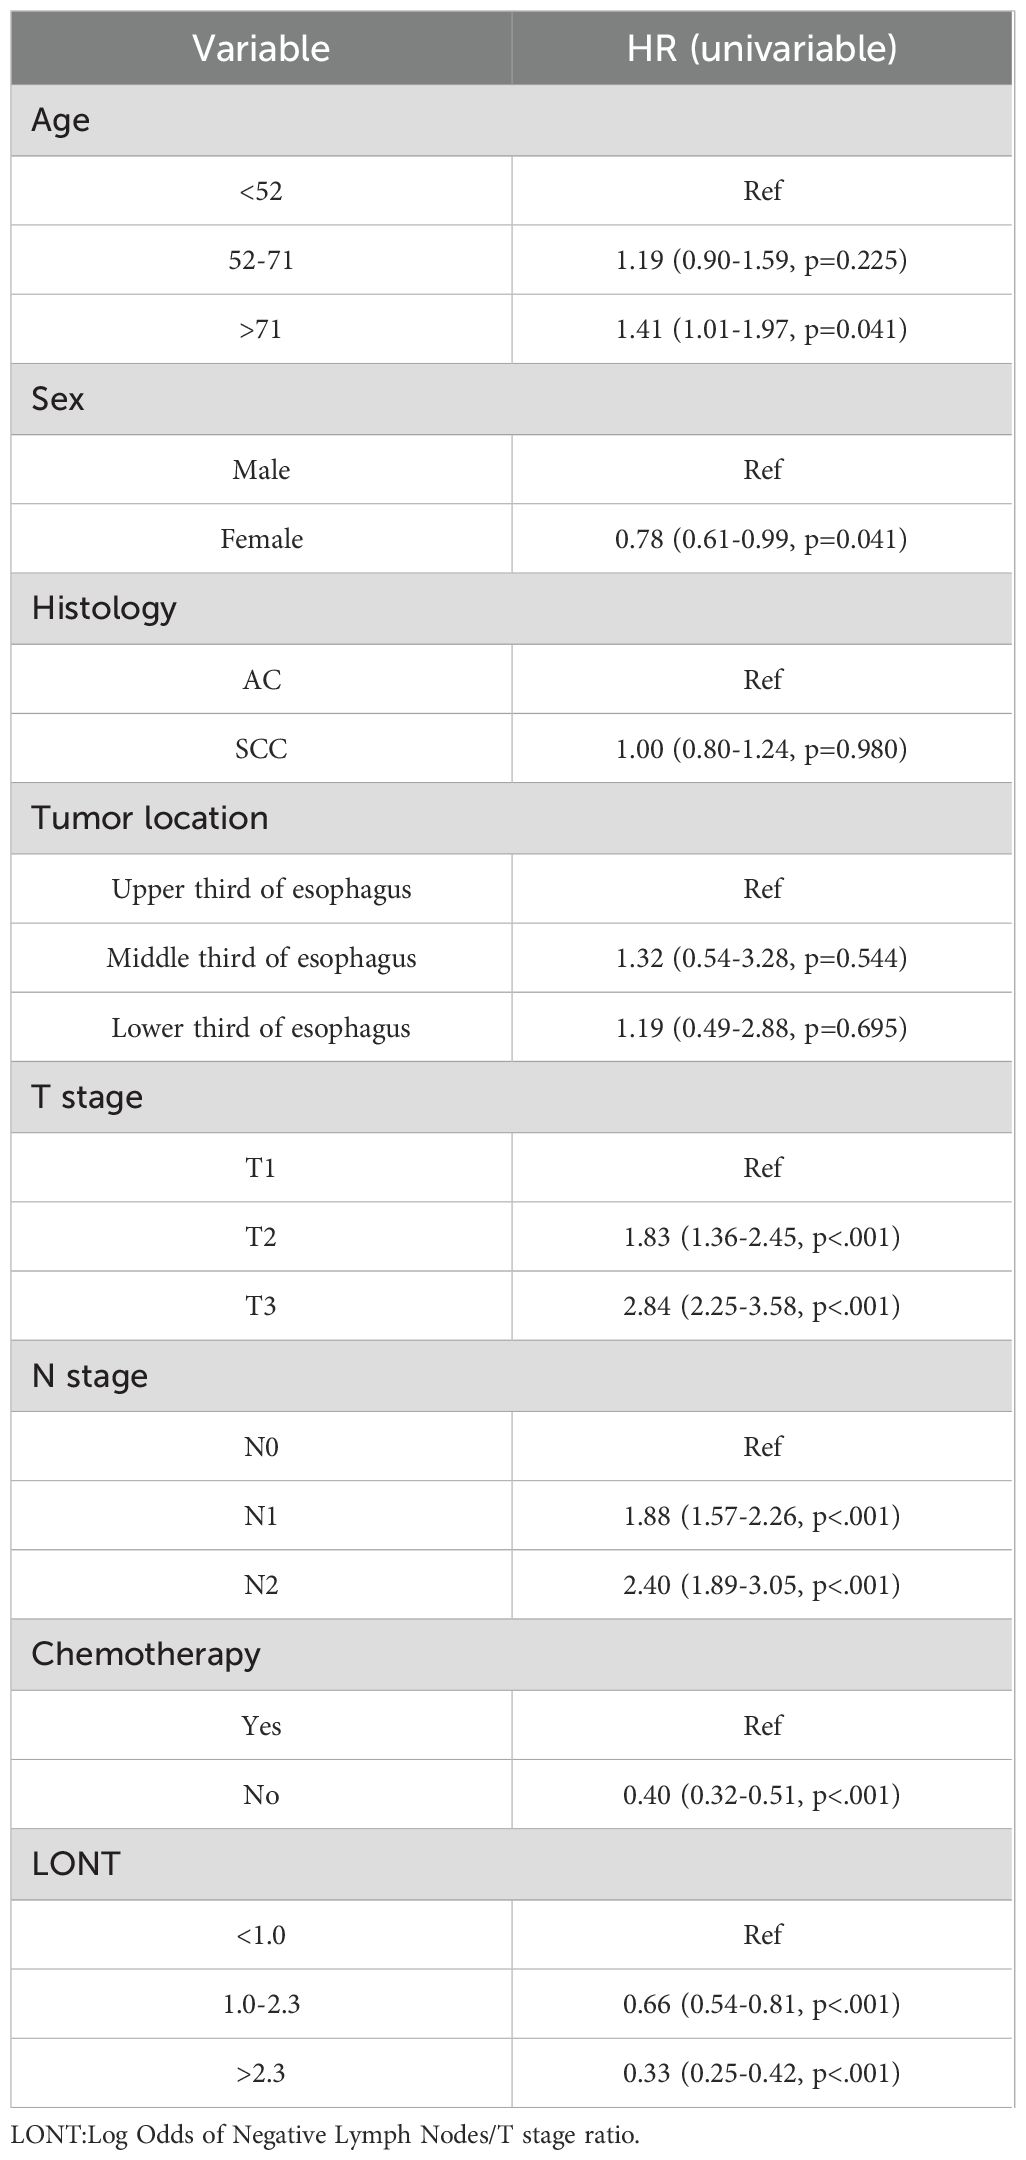
Table 2. Univariate Cox proportional hazards regression analysis of esophageal cancer prognosis.
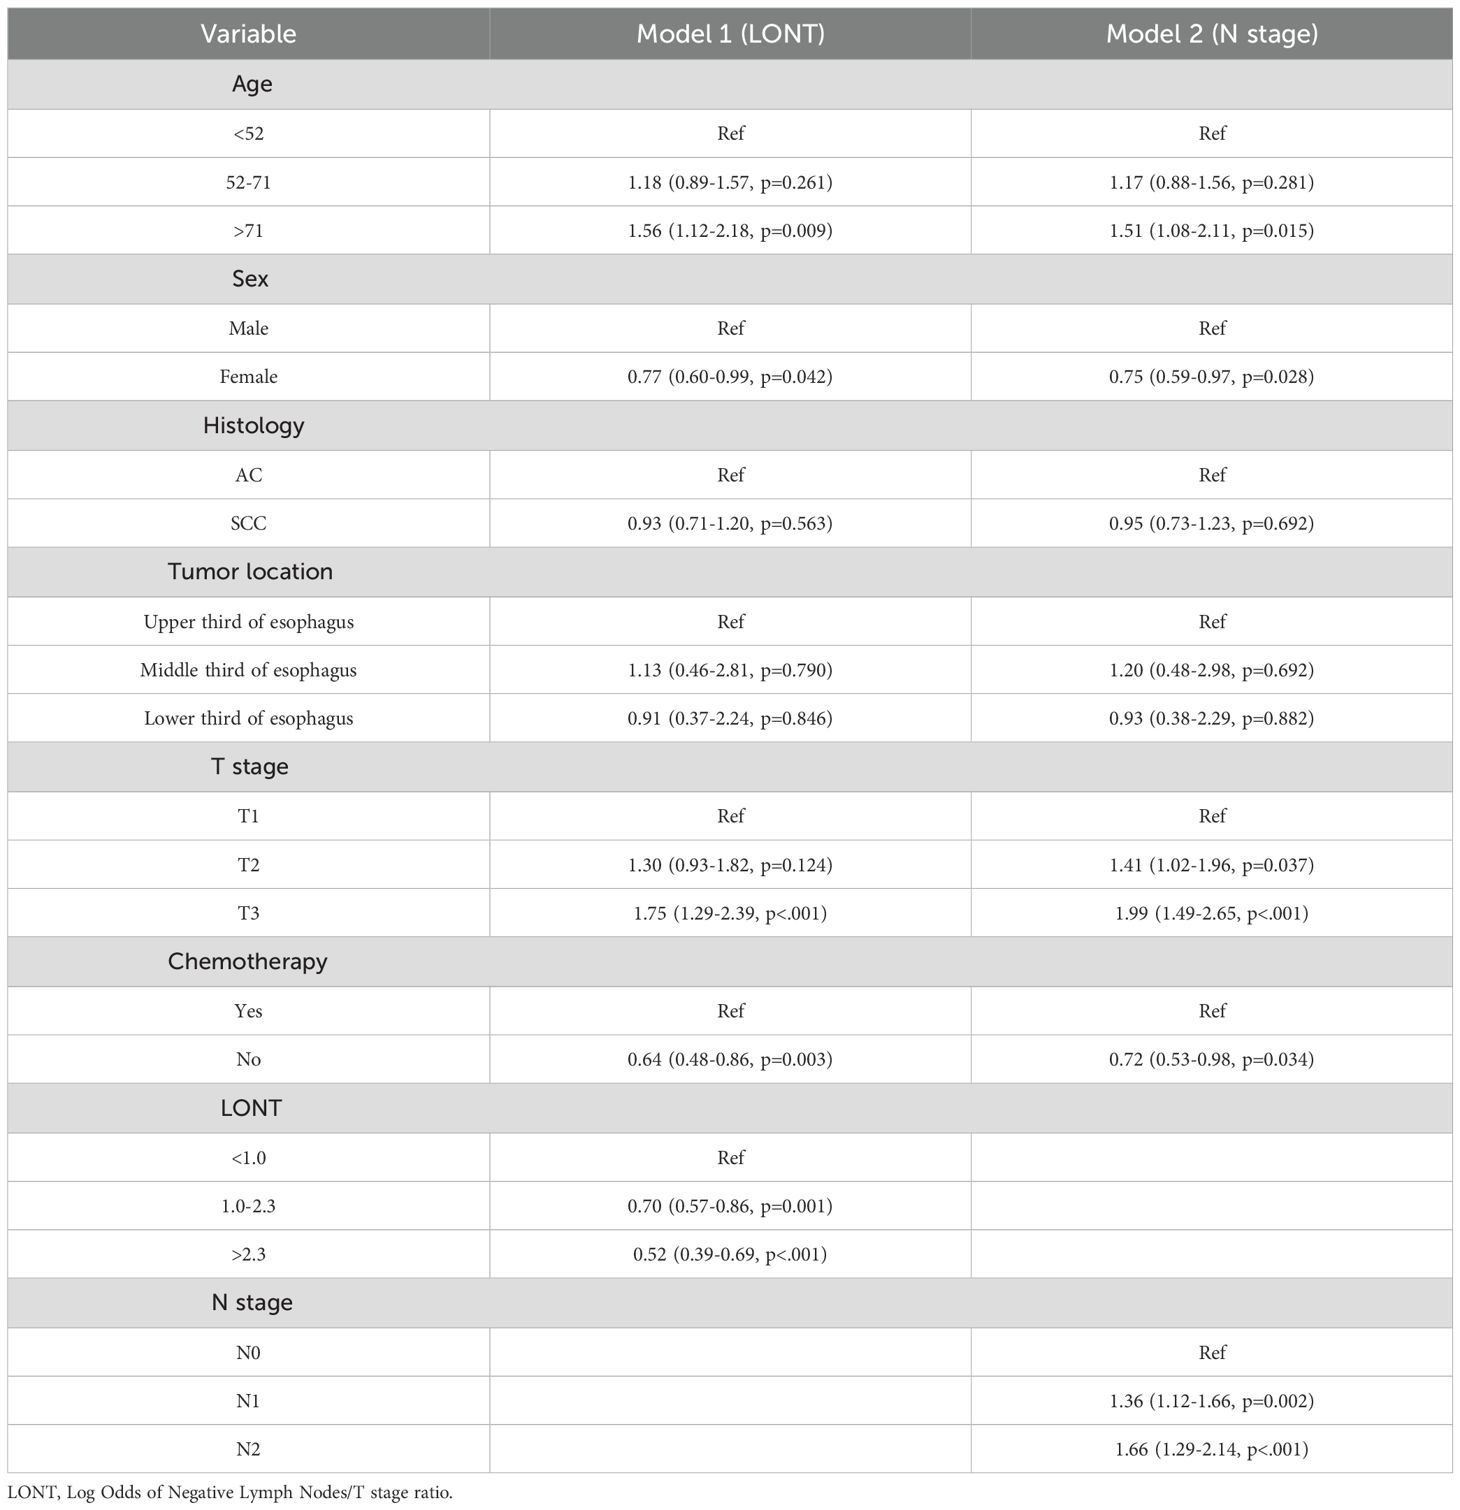
Table 3. Multivariate Cox regression analysis for CSS.
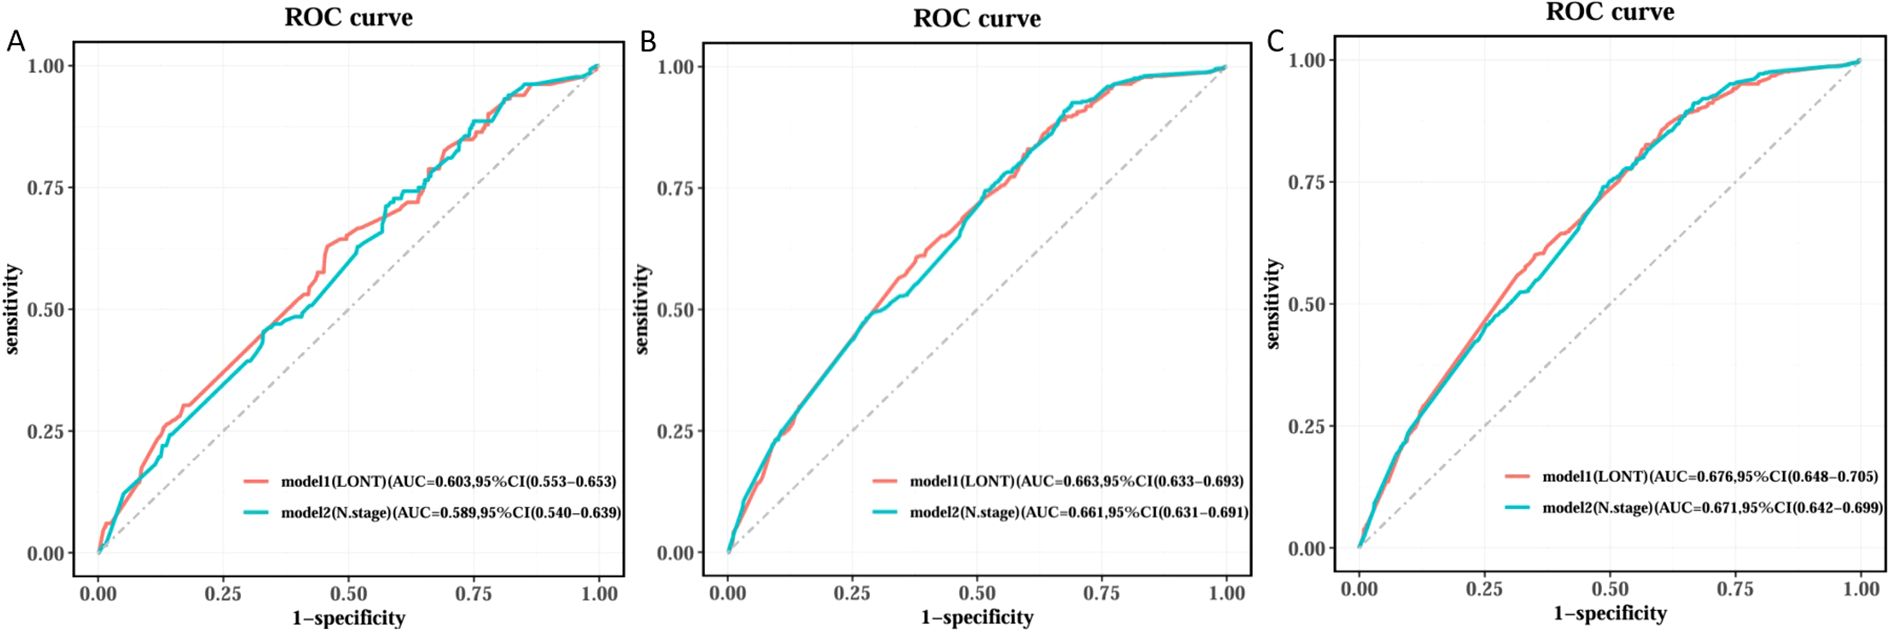
Figure 2. Comparison of ROC curves among different Cox models. (A) Time of the ROC in 1 year, (B) Time of the ROC in 3 years and (C) Time of the ROC in 5 years.
Random survival forest analysis
We trained Random Survival Forest (RSF) models using the variables from the two multivariate Cox models: Model 1 (LONT) and Model 2 (N stage). As shown in Figure 3, variable importance was visualized for both models. In Model 1, the top three most important variables and their relative importance were T stage (1.00), LONT (0.50), and chemotherapy (0.49). In Model 2, the top three variables were T stage (1.00), chemotherapy (0.29), and N stage (0.23). We further compared the ROC curves of Model 1(LONT) and Model 2(N stage), and found that LONT exhibited superior predictive performance compared to N stage. In the training set, the AUC for Model 1 at 1-, 3-, and 5-years CSS were 0.700, 0.727, and 0.738, respectively, whereas the AUC for Model 2 were 0.684, 0.725, and 0.727, respectively. In the testing set, Model 1 yielded AUC of 0.653, 0.663, and 0.659, whereas Model 2 produced AUC of 0.642, 0.659, and 0.656 for 1-, 3-, and 5-years CSS, respectively (Figure 4). To further evaluate the performance of the RSF models, we generated Decision Curve Analysis (DCA) plots (Figure 5) and calibration curves (Figure 6). The calibration plots showed high consistency between the predicted and observed survival probabilities, with all curves closely aligned with the diagonal line, indicating good calibration of the models. The DCA results demonstrated a higher net benefit across a wide range of threshold probabilities, supporting the clinical utility of the RSF models in individualized risk prediction.
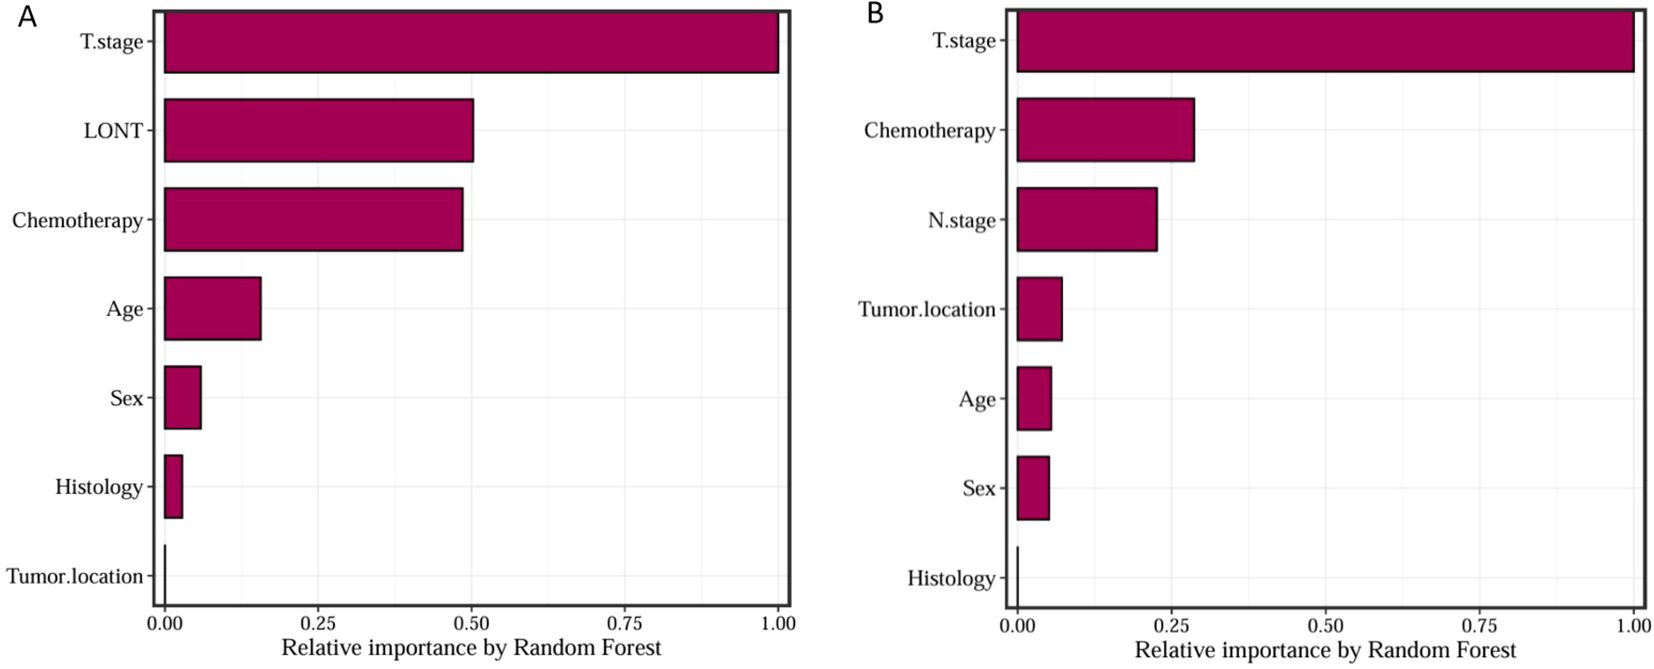
Figure 3. Random Survival Forest model variable relative importance for Model1 (A) and Model2 (B).
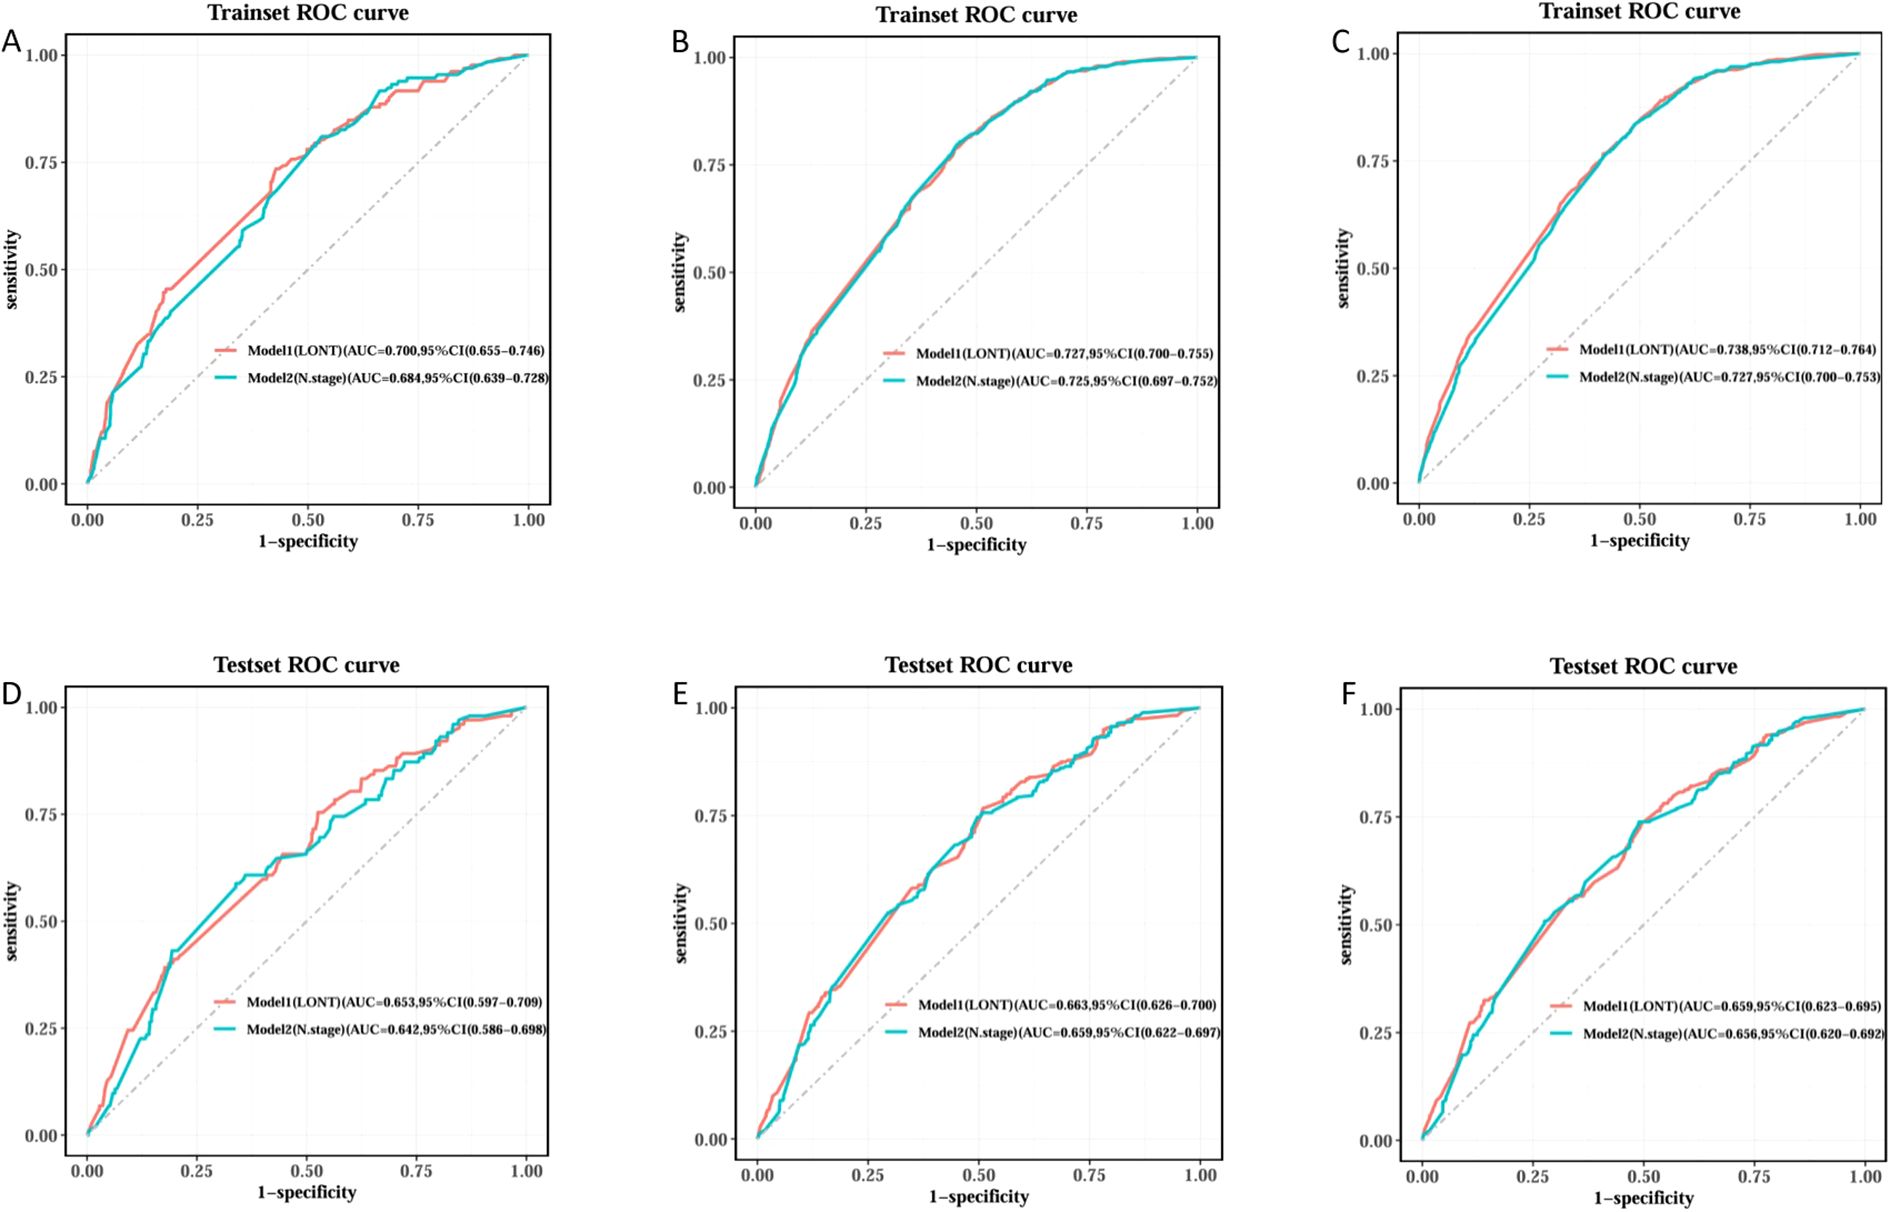
Figure 4. ROC curve comparison of Model1 and Model2 Random Survival Forest model in training and testing sets. Trainset ROC curve in 1 year (A), 3 years (B) and 5 years (C). Testing set ROC curve in 1 year (D), 3 years (E) and 5 years (F).
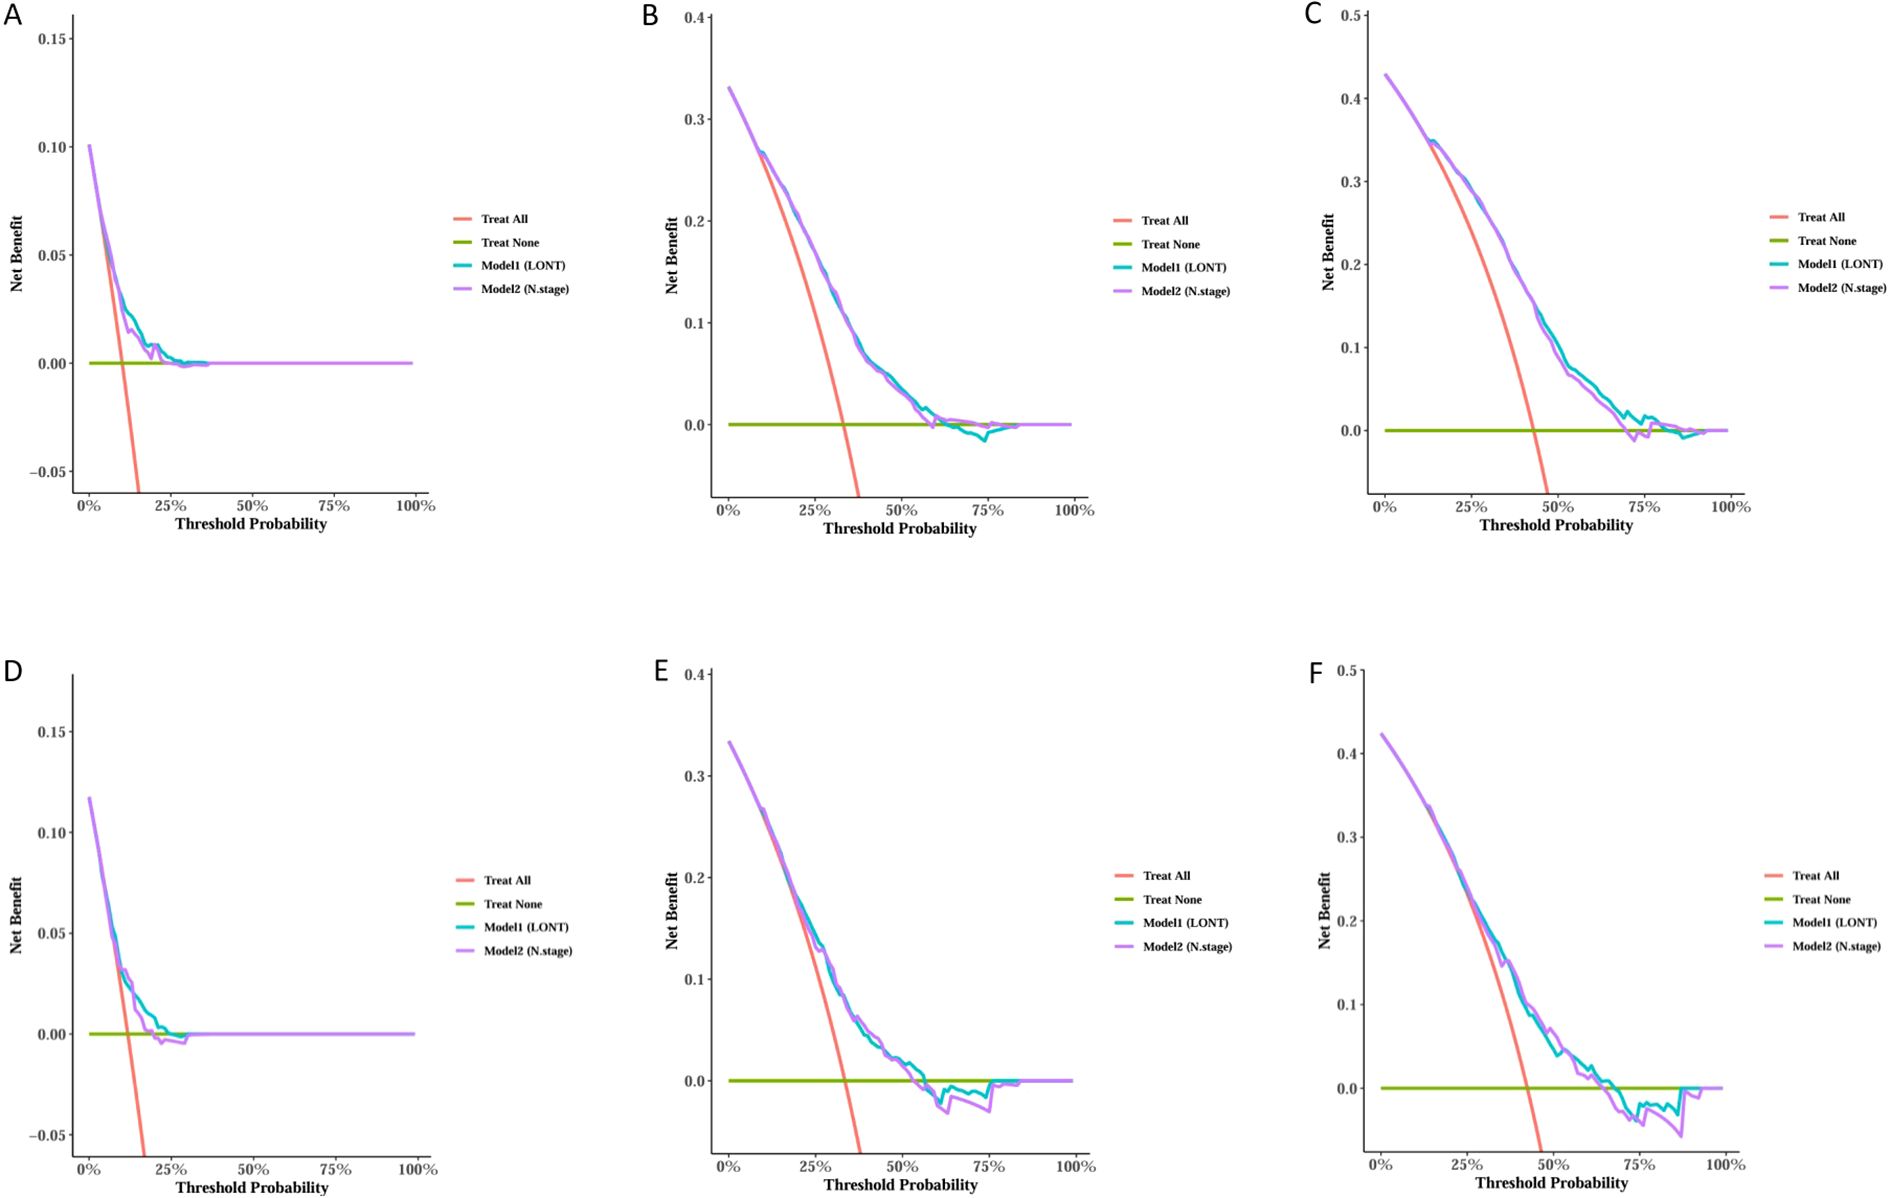
Figure 5. Decision Curve Analysis (DCA) for 1, 3, and 5-years predictions in the Training and Testing sets. Trainset DCA curve in 1 year (A), 3 years (B) and 5 years (C). Testing set DCA curve in 1 year (D), 3 years (E) and 5 years (F).
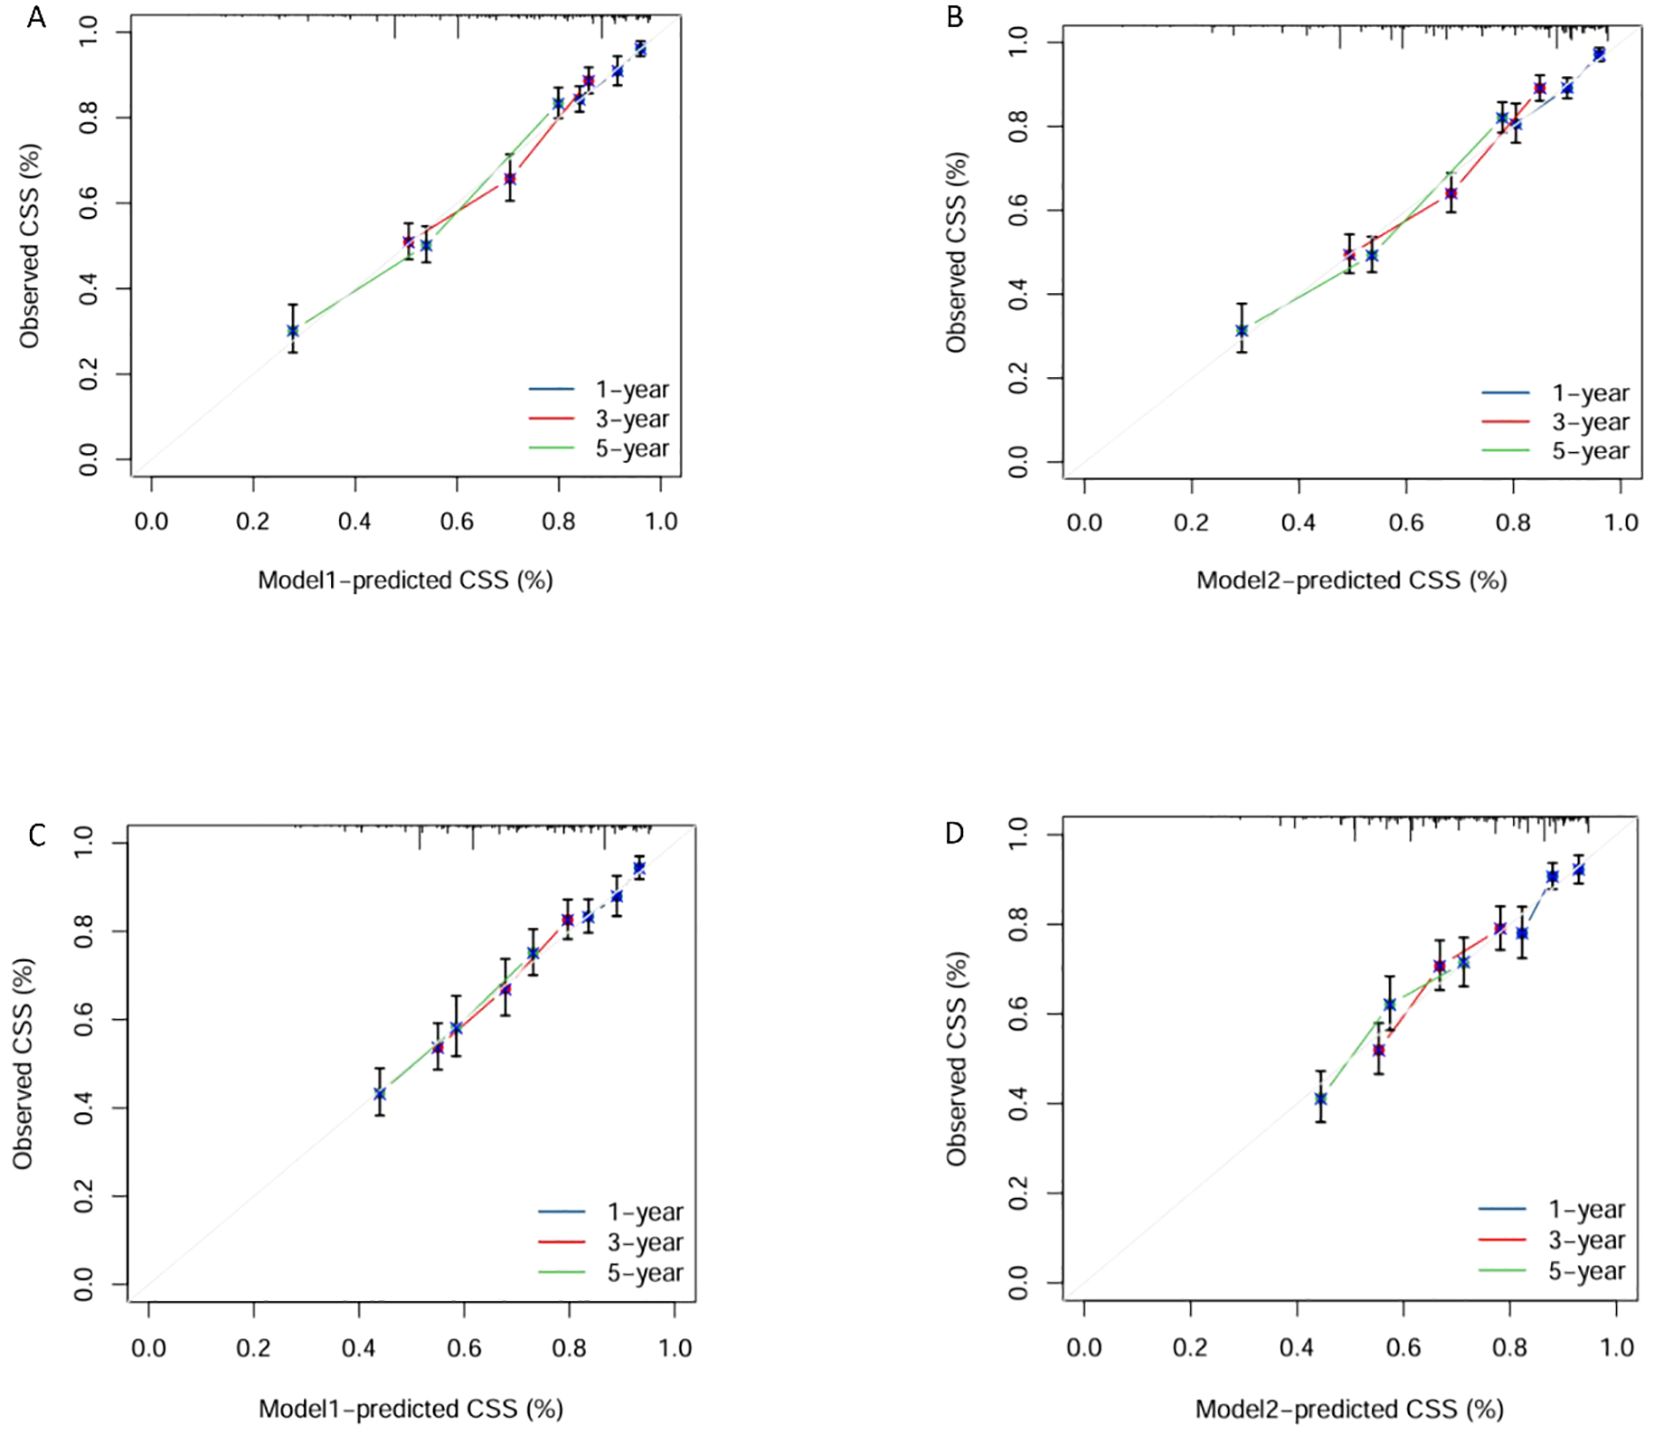
Figure 6. Calibration Plots of Model1 and Model2 for 1, 3, and 5-years survival predictions in the training and testing sets. Calibration plots of training set in Model1 (A) and Model2 (B). Calibration plots of testing set in Model1 (C) and Model2 (D).
Survival analysis
Based on the median predicted risk scores from the RSF models of Model 1(LONT) and Model2(N stage), patients were stratified into high-risk and low-risk groups. Kaplan–Meier survival curves demonstrated that patients in the high-risk group had significantly shorter CSS compared to those in the low-risk group (p < 0.0001) (Figure 7).
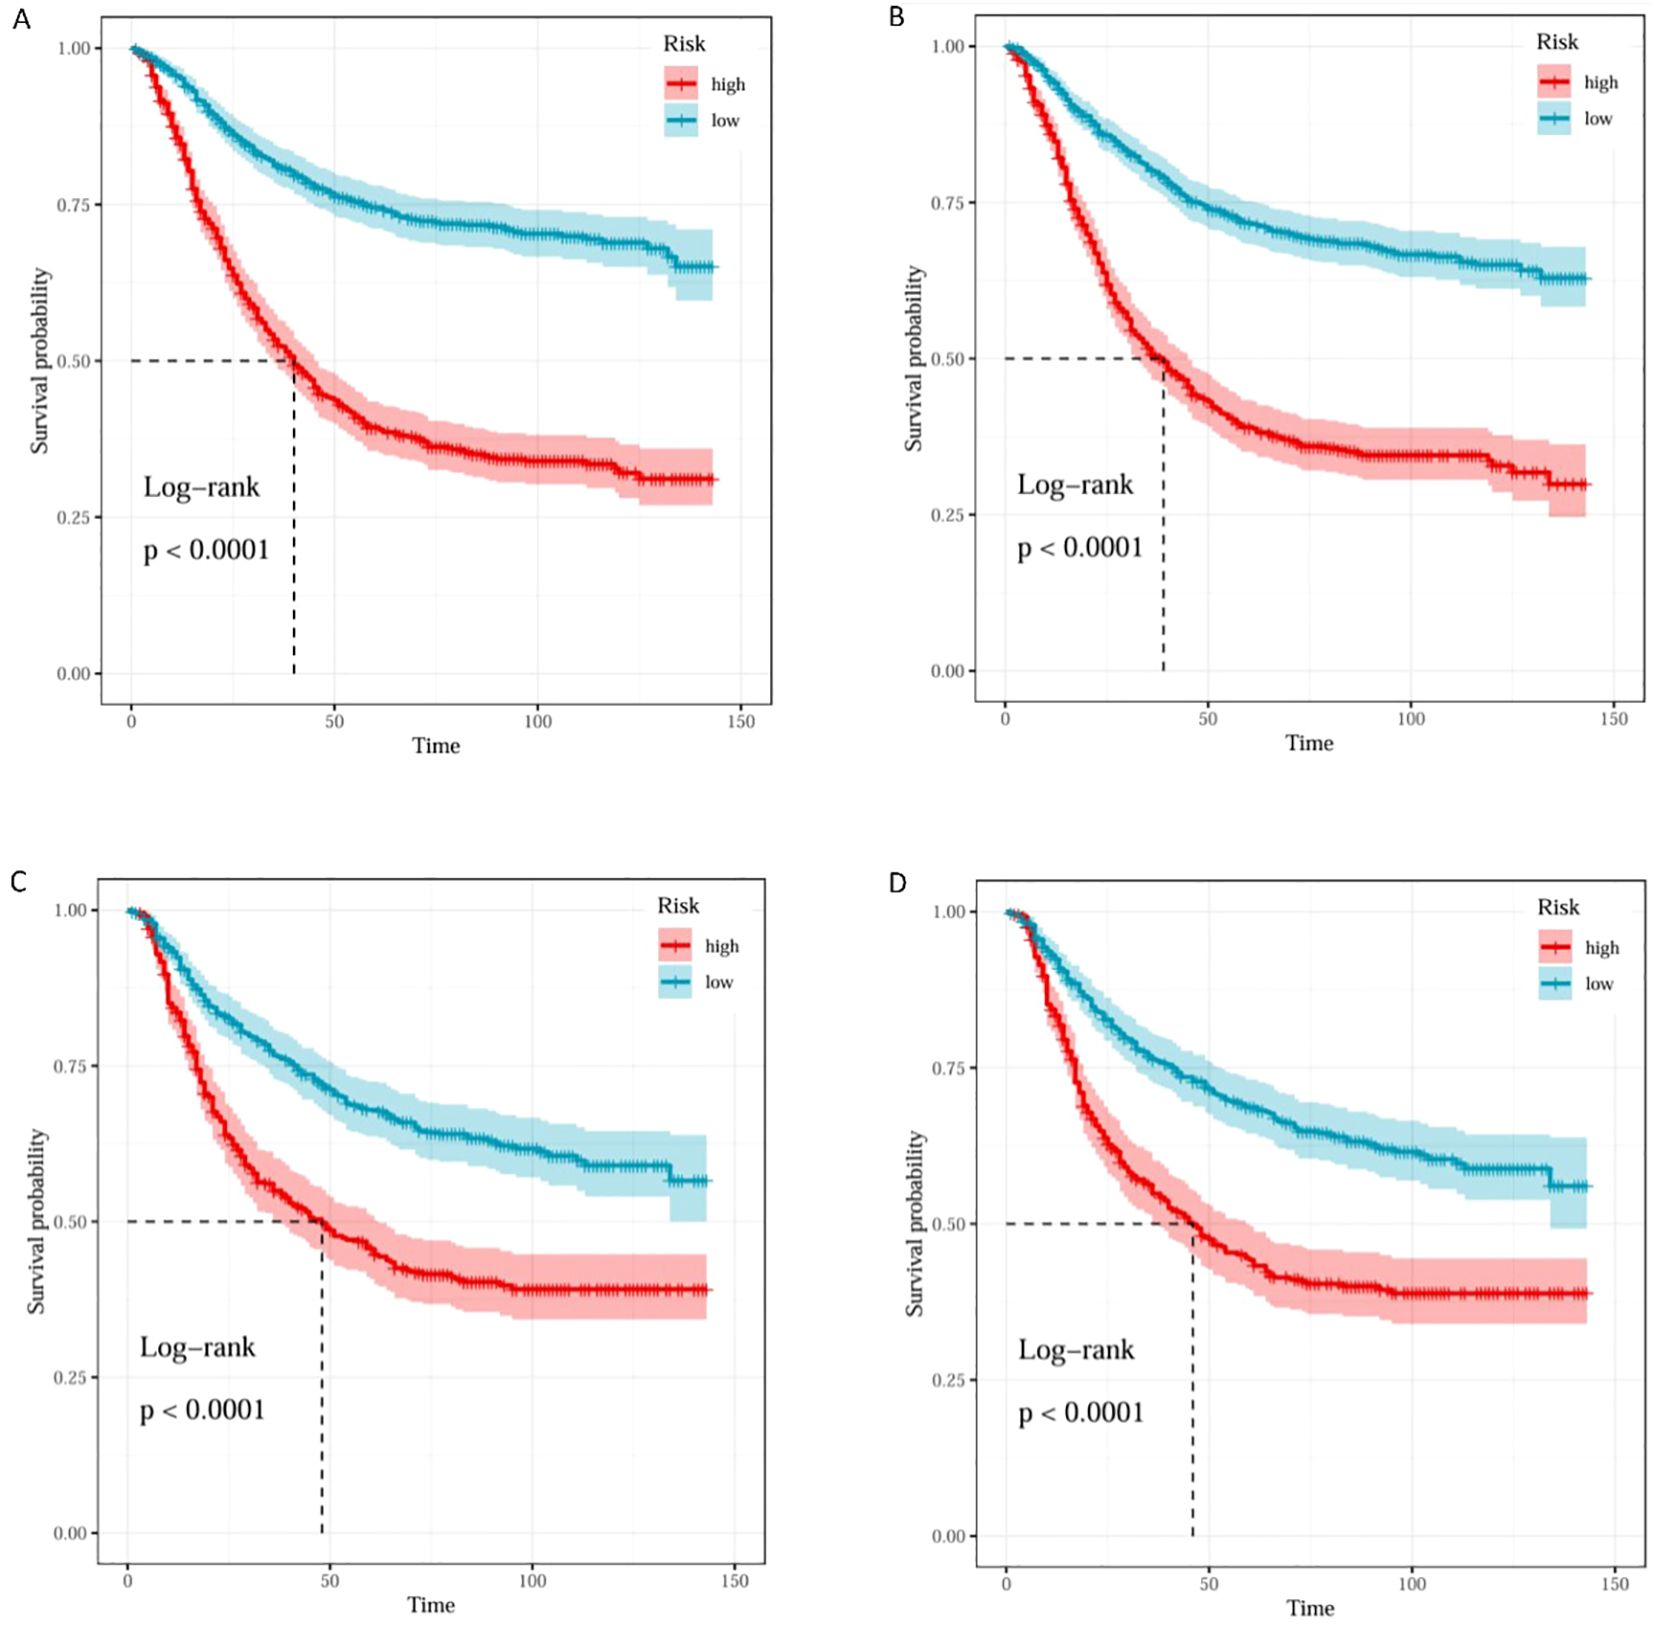
Figure 7. K–M curves of Model1 and Model2 for risk stratification in the training and testing sets. K–M curves of training set in Model1 (A) and Model2 (B). K–M curves of testing set in Model1 (C) and Model2 (D).
Web-based calculator
We developed an interactive web-based tool incorporating the LONT index, enabling users to input patient-specific clinicopathological variables to rapidly estimate individualized CSS and survival trends (Figure 8). This tool was designed to translate our research findings into an intuitive and practical clinical application, providing clinicians with a convenient method for postoperative prognostic assessment and aiding in personalized clinical decision-making. The link to web-based tool is https://hlhmedianaranja.shinyapps.io/dynnomapp/. Patients can access the web-based tool and select either the “Survival Plot” or “Predicted Survival” tab at the top of the page to generate a predicted survival curve or a point estimate of survival probability with a 95% confidence interval, respectively. After entering individual clinical and pathological characteristics using the dropdown menus, users can click the “Predict” button in the lower-left corner to generate the corresponding graphical output(Supplementary Figure S3).
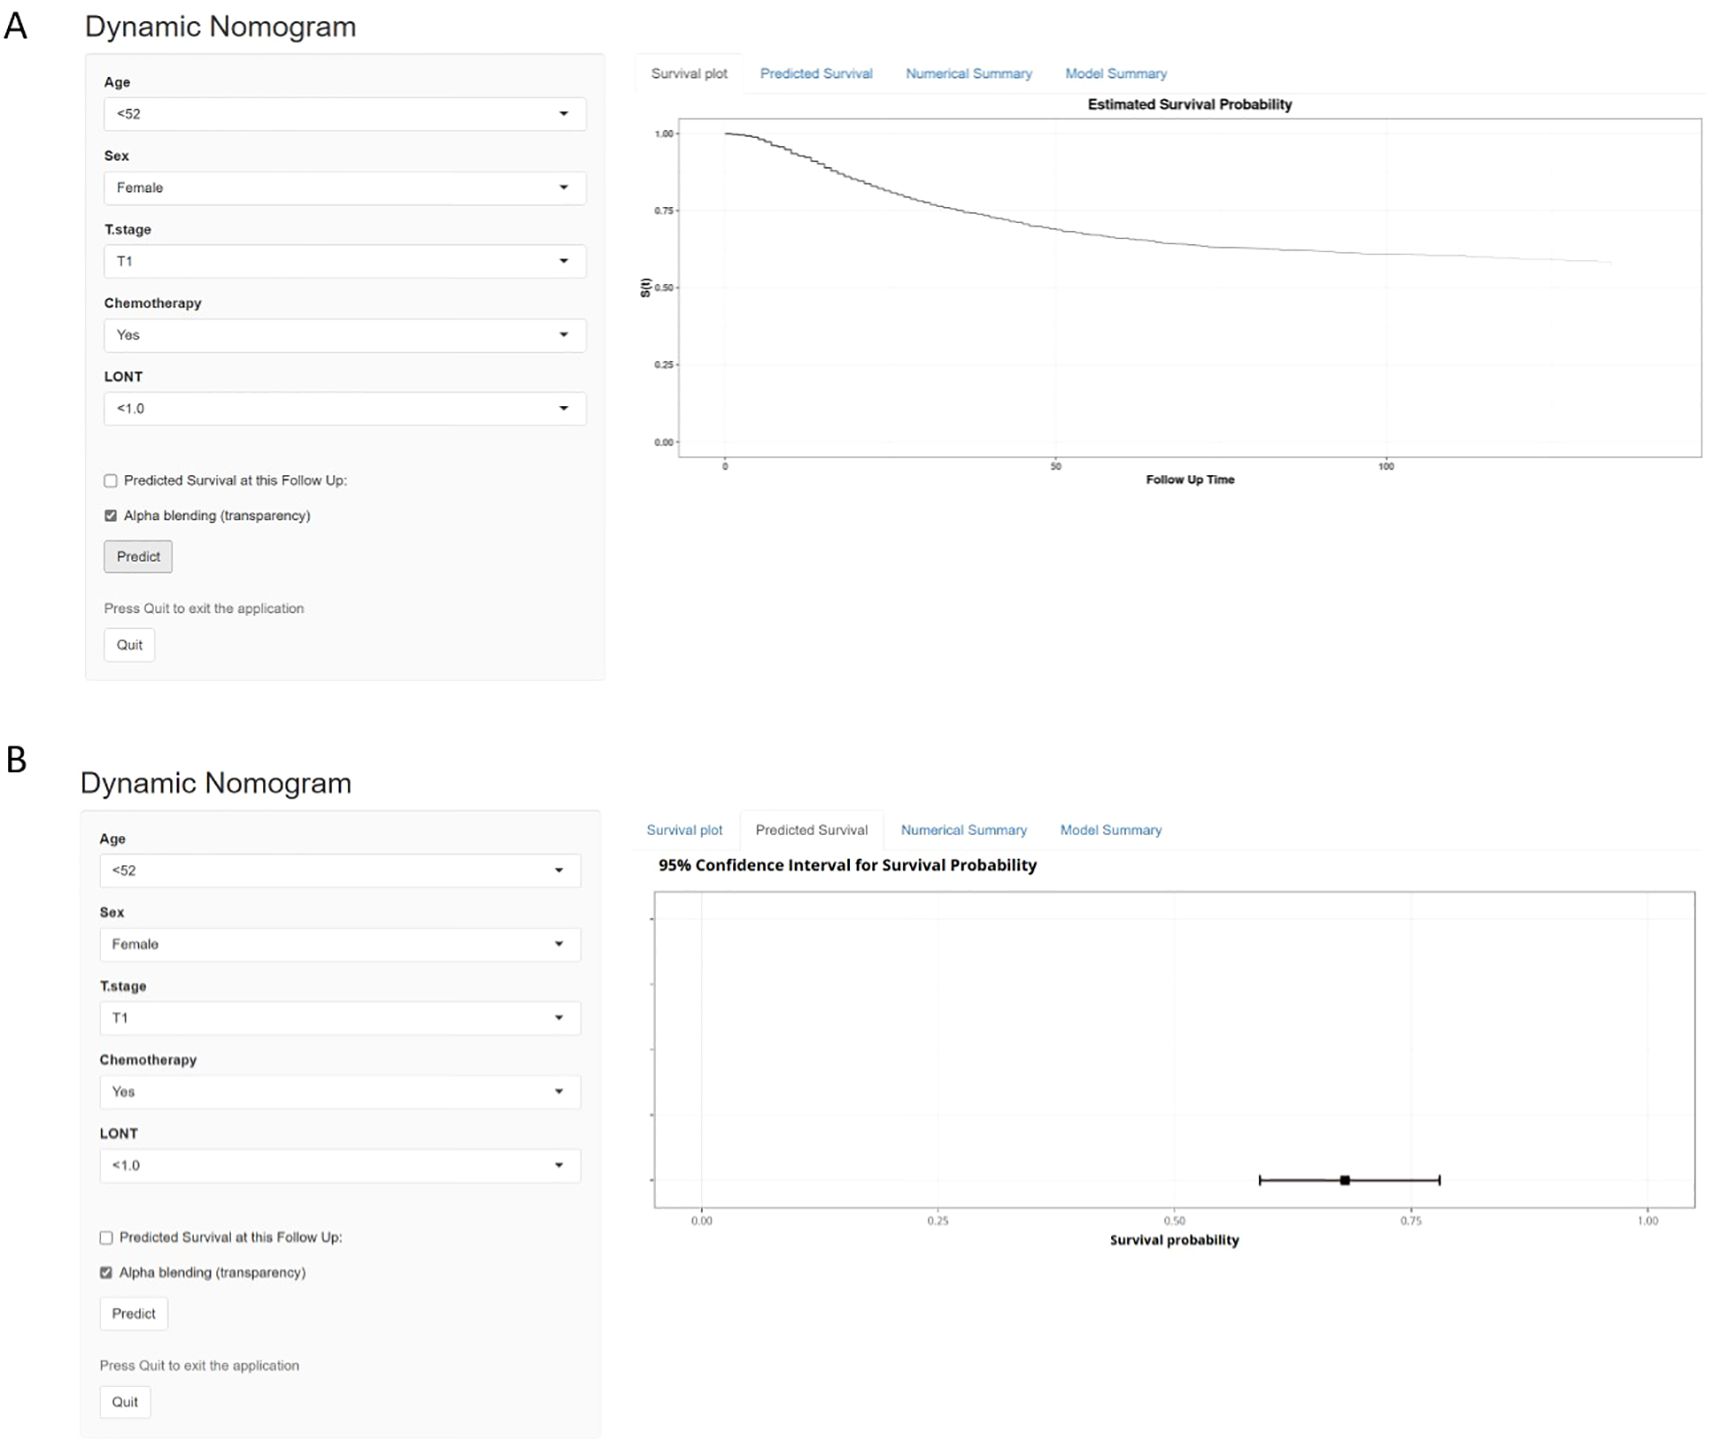
Figure 8. A Web-Based dynamic nomogram calculator. (A) displays the predicted survival curve over time. (B) provides the estimated survival probability.
Discussion
In recent years, the log odds of negative lymph nodes/T stage ratio (LONT) has emerged as a novel prognostic marker for evaluating postoperative outcomes in cancer patients, demonstrating significant predictive value (13, 15). Several studies have confirmed a strong association between LONT and tumor progression or prognosis in various cancers (10, 12, 13, 16). However, to our knowledge, no studies have yet explored the prognostic significance of LONT in postoperative esophageal cancer (EC) patients. Therefore, this study investigates the role of LONT as an independent prognostic factor in postoperative EC patients with T1~3N0~2M0 stage, and based on the LONT metric, we developed an interactive web-based tool for dynamic survival prediction.
Increasing attention is being paid to the prognostic significance of negative lymph nodes (NLN) in EC patients. Previous studies have demonstrated that more than three NLNs were associated with improved survival in EC patients (17), while Tang JM identified NRLN > 21 as an independent prognostic factor after surgery in EC patients (18). These findings underscore the potential importance of NLN count in EC prognosis, as it may reflect both the thoroughness of lymphadenectomy and the patient’s immune status. Previous research has also established T stage as a key indicator of tumor aggressiveness and a critical guide for treatment planning (9). Given the prognostic relevance of both NLN and T stage, recent studies have proposed LONT as a novel composite index to better assess the extent of lymph node dissection (LND) and improve individualized prognosis evaluation in cancer patients (12, 13, 16, 19). In the RSF model of this study, although T stage was the strongest predictor, LONT—by incorporating the number of negative lymph nodes—reflects the thoroughness of lymph node dissection and the host immune status, thus providing additional information beyond T stage alone and further improving the model’s predictive performance. Traditional N stage classifies nodal involvement solely based on the number of positive lymph nodes (PLN), without accounting for NLN. As a result, even with identical PLN counts, the total number of examined lymph nodes (ELN) may vary, potentially reflecting differences in actual tumor burden (20). Hence, pN stage may not provide a comprehensive assessment of survival risk. In contrast, LONT combines NLN with T stage, adjusting the NLN ratio according to tumor depth. This allows for a more consistent reflection of lymph node dissection and associated prognostic risk across TNM stage (21). This approach may help address limitations of the TNM stage system and provide a more personalized risk stratification for patients.
In summary, the clinical rationale for LONT is supported on multiple levels. First, the number of NLNs serves as an indirect indicator of the thoroughness and quality of lymphadenectomy. A higher NLN count generally reflects more extensive regional lymph node dissection, which enhances the accuracy of assessing the true metastatic status (22). Second, the NLN count has been recognized as an important prognostic factor for cancer survival. Previous studies suggest that its predictive value may be linked to the host immune response to tumor cells and the molecular characteristics of the cancer itself (23, 24). Moreover, by integrating NLN count with T stage, LONT dynamically adjusts the prognostic weight of NLNs based on tumor invasion depth. This allows for more consistent and reliable risk stratification across different TNM stage (25). Therefore, LONT may overcome the limitations of conventional pN stage, which ignores NLN information. It offers a more comprehensive assessment of prognosis by capturing surgical quality, host immune status, and tumor burden. In this study, LONT outperformed traditional N stage in predicting 1-, 3-, and 5-years cancer-specific survival (CSS) in EC patients, with particularly strong predictive power at the 1-year mark.
This study offers several strengths. First, the study utilizes the Surveillance, Epidemiology, and End Results (SEER) database, covering a large cohort of postoperative EC patients, thereby enhancing the generalizability and statistical power of the findings. Second, it is the first to demonstrate the prognostic value of the LONT metric in EC patients. Third, we developed a dynamic web-based tool for survival prediction to assist clinicians in postoperative follow-up and individualized treatment planning. Naturally, this study also has certain limitations. First, this study is based solely on SEER data, and although internal validation was performed, the lack of external, independent cohort validation limits the generalizability of the model. Future studies should validate the model in external populations and real-world clinical settings to confirm its robustness and clinical applicability. Second, the retrospective nature of the SEER database may introduce selection bias and unmeasured confounders. Third, the SEER database lacks detailed information on chemotherapy, radiotherapy, targeted therapy, and immunotherapy regimens, which may affect patient outcomes. The absence of these treatment-related variables may limit the accuracy of survival prediction and the comprehensive assessment of LONT’s prognostic value. Finally, both our Cox and RSF models demonstrated moderate discriminatory ability, which may limit their utility as standalone clinical tools. Nevertheless, they may still offer practical value when incorporated into a more comprehensive prognostic framework or applied for preliminary risk stratification in large-scale studies.
Conclusion
Based on the novel prognostic indicator LONT, we developed an interactive web-based tool to predict CSS in postoperative patients with T1~3N0~2M0 esophageal cancer. This online tool provides individualized, quantitative CSS predictions based on patient-specific information, enabling clinicians and patients to better understand disease progression, anticipate treatment outcomes, and set realistic expectations for survival.
Data availability statement
Publicly available datasets were analyzed in this study. This data can be found here: The data used in this study were obtained from the SEER (Surveillance, Epidemiology, and End Results) Program. The data are publicly available and can be accessed via the SEER website. Direct link to the SEER data: (https://seer.cancer.gov/data/). For this study, data were downloaded using the SEERStat software (version 8.4.4), which allows for customized queries and extraction of data from the SEER database.
Ethics statement
Ethical approval was not required for the study involving humans in accordance with the local legislation and institutional requirements. Written informed consent to participate in this study was not required from the participants or the participants’ legal guardians/next of kin in accordance with the national legislation and the institutional requirements.
Author contributions
YL: Software, Investigation, Resources, Funding acquisition, Writing – review & editing, Formal Analysis, Writing – original draft, Validation, Methodology, Data curation, Supervision, Project administration, Visualization, Conceptualization. DC: Project administration, Conceptualization, Methodology, Supervision, Data curation, Writing – review & editing, Writing – original draft, Resources, Investigation, Software, Funding acquisition, Formal Analysis. JL: Writing – original draft, Funding acquisition, Formal Analysis, Supervision, Writing – review & editing, Resources, Methodology, Data curation, Project administration, Investigation, Validation, Conceptualization. YH: Conceptualization, Methodology, Writing – original draft, Investigation, Funding acquisition, Formal Analysis, Project administration. ZH: Project administration, Visualization, Validation, Funding acquisition, Resources, Formal Analysis, Conceptualization, Methodology, Writing – review & editing, Data curation, Software, Writing – original draft, Investigation. MK: Writing – original draft, Formal Analysis, Software, Funding acquisition, Visualization, Resources, Conceptualization, Project administration, Methodology, Data curation, Writing – review & editing, Validation, Investigation.
Funding
The author(s) declare that no financial support was received for the research and/or publication of this article.
Conflict of interest
The authors declare that the research was conducted in the absence of any commercial or financial relationships that could be construed as a potential conflict of interest.
Generative AI statement
The author(s) declare that no Generative AI was used in the creation of this manuscript.
Any alternative text (alt text) provided alongside figures in this article has been generated by Frontiers with the support of artificial intelligence and reasonable efforts have been made to ensure accuracy, including review by the authors wherever possible. If you identify any issues, please contact us.
Publisher’s note
All claims expressed in this article are solely those of the authors and do not necessarily represent those of their affiliated organizations, or those of the publisher, the editors and the reviewers. Any product that may be evaluated in this article, or claim that may be made by its manufacturer, is not guaranteed or endorsed by the publisher.
Supplementary material
The Supplementary Material for this article can be found online at: https://www.frontiersin.org/articles/10.3389/fonc.2025.1619106/full#supplementary-material
Supplementary | Supplementary Figure S1 Optimal Age cut-off determination using X-tile software.
Supplementary | Supplementary Figure S2 Optimal LONT cut-off determination using X-tile software.
Supplementary | Supplementary Figure S3 User interface of the web tool.
References
1. Sung H, Ferlay J, Siegel RL, Laversanne M, Soerjomataram I, Jemal A, et al. Global cancer statistics 2020: GLOBOCAN estimates of incidence and mortality worldwide for 36 cancers in 185 countries. CA Cancer J Clin. (2021) 71:209–49. doi: 10.3322/caac.21660
2. Xie R, Cai Q, Chen T, Huang H, and Chen C. Current and future on definitive concurrent chemoradiotherapy for inoperable locally advanced esophageal squamous cell carcinoma. Front Oncol. (2024) 14:1303068. doi: 10.3389/fonc.2024.1303068
3. Worni M, Martin J, Gloor B, Pietrobon R, D'Amico TA, Akushevich I, et al. Does surgery improve outcomes for esophageal squamous cell carcinoma? An analysis using the surveillance epidemiology and end results registry from 1998 to 2008. J Am Coll Surg. (2012) 215:643–51. doi: 10.1016/j.jamcollsurg.2012.07.006
4. Qiao Y, Zhu J, Han T, Jiang X, Wang K, Chen R, et al. Finding the minimum number of retrieved lymph nodes in node-negative colorectal cancer using Real-world Data and the SEER database. Int J Surg. (2023) 109:4173–84. doi: 10.1097/JS9.0000000000000746
5. Duraker N, Civelek Çaynak Z, and Hot S. The prognostic value of the number of lymph nodes removed in patients with node-negative colorectal cancer. Int J Surg. (2014) 12:1324–7. doi: 10.1016/j.ijsu.2014.10.038
6. Guan X, Jiao S, Wen R, Yu G, Liu J, Miao D, et al. Optimal examined lymph node number for accurate staging and long-term survival in rectal cancer: a population-based study. Int J Surgery. (2023) 109:2241. doi: 10.1097/JS9.0000000000000320
7. Mo J, Chen D, Li C, and Chen M. The significance of negative lymph nodes in esophageal cancer after curative resection: A retrospective cohort study. Cancer Manag Res. (2020) 12:1269–79. doi: 10.2147/CMAR.S232856
8. Sun Y, Hu P, Wang J, Shen L, Xia F, Qing G, et al. Radiomic features of pretreatment MRI could identify T stage in patients with rectal cancer: Preliminary findings. J Magn Reson Imaging. (2018). doi: 10.1002/jmri.25969
9. Ao W, Bao X, Mao G, Yang G, Wang J, and Hu J. Value of apparent diffusion coefficient for assessing preoperative T staging of low rectal cancer and whether this is correlated with ki-67 expression. Can Assoc Radiol J. (2020) 71:5–11. doi: 10.1177/0846537119885666
10. Cai H, Zeng J, Wang Y, Zhuang J, Liu X, and Guan G. Recursive partitioning staging system based on the log odds of the negative lymph node/T stage ratio in colon mucinous adenocarcinoma. Front Immunol. (2024) 15:1472620. doi: 10.3389/fimmu.2024.1472620
11. Xie JB, Pang YS, Li X, and Wu XT. Critical prognostic value of the log odds of negative lymph nodes/tumor size in rectal cancer patients. World J Clin Cases. (2021) 9:3531–45. doi: 10.12998/wjcc.v9.i15.3531
12. Wang X, Wu Y, Li X, Hong J, and Zhang M. Log odds of negative lymph nodes/T stage ratio (LONT): A new prognostic tool for differentiated thyroid cancer without metastases in patients aged 55 and older. Front Endocrinol (Lausanne). (2023) 14:1132687. doi: 10.3389/fendo.2023.1132687
13. Chen T, Zhan X, Chen X, Jiang M, Wan H, Fu B, et al. Predictive value of the log odds of negative lymph nodes/T stage as a novel prognostic factor in bladder cancer patients after radical cystectomy. Front Oncol. (2022) 12:895413. doi: 10.3389/fonc.2022.895413
14. Dietrich S, Floegel A, Troll M, Kühn T, Rathmann W, Peters A, et al. Random Survival Forest in practice: a method for modelling complex metabolomics data in time to event analysis. Int J Epidemiol. (2016) 45:1406–20. doi: 10.1093/ije/dyw145
15. Wang Y, Pan Z, Cai H, Li S, Huang Y, Zhuang J, et al. Prognostic model for log odds of negative lymph node in locally advanced rectal cancer via interpretable machine learning. Sci Rep. (2025) 15:7924. doi: 10.1038/s41598-025-90191-0
16. Yang W, Lu S, Ge F, Hua Y, and Chen X. Prognostic and predictive model of the log odds of the negative lymph node/T stage ratio in resectable gastric adenocarcinoma patients. J Gastrointest Surg. (2022) 26:1743–56. doi: 10.1007/s11605-022-05408-8
17. Zhou L, Zhao Y, Zheng Y, Wang M, Tian T, Lin S, et al. The prognostic value of the number of negative lymph nodes combined with positive lymph nodes in esophageal cancer patients: A propensity-matched analysis. Ann Surg Oncol. (2020) 27:2042–50. doi: 10.1245/s10434-019-08083-3
18. Tang JM, Huang SJ, Chen QB, Wu HS, and Qiao GB. Optimal extent of lymphadenectomy improves prognosis and guides adjuvant chemotherapy in esophageal cancer: A propensity score-matched analysis. World J Gastrointest Surg. (2024) 16:1537–47. doi: 10.4240/wjgs.v16.i6.1537
19. Xie J, Pang Y, Li X, and Wu X. The log odds of negative lymph nodes/T stage: a new prognostic and predictive tool for resected gastric cancer patients. J Cancer Res Clin Oncol. (2021) 147:2259–69. doi: 10.1007/s00432-021-03654-y
20. Chen C, Xia HB, Yuan WW, Zhou MC, Zhang X, and Xu AM. Developing a novel model for predicting overall survival in late-onset colon adenocarcinoma patients based on LODDS: a study based on the SEER database and external validation. Discov Oncol. (2025) 16:99. doi: 10.1007/s12672-025-01849-0
21. Cai B, Zheng M, Li Y, Chen Z, Zhong C, Chen X, et al. Nomogram based on the log odds of negative lymph node/T stage can predict the prognosis of patients with colorectal cancer: a retrospective study based on SEER database and external validation in China. BMJ Open. (2024) 14:e083942. doi: 10.1136/bmjopen-2024-083942
22. Bahardoust M, Torabi S, Yarahmadi D, Kakoienejad MM, Abbasi F, Shamohammadi M, et al. Impact of negative lymph node removal on survival in esophageal cancer: a systematic review and meta-analysis. BMC Surg. (2025) 25:124. doi: 10.1186/s12893-025-02858-0
23. Johnson PM, Porter GA, Ricciardi R, and Baxter NN. Increasing negative lymph node count is independently associated with improved long-term survival in stage IIIB and IIIC colon cancer. J Clin Oncol. (2006) 24:3570–5. doi: 10.1200/JCO.2006.06.8866
24. Schaapveld M, de Vries EGE, van der Graaf WTA, Otter R, de Vries J, and Willemse PHB. The prognostic effect of the number of histologically examined axillary lymph nodes in breast cancer: stage migration or age association? Ann Surg Oncol. (2006) 13:465–74. doi: 10.1245/ASO.2006.02.020
Keywords: esophageal cancer, LONT, RSF, postoperative, SEER
Citation: Lin Y, Chen D, Lu J, Huang Y, Han Z and Kang M (2025) Prognostic value of the log odds of negative lymph nodes/T stage ratio (LONT) in postoperative esophageal cancer: a SEER-based study. Front. Oncol. 15:1619106. doi: 10.3389/fonc.2025.1619106
Received: 27 April 2025; Accepted: 31 July 2025;
Published: 20 August 2025.
Edited by:
Zhen Liu, Zhejiang University, ChinaReviewed by:
Vahur Valvere, North Estonia Medical Centre, EstoniaGang Lin, Peking University, China
Kangping Yang, Second Affiliated Hospital of Nanchang University, China
Copyright © 2025 Lin, Chen, Lu, Huang, Han and Kang. This is an open-access article distributed under the terms of the Creative Commons Attribution License (CC BY). The use, distribution or reproduction in other forums is permitted, provided the original author(s) and the copyright owner(s) are credited and that the original publication in this journal is cited, in accordance with accepted academic practice. No use, distribution or reproduction is permitted which does not comply with these terms.
*Correspondence: Ziyang Han, aGFueml5YW5nOTlAMTYzLmNvbQ==; Mingqiang Kang, bWluZ3FpYW5nX2thbmdAMTI2LmNvbQ==
†These authors have contributed equally to this work