 Rong Li
 Jiehua Lei
- Departments of Ultrasound, The People’s Hospital of Guangxi Zhuang Autonomous Region, Nanning, Guangxi, China
Purpose: This meta-analysis aimed to evaluate the diagnostic performance of artificial intelligence (AI) in ultrasound imaging for the initial diagnosis of malignant ovarian cancer, comparing its performance to that of sonographers.
Methods: A systematic literature search was conducted in PubMed, Web of Science, Embase, and the Cochrane Library up to February 2025. Inclusion criteria targeted studies employing AI algorithms to analyze ultrasound images in patients with suspected ovarian cancer, using pathology as the reference standard. Bivariate random-effects models were utilized to aggregate sensitivity, specificity, and area under the curve (AUC). The methodological quality of the included studies was assessed using a modified version of the Quality Assessment of Diagnostic Accuracy Studies-2 (QUADAS-2) tool.
Results: Eighteen studies encompassing a total of 22,697 total patients/images/lesions were analyzed. AI demonstrated a sensitivity of 0.95 (95% CI: 0.88-0.98) and specificity of 0.95 (95% CI: 0.89-0.98) in internal validation sets, yielding an AUC of 0.98. In external validation, sensitivity was 0.78 (95% CI: 0.56-0.91) and specificity was 0.88 (95% CI: 0.76-0.95), with an AUC of 0.91. In comparison, sonographers exhibited a sensitivity of 0.83 (95% CI: 0.62-0.94), specificity of 0.84 (95% CI: 0.79-0.88), and an AUC of 0.87. These results indicate that ultrasound-based AI significantly outperforms sonographer diagnostics. Meta-regression analysis indicated that the heterogeneity was primarily attributed to the analysis method (image-based vs. patient-based, specificity P = 0.01).
Conclusions: AI based on ultrasound diagnosis demonstrates excellent performance for malignant ovarian cancer detection, with potentially superior performance compared to sonographers. Despite high heterogeneity across studies and the observed publication bias, these results indicate the potential for AI integration into clinical practice. Further studies with external, multicenter prospective head-to-head design are still needed.
Introduction
Ovarian cancer is the deadliest form of cancer affecting the female reproductive system. Its early clinical symptoms are often subtle, leading to diagnosis at advanced stages and resulting in poor prognosis (1, 2). It is the leading cause of mortality among gynecological cancers, surpassing cervical and endometrial cancers in terms of lethality, with a 10-year survival rate of only 35% across all stages (3). The insidious nature of ovarian cancer presents a significant diagnostic challenge, as subtle or non-specific symptoms often result in delayed clinical presentations. Early and accurate diagnosis is pivotal to reducing mortality, improving treatment outcomes, and minimizing unnecessary surgical procedures for patients presenting with ovarian masses.
Conventional diagnostic modalities for ovarian cancer include imaging tools such as computed tomography (CT), magnetic resonance imaging (MRI), serum biomarkers like CA125 and HE4, pathological biopsy, and ultrasound. CT and MRI are common non-invasive methods, but their ability to fully analyze tumor microenvironments is limited because human vision has natural limitations (3, 4). Moreover, variability in radiological interpretation often depends on the expertise of the operator, which adding a layer of subjectivity to diagnostic accuracy. Pathological biopsy, though definitive, is invasive and not always suitable for all patients (5, 6). Serum biomarkers, despite being widely used, often lack specificity, as elevated levels can occur in conditions unrelated to ovarian malignancies (7). Ultrasound, particularly transvaginal ultrasound, has emerged as one of the most accessible and cost-effective tools for ovarian tumor evaluation (5). However, conventional ultrasound diagnostics primarily rely on morphological imaging and visual assessment, which are significantly influenced by operator-dependent variability. Quantitative data embedded within ultrasound images, which reportedly carry predictive advantages over traditional imaging metrics, often remain underexplored in clinical settings (1, 8). Thus, while these diagnostic methods offer valuable insights, their limitations underscore the urgent need for innovative solutions to improve diagnostic precision and reliability.
Artificial intelligence (AI) has demonstrated remarkable potential in improving diagnostic performance, especially in the analysis of medical imaging such as ultrasound. By leveraging machine learning and deep learning technologies, AI can extract complex patterns from imaging data and provide quantitative assessments of radiographic features that are often imperceptible to the human eye (4, 9). Recent studies have demonstrated that AI-assisted diagnostic performance in ovarian cancer can achieve sensitivity and specificity rates as high as 81% and 92%, which outperforming traditional imaging-based diagnostics (1). AI-based models can enhance the interpretation of ultrasound images by systematically quantifying tumor characteristics such as lesion size, echotexture, and morphological irregularities (8). However, despite their promising potential, AI based on ultrasound applications face significant controversies. First, the generalizability of AI models needs further evaluation, particularly regarding their diagnostic performance in external validation sets (6). Second, the relative diagnostic performance of AI compared to sonographers also requires assessment (10). These challenges underscore the necessity for systematic evaluations to clarify the performance variability of AI-enabled ultrasound diagnostics for ovarian cancer.
Therefore, this meta-analysis aims to systematically assess the diagnostic performance of AI-based ultrasound models for the initial diagnosis of ovarian cancer, and compare its performance to that of sonographers.
Methods
The meta-analysis was conducted in strict accordance with the Preferred Reporting Items for Systematic Reviews and Meta-Analyses of Diagnostic Test Accuracy (PRISMA-DTA) guidelines (11).
Search strategy
A systematic search was conducted across PubMed, Embase, Cochrane Library, and Web of Science up to February 2025. The search strategy integrated three conceptual domains: AI (e.g., “deep learning,” “machine learning”, “ artificial intelligence”), ovarian cancer (e.g., “Ovarian Neoplasms,” “Cancer of the Ovary”), and ultrasound imaging (e.g., “ultrasonography,” “Echography”). Free terms and MeSH headings were combined for comprehensive coverage (Supplementary Table 1). In addition, reference lists of included studies were manually screened. In order to minimize selection bias, the search was updated in March 2025 to include newly published studies.
Inclusion and exclusion criteria
Inclusion criteria were established following the PICOS framework. Population (P): Patients suspected of ovarian malignancy or borderline ovarian tumors, which were classified as the malignant (positive) group in our study. Intervention (I): Application of AI algorithms to predict malignancy using ovarian ultrasound images, including transvaginal, transabdominal and transrectal approaches. Comparison (C): Pathological outcomes was reference standard. Outcomes (O): Studies reporting diagnostic performance metrics, including sensitivity, specificity, and AUC were included. Study design (S): Retrospective or prospective studies published in peer-reviewed journals.
Exclusion criteria encompassed: (1) studies lacking sufficient data to calculate true positive (TP), false positive (FP), false negative (FN), and true negative (TN) values; (2) non-relevant publication types (e.g., case reports, conference abstracts, reviews, meta-analyses, or commentaries); (3) non-English literature; (4) studies utilizing non-ultrasound-based AI methodologies (e.g., CT or MRI); (5) studies employing non-pathological reference standards.
Quality assessment
The methodological quality of the included studies was assessed using a modified version of the Quality Assessment of Diagnostic Accuracy Studies-2 (QUADAS-2) tool (12). To enhance relevance, we integrated specific domain criteria from the Prediction model Risk of Bias Assessment Tool (PROBAST) to replace less applicable components of the original QUADAS-2 framework (13). The revised tool evaluated four domains: participant selection, index test (AI algorithm), reference standard, and analysis. Within each domain, risk of bias and concerns regarding applicability were systematically assessed. Two independent reviewers (X.T. and S.Z.) conducted the assessments using the modified QUADAS-2 tool. Disagreements were resolved through iterative discussions to ensure consensus.
Data extraction
Two independent reviewers (R.L. and J.L.) conducted preliminary screening of titles and abstracts from the remaining literature to assess potential eligibility. Discrepancies in evaluations were resolved through adjudication by a third reviewer (H.Z.). Data extraction items included: author, publication year, country, study design, type of ultrasound, reference standard, analysis, patients/lesions/images per set, number of malignant ovarian cancer patients/lesions/images, AI method, AI model, optimal AI algorithms, data splitting method, the diagnostic matrix for internal and external validation sets, sonographers, scanner modality (system), evaluation time, and frequency (MHz).
For studies included in the systematic review but lacking meta-analyzable data, the research team contacted corresponding authors via email to obtain missing information. As most studies did not report complete diagnostic contingency tables, two methods were employed to construct the contingency table: (1) back-calculating total cases, along with sensitivity, specificity, and the number of malignant ovarian cancer patients based on the reference standard; (2) determining optimal sensitivity and specificity parameters through receiver operating characteristic (ROC) curve analysis using Youden’s index.
Outcome measures
The primary outcome measures included sensitivity, specificity, and AUC from internal validation sets, external validation sets, and sonographer. Sensitivity (also termed recall or true positive rate) quantified the probability of the AI model correctly identifying malignant cases (including both ovarian cancer and borderline ovarian tumors), calculated as TP/(TP+FN). Specificity (true negative rate) represented the model’s ability to accurately identify non-malignant cases, computed as TN/(TN+FP). AUC, derived from the ROC curve, served as a composite metric for diagnostic discriminative performance. For studies reporting multiple contingency tables across datasets (e.g., two external validation cohorts), all independent datasets were extracted. When multiple AI models or algorithms were presented, in order to avoid patient overlap, only the optimal-performing model (highest AUC) from internal/external validation sets or sonographer comparisons was included.
Statistical analysis
Statistical analyses were conducted using a bivariate random-effects model to pool sensitivity and specificity estimates for AI performance across internal validation, external validation, and sonographer datasets (14). Forest plots visually summarized pooled sensitivities and specificities, while SROC curves illustrated combined estimates with 95% confidence intervals (CIs) and prediction intervals. Heterogeneity between studies was quantified using the I2 statistic, with a threshold of 50% indicating possible significant heterogeneity (15). For internal validation datasets (>10 studies with I2 > 50%), subgroup analysis and meta-regression were conducted, evaluating covariates such as study design, analysis type, AI method, ultrasound type, AI model, and optimal AI algorithms. Clinical utility was assessed using Fagan’s nomogram, while publication bias was evaluated via Deeks’ funnel plot asymmetry test (16). The 95% CIs of the AUCs of AI and sonographer were compared. Nonoverlapping 95% CIs between two subgroups indicated a statistically significant difference. All analyses were conducted in Stata 15.1 (Midas package), with statistical significance defined as P < 0.05. Study quality and risk of bias were conducted using RevMan 5.4 (Cochrane Collaboration).
Results
Study selection
A systematic search of four databases identified 302 studies, with 108 duplicates removed, yielding 194 unique records for initial screening. A total of 165 articles were excluded during title/abstract screening due to non-relevant publication types (e.g., case reports, conference abstracts, reviews, meta-analyses, or commentaries) or clearly irrelevant titles/abstracts. Full-text eligibility assessment of the remaining 29 studies excluded 11 additional articles: four lacked extractable diagnostic performance metrics (TP, FP, FN, TN), four utilized non-ultrasound-based AI models, and three employed non-pathological reference standards. Eighteen studies met all criteria for final inclusion (9, 17–32). The selection process adhered to PRISMA guidelines, as detailed in Figure 1.
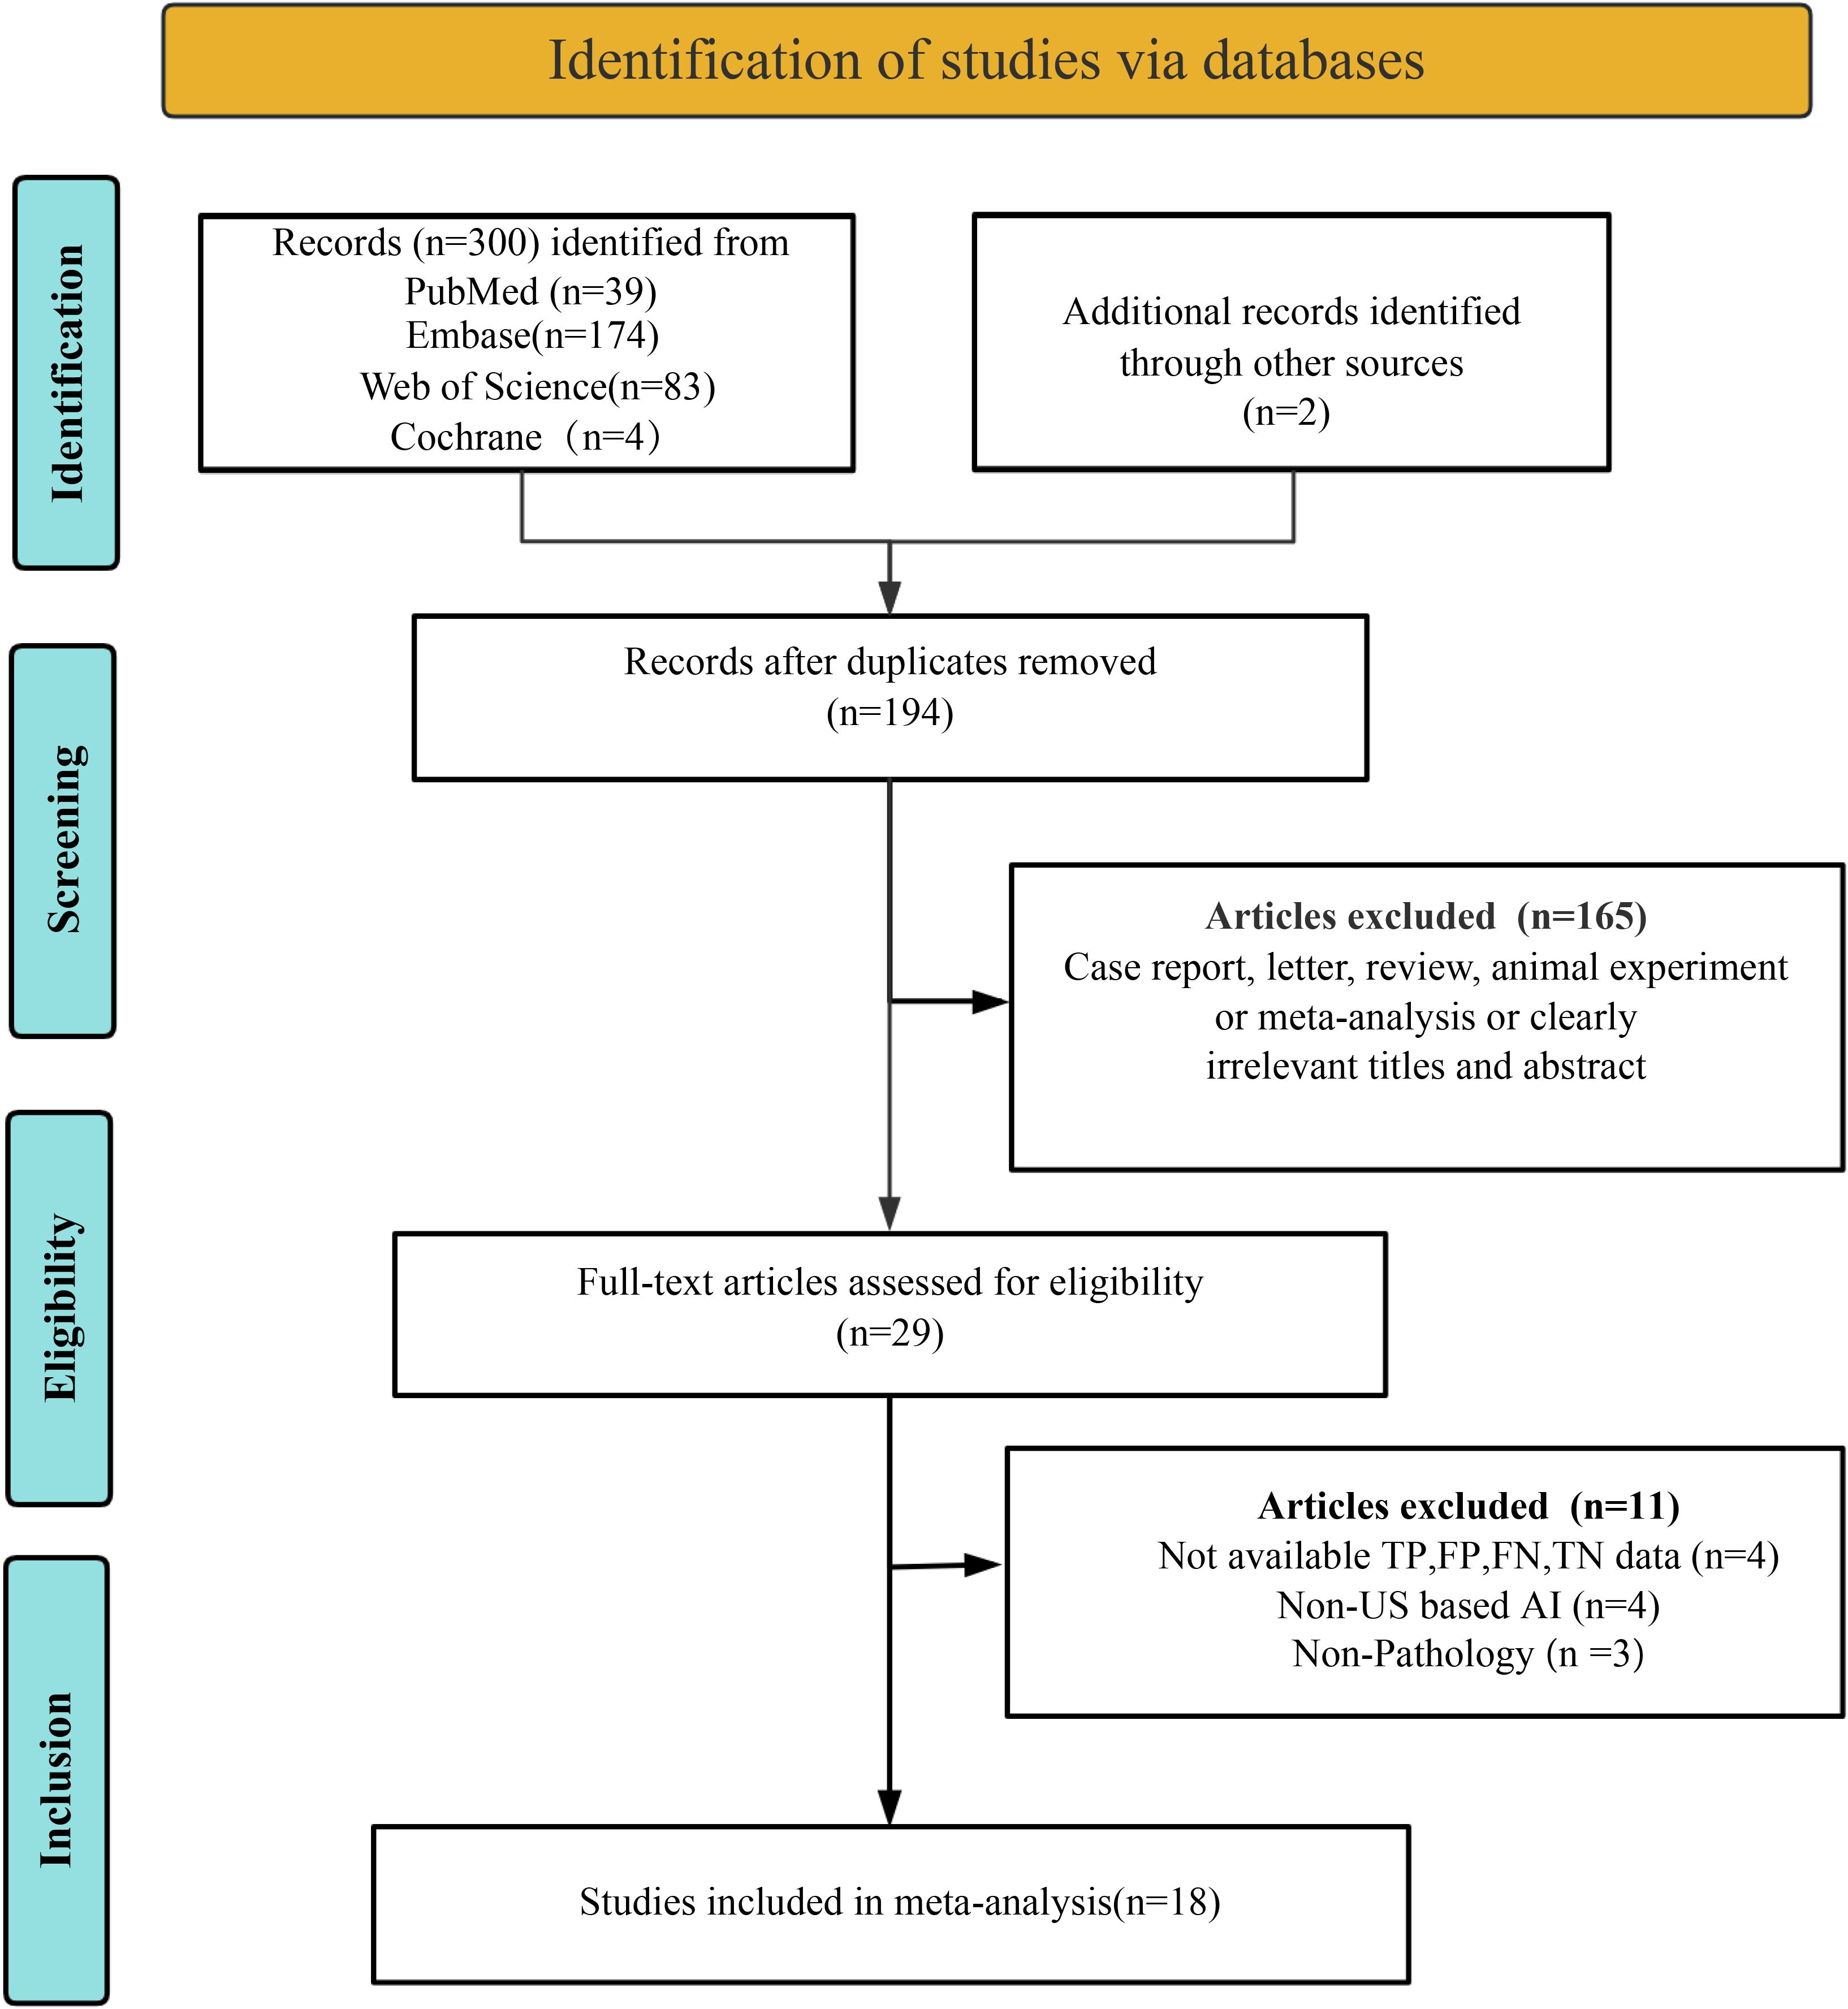
Figure 1. Preferred Reporting Items for Systematic Reviews and Meta-Analyses (PRISMA) flow diagram depicting the study selection process.
Study description and quality assessment
A total of 18 eligible studies were identified, including 17 studies (7, 9, 17–21, 23–32) in the internal validation set with 22,697 total patients/images/lesions(range: 1-7,995), and three studies (9, 17, 22) in external validation involving 2,297 patients(range:2-662). The studies were published between 1999 and 2024. Among them, 13 studies included in the meta-analysis were retrospective (7, 9, 17–19, 21, 23, 26–28, 30–32), while five were prospective (20, 22, 24, 25, 29). Transvaginal ultrasound alone was used in nine studies (18–20, 22, 24, 25, 28, 30, 32), combined transvaginal and transabdominal ultrasound in four (7, 17, 21, 26), transabdominal ultrasound alone in one (31), transvaginal combined with transrectal ultrasound in one (9), and unspecified methods in three studies (23, 27, 29). Radiomic & Clinical AI models were employed in eight studies (7, 20, 22, 24–26, 29, 30), while radiomic models alone were used in ten studies (9, 17–19, 21, 23, 27, 28, 31, 32). Deep learning methods were utilized in eight studies (7, 9, 17, 19, 21, 23, 27, 31), with the remaining ten employing machine learning (18, 20, 22, 24–26, 28–30, 32). Patient-based analysis was conducted in nine studies (7, 9, 17, 19–22, 25, 33), lesion-based in four (18, 24, 29, 30), and image-based in five (23, 27, 28, 31, 32). Study characteristics along with patient demographics and technical details are summarized in Tables 1, 2, and Supplementary Table 2.
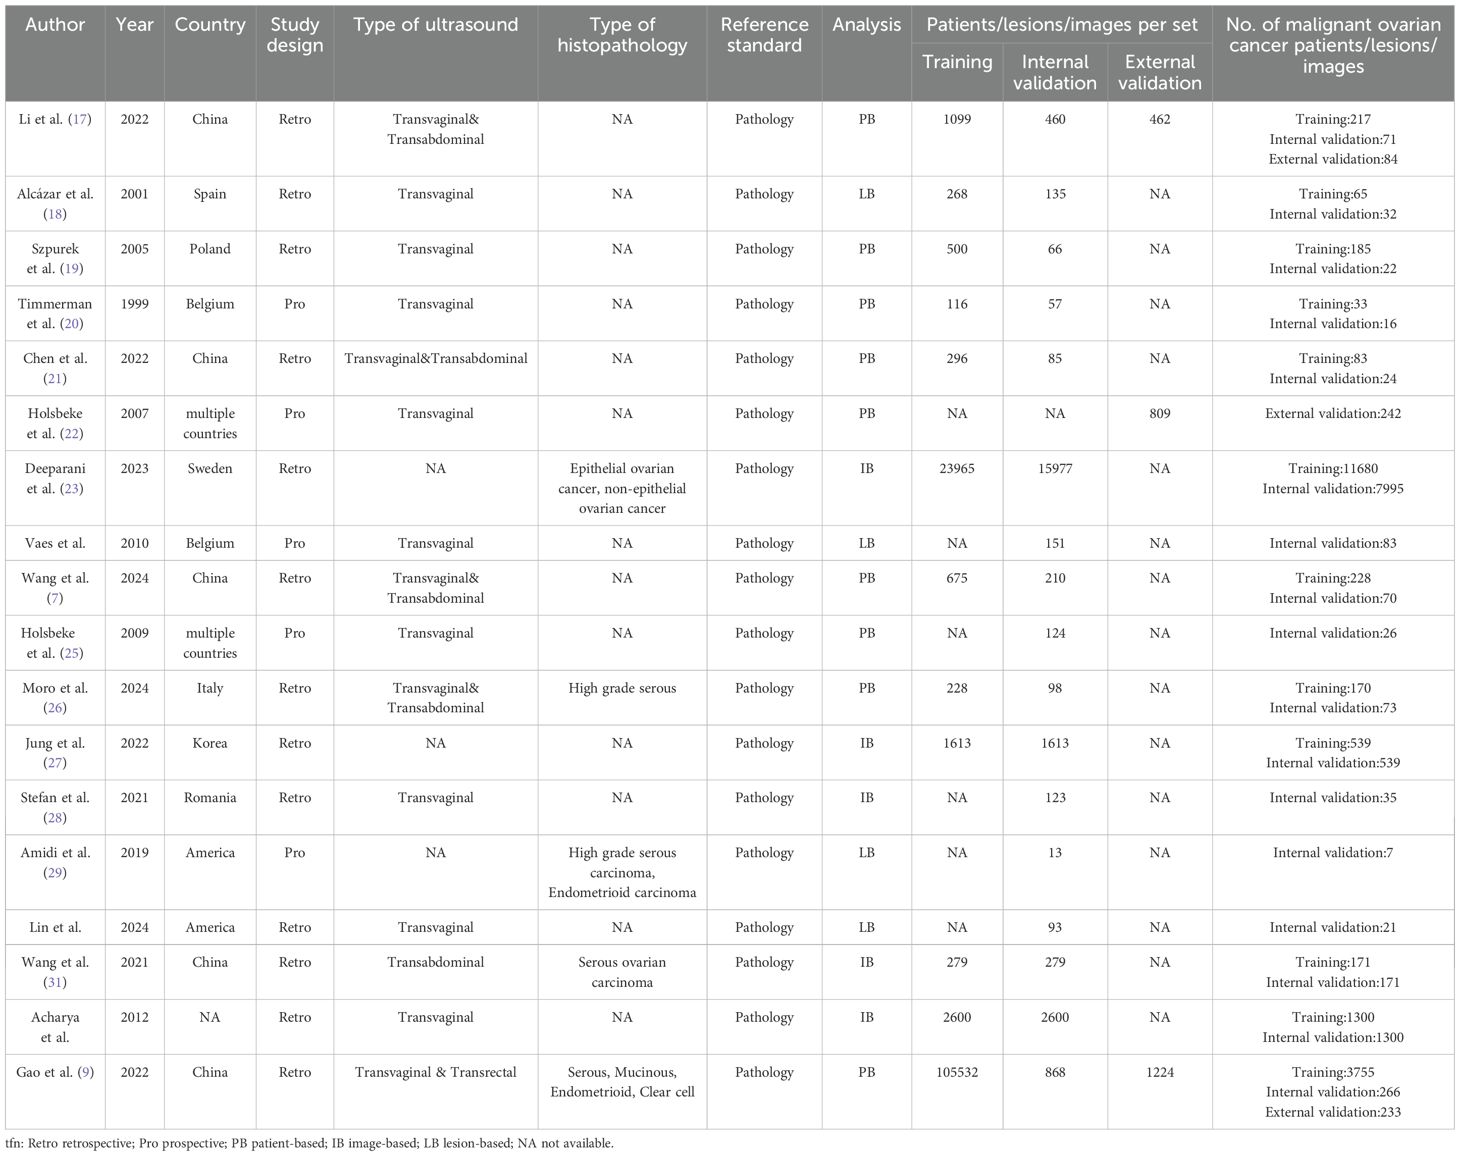
Table 1. Study and patient characteristics of the included studies.
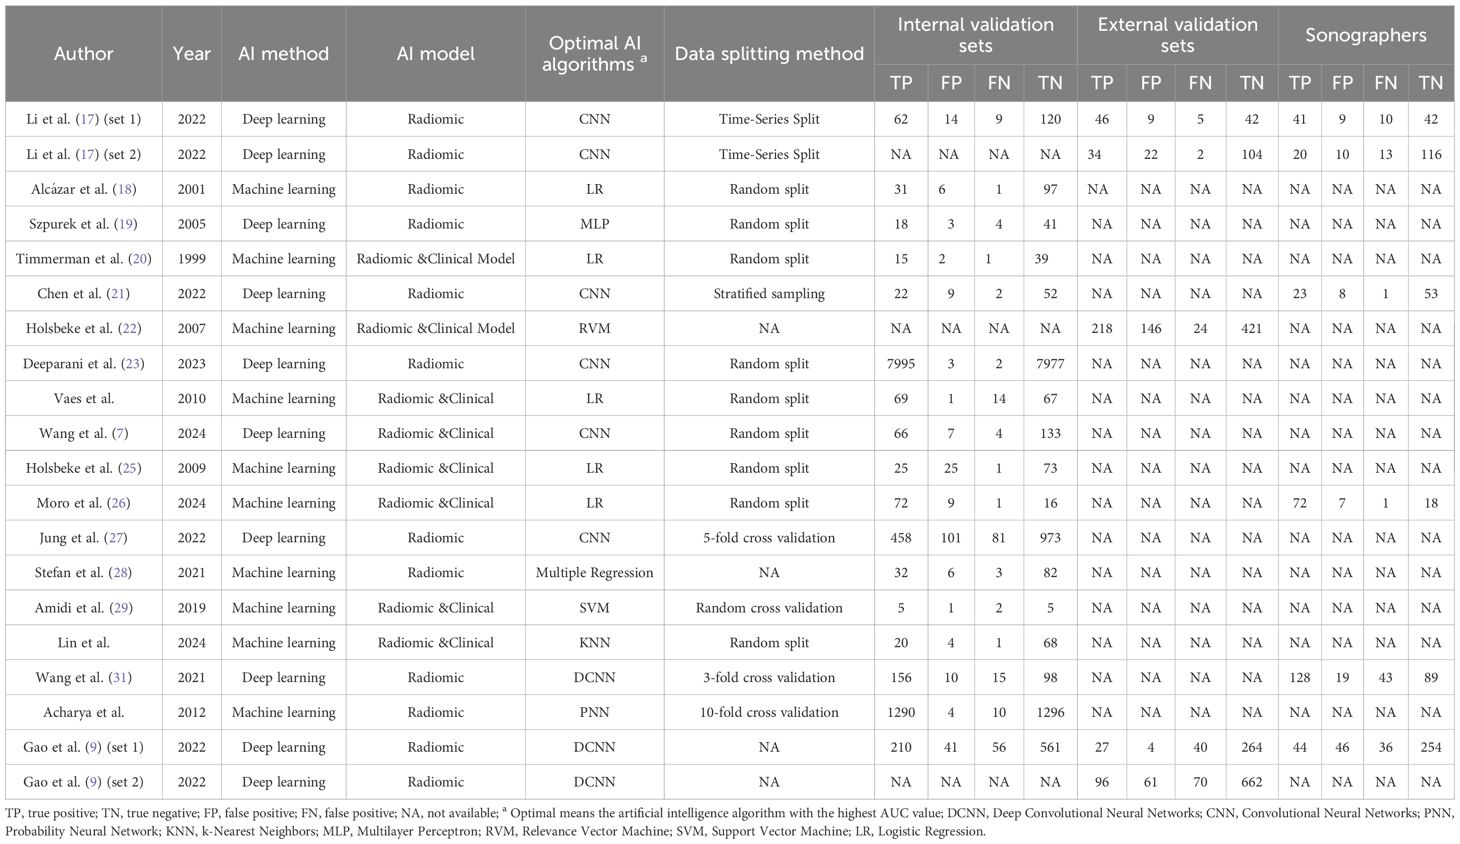
Table 2. Technical aspects of included studies.
The risk of bias assessment using the revised QUADAS-2 tool is shown in Figure 2. Regarding the index test, one study was rated as “high risk” because it only reported the model name without critical training procedures details (18). In the analysis domain, three studies were deemed “high risk” due to the exclusion of participants from specific subgroups or partial cohorts (17, 22, 29). The methodological quality of included studies was deemed acceptable based on overall quality assessment.
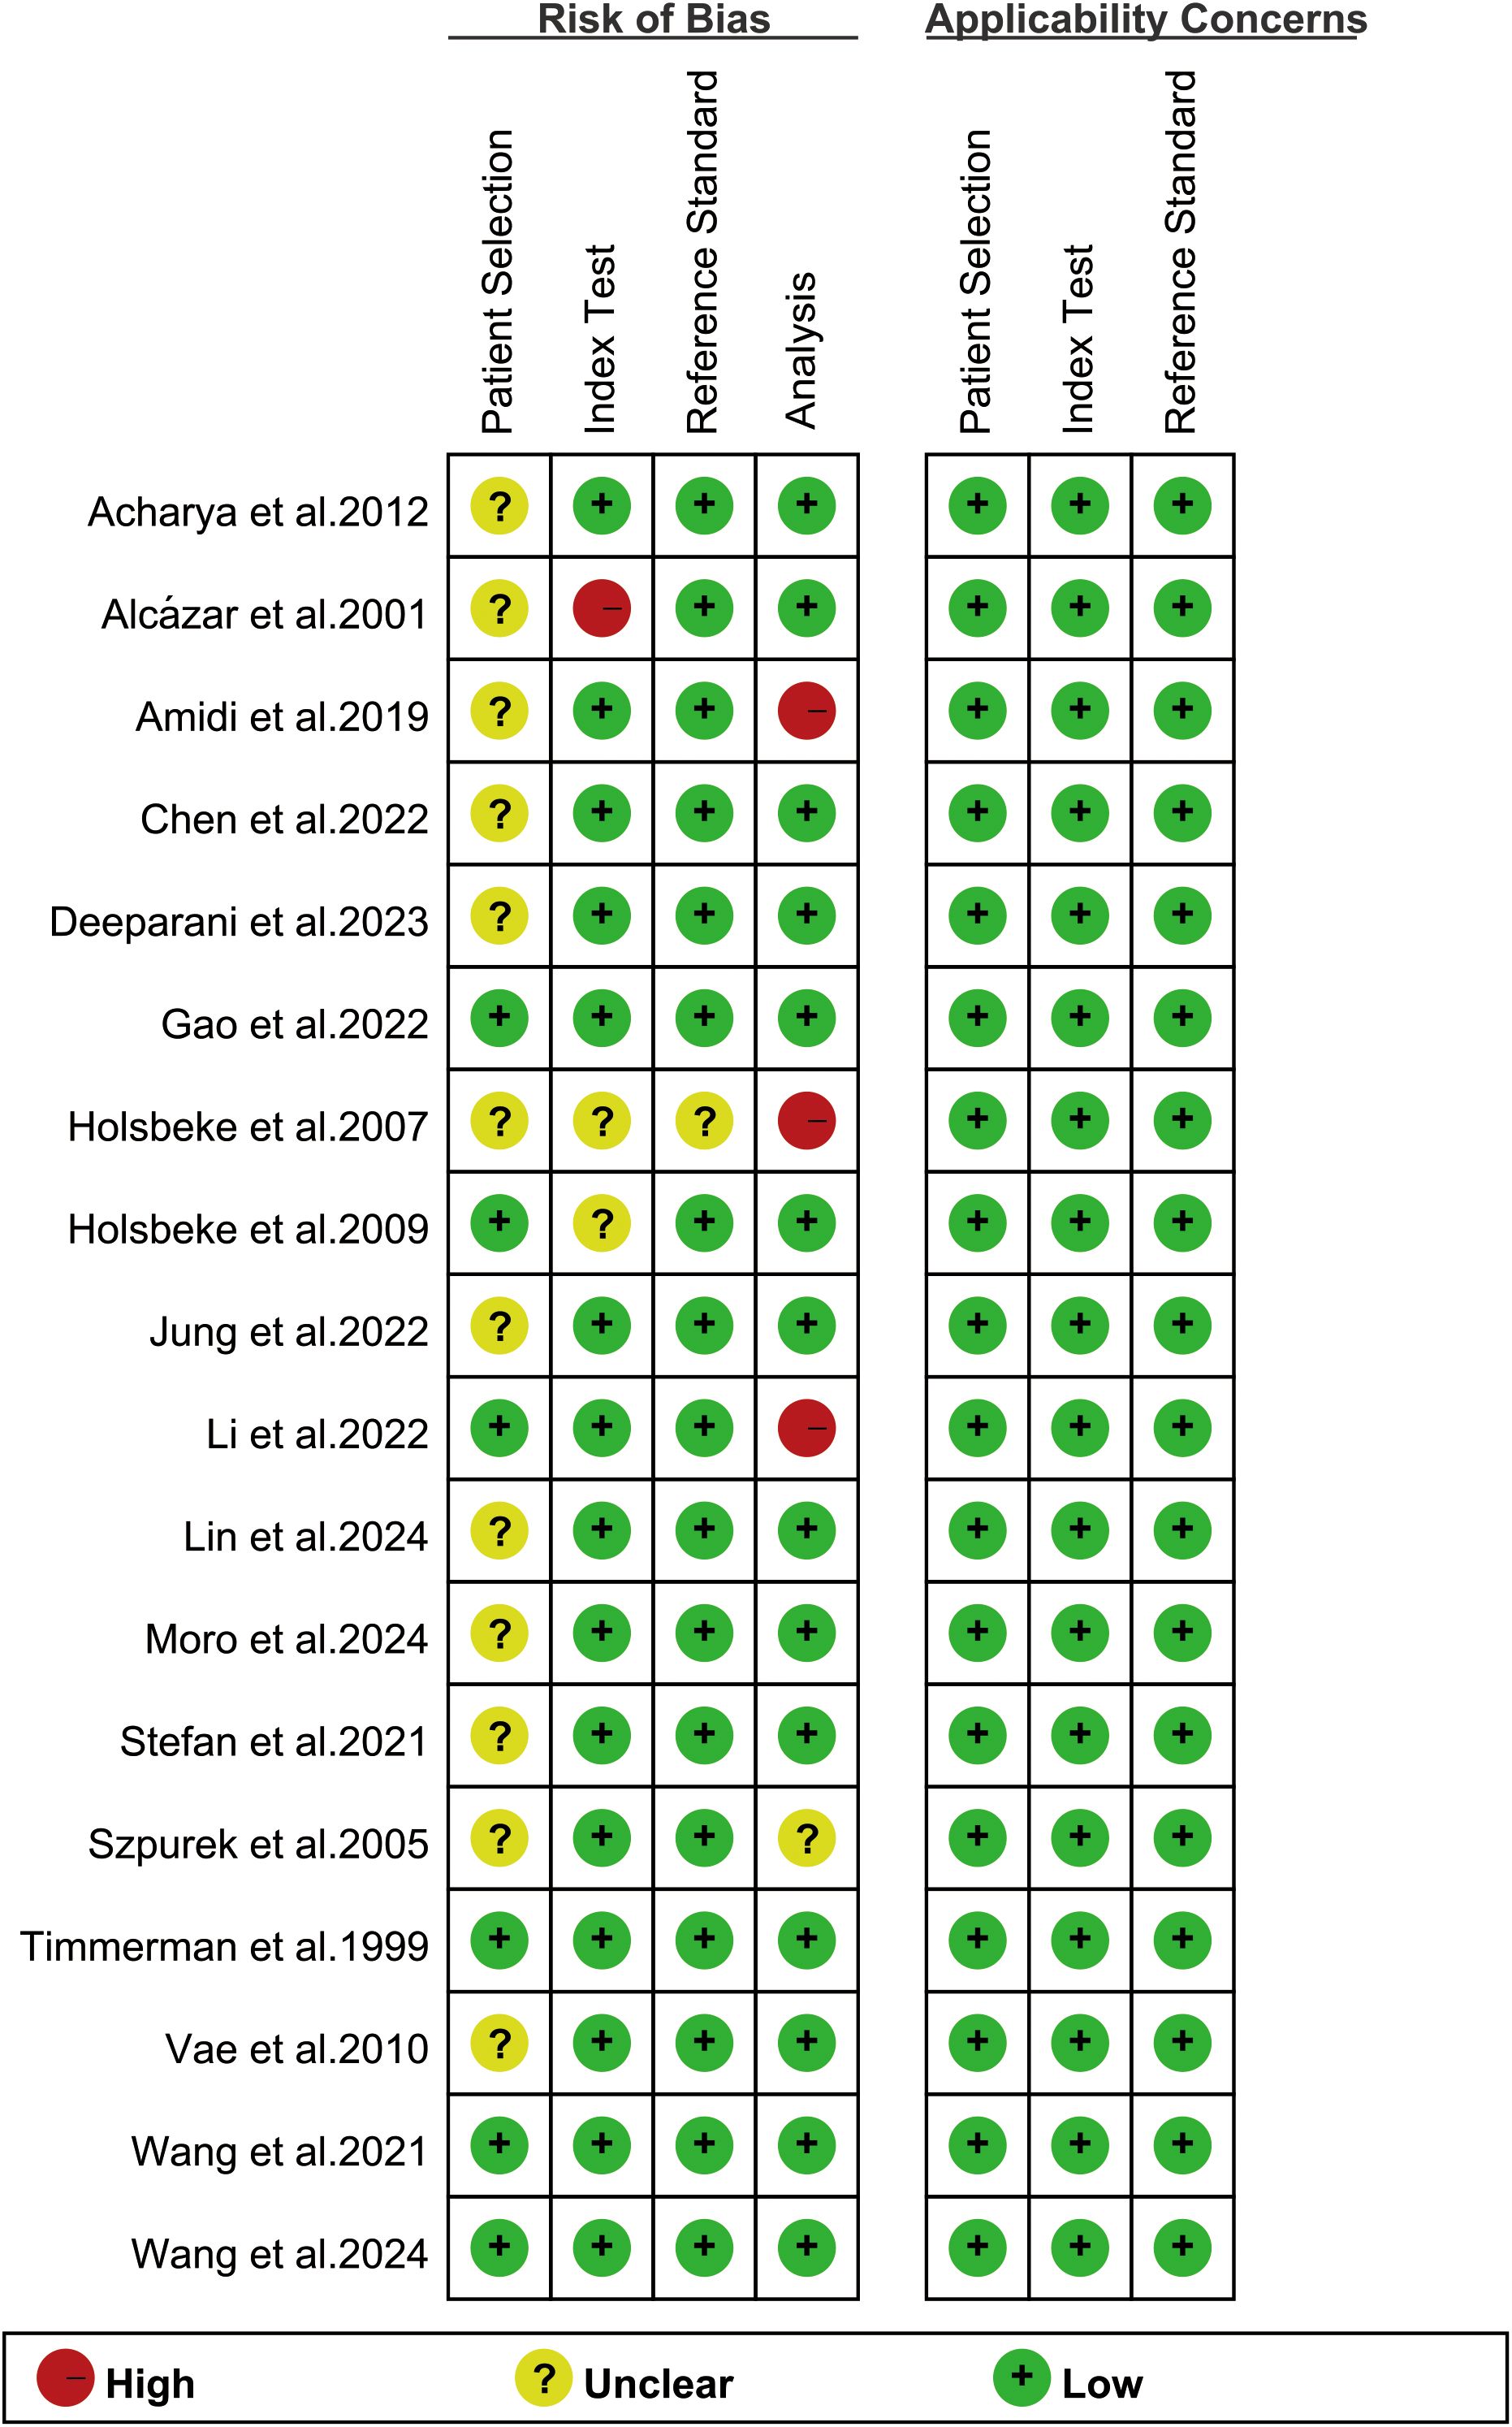
Figure 2. Risk of bias and applicability concerns of the included studies using the revised Quality Assessment of Diagnostic Performance Studies-2 (QUADAS-2) tool.
Diagnostic performance of internal validation sets for AI and sonographers in predicting ovarian malignancy: non-head-to-head comparison
For the internal validation sets, the sensitivity of AI based on ultrasound in detecting ovarian malignancy was 0.95 (95% CI: 0.88-0.98), and the specificity was 0.95 (95% CI: 0.89-0.98) (Figure 3). The AUC was 0.98 (95% CI: 0.97-0.99) (Figure 4a). Using a pretest probability of 20%, the Fagan nomogram showed a positive likelihood ratio of 82% and a negative likelihood ratio of 1% (Figure 5a).
![Forest plot showing sensitivity and specificity for various studies. The left panel depicts sensitivity with blue squares and lines indicating confidence intervals, while the right panel shows specificity with yellow squares and lines. Each study is listed alongside its respective values. Combined results are at the bottom, with sensitivity at 0.95 [0.88 - 0.98], and specificity at 0.95 [0.89 - 0.98]. Heterogeneity statistics are provided at the bottom of each panel.](https://www.frontiersin.org/files/Articles/1626286/fonc-15-1626286-HTML/image_m/fonc-15-1626286-g003.jpg)
Figure 3. Forest plots displaying the sensitivity and specificity of the internal validation sets. Squares denoted the sensitivity and specificity in each study, while horizontal bars indicated the 95% confidence interval.
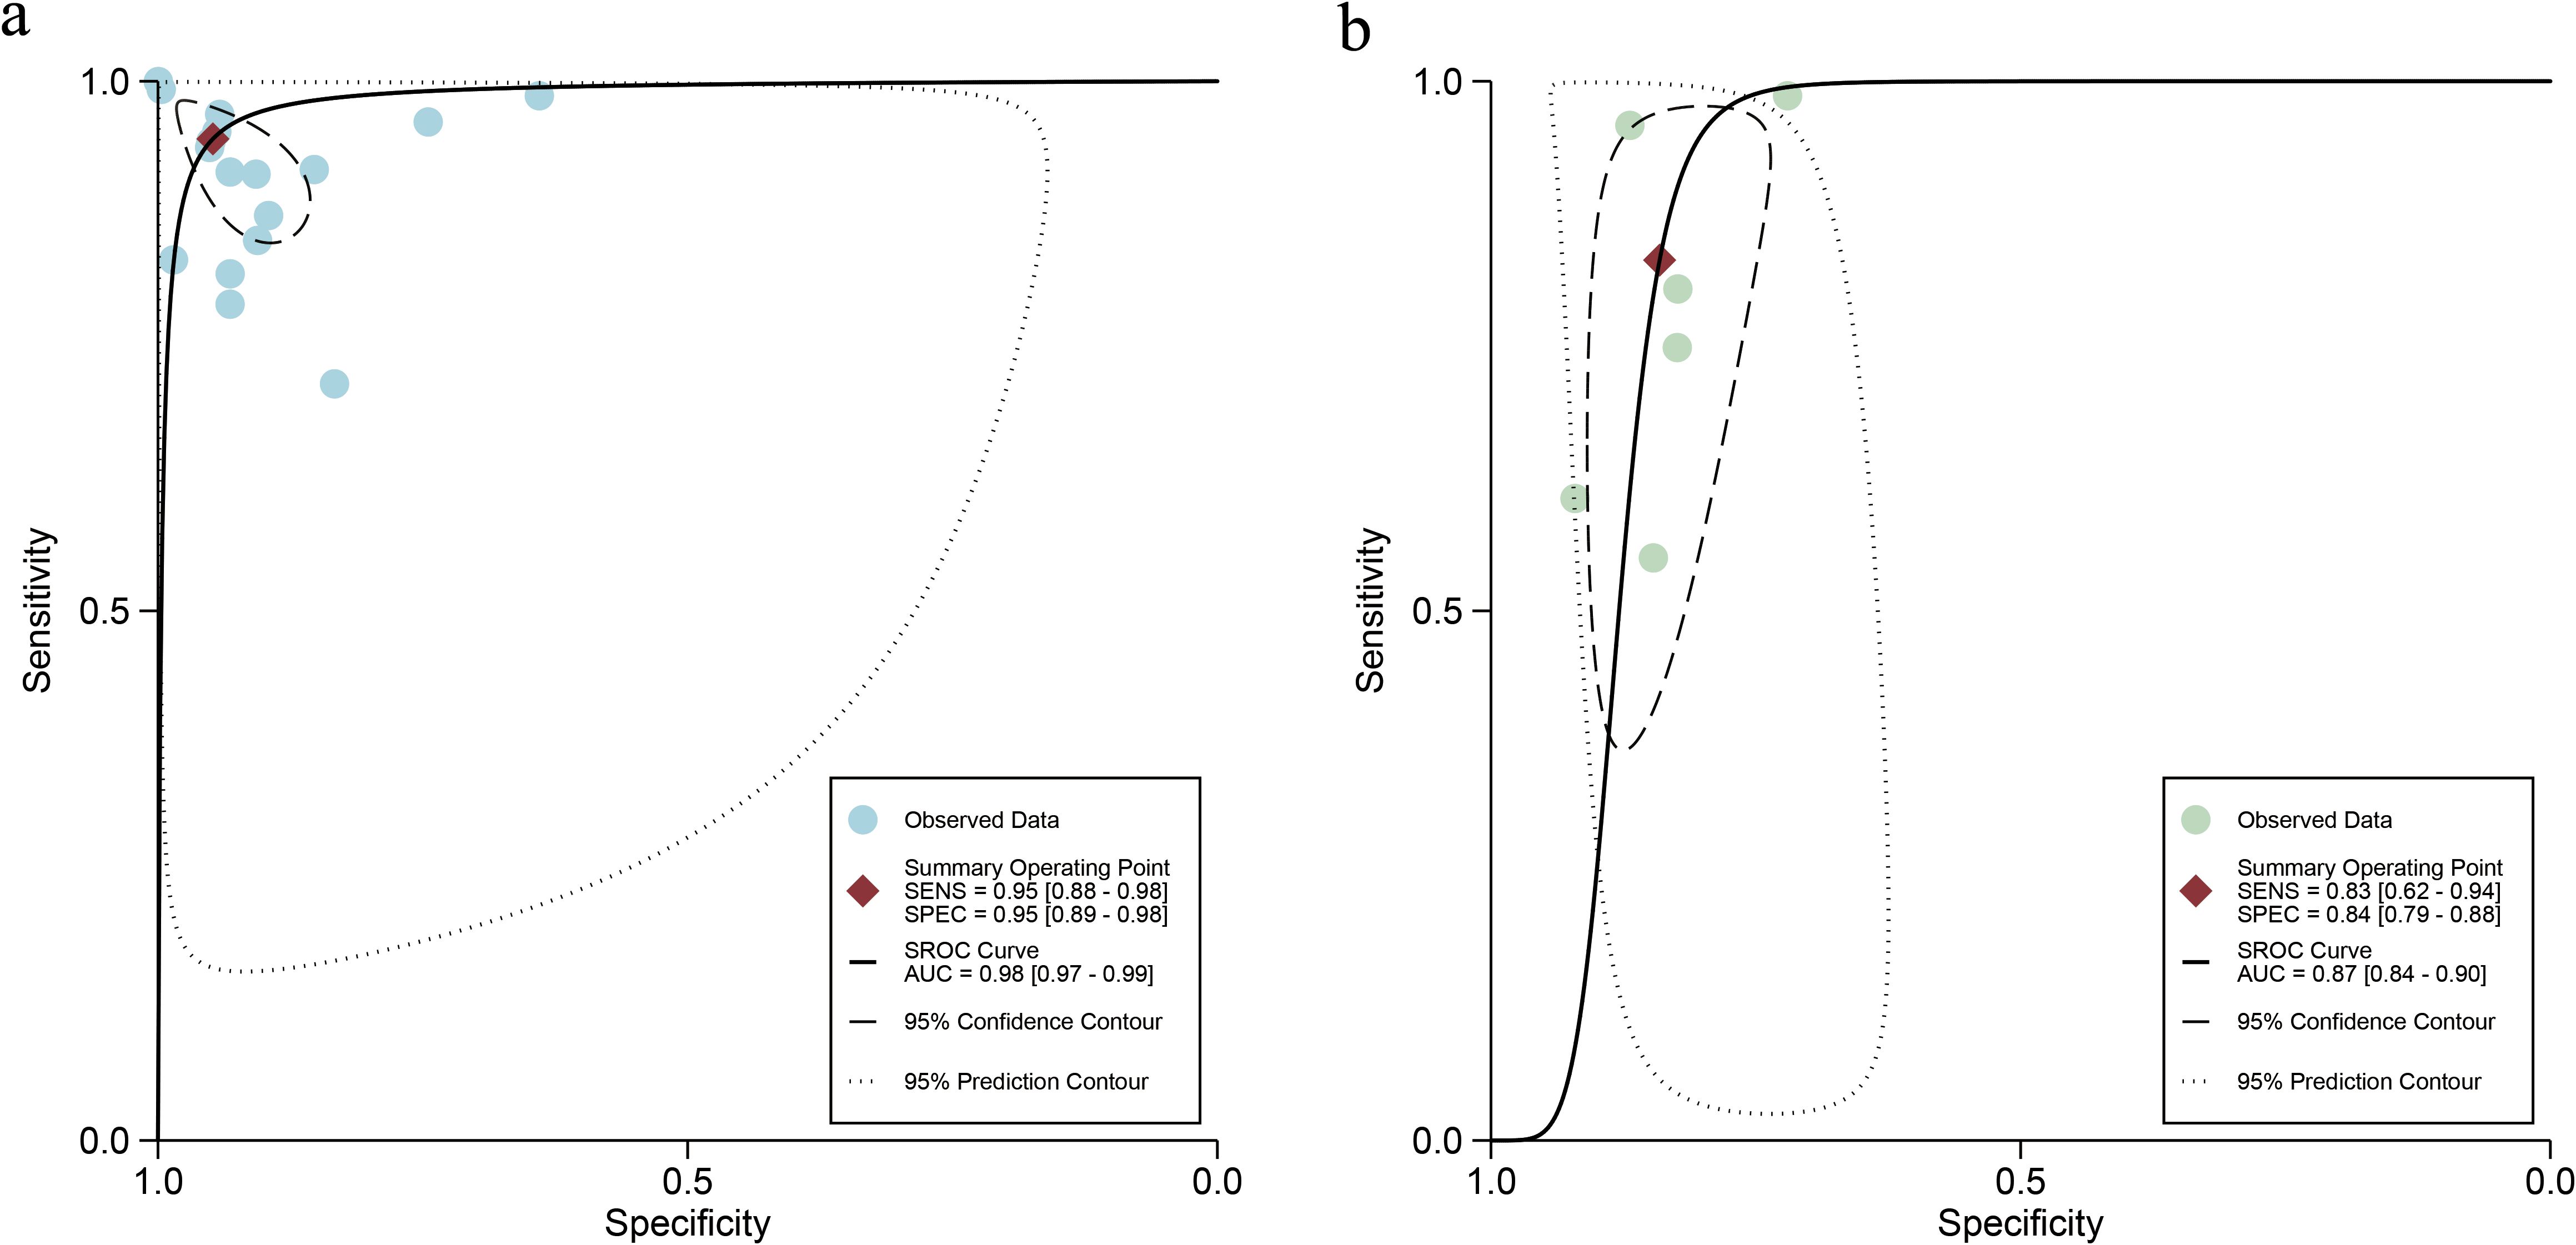
Figure 4. Summary receiver operating characteristic (SROC) curves of ultrasound-based artificial intelligence on the internal validation set (a) and sonographers (b) for diagnosing ovarian cancer.
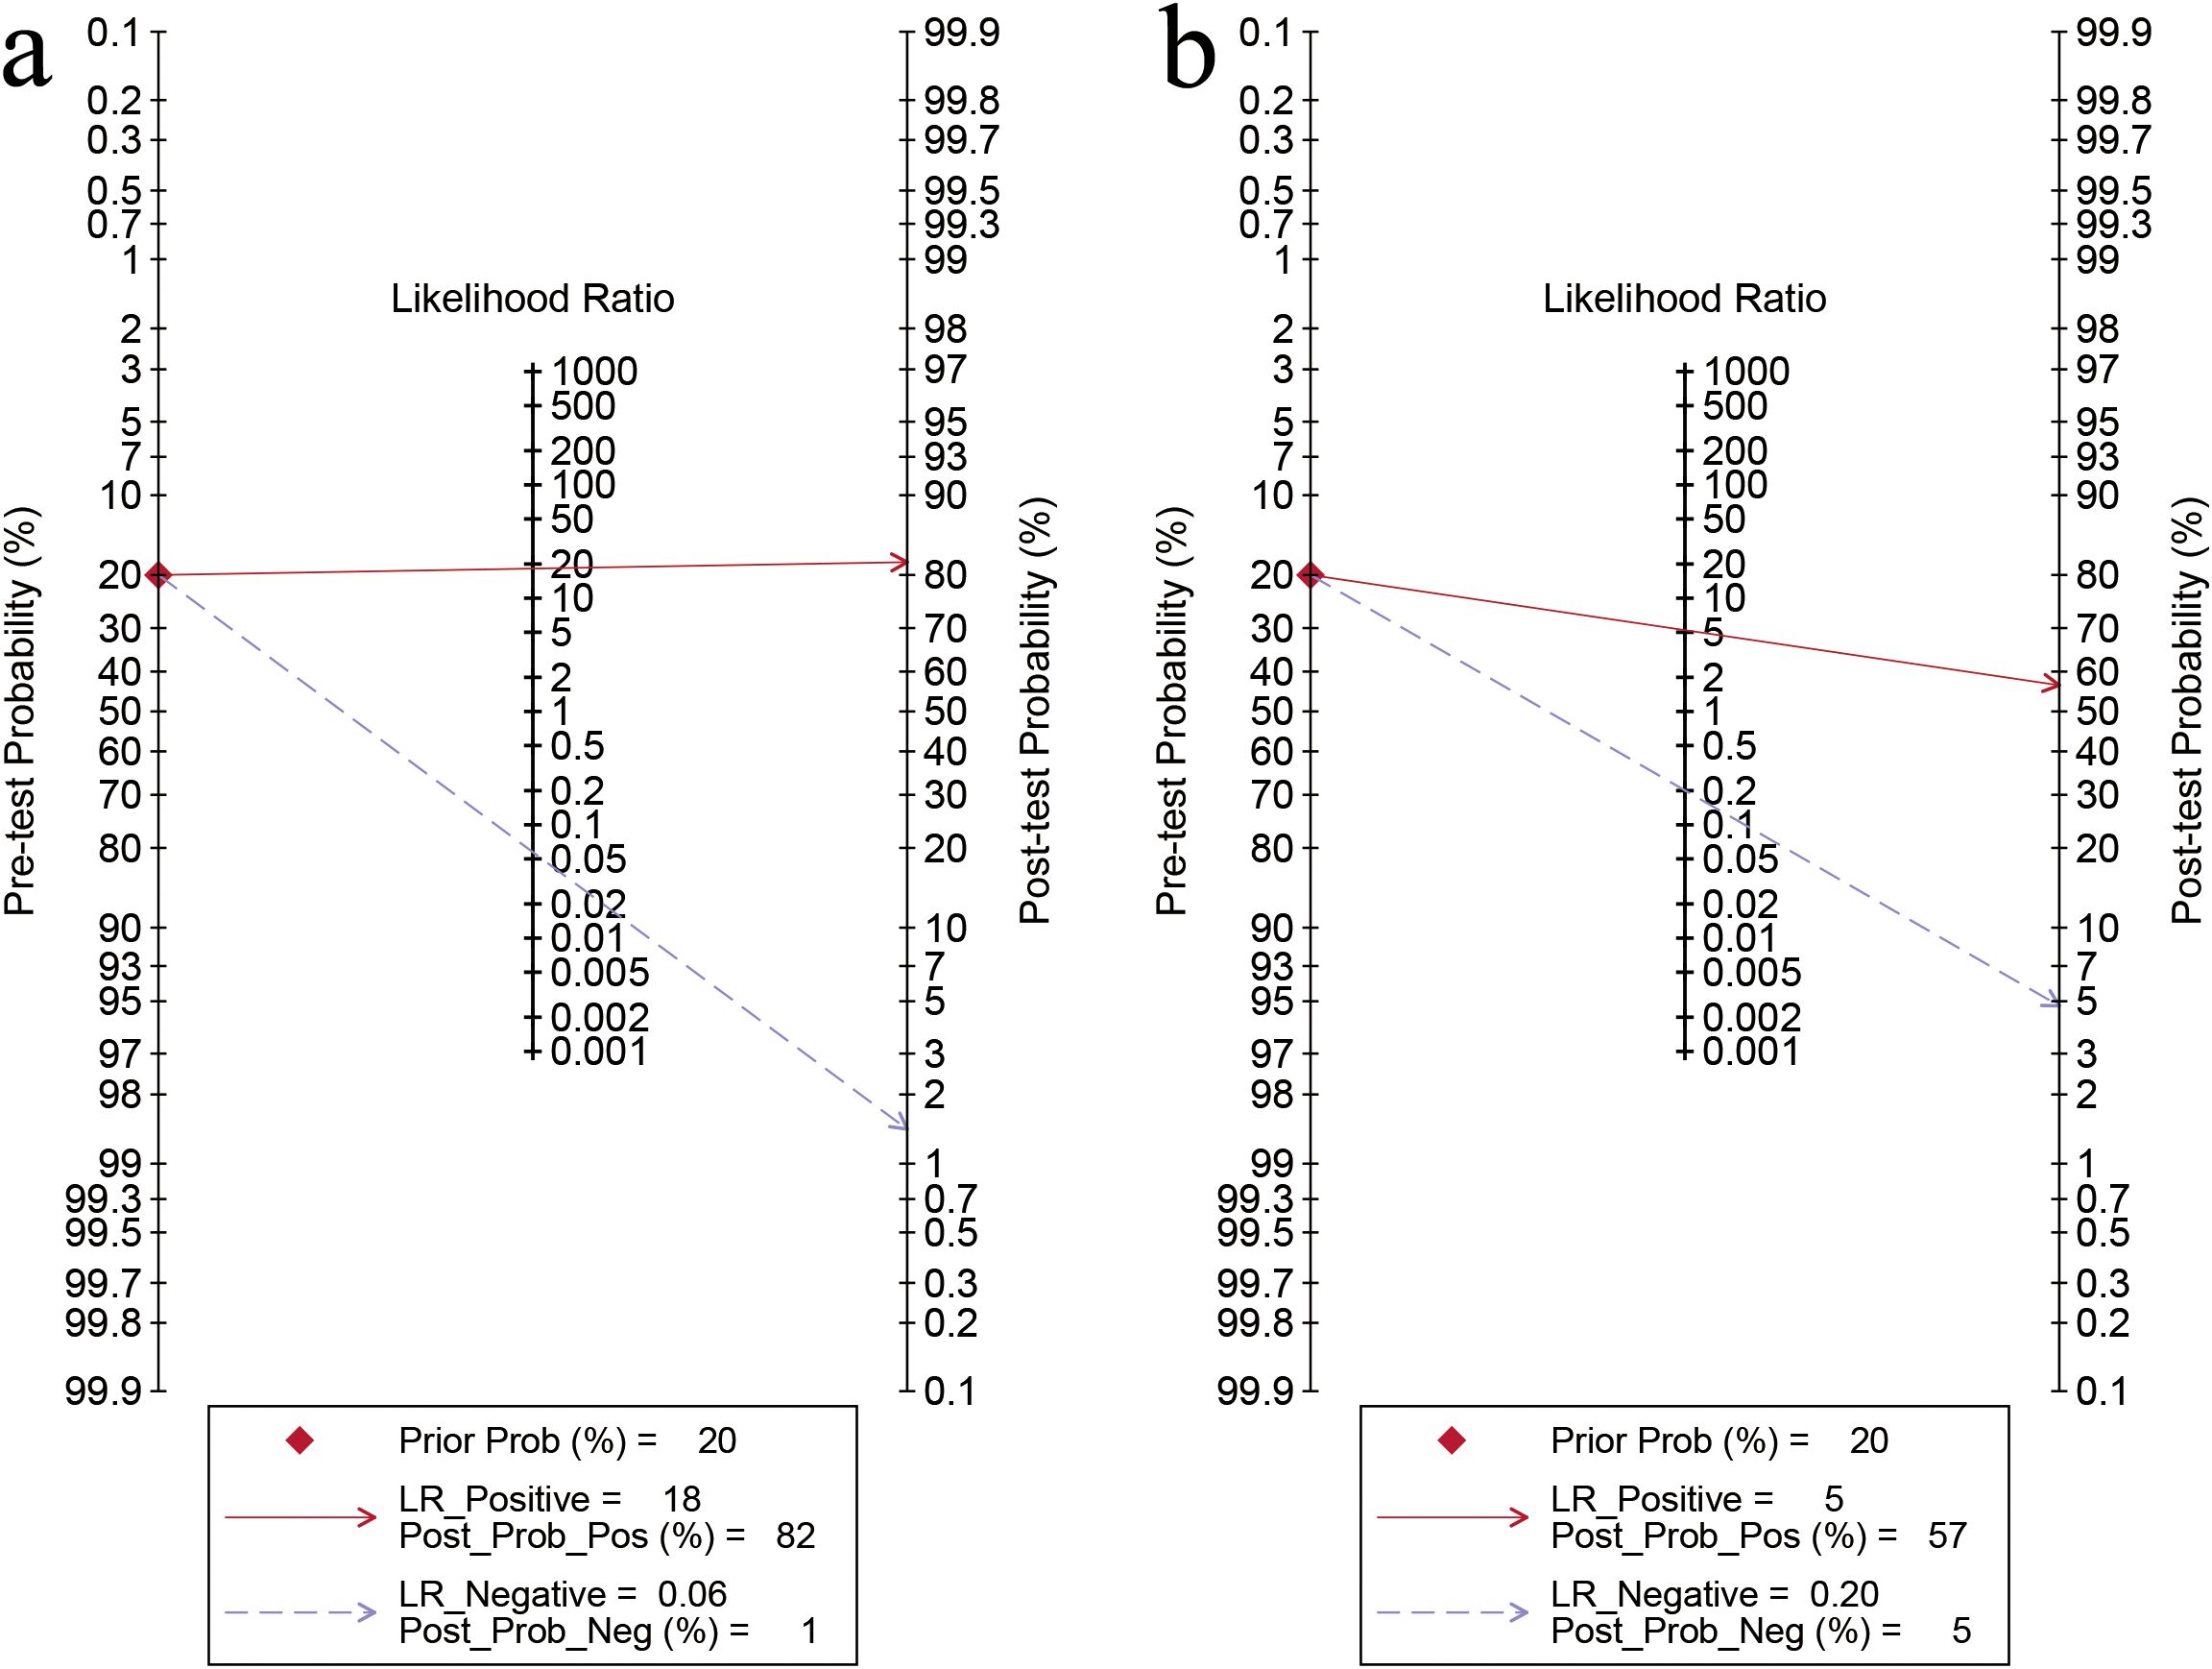
Figure 5. Fagan’s nomogram for artificial intelligence on the internal validation set (a) and sonographers (b) for diagnosing ovarian cancer.
For sonographers, the sensitivity in detecting ovarian malignancy was 0.83 (95% CI: 0.62-0.94), and the specificity was 0.84 (95% CI: 0.79-0.88) (Figure 6). The AUC was 0.87 (95% CI: 0.84-0.90) (Figure 4b). Using a pretest probability of 20%, the Fagan nomogram showed a positive likelihood ratio of 57% and a negative likelihood ratio of 5% (Figure 5b). The AUC value of the AI based on ultrasound was significantly higher than that of the sonographers, with no overlapping 95% CI.
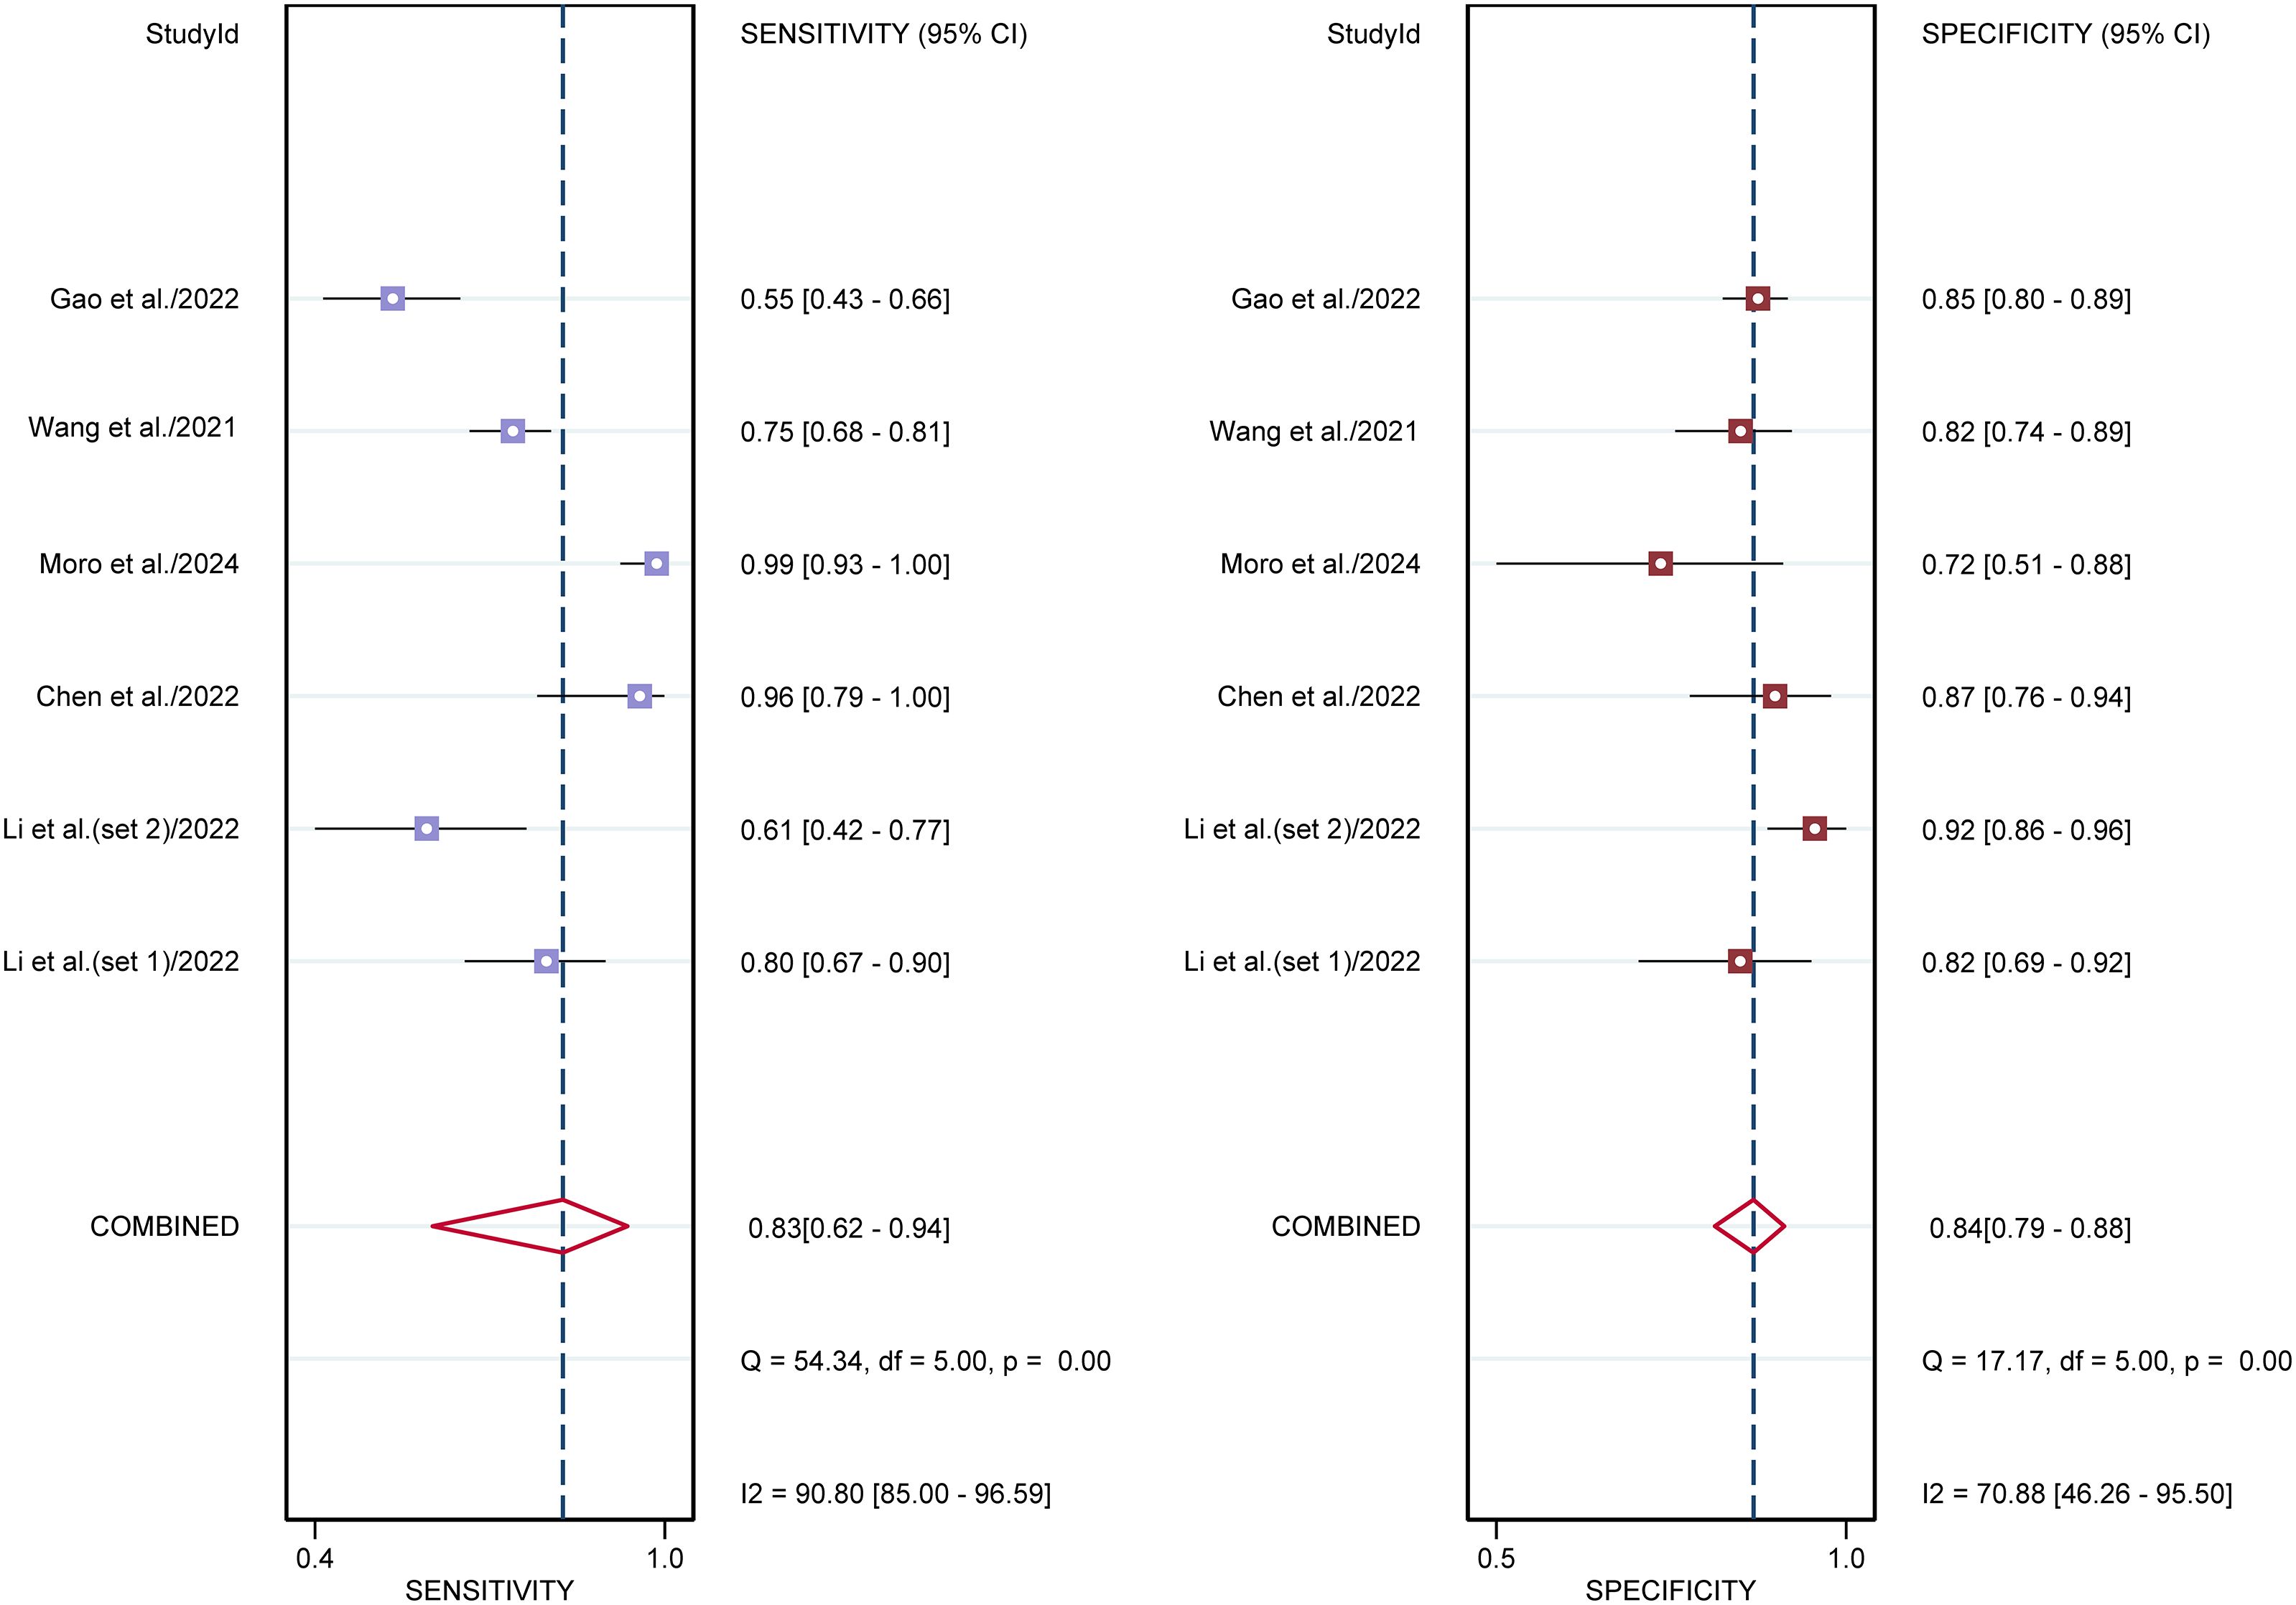
Figure 6. Forest plots displaying the sensitivity and specificity of the sonographers. Squares denoted the sensitivity and specificity in each study, while horizontal bars indicated the 95% confidence interval.
Diagnostic performance of AI and sonographers in predicting ovarian malignancy: head-to-head comparison
Six studies provided data for head-to-head comparison. The sensitivity of AI based on ultrasound in detecting ovarian malignancy was 0.91 (95% CI: 0.74-0.97), and the specificity was 0.89 (95% CI: 0.76-0.95), and the AUC was 0.95 (95% CI: 0.93-0.97) (Table 3). For sonographers, the sensitivity in detecting ovarian malignancy was 0.83 (95% CI: 0.62-0.94), and the specificity was 0.84 (95% CI: 0.79-0.88). The AUC was 0.87 (95% CI: 0.84-0.90) (Table 3). The AUC value of the AI based on ultrasound was significantly higher than that of the sonographers, with no overlapping 95% CI.

Table 3. Sensitivity analysis of ultrasound-based artificial intelligence performance.
Subgroup analysis and meta-regression for internal validation sets for AI in predicting ovarian malignancy
Subgroup analyses demonstrated consistently high sensitivity across all categories (range: 0.89-0.98), with no statistically significant differences observed between study designs (prospective vs. retrospective), AI methodologies (deep learning vs. machine learning), ultrasound approaches (transvaginal+ abdominal vs. transvaginal alone), AI model types (radiomic vs. radiomic+ clinical), or algorithm choices (CNN vs. logistic regression), or type of histopathology (serous vs. non-serous carcinomas) (all P > 0.05). Specificity values showed greater variability (range: 0.87-0.96), with a statistically significant difference noted between image-based (0.96, 95% CI: 0.93-1.00) and patient-based analyses (0.89, 95% CI: 0.79-1.00; P = 0.01). No other significant specificity differences were detected across subgroups including histological subtypes (all P > 0.05), though radiomic models (0.96) trended toward higher specificity than radiomic+ clinical models (0.90; P = 0.06).
For the internal validation sets, high heterogeneity was detected in both sensitivity (I² = 98.15%) and specificity (I² = 97.67%). Meta-regression analysis indicated that the heterogeneity was primarily attributed to the analysis method (Image-based vs. Patient-based, specificity P = 0.01) (Table 4).
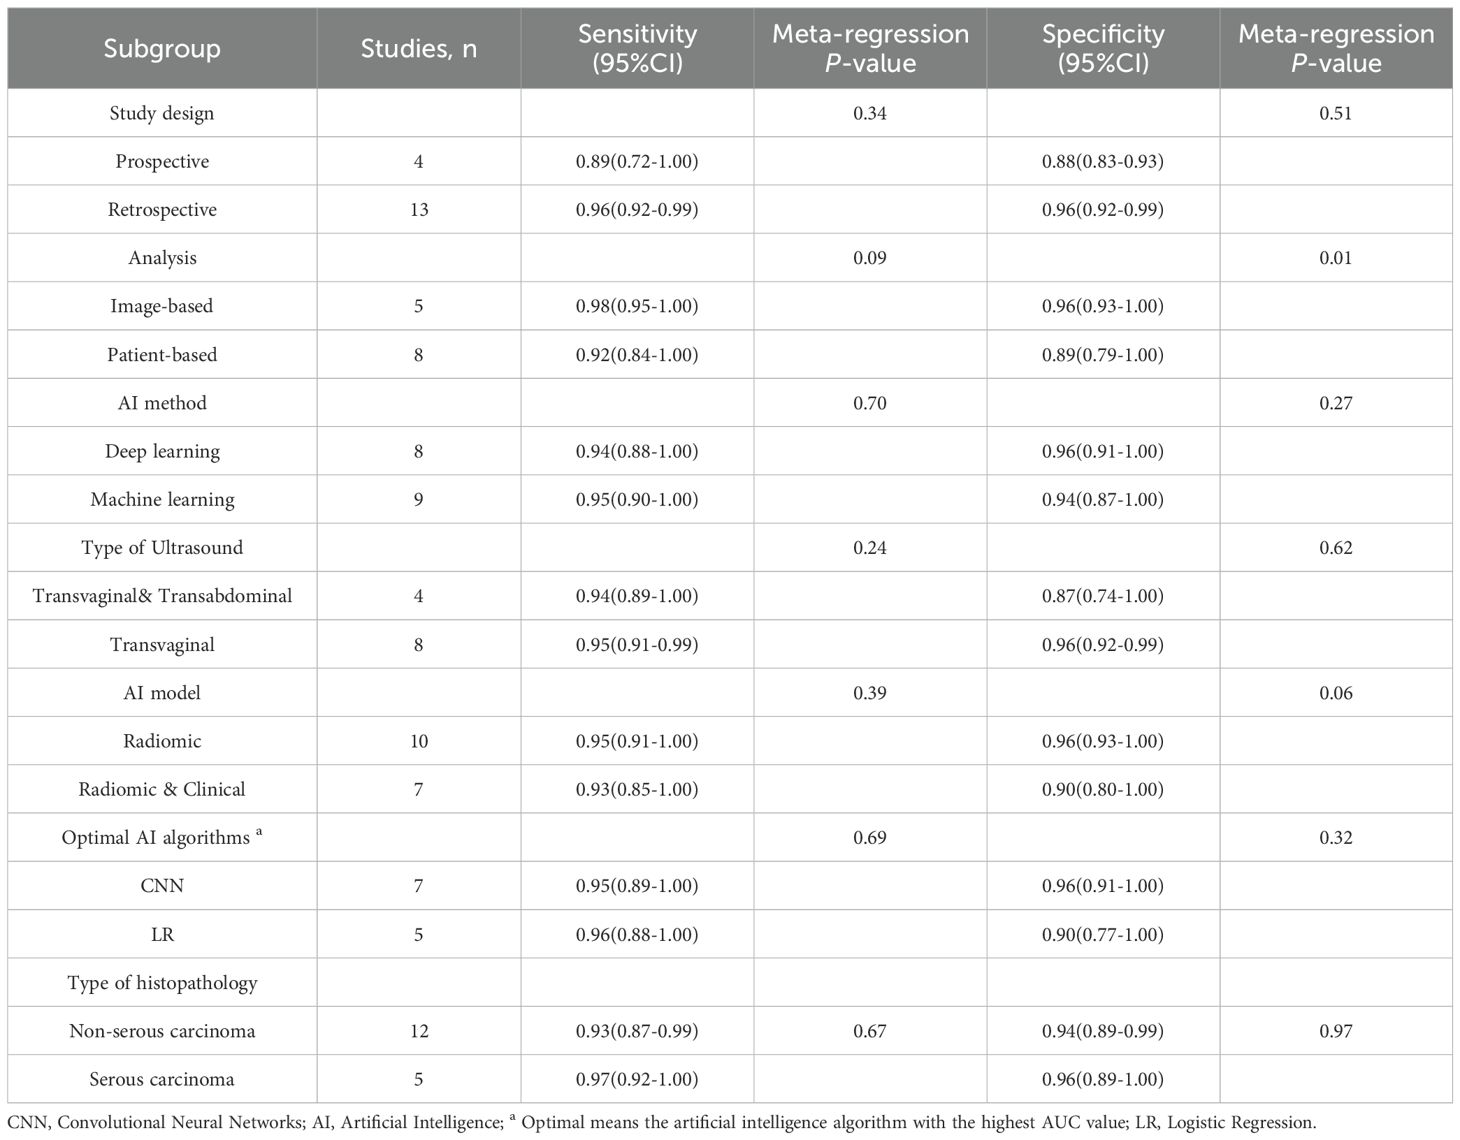
Table 4. Subgroup analysis of artificial intelligence performance in internal validation sets for ovarian cancer.
Diagnostic performance of external validation sets for AI in predicting ovarian malignancy
For the external validation sets, the sensitivity of AI in detecting ovarian malignancy was 0.78 (95% CI:0.56-0.91), and the specificity was 0.88 (95% CI: 0.76-0.95) (Supplementary Figure 1). The AUC was 0.91 (95% CI: 0.88-0.93) (Supplementary Figure 2). Using a pretest probability of 20%, the Fagan nomogram showed a positive likelihood ratio of 63% and a negative likelihood ratio of 6% (Supplementary Figure 3).
Publication bias
Deeks’ funnel plot asymmetry test indicated significant publication bias in the internal validation sets for AI and sonographers (P < 0.001, P = 0.03) (Figures 7a, b). However, no significant publication bias was found in the external validation sets (P = 0.13) (Supplementary Figure 4).
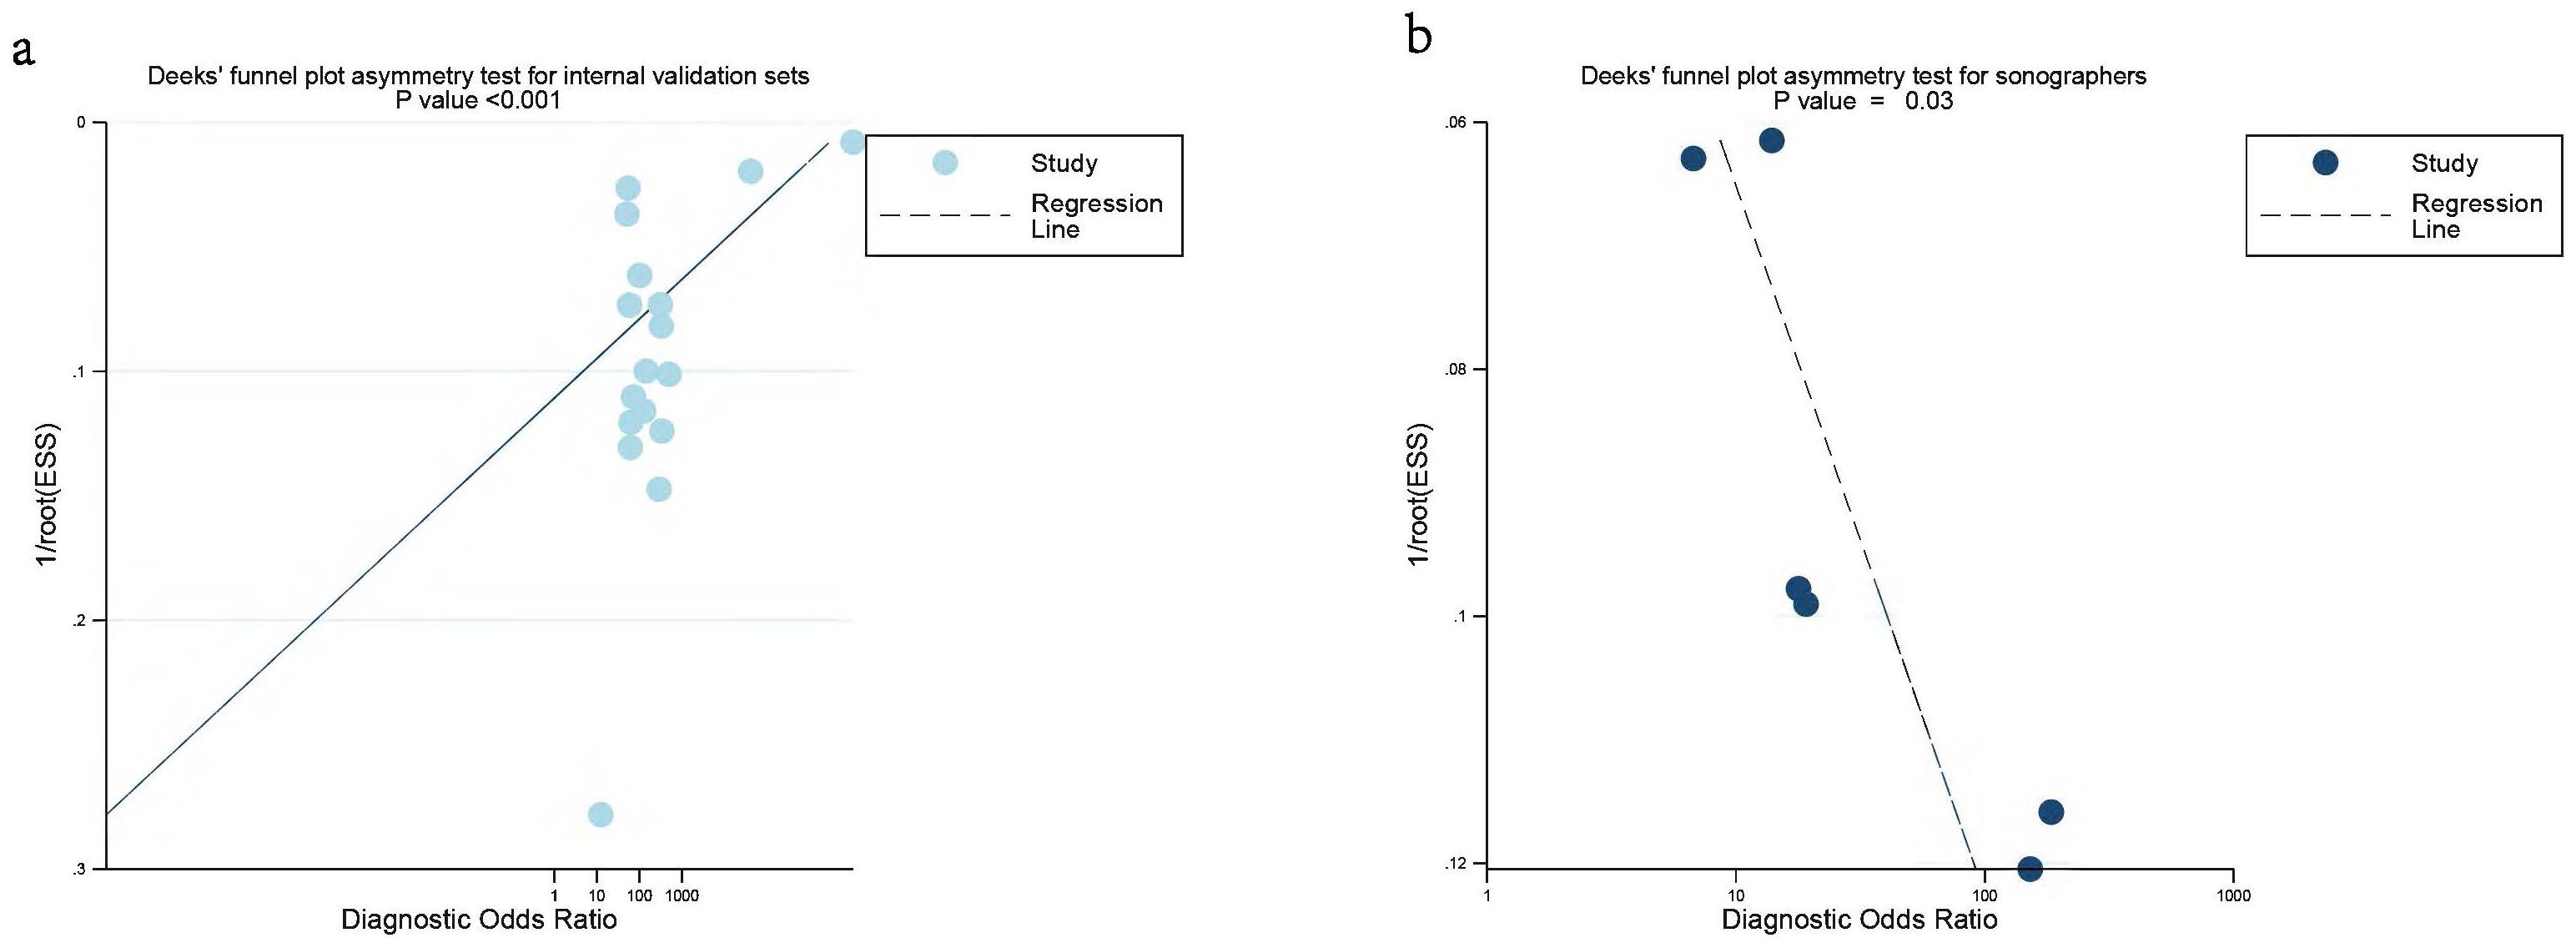
Figure 7. Deek’s funnel plot was used to evaluate internal validation set (a) and sonographers (b) the publication bias of ultrasound-based artificial intelligence for diagnosing ovarian cancer. P < 0.05 was considered significant.
Discussion
Ultrasound-based AI demonstrated excellent diagnostic performance in the initial diagnosis of ovarian cancer, achieving AUC values of 0.98 and 0.91 in the internal and external validation sets, respectively. Additionally, our results revealed that the AUC value for sonographers was 0.87, with no overlap in the 95%CI compared to AI, indicating that the AI model significantly outperformed traditional ultrasound diagnosis. The decline in diagnostic performance in the external validation sets may be attributed to sample heterogeneity and differences in operational standards across hospitals, which could affect the model’s generalizability. In contrast, the internal validation sets was conducted in a relatively uniform environment, ensuring the model’s high performance (1, 2). The advantages of ultrasound-based AI algorithms in complex pattern recognition and data processing enable them to better identify subtle lesion features, thereby providing higher sensitivity and specificity. However, sonographers may be influenced by factors such as experience, fatigue, and subjective judgment when interpreting images, leading to lower diagnostic performance (3, 9). Therefore, AI technology in the early screening of ovarian cancer may effectively improve diagnostic accuracy and enhance patient prognosis.
Interestingly, according to the results of our subgroup analysis, the sensitivity and specificity of deep learning were 0.94 and 0.96, respectively, while those of machine learning were 0.95 and 0.94. The differences between the two were not statistically significant (both P > 0.05). This indicates that deep learning does not significantly outperform machine learning, which is consistent with Xu et al. previous findings (1). However, due to the high heterogeneity, these results should be interpreted with caution. More studies are needed in the future to confirm whether deep learning algorithms offer any additional value over machine learning algorithms in the accurate diagnosis of ovarian cancer.
We found that regarding different AI models, the sensitivity and specificity of radiomic models did not show statistically significant differences compared to the combined approach of radiomic & clinical models (both P > 0.05). This may be attributed to the inherent complexities of integrating clinical data with imaging features (34). Radiomic, which extracts quantitative features from medical images, may not fully account for the multifactorial nature of tumor behavior and clinical symptoms that influence diagnostic outcomes (35). Furthermore, the potential redundancy in the information provided by radiomic features and clinical data may not contribute to an improvement in diagnostic performance metrics (2). In the studies we included, most of the researches that combined radiomics with clinical features used machine learning algorithms, while studies that relied solely on radiomics mostly adopted deep learning algorithms. Therefore, the choice of training algorithm may also influence the current results. More research is needed in the future to determine the value of multimodal AI algorithms compared to studies using radiomics alone.
In 2022, Xu et al. (1) performed a meta-analysis evaluating the diagnostic performance of a multimodal imaging-based AI approach incorporating CT, MRI, and ultrasound for ovarian cancer. The AI-based ultrasound diagnosis demonstrated a sensitivity of 0.91, specificity of 0.87, and AUC of 0.95. Their research compared a multimodal imaging-based AI approach incorporating CT, MRI, and ultrasound with human radiologists and found that AI outperformed the radiologists (AUC: 0.93 vs. 0.85). In 2024, Mitchell et al. (3) published another meta-analysis on AI-based ultrasound diagnosis for ovarian cancer, reporting an AI sensitivity of 0.81, specificity of 0.92, and AUC of 0.87. However, only two of the included studies compared AI with sonographers, and the diagnostic performance of sonographers was not extracted in their study. In addition, their study only performed a pooled analysis of 14 articles and did not conduct in-depth subgroup analyses based on different ultrasound equipment types or various AI algorithms.
To the best of our knowledge, this the first meta-analysis to separately extract data from internal validation sets, external validation sets, and diagnostic performance data of sonographers. Compared to previous published studies, our results demonstrate higher diagnostic performance for AI models (AUC:0.98), which may be attributed to updates in new algorithms that enhance performance. Our findings also indicate that AI-based ultrasound exhibits a diagnostic performance advantage over sonographers in the initial diagnosis of ovarian cancer (AUC:0.98 vs. 0.87), which consistent with prior findings (1).
It’s worth to noted that the inclusion of studies in our meta-analysis demonstrated significant heterogeneity, potentially impacting the overall sensitivity and specificity of AI performance. We conducted a meta-regression analysis, revealing that one of the primary sources of heterogeneity was the difference between analysis (Image-based vs. Patient-based P = 0.01). Image-based studies can provide more detailed information, leading to higher diagnostic performance, which may result in overestimation of the accuracy of findings. This is largely due to their focus on specific anatomical structures and lesions, allowing for a nuanced analysis that can highlight minute details that might be overlooked in broader studies. In contrast, patient-based studies do not capture as much information, resulting in significant differences in design and methodology. However, the high heterogeneity may also be attributed to other factors: (1) For patient characteristics, the different stages of ovarian tumors and the age of patients may also influence the performance; (2) For intervention methods, the quality of ultrasound imaging itself, which depends on operator expertise and equipment, could influence AI diagnostic accuracy. These factors highlight the need for standardized reporting in future studies to facilitate more robust meta-analyses.
Our results demonstrate that AI models based on ultrasound have achieved diagnostic performance in both internal and external validation datasets, and they have the potential to become important support tools for sonographers. AI can serve as a powerful auxiliary tool, offering physicians a valuable second opinion, enhancing diagnostic reliability, and reducing the risk of missed or incorrect diagnoses. Additionally, AI has the potential to decrease unnecessary surgeries or procedures, thereby helping to lessen the clinical workload, improve diagnostic accuracy, and prevent adverse outcomes caused by missed or delayed diagnoses (32). Implementing ultrasound-based AI in primary healthcare systems could facilitate early detection and timely management of ovarian cancer. However, it is crucial to emphasize that these models should not be regarded as standalone diagnostic standards or decision-making tools but rather as supplementary aids for sonographers (9). Due to the significant differences in algorithm interpretability and the lack of standardized algorithm training for ovarian cancer diagnosis, we can only conclude that our results represent a short-term phenomenon, indicating that current AI algorithms already have the potential to outperform traditional sonographers. Notably, only five studies in our analysis compared AI diagnostic performance directly with that of sonographers, highlighting the need for further research in this area.
Some limitations of the current meta-analysis should be considered when interpreting the results. First, most of the included studies were retrospective in design, with only four employing a prospective approach, which may introduce potential biases. To assess the possible impact of different study designs on the outcomes, we conducted a meta-regression analysis, which revealed that the type of study did not significantly affect the results (both P > 0.05). Therefore, well-designed prospective studies are essential to validate the findings of this meta-analysis and ensure the reliability and generalizability of the results. Second, only the optimal AI algorithms were selected for analysis, which may lead to an overestimation of the results. This was primarily because we aimed to avoid potential patient overlap. However, this approach may have led to an overly optimistic assessment of AI model performance. Future studies should compare the performance of different models, including those with moderate or poor outcomes, to provide a more comprehensive and objective evaluation. Third, due to lack of information, the study did not stratify sonographers by their experience and skill level. Future studies should consider stratifying sonographers by experience levels to better evaluate the impact of AI assistance on diagnostic performance across different practitioner groups. Fourth, since most of the included studies classified borderline tumors as part of the malignant (positive) group, we followed their approach and classified both borderline and malignant tumors as a positive group. However, this may have contributed to an increased rate of positive diagnoses. In the future, there is a need to evaluate AI’s ability to distinguish between benign, borderline, and malignant ovarian tumors to aid early clinical intervention for malignant cases. Forth, the very high heterogeneity (It > 97%) observed in both sensitivity and specificity, partly driven by methodological factors such as the unit of analysis, significantly limits the strength of conclusions that can be drawn regarding their current clinical readiness. Therefore, any claims about their ability to enhance diagnostic reliability, reduce workload, or improve patient outcomes in clinical practice are currently premature and require validation through more standardized, large-scale studies. Fifth, the classification of borderline tumors represents a potential source of heterogeneity. Most included studies categorized borderline tumors as malignant for the purpose of binary classification. While this reflects a common clinical challenge in distinguishing these entities from invasive cancer, it may inflate the perceived sensitivity of AI models and complicate the clinical interpretation of results, as the management of borderline tumors differs from that of frank malignancy. To address this concern, we performed a sensitivity analysis excluding studies that explicitly included borderline tumors in the malignant group. Future research should aim to evaluate AI performance across a three-tiered stratification (benign, borderline, malignant) to better assess its clinical utility in differentiating this diagnostically challenging spectrum of disease.
Conclusion
AI based on ultrasound diagnosis demonstrates excellent performance for malignant ovarian cancer detection, with potentially superior performance compared to sonographers. Despite high heterogeneity across studies and the observed publication bias, these results indicate the potential for AI integration into clinical practice. Further studies with external, multicenter prospective head-to-head design are still needed.
Data availability statement
The original contributions presented in the study are included in the article/Supplementary Material. Further inquiries can be directed to the corresponding author.
Author contributions
RL: Conceptualization, Data curation, Formal analysis, Investigation, Methodology, Software, Writing – original draft. JL: Conceptualization, Data curation, Formal analysis, Methodology, Writing – original draft. XT: Conceptualization, Data curation, Formal analysis, Methodology, Writing – original draft. SZ: Conceptualization, Data curation, Formal analysis, Methodology, Validation, Writing – original draft. JQ: Conceptualization, Data curation, Formal analysis, Writing – original draft. YX: Data curation, Formal analysis, Methodology, Software, Writing – original draft. HZ: Conceptualization, Formal analysis, Funding acquisition, Methodology, Resources, Validation, Writing – review & editing.
Funding
The author(s) declare financial support was received for the research and/or publication of this article. This study was supported by the Guangxi Key Research and Development Plan (Guike AB23026042).
Conflict of interest
The authors declare that the research was conducted in the absence of any commercial or financial relationships that could be construed as a potential conflict of interest.
Generative AI statement
The author(s) declare that Generative AI was used in the creation of this manuscript. During the preparation of this work, the authors used Sider in order to improve readability and language quality. After using this tool, the authors reviewed and edited the content as needed and take full responsibility for the content of the publication.
Any alternative text (alt text) provided alongside figures in this article has been generated by Frontiers with the support of artificial intelligence and reasonable efforts have been made to ensure accuracy, including review by the authors wherever possible. If you identify any issues, please contact us.
Publisher’s note
All claims expressed in this article are solely those of the authors and do not necessarily represent those of their affiliated organizations, or those of the publisher, the editors and the reviewers. Any product that may be evaluated in this article, or claim that may be made by its manufacturer, is not guaranteed or endorsed by the publisher.
Supplementary material
The Supplementary Material for this article can be found online at: https://www.frontiersin.org/articles/10.3389/fonc.2025.1626286/full#supplementary-material
References
1. Xu HL, Gong TT, Liu FH, Chen HY, Xiao Q, Hou Y, et al. Artificial intelligence performance in image-based ovarian cancer identification: A systematic review and meta-analysis. EClinicalMedicine. (2022) 53:101662. doi: 10.1016/j.eclinm.2022.101662
2. Ma L, Huang L, Chen Y, Zhang L, Nie D, He W, et al. AI diagnostic performance based on multiple imaging modalities for ovarian tumor: A systematic review and meta-analysis. Front Oncol. (2023) 13:1133491. doi: 10.3389/fonc.2023.1133491
3. Mitchell S, Nikolopoulos M, El-Zarka A, Al-Karawi D, Al-Zaidi S, Ghai A, et al. Artificial intelligence in ultrasound diagnoses of ovarian cancer: A systematic review and meta-analysis. Cancers. (2024) 16:422. doi: 10.3390/cancers16020422
4. Kumar Y, Koul A, Singla R, and Ijaz MF. Artificial intelligence in disease diagnosis: a systematic literature review, synthesizing framework and future research agenda. J Ambient Intell Humaniz Comput. (2023) 14:8459–86. doi: 10.1007/s12652-021-03612-z
5. Bedrikovetski S, Dudi-Venkata NN, Maicas G, Kroon HM, Seow W, Carneiro G, et al. Artificial intelligence for the diagnosis of lymph node metastases in patients with abdominopelvic Malignancy: A systematic review and meta-analysis. Artif Intell Med. (2021) 113:102022. doi: 10.1016/j.artmed.2021.102022
6. Campbell S and Gentry-Maharaj A. The role of transvaginal ultrasound in screening for ovarian cancer. Climacteric. (2018) 21:221–6. doi: 10.1080/13697137.2018.1433656
7. Wang ZM, Luo SY, Chen J, Jiao Y, Cui C, Shi SY, et al. Multi-modality deep learning model reaches high prediction accuracy in the diagnosis of ovarian cancer. Iscience. (2024) 27:109403. doi: 10.1016/j.isci.2024.109403
8. Sogani J, Allen B Jr., Dreyer K, and McGinty G. Artificial intelligence in radiology: the ecosystem essential to improving patient care. Clin Imaging. (2020) 59:A3–a6. doi: 10.1016/j.clinimag.2019.08.001
9. Gao Y, Zeng SQ, Xu XY, Li HY, Yao SZ, Song K, et al. Deep learning-enabled pelvic ultrasound images for accurate diagnosis of ovarian cancer in China: a retrospective, multicentre, diagnostic study. Lancet Digital Health. (2022) 4:E179–E87. doi: 10.1016/S2589-7500(21)00278-8
10. Moher D, Liberati A, Tetzlaff J, and Altman DG. Preferred reporting items for systematic reviews and meta-analyses: the PRISMA statement. PloS Med. (2009) 6:e1000097. doi: 10.1371/journal.pmed.1000097
11. McInnes MDF, Moher D, Thombs BD, McGrath TA, Bossuyt PM, Clifford T, et al. Preferred reporting items for a systematic review and meta-analysis of diagnostic test accuracy studies: the PRISMA-DTA statement. JAMA. (2018) 319:388–96. doi: 10.1001/jama.2017.19163
12. Whiting PF, Rutjes AW, Westwood ME, Mallett S, Deeks JJ, Reitsma JB, et al. QUADAS-2: a revised tool for the quality assessment of diagnostic accuracy studies. Ann Intern Med. (2011) 155:529–36. doi: 10.7326/0003-4819-155-8-201110180-00009
13. Wolff RF, Moons KGM, Riley RD, Whiting PF, Westwood M, Collins GS, et al. PROBAST: A tool to assess the risk of bias and applicability of prediction model studies. Ann Intern Med. (2019) 170:51–8. doi: 10.7326/m18-1376
14. Arends L, Hamza T, Van Houwelingen J, Heijenbrok-Kal M, Hunink M, and Stijnen T. Bivariate random effects meta-analysis of ROC curves. Med Decision Making. (2008) 28:621–38. doi: 10.1177/0272989X08319957
15. Higgins JP and Thompson SG. Quantifying heterogeneity in a meta-analysis. Stat Med. (2002) 21:1539–58. doi: 10.1002/sim.1186
16. Deeks JJ, Macaskill P, and Irwig L. The performance of tests of publication bias and other sample size effects in systematic reviews of diagnostic test accuracy was assessed. J Clin Epidemiol. (2005) 58:882–93. doi: 10.1016/j.jclinepi.2005.01.016
17. Li JA, Chen YX, Zhang MY, Zhang PF, He KL, Yan FQ, et al. A deep learning model system for diagnosis and management of adnexal masses. Cancers. (2022) 14:5291. doi: 10.3390/cancers14215291
18. Alcázar JL, Errasti T, Laparte C, Jurado M, and López-García G. Assessment of a new logistic model in the preoperative evaluation of adnexal masses. J Ultrasound Med. (2001) 20:841–8. doi: 10.7863/jum.2001.20.8.841
19. Szpurek D, Moszynski R, Smolen A, and Sajdak S. Artificial neural network computer prediction of ovarian Malignancy in women with adnexal masses. Int J Gynaecol Obstet. (2005) 89:108–13. doi: 10.1016/j.ijgo.2005.01.034
20. Timmerman D, Verrelst H, Bourne TH, De Moor B, Collins WP, Vergote I, et al. Artificial neural network models for the preoperative discrimination between Malignant and benign adnexal masses. Ultrasound Obstet Gynecol. (1999) 13:17–25. doi: 10.1046/j.1469-0705.1999.13010017.x
21. Chen H, Yang BW, Qian L, Meng YS, Bai XH, Hong XW, et al. Deep learning prediction of ovarian Malignancy at US compared with O-RADS and expert assessment. Radiology. (2022) 304:106–13. doi: 10.1148/radiol.211367
22. Van Holsbeke C, Van Calster B, Valentin L, Testa AC, Ferrazzi E, Dimou I, et al. External validation of mathematical models to distinguish between benign and Malignant adnexal tumors: A multicenter study by the International Ovarian Tumor Analysis group. Clin Cancer Res. (2007) 13:4440–7. doi: 10.1158/1078-0432.CCR-06-2958
23. Deeparani M and Kalamani M. Gynecological healthcare: unveiling pelvic masses classification through evolutionary gravitational neocognitron neural network optimized with nomadic people optimizer. Diagnostics. (2023) 13:3131. doi: 10.3390/diagnostics13193131
24. Vaes E, Manchanda R, Nir R, Nir D, Bleiberg H, Autier P, et al. Mathematical models to discriminate between benign and Malignant adnexal masses: potential diagnostic improvement using ovarian HistoScanning. Int J Gynecol Cancer. (2010) 21:35–43. doi: 10.1097/IGC.0b013e3182000528
25. Van Holsbeke C, Van Calster B, Testa AC, Domali E, Lu C, Van Huffel S, et al. Prospective internal validation of mathematical models to predict Malignancy in adnexal masses: Results from the international ovarian tumor analysis study. Clin Cancer Res. (2009) 15:684–91. doi: 10.1158/1078-0432.CCR-08-0113
26. Moro F, Vagni M, Tran HE, Bernardini F, Mascilini F, Ciccarone F, et al. Radiomics analysis of ultrasound images to discriminate between benign and Malignant adnexal masses with solid ultrasound morphology. Ultrasound obstetrics gynecology. (2024) 65. doi: 10.1002/uog.27680
27. Choi YJ and Jung Y. Ovarian tumor diagnosis using deep convolutional neural networks and denoising convolutional autoencoder. Cancer Res. (2022) 82:1925. doi: 10.1158/1538-7445.AM2022-1925
28. Ștefan PA, Lupean RA, Mihu CM, Lebovici A, Oancea MD, Hîțu L, et al. Ultrasonography in the diagnosis of adnexal lesions: The role of texture analysis. Diagnostics. (2021) 11:812. doi: 10.3390/diagnostics11050812
29. Amidi E, Mostafa A, Nandy S, Yang G, Middleton W, Siegel C, et al. Classification of human ovarian cancer using functional, spectral, and imaging features obtained from in vivo photoacoustic imaging. Biomed Optics Express. (2019) 10:2303–17. doi: 10.1364/BOE.10.002303
30. Lin YX and Zhu Q. Classification and risk assessment of ovarian-adnexal lesions using parametric and radiomic analysis of co-registered ultrasound-photoacoustic tomographic images. Photoacoustics. (2024) 41:100675. doi: 10.1016/j.pacs.2024.100675
31. Wang H, Liu C, Zhao Z, Zhang C, Wang X, Li H, et al. Application of deep convolutional neural networks for discriminating benign, borderline, and Malignant serous ovarian tumors from ultrasound images. Front Oncol. (2021) 11:770683. doi: 10.3389/fonc.2021.770683
32. Acharya UR. Evolutionary algorithm-based classifier parameter tuning for automatic ovarian cancer tissue characterization and classification. Ultraschall der Med (Stuttgart Germany: 1980). (2012) 35:237–45. doi: 10.1055/s-0032-1330336
33. Moro F, Ciancia M, Zace D, Vagni M, Tran HE, Giudice MT, et al. Role of artificial intelligence applied to ultrasound in gynecology oncology: A systematic review. Int J Cancer. (2024) 155:1832–45. doi: 10.1002/ijc.35092
34. Zhang YP, Zhang XY, Cheng YT, Li B, Teng XZ, Zhang J, et al. Artificial intelligence-driven radiomics study in cancer: the role of feature engineering and modeling. Mil Med Res. (2023) 10:22. doi: 10.1186/s40779-023-00458-8
Keywords: artificial intelligence, ovarian neoplasms, ultrasonography, diagnosis, meta-analysis
Citation: Li R, Lei J, Tang X, Zheng S, Qu J, Xu Y and Zheng H (2025) Artificial intelligence based on ultrasound for initial diagnosis of malignant ovarian cancer: a systematic review and meta-analysis. Front. Oncol. 15:1626286. doi: 10.3389/fonc.2025.1626286
Received: 10 May 2025; Accepted: 14 November 2025; Revised: 07 October 2025;
Published: 01 December 2025.
Edited by:
Rohan Gupta, University of South Carolina, United StatesReviewed by:
Faezeh Aghajani, Boston Children’s Hospital and Harvard Medical School, United StatesGiulia Parpinel, Azienda Sanitaria Locale di Biella, Italy
Copyright © 2025 Li, Lei, Tang, Zheng, Qu, Xu and Zheng. This is an open-access article distributed under the terms of the Creative Commons Attribution License (CC BY). The use, distribution or reproduction in other forums is permitted, provided the original author(s) and the copyright owner(s) are credited and that the original publication in this journal is cited, in accordance with accepted academic practice. No use, distribution or reproduction is permitted which does not comply with these terms.
*Correspondence: Hongyu Zheng, emhlbmdob25neXVAaG90bWFpbC5jb20=