 Cheng Shen
 Gen Chen4†
 Zhan Chen
 Bing Zheng
- 1Department of Urology, Affiliated Hospital 2 of Nantong University, Nantong, Jiangsu, China
- 2Jiangsu Nantong Urological Clinical Medical Center, Nantong, Jiangsu, China
- 3Institute of Urological Diseases, Nantong University, Nantong, Jiangsu, China
- 4Department of Urology, Nantong Second People’s Hospital, Nantong, Jiangsu, China
- 5Department of Urology, Rudong Hospital, Xinglin College of Nantong University, Nantong, Jiangsu, China
Objective: One known side effect of transperineal (TP) prostate biopsies is acute urine retention (AUR). We aimed to create and evaluate a predictive model for the post-paracentesis risk of acquiring AUR.
Methods: This study included 599 patients undergoing prostate biopsies (April 2020-July 2023) at the Second Affiliated Hospital of Nantong University, selected based on abnormal digital rectal examination and/or PSA (prostate-specificantigen) > 4 ng/mL. Acute urinary retention (AUR) was defined as the inability to void within 72 hours post-biopsy, requiring catheterization. Patients were randomly divided into training (419 cases) and test (180 cases) sets. Univariate logistic analysis and feature selection Boruta and LASSO (Least absolute shrinkage and selection operator) identified predictors, followed by multivariate logistic regression to develop a predictive nomogram for AUR. Internal validation used the test set, with model performance assessed via the c-index, ROC (Receiver Operating Characteristic) curve, calibration plot, and decision curve analysis. The nomogram demonstrated strong discrimination, calibration, and clinical utility for AUR risk prediction.
Results: In 86 patients (14.3%), AUR happened. An examination of multivariate logistic regression revealed six distinct risk variables for AUR. Based on these independent risk factors, a nomogram was constructed. The training and validation groups’ c-indices showed the model’s high accuracy and stability. The calibration curve demonstrates that the corrective effect of the training and verification groups is perfect, and the area under the receiver operating characteristic curve indicates great identification capacity. DCA (Decision Curve Analysis) curves, or decision curve analysis, demonstrated the model’s significant net therapeutic effect.
Discussion: The nomogram model created in this work can offer a personalized and intuitive analysis of the risk of AUR and has intense discrimination and accuracy. It can help create efficient preventative measures and identify high-risk populations.
Introduction
In 2022, prostate cancer accounted for around 27% of all new cancer diagnoses in the United States and was the most common cancer diagnosis among men (1). Research has focused on prostate biopsies as the gold standard for diagnosing prostate cancer in recent years. There are two methods for prostate biopsies: transrectal (TR) and transperineal (TP) (2). TR has historically carried out prostate biopsies. The burden that postoperative sepsis places on patient health and adds to the expenditures to the healthcare system, however, is the primary critique of this strategy (3–6). As a result of the declining percentage of TP biopsy in sepsis cases, there has been a nationwide movement to offer TP biopsy. AUR, or acute urinary retention, is another danger associated with prostate biopsies that may be higher than other TR techniques (7–10). AUR frequently necessitates catheterization and additional hospitalization (11, 12). While TP biopsy may lessen infection, it does not entirely prevent infection. According to studies referenced by NICE, urinary retention rates range from 1.6 to 11.4% (12).
Data evaluating possible risk factors for AUR after prostate biopsy in TP are currently hard to come by (13–15). Because medical big data is so common, machine learning (ML), the most significant artificial intelligence implementation technique, has been applied extensively to data-driven risk prediction (16, 17). Given the high dimensionality of the data, we chose to use LASSO first for preliminary screening to reduce Boruta ‘s computational burden and improve the efficiency of the overall analysis. Therefore, after screening out risk factors using LASSO regression. We further screened variables using Boruta ‘s feature screening method. We then iteratively processed random fluctuations in forest importance scores and factor interactions to screen for significant urinary retention predictors. In addition, this approach is commonly used for feature selection in diabetes mellitus (DM) studies (18, 19). In addition, Meng Zirui et al. constructed predictive models for severe novel coronavirus pneumonia using variant analysis and least absolute contraction and selection operator (LASSO) modeling along with Boruta ‘s algorithm (20). Ding Xuexuan et al. identified the core genes of asthma using five machine learning algorithms: LASSO, SVM-RFE, Boruta, XGBoost, and RF (21).
In view of the high clinical incidence of acute urinary retention (AUR) after transperineal prostate puncture (TP) and the lack of a precise predictive model for this complication, the aim of this study was to construct and validate a nomogram model that can be used to rapidly assess the risk of AUR preoperatively by integrating clinical routine indicators (such as BMI, prostate volume, etc.) using LASSO and Boruta feature selection algorithms to provide a quantitative tool for clinical decision-making in order to reduce the postoperative catheter indwelling rate and length of hospital stay.
Patients and methods
Study design and participants
We conducted a retrospective analysis of a cohort of patients who underwent prostate biopsy in the day ward of the Department of Urology, the First People’s Hospital of Nantong, from April 2020 to July 2023. Abnormal digital rectal examination, high PSA (> 4.0 ng/mL), or positive prostate multiparametric MRI (prostate imaging report and data system ≥ 3) were the inclusion criteria. The following conditions precluded study participation: hypersensitivity to ciprofloxacin, prostate-related surgery within the previous three months, urinary tract infection during biopsy or therapy, and denial of informed written consent. The study excluded patients with a history of urine retention and those with urinary retention during biopsy. Data parameters included patient demographics, PSA readings, the International Prostate Symptom Score (IPSS), prostate volume, post-void residual (PVR) volume before biopsy, comorbidities, blood and urine routines, post-void residual (PVR) volume, and histopathological findings.
Ethics and informed consent
The research adhered to the principles outlined in the Declaration of Helsinki. All subjects gave informed consent, which was approved by the First People’s Hospital Center of Nantong’s Ethics Committee (ethical approval number 2022KT100). Because this study was a retrospective cross-sectional study, informed consent was not required and all subjects included in the study had signed an informed consent form authorizing the use of the information for future scientific research. Retrospective data analysis followed the ethical guidelines applicable at the time of source data collection (Declaration of Helsinki 2013 revision).
Data collection and variable definition
Demographic information was obtained from electronic medical records, along with PSA values, the International Prostate Symptom Score (IPSS), prostate volume, post-void residual (PVR) volume before biopsy, comorbidities, blood and urine routines, routine inflammatory parameters, and post-void residual (PVR) volume. Before being included in the study, a second reviewer verified the chart review data’s accuracy. We used multiple imputation to handle missing values, the number of imputations was 5, and variables with < 5% missing proportion were finally retained; abnormal values (identified by Z-score method, | Z | > 3) were verified, corrected after confirming abnormal values due to measurement error, and the rest retained original data to avoid information loss; normality tests were performed for continuous variables (e.g., prostate volume, IPSS score), and logarithmic transformation was used for non-normally distributed variables (e.g., residual urine volume) to ensure the rationality of model input data. AUR was defined as the inability to void within 72 hours following biopsy, necessitating the implantation of a urinary catheter (22).
Histopathologic evaluation
All biopsies were analyzed by 2 urogenital pathologists (> 10 years’ experience). The location, proportion of cancer tissue per core, and Gleason score (GS), based on the 2005 consensus of the International Society of Uropathology (23), were recorded for each prostate cancer-positive biopsy core.
PI-RADS score
Before having a prostate biopsy, all patients had 3.0 T mpMRIs (no endorectal coils). T1-weighted imaging (T1WI), T2-weighted imaging (T2WI), diffusion-weighted imaging (DWI), and dynamic contrast-enhanced imaging (DCE) are among the scanning techniques used for mpMRI. After DWI data were collected at b-values of 0 and 1500 s/mm 2, ADC maps were produced. Two genitourinary radiologists with at least three years of prostate MRI expertise evaluated the mpMRI, and the PI-RADSv2.1 score was used to record the results. For CSPCa, it is doubtful to originate in PI-RADS 1 (doubtful to occur in CSPCa), PI-RADS 2 (unlikely to happen in CSPCa), and PI-RADS 3 (suspicious for CSPCa); nevertheless, for PI-RADS 4 (high) and PI-RADS 5 (very high) (24, 25).
Statistical analysis
The continuous data were evaluated using the Student’s t-test or the Mann-Whitney U test, and the results were reported as mean ± standard deviation (SD) or median and interquartile range. Alternatively, categorical data reported as numbers (%) was evaluated using Fisher’s exact or Chi-square tests. We used LASSO regression to reduce the dimension of high-dimensional data and identify the best predictive characteristics and variables of AUR after performing univariate logistic regression analysis of the training group to first screen the factors and determine the risk factors of AUR (26). In addition, we employed Boruta’s technique for feature selection, which involved 100 random forest iterations and the creation of logistic regression prediction models. Nomograms are validated by measuring their calibration (calibration graph) and discriminant capacity (C-statistic). C-statistic values above 0.75 are generally indicative of comparatively excellent discriminant ability. Lastly, we used decision curve analysis (DCA) to assess how applicable nomograms are in clinical practice. In every analysis, a p-value of less than 0.05 was deemed statistically significant.
Results
Clinical features
Between January 1, 2020, and December 31, 2023, 599 patients who underwent prostate biopsies in Urology Department Day Ward at the Second Affiliated Hospital of Nantong University provided data for our analysis. Of these, 513 cases (85.64%) did not experience postoperative acute urine retention, while 86 (14.36%) experienced it. Figure 1 is a flow chart of the case selection and study process. The patients’ demographic features are detailed in Table 1.
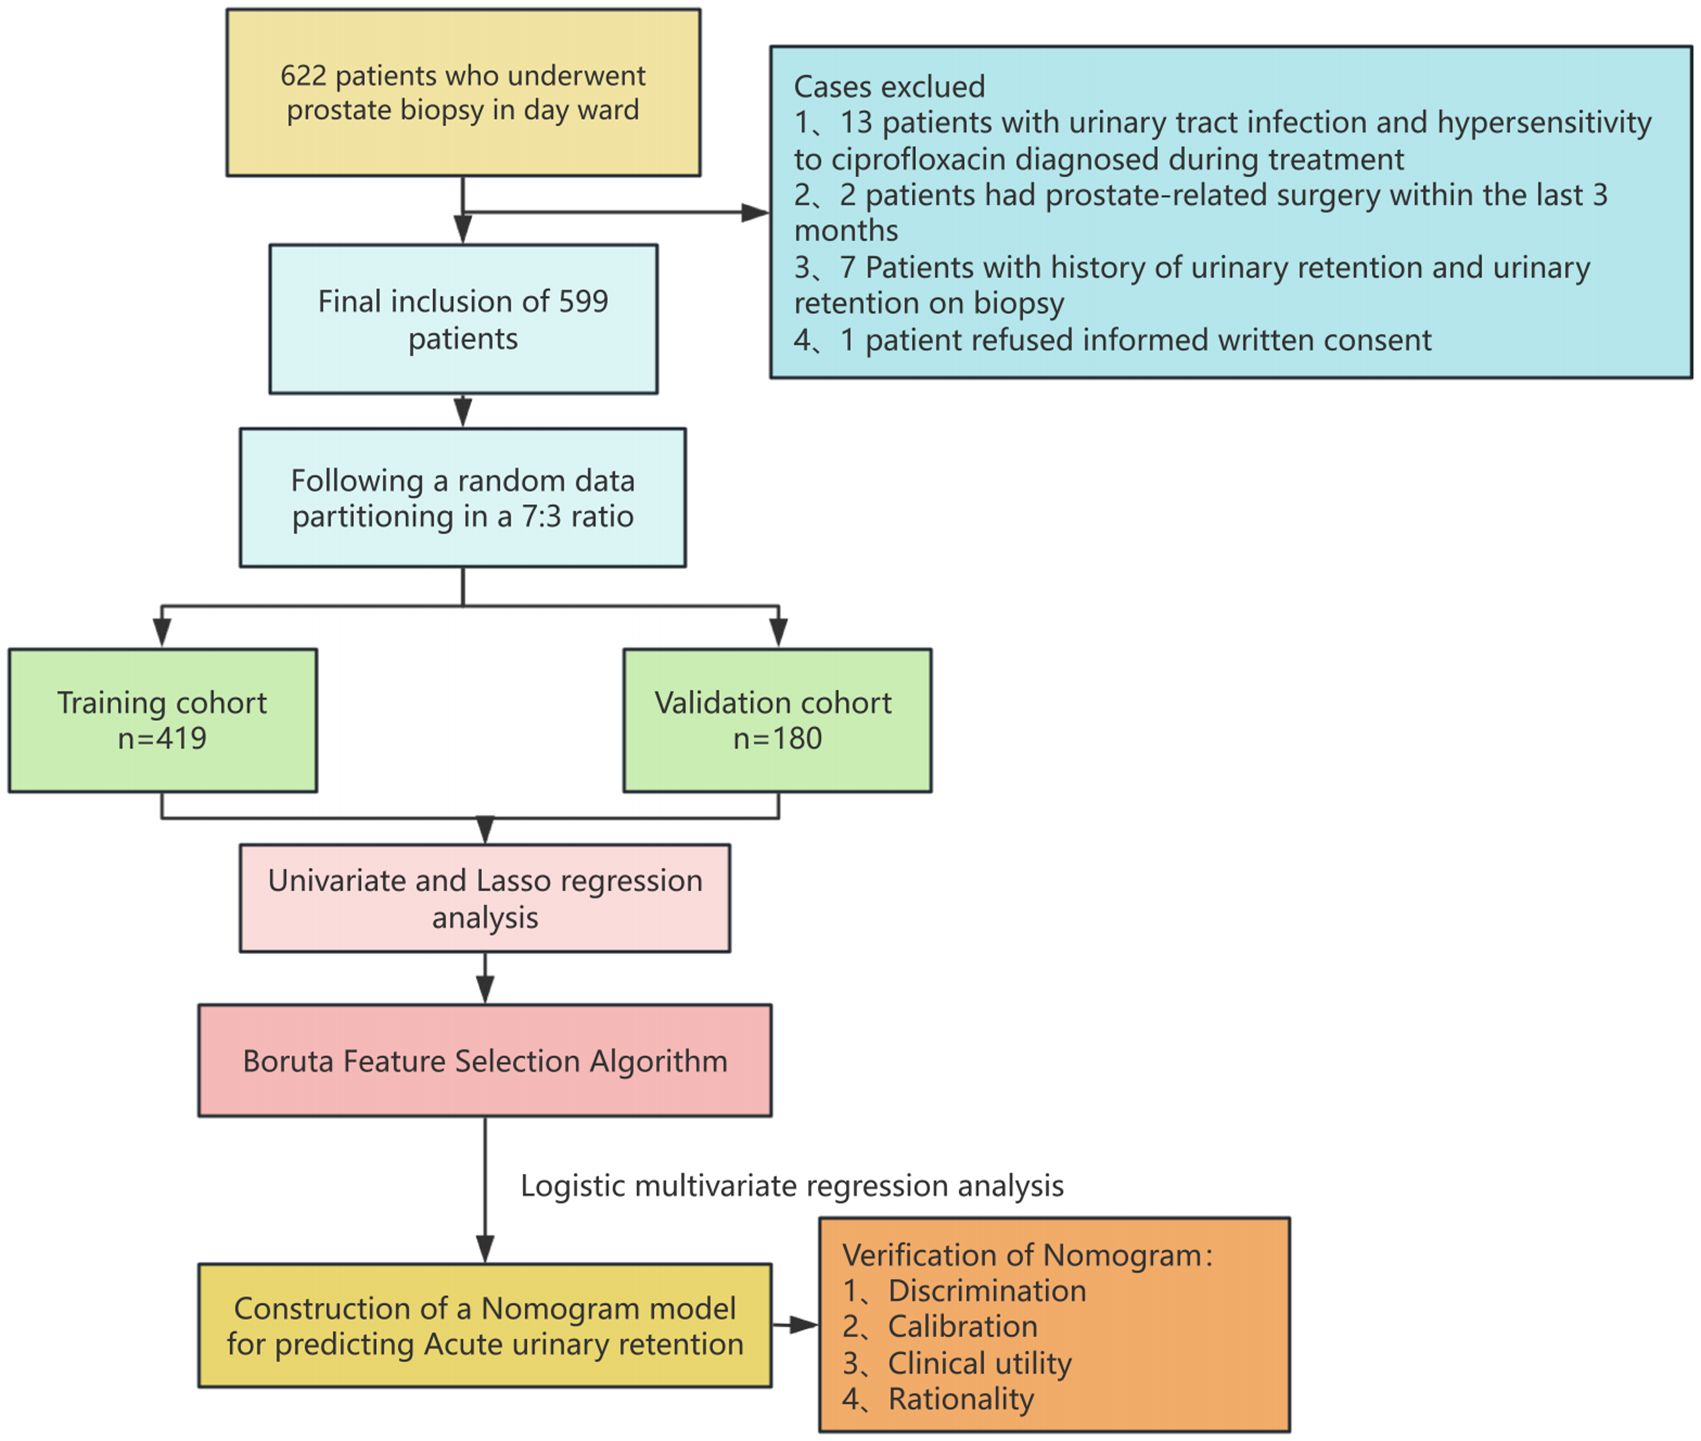
Figure 1. Research pathway diagram.

Table 1. Baseline characteristics of patients.
Risk factors associated with AUR
For each univariate logistic regression analysis, we created a forest plot (Figure 2). We created a forest plot for each univariate logistic regression analysis (Figure 2). We employed LASSO regression to select variables and simplify the model due to the many covariates. We utilized a 10-fold cross-validation strategy for internal validation using Lambda as the dependent variable and pi incidence as the dependent variable. The choice for the λ filter variable was Min. The Lasso method’s numerical variable screening procedure, which uses 14 variable coefficients that fluctuate with penalty coefficients, is shown in Figure 3A. The initial integration factor’s coefficient is compressed and eliminated from the model when the coefficient is 0. Every row represents a different variable. The target covariates were ascertained by applying 10-fold cross-validation and the area under the ROC curve (ACU), as illustrated in Figure 3B. Two lines represent Lambda. Min and Lambda. Lse and each red dot represent the confidence interval for the appropriate λ value for the covariate of interest. We then used the Boruta feature selection algorithm on optimal parameters to help separate AUR patients from non-AUR patients. Six variables were ultimately chosen, including body mass index, prostate volume, history of diabetes, constipation, IPSS, and residual urine before biopsy (Figure 3C). After that, we divided the six variables into groups and used logistic multivariate regression to examine them. The outcomes of the univariate and multivariate logistic regression analyses are shown in Tables 2 and 3, respectively.
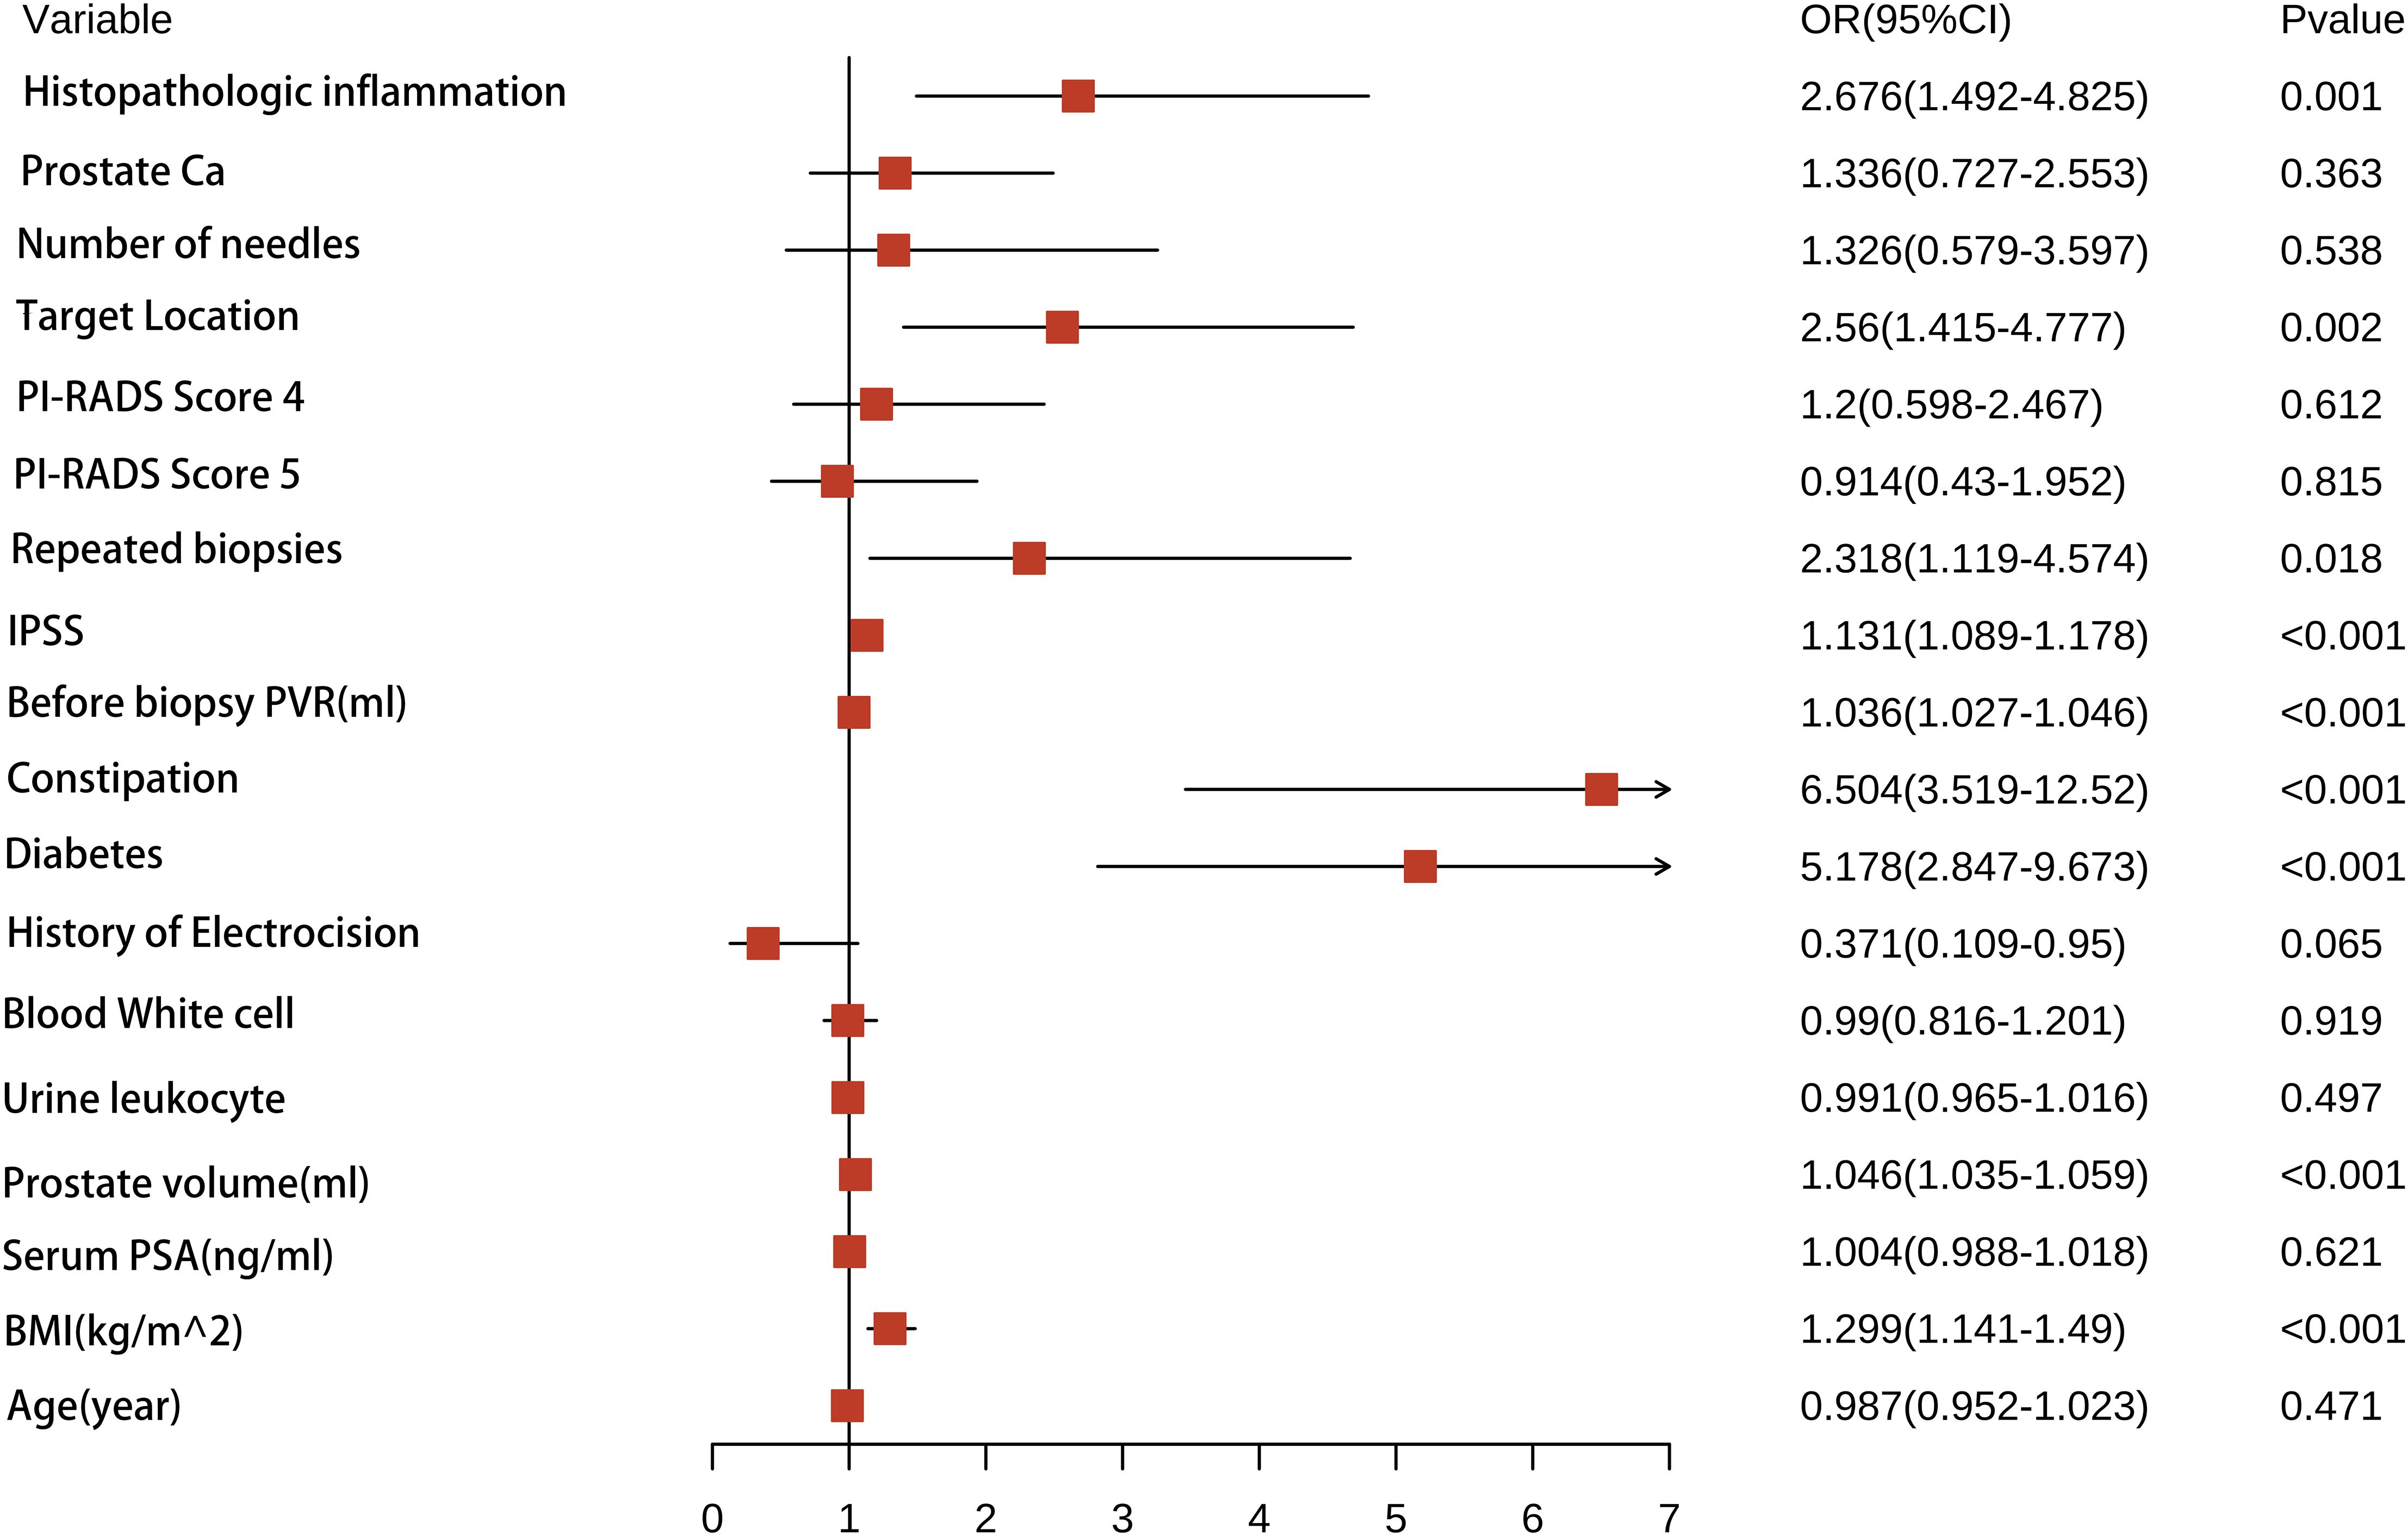
Figure 2. A forest plot illustrating the all of characteristics identified by univariate logistic regression analyses.
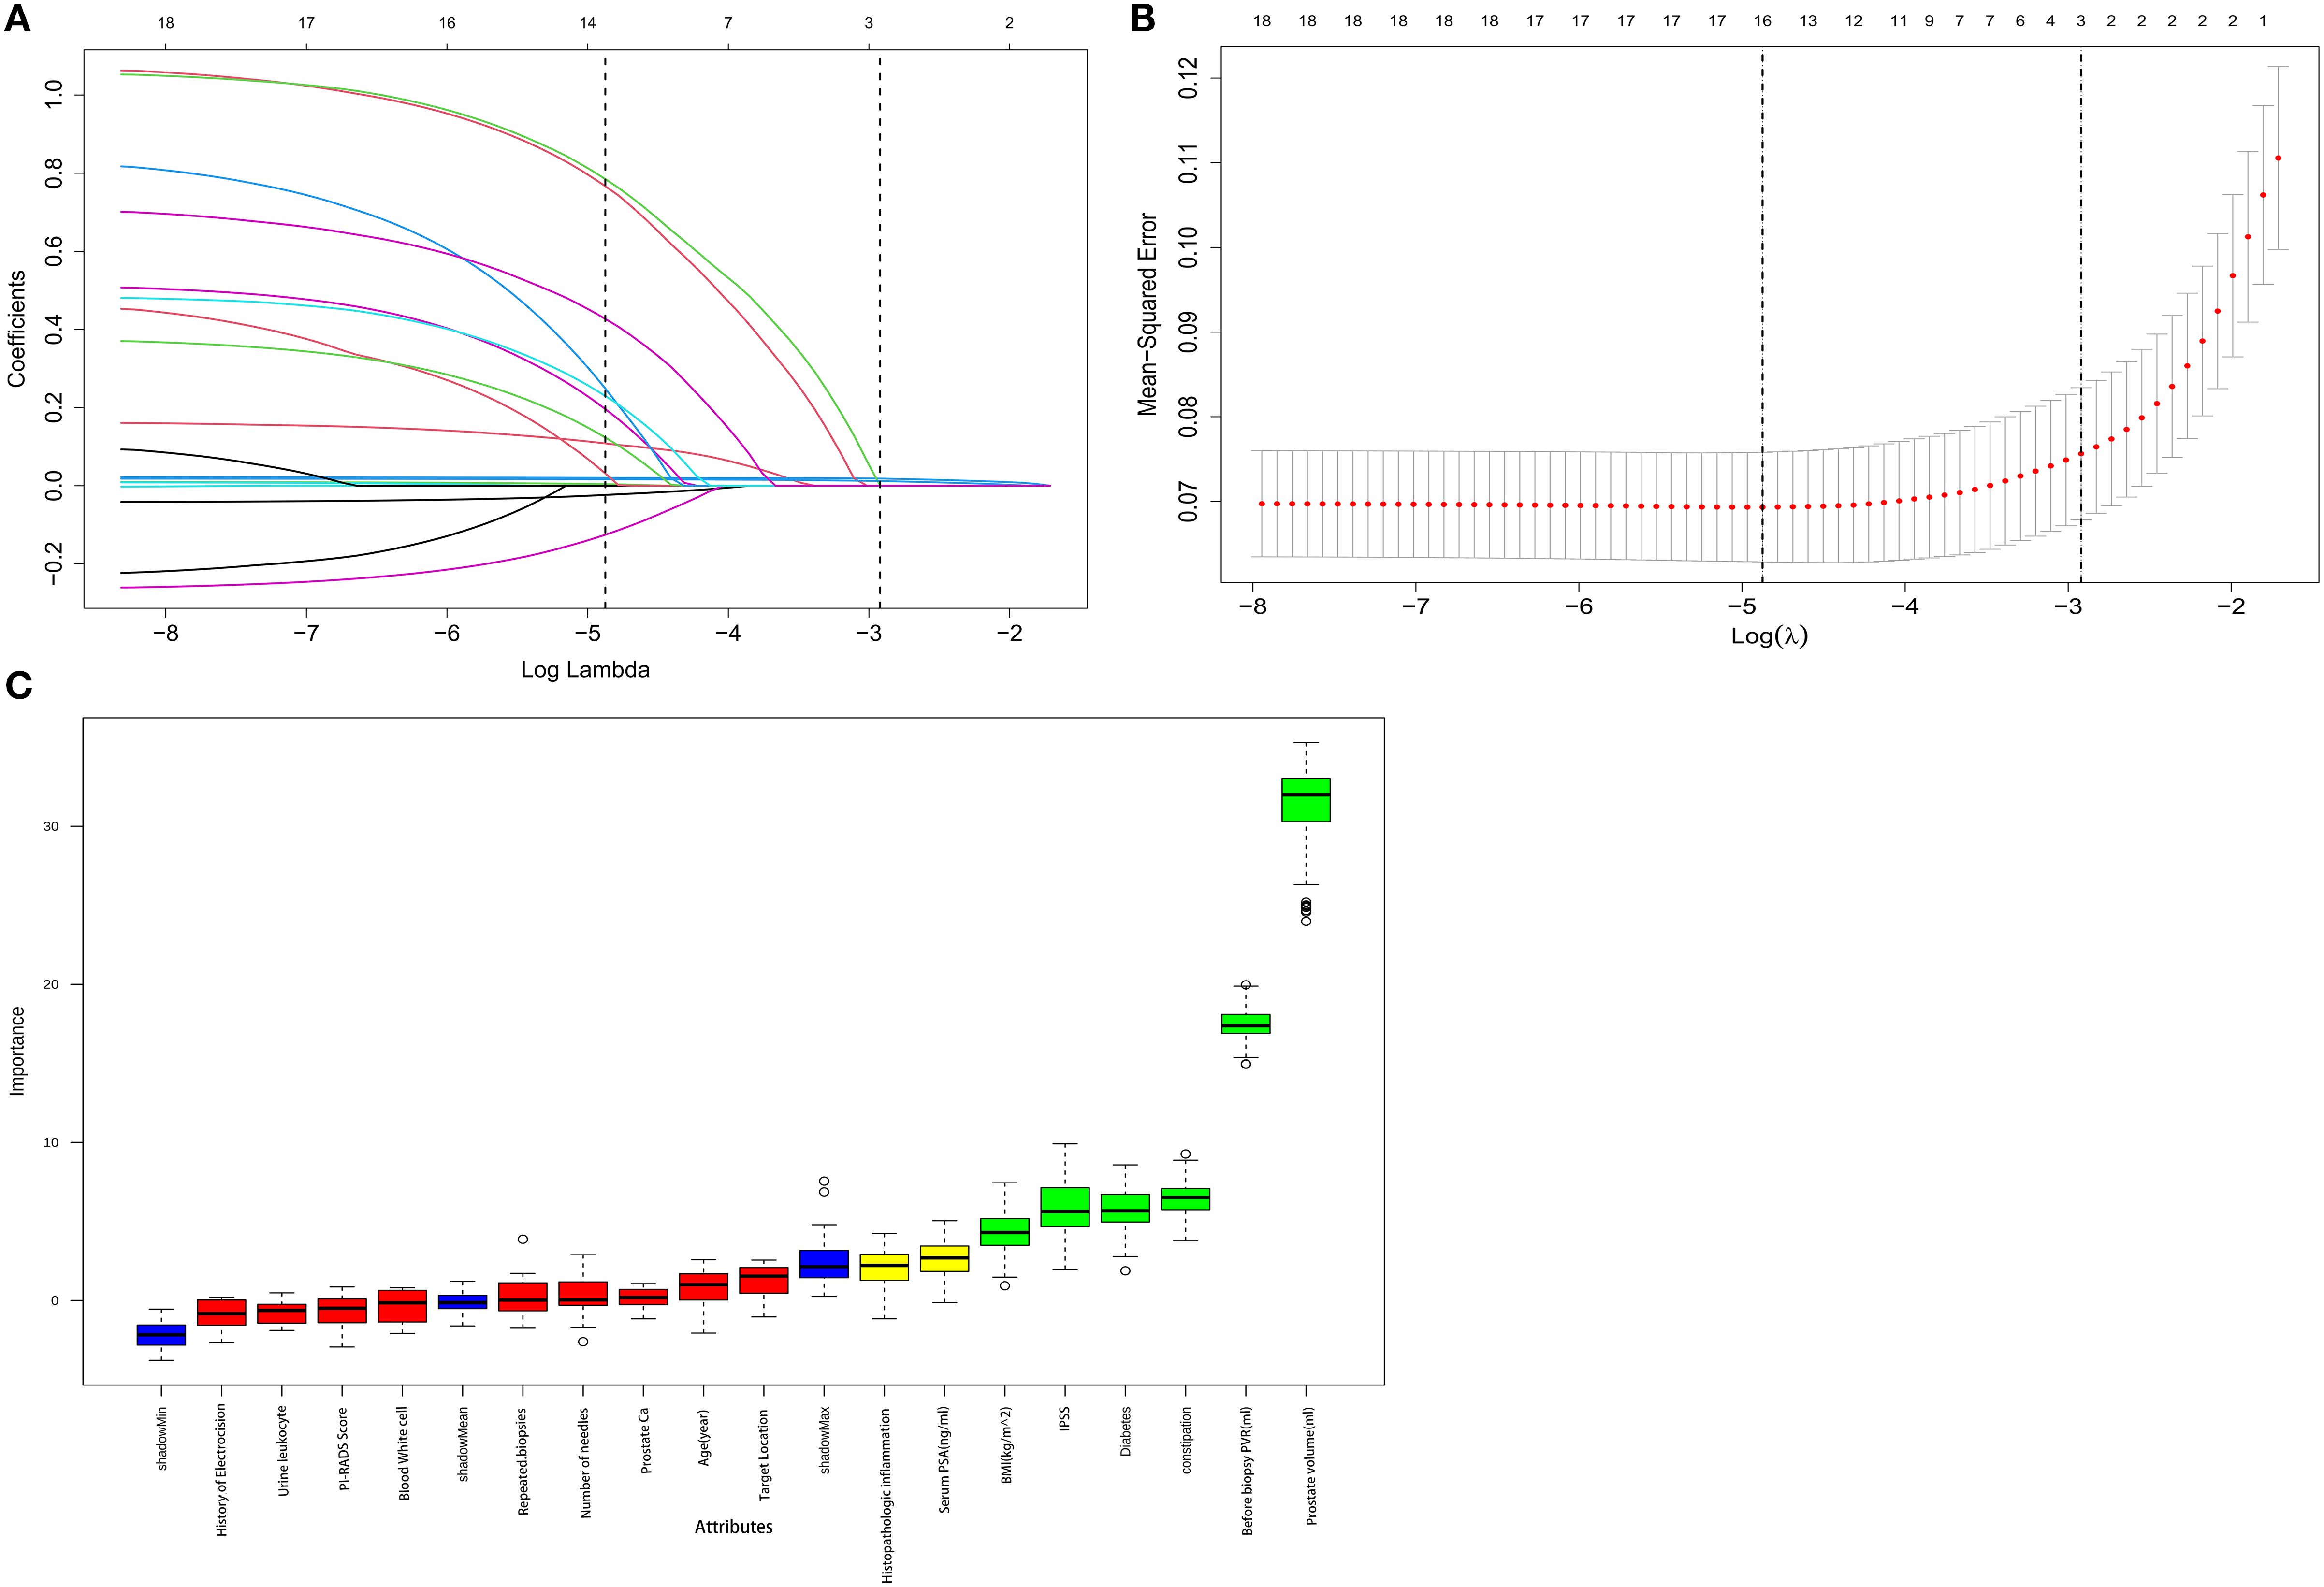
Figure 3. Boruta algorithm is used for feature selection, while LASSO is used for significant variable selection. (A) The clinical features’ LASSO coefficient profiles. (B) Tenfold cross-validation in LASSO produced the ideal penalization coefficient lambda. The figure displays the minimal mean square error’s lambda value. The most minor absolute shrinkage and selection operator is known as LASSO. (C) Boruta’s choice of function. We could counteract the predictive capacity of variables through these randomization features by using blue controls, which were risk permutation characteristics. Green features were validated as applicable; red features did not help predict AUR. The y-axis, linked to the standard deviation derived from 100 iterations, shows the variation in accuracy between each Z-score on the feature and the control. Level thresholds represent significant differences in thresholds between features and controls.
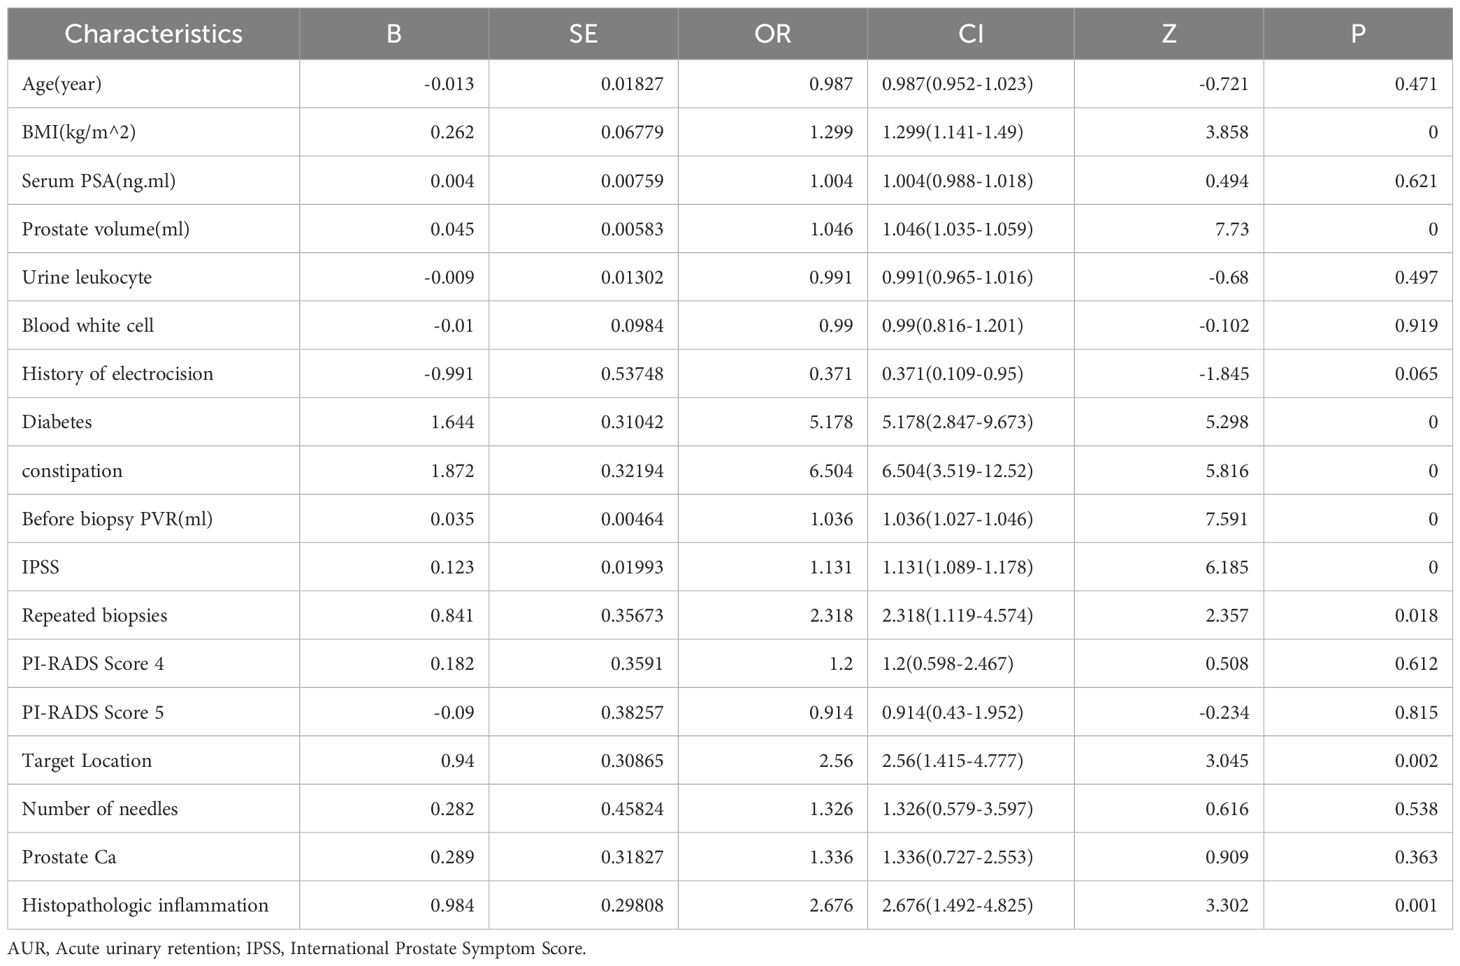
Table 2. Univariate Cox regression analysis of risk factors associated with AUR in patients undergoing TP.
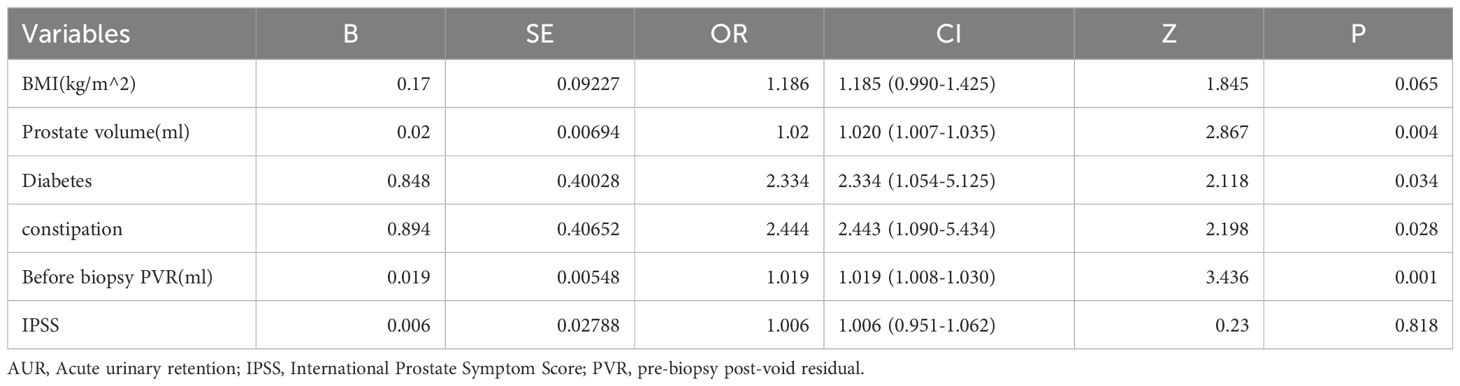
Table 3. Multivariate Logistic regression analysis of risk factors for AUR.
Modal chart model for estimating the risk of AUR following TP
The enrolled patients were split into training and test groups in a 7:3 ratio using a randomized stratified grouping technique (Supplementary Data). We constructed individualized nomogram estimates to estimate the chance of AUR in patients following TP based on the risk factors determined by binary logistic regression, Boruta feature selection method, and Lasso regression (Figure 4). Each element is assigned a score between 0 and 100 on a modal plot, representing its regression coefficient about the requirement of AUR. Adding the scores related to each component may determine the cumulative score, representing an individual’s probability of developing a post-TP AUR. For this calculation, a vertical line from each factor axis intersecting the nomogram’s point axis must be drawn. The total score obtained can then be compared to the total score table for explanatory purposes.
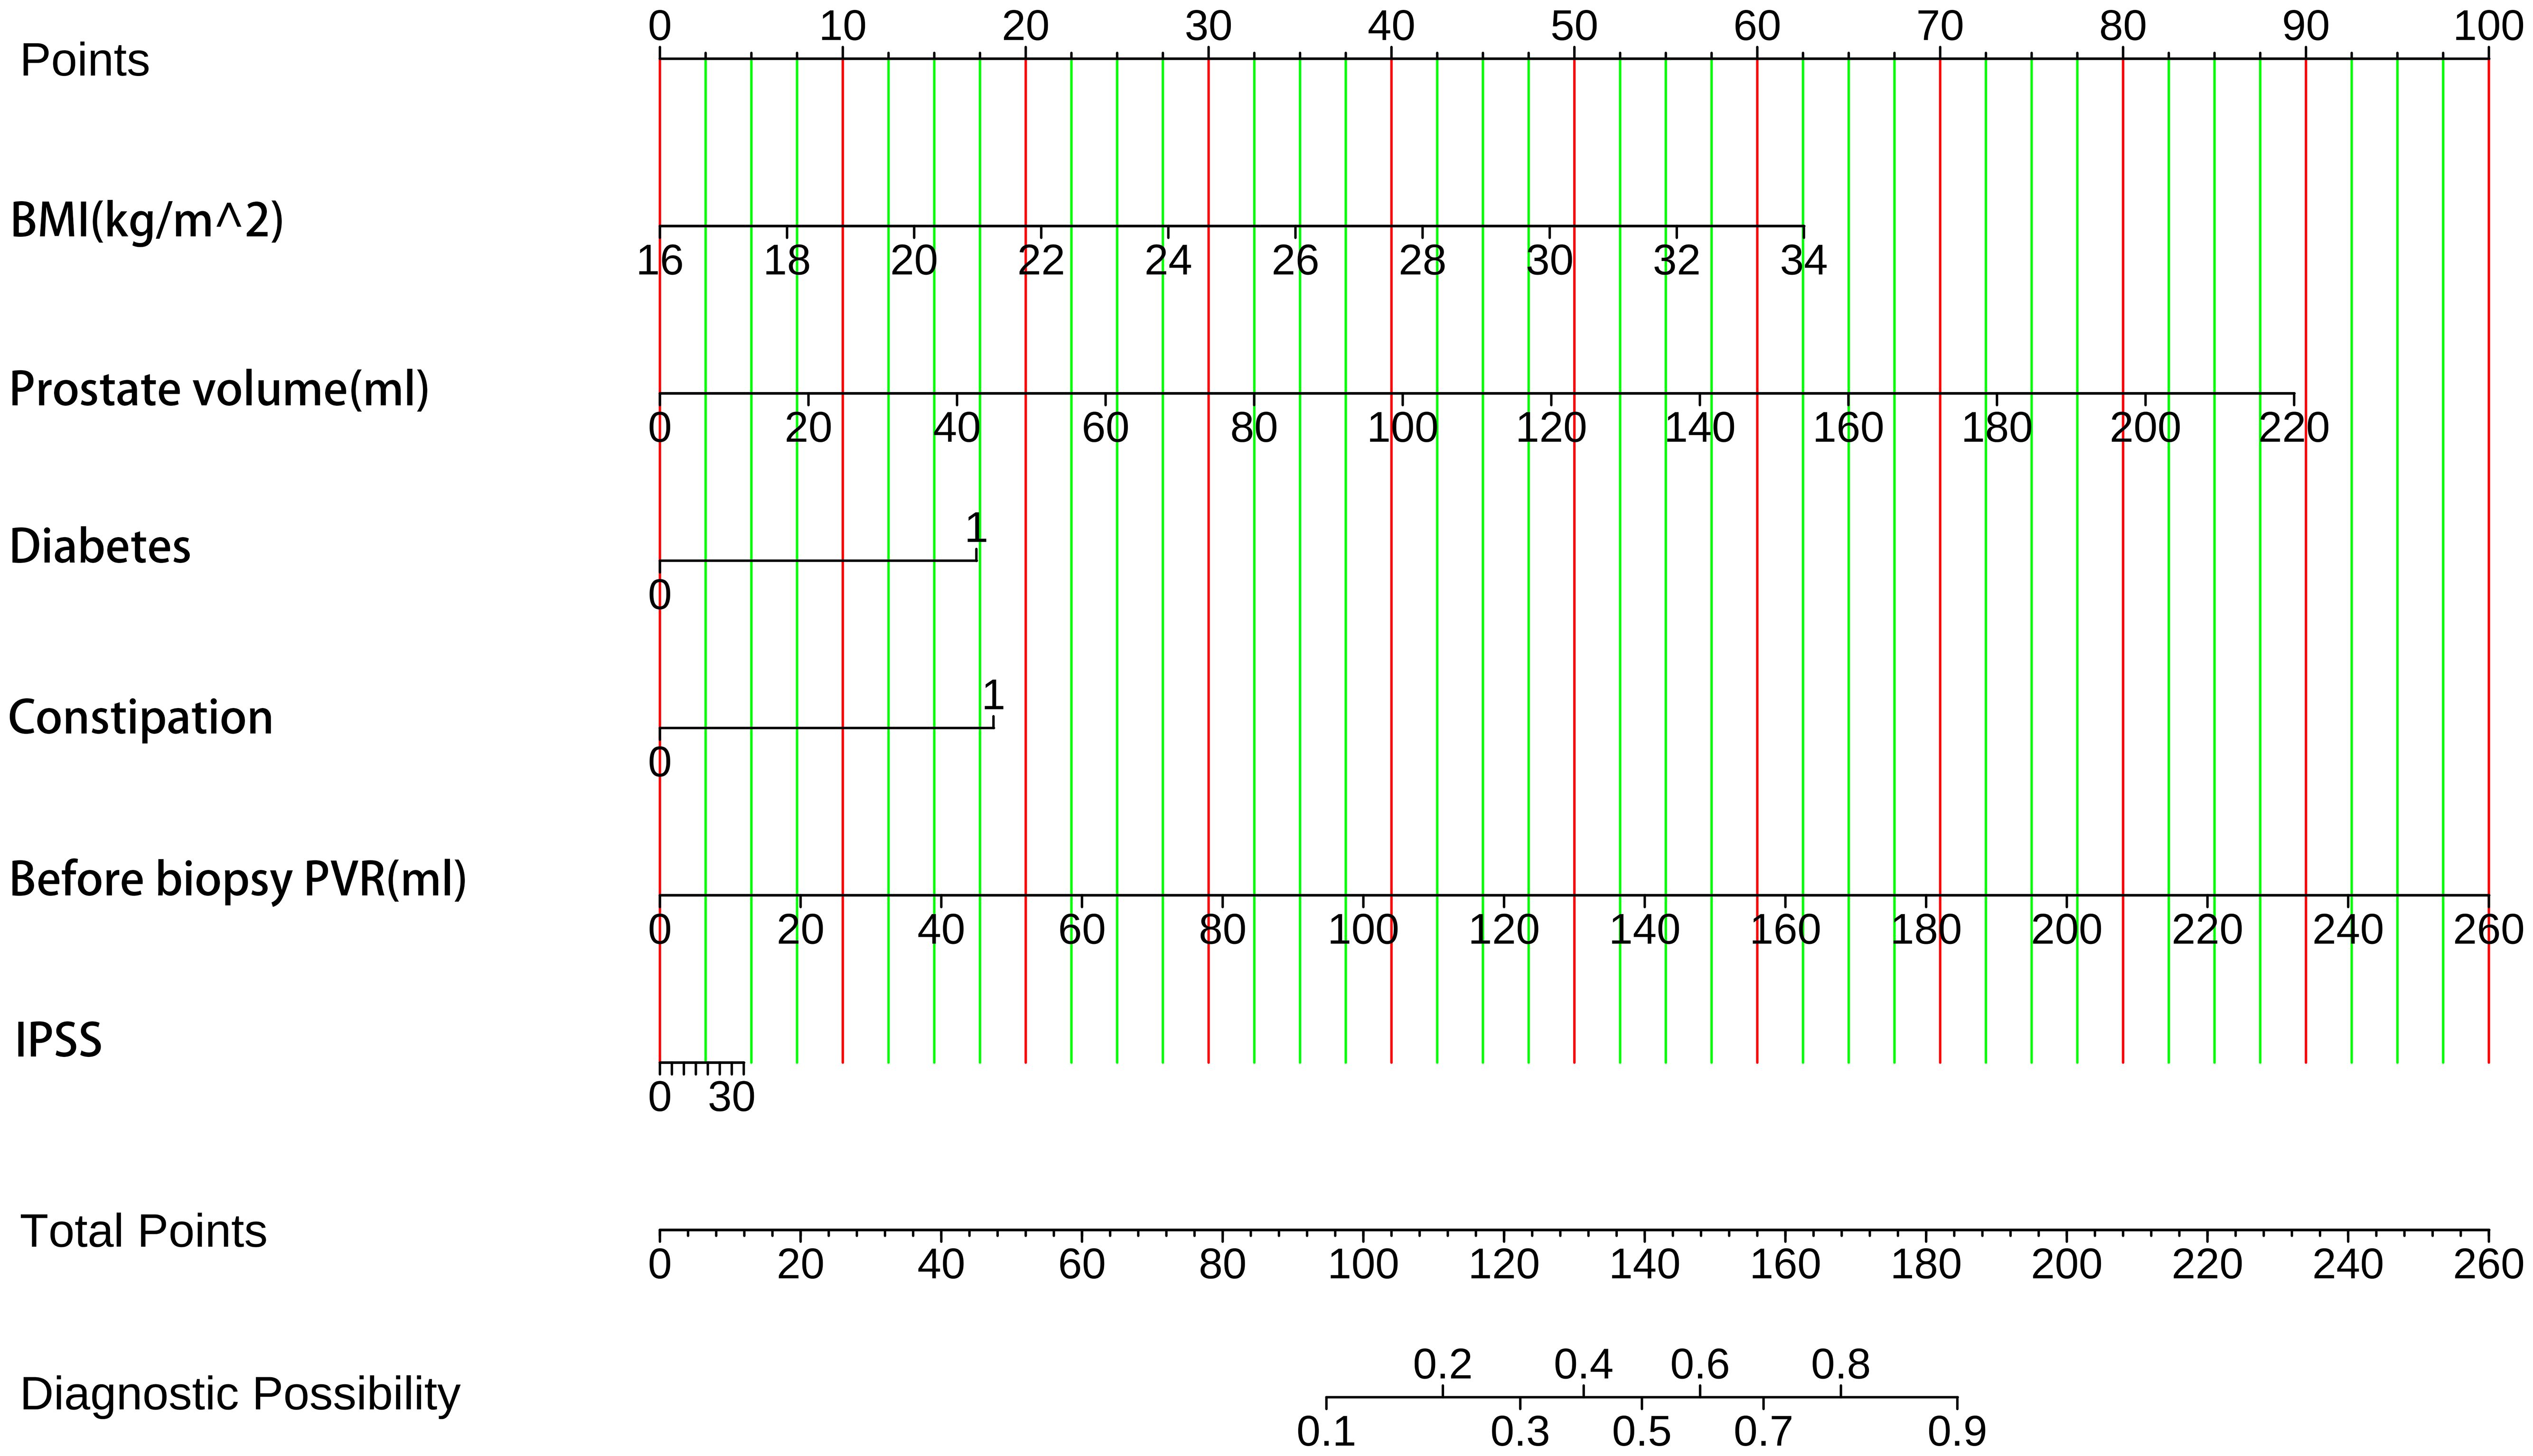
Figure 4. The probability of AUR in TP patients was predicted using clinical nomograms based on multiple logistic regression analysis and Boruta’s algorithm for feature selection. A line was drawn from the matching value to a “dot line” for every indicator to allocate points. By computing the likelihood of similar “totals” and using the individual score totals of the six measurements that comprise the nomogram, we can ascertain the patient’s risk of AUR. BMI, health index. PVR, post-void residual urine volume. IPSS, International Prostate Symptom Score.
Validation of nomogram models
For the training cohort model (Figure 5A), the AUC was 0.874 (95% CI: 0.806 – 0.9419), and for the testing cohort model (Figure 5B), it was 0.898 (0.8218 – 0.9741). The results of the training and testing cohorts showed that the model was effective in discriminating between high and low risk patients. The model was well corrected based on the Hosmer-Lemeshow goodness-of-fit test results for the training cohort (χ2 = 10.797, P = 0.2135) and validation cohort (χ2 = 11568, P = 0.1716). The model’s calibration analysis revealed that the model had been calibrated following 500 internal Bootstrap samplings. For the training set (Figure 6A), the Brier score was 0.059 with a p-value of 0.775 (> 0.05), and for the validation set (Figure 6B), it was 0.074 with a p-value of 0.697 (> 0.05). The calibration curve revealed a high degree of agreement between the actual likelihood of occurrence and the projected probability.
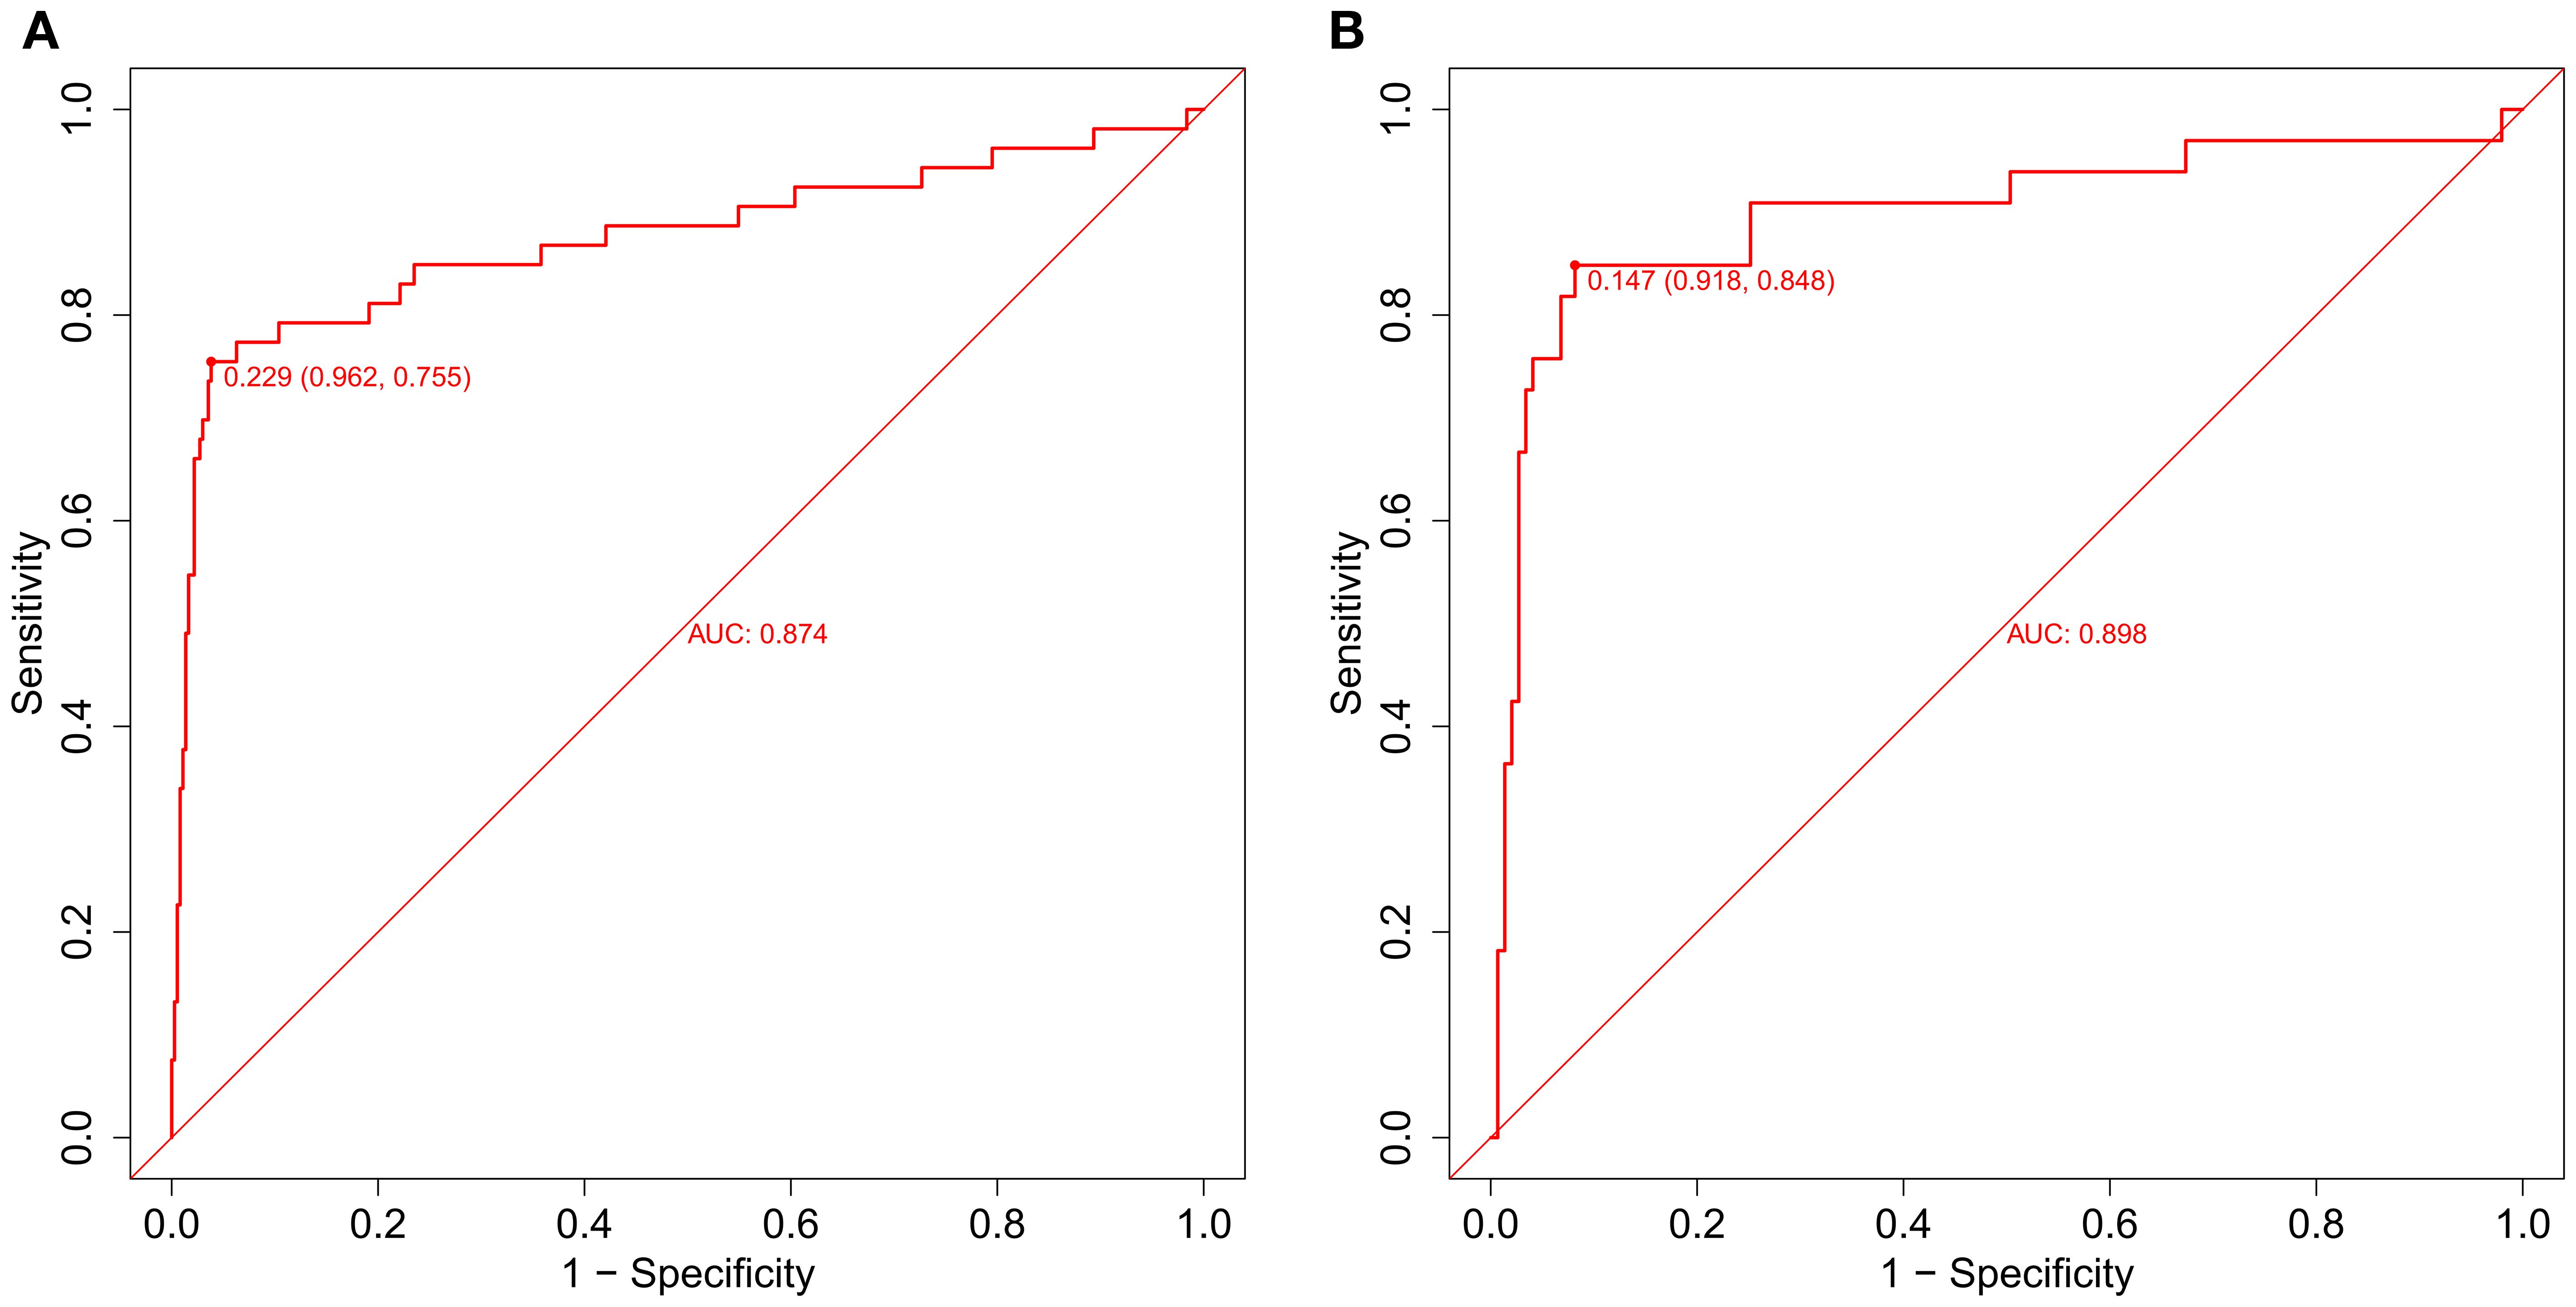
Figure 5. The evaluation and internal validation of the nomogram. (A) The AUC of the training group (AUC = 0.874) and (B) the validation group (AUC = 0.898) showed that the model had a high discrimination ability.
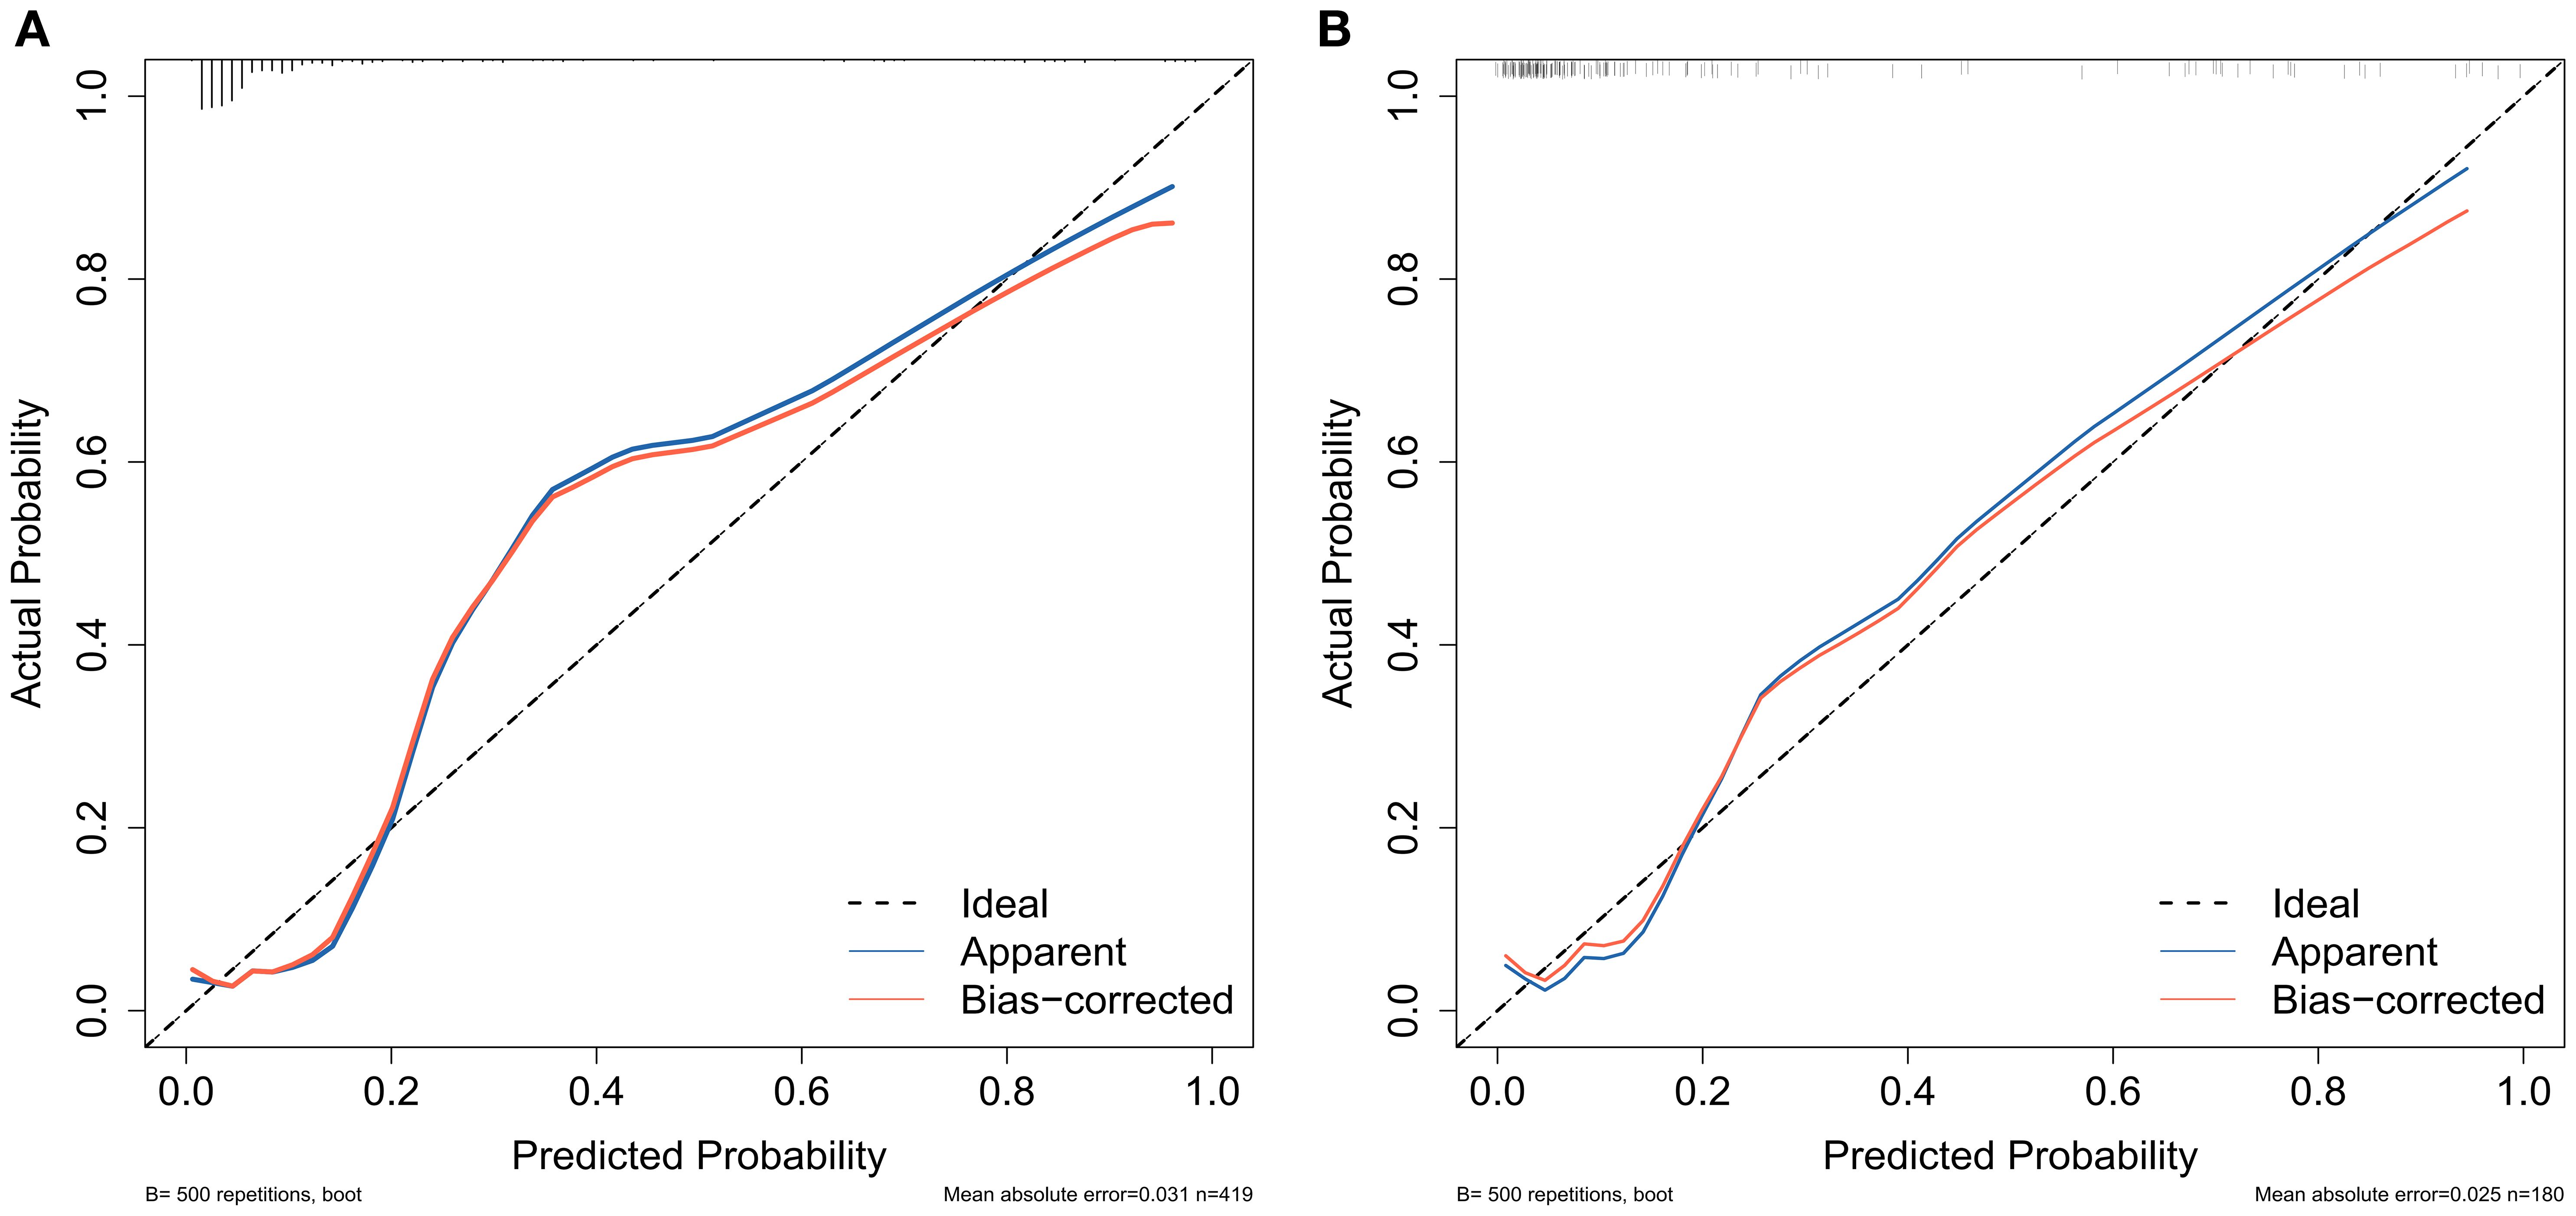
Figure 6. Calibration curves were used to assess the consistency of predicted versus actual risk of AUR following TP. (A) calibration curve of the training group and (B) calibration curve of the validation group.
Analysis of clinical practicability and rationality of prediction model
We employed the incidence of AUR in patients following TP as a state variable and the predicted probability of the calibration plot as a test variable to evaluate the nomogram’s clinical value. As illustrated in Figure 7, we created a clinical decision curve (DCA) for the nomogram model. The Y-axis shows net benefit, whereas the X-axis shows threshold probability. A solid gray line denotes that every patient had AUR, while a narrow solid black line shows that none did. The decision curve indicates that the model is clinically useful throughout a comparatively extensive threshold probability range. In contrast, the red curve shows the advantage for patients utilizing the prediction model for this study. Overall, DCA showed a net clinical benefit of the model over a wide range of thresholds, better than single measures (e.g., IPSS, prostate volume).
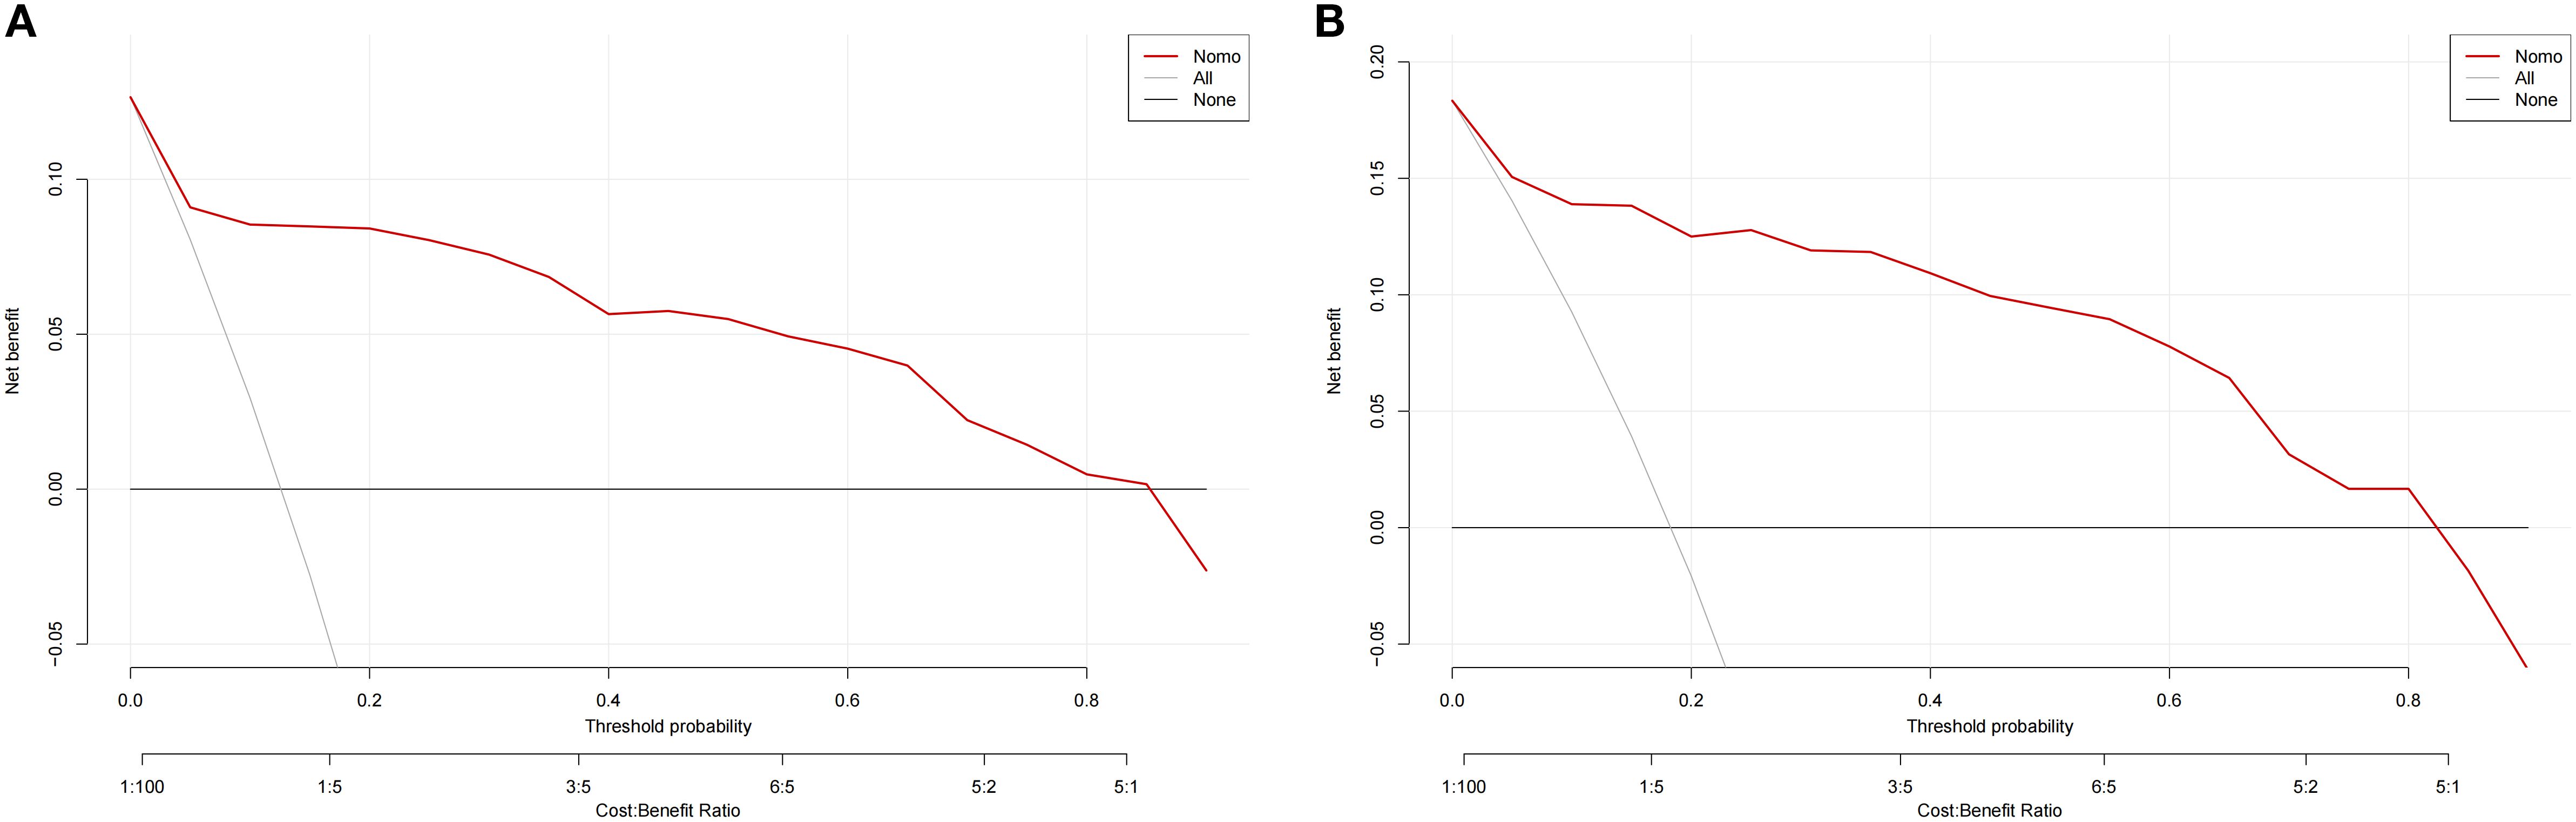
Figure 7. Clinical decision curves for nomogram models. (A) denote the decision curve for the training set, and (B) denote the decision curve for the validation set.
We contrasted the ROC curves of the predicted nomograms with those of models that only used one predictor to provide a more thorough assessment. In Figure 8, the nomogram area under the curve (AUR) was more significant than that of BMI, IPSS, pre-biopsy residual urine, and prostate volume alone, indicating the model’s plausibility; this suggests that the AUR of individual predictors was consistently smaller than that of the predictive model, highlighting the model’s robust performance.
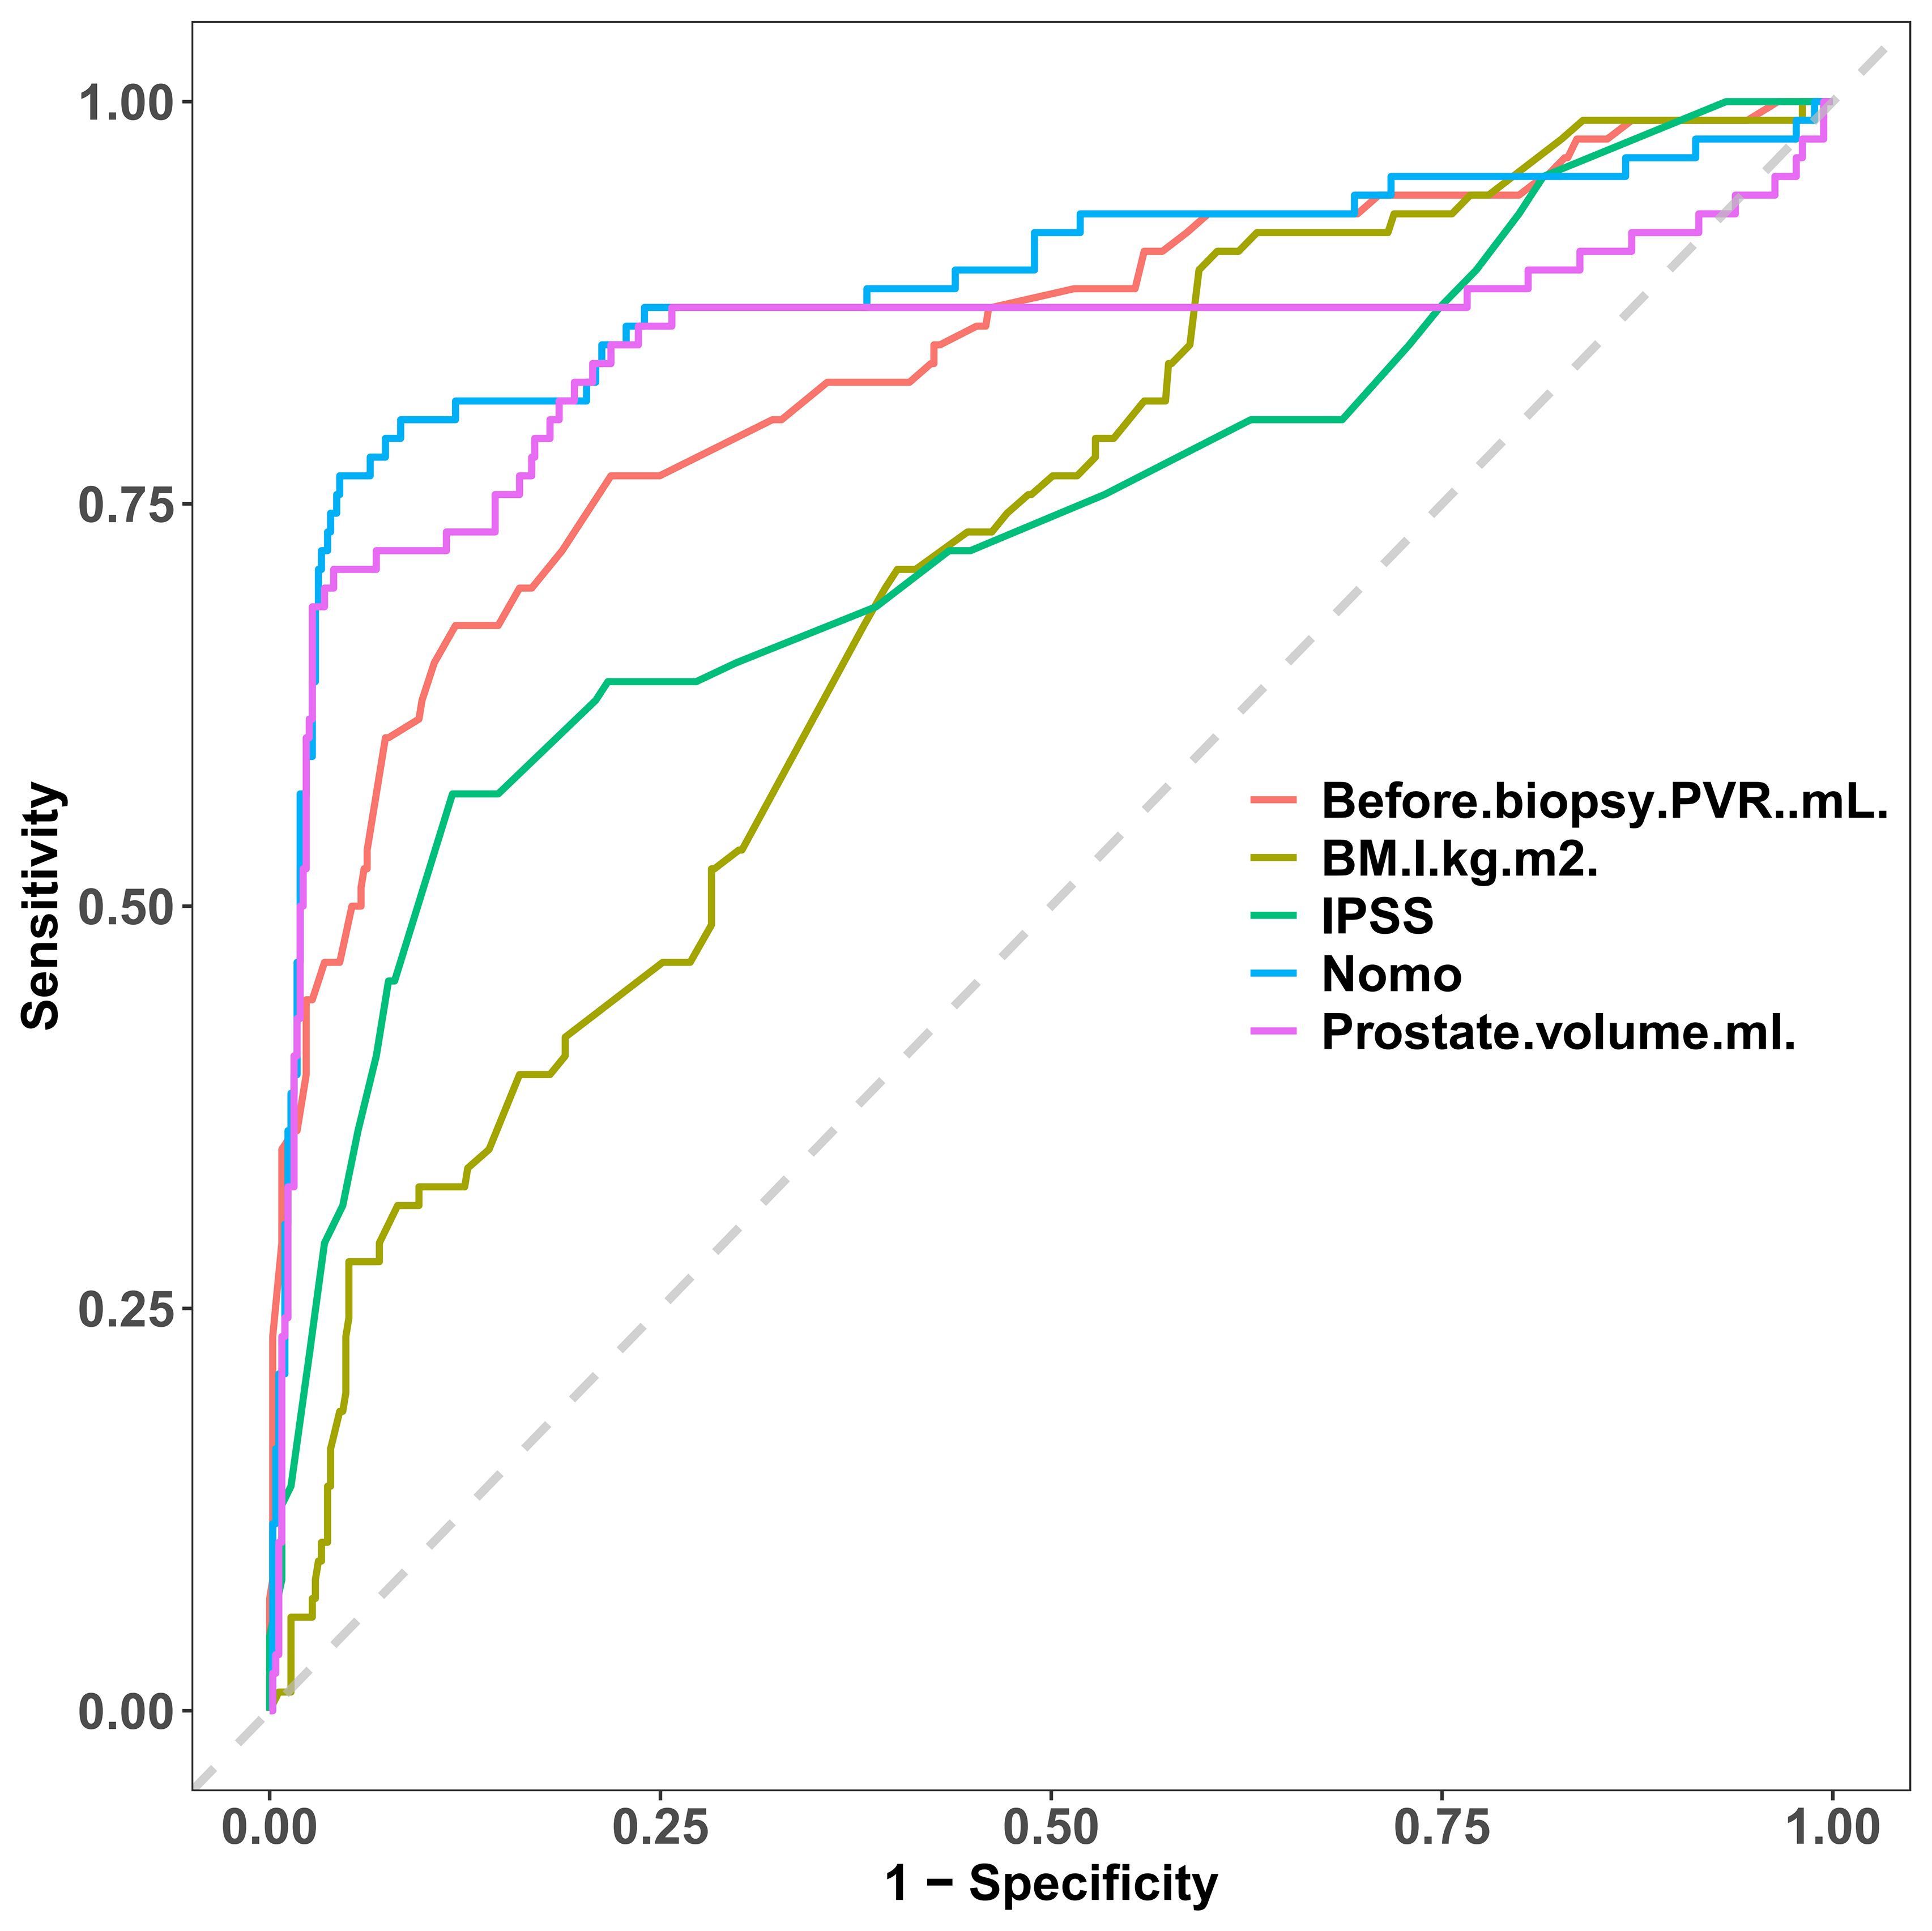
Figure 8. Rationality curve analysis of residual variable risk nomogram.
Discussion
Current studies have mostly focused on the comparison of diagnostic accuracy and complication rates between transperineal and transrectal prostate biopsy in the diagnosis of prostate cancer (27–30). Since template biopsies are carried out more frequently than TRUS biopsies, evaluating any problems and the patient’s following effects is critical. Before template biopsy, it is helpful to understand that postoperative complications, counseling, and patient consent are clinically significant risk factors linked with urine retention. According to reports, between 0.10% and 3% of TP biopsies result in infection (13, 31, 32). AUR occurs in 1.5-13% of patients having TP prostate biopsies (14, 15, 33, 34). Although the frequency of these occurrences has been reported, there is a shortage of information evaluating probable risk factors for infection and AUR following prostate biopsy for TP (13, 14). Predictive models are receiving more attention in several clinical domains, including sepsis, Kawasaki disease, and malignant tumors. Additionally, there is a growing body of pertinent research in these domains (35–38). For AUR following TP, there aren’t many prediction models available yet. Therefore, to support clinical decision-making and offer individualized treatment plans, we set out to create a predictive model for developing AUR following TP surgery.
The clinical information and laboratory parameters of 599 patients who had prostate biopsies were reviewed retrospectively. These included easily accessible laboratory and anthropological data, such as age, sex, BMI, prostate-specific antigen, diabetes, and residual urine before biopsy. We determined the independent variables for AUR in TP patients to be body mass index, prostate volume, history of diabetes, constipation, IPSS, and residual urine before biopsy using various statistical techniques. We created a straightforward and precise nomogram, verified it within the model, and demonstrated its clinically solid applicability and efficacy.
In 14.3% of our cohort, urinary retention happened. Urinary retention has an incidence ranging from 1.6 to 11.4%, according to the NICE guidelines for transperineal template biopsy of the prostate (12, 33). Pepe et al. (34) conducted a large single-center study involving 3000 patients with varied amounts of biopsies, and they found a low mean incidence of urine retention of 6.7%. Our rate was compared to other groups (39), even though it was marginally higher than the incidence reported by NICE, as reported by Merrick et al. Urinary retention occurs 1.7% of the time in patients receiving TRUS biopsy, according to a comprehensive review by Loeb et al. (11). In contrast to transperineal biopsy, which typically requires at least 24 cores, the conventional protocol for TRUS biopsy only requires 12 cores. Urinary retention can also be prevented by reducing the number of biopsies performed. Taking targeted biopsies instead of entire templates can also save operating time. However, it is contingent upon the operator’s cognitive objectives. We selected targeted + systematic access, a total of 16 needles, for patients with apparent targets on MRIs, which may be why the number of biopsy needles we used did not lower the rate of urine retention.
In line with our findings, several studies have found a positive correlation between the frequency of urine retention and the number of needle biopsies performed; however, this relationship was not statistically significant (33, 34). Urinary retention was linked to a prostate volume of more than 68 milliliters, according to Willis et al. (22). Increased prostate volume has also been found in several studies to be an independent predictor of AUR diagnosis after TP (7, 14). The ratio of the transitional zone volume to the total prostate volume and a greater IPSS are two additional prostate volume markers that may predispose patients to urine retention and worsen LUTS (11). Urinary retention was significantly predisposed to the severity of LUTS in our study. Furthermore, it has been suggested that more enormous prostate volumes and higher baseline IPSS values may be indicators of LUTS and AUR following PB (40). Consequently, discussing risk with patients could be considered a preoperative risk factor. Constipation can be regarded as a significant and trustworthy predictor of AUR in individuals receiving transrectal ultrasonography-guided prostate biopsy, according to research by Cahit Sahin et al. (41). Acute postoperative urine retention has also been described in our community and is also connected with diabetes mellitus and aging (11). One known consequence of diabetes is neuroautonomic dysfunction, which has been linked to an increased risk of urine retention. According to other research, diagnosing chronic urine retention (CUR) is typically more challenging. It is generally related to higher levels of postvoid residual urine (PVR) (42), and our data imply that PVR before biopsy is a separate risk factor for AUR following TP. Ultimately, our research revealed that AUR patients’ BMIs were greater than non-AUR patients. This appears to be a discovery. No study has been done on how BMI affects AUR following TP biopsy. BMI is a little-studied topic, and while we show some intriguing findings, further research is needed to draw firm conclusions.
Existing studies mostly focus on complications after transrectal puncture (TR), there are very few studies on AUR after TP, and most of them are univariate analysis (such as only focusing on prostate volume or number of puncture needles); a few studies involving TP do not establish prediction models and do not include machine learning algorithms to optimize variable screening (29, 43, 44). As Francesca Kum et al. found factors for urinary retention after transperineal template biopsy of the prostate, but only a univariate association, no predictive model was constructed (14). Sabri Cavkaytar et al. (45) used logistic regression to analyze risk factors for postpartum urinary retention, but given the high dimensionality of the data, no further dimensionality reduction was performed using machine learning algorithms. Samuel L Malnik et al. used machine learning to develop a postoperative predictive model for urinary retention after lumbar spine surgery, but only LASSO regression models were used, but often this was not able to eliminate random fluctuations in factor interactions (46). Moreover, the AUC of our two machine learning algorithms was more significant than that of Ding Xuexuan et al., who identified the core genes of asthma using five machine learning algorithms (21).
The clinical nomogram of this study integrates biomarkers and clinical characteristics, includes factors such as constipation and BMI in the prediction model of AUR after TP for the first time, and improves the rigor of variable screening through a two-feature selection algorithm to provide a personalized assessment of whether to continue Foley catheter or take additional safety measures to prevent AUR in TP patients. The nomogram constructed in this study is based on six easily accessible clinical measures (body mass index, prostate volume, history of diabetes, constipation, International Prostate Symptom Score, preoperative residual urine volume) that can be directly integrated into the preoperative assessment process of transperineal prostate biopsy (TP). Clinicians achieve precise stratified management by rapidly calculating the patient ‘s acute urinary retention (AUR) risk score: for example, high-risk patients (score > 70%): prophylactic use of alpha-blockers to relax the bladder neck preoperatively, or prolonged monitoring to 72 hours postoperatively, timely detection of signs of urinary retention, and reduction in the risk of complications such as emergency catheterization rate and overdistension of the bladder; for low-risk patients (score < 30%): use a standardized discharge regimen to reduce unnecessary inpatient observation and reduce medical costs while ensuring safety.
The current study has some limitations. It is a single-center cross-sectional study with a limited sample size that may introduce selection bias. In addition, we only performed internal validation on nomogram models, and subsequent studies also required external validation. Furthermore, potential influencing factors such as the number of puncture needles and operator experience were not included, and subsequent studies could expand the range of variables. Subsequent studies can be conducted in a large sample, multicenter, prospective study to find more risk factors for AUR complications in TP patients so that relevant measures can be taken early to avoid repeated catheterization and further hospitalization and improve patient discomfort.
Data availability statement
The original contributions presented in the study are included in the article/Supplementary Material. Further inquiries can be directed to the corresponding authors.
Ethics statement
The studies involving humans were approved by the Medical Ethics Review Committee of the First People ‘s Hospital of Nantong. The studies were conducted in accordance with the local legislation and institutional requirements. Written informed consent for participation was not required from the participants or the participants’ legal guardians/next of kin in accordance with the national legislation and institutional requirements.
Author contributions
CS: Investigation, Writing – original draft. GC: Investigation, Methodology, Writing – review & editing. ZC: Investigation, Methodology, Writing – review & editing. JY: Investigation, Project administration, Writing – review & editing. BZ: Formal Analysis, Investigation, Methodology, Writing – review & editing.
Funding
The author(s) declare financial support was received for the research and/or publication of this article. The present study was supported by Nantong Minsheng Science and Technology Program (MS22022085), Jiangsu Geriatric Health Research Project (LKM2022059), Yaodong Shenzhou Pharmaceutical Research Capacity Building Fund Project (2024-KY002-01), Nantong University Clinical Medicine Special Scientific Research Fund Project (2024LQ019), and Basic Research and Social Minsheng Plan Project (MS22022085).
Conflict of interest
The authors declare that the research was conducted in the absence of any commercial or financial relationships that could be construed as a potential conflict of interest.
Generative AI statement
The author(s) declare that no Generative AI was used in the creation of this manuscript.
Any alternative text (alt text) provided alongside figures in this article has been generated by Frontiers with the support of artificial intelligence and reasonable efforts have been made to ensure accuracy, including review by the authors wherever possible. If you identify any issues, please contact us.
Publisher’s note
All claims expressed in this article are solely those of the authors and do not necessarily represent those of their affiliated organizations, or those of the publisher, the editors and the reviewers. Any product that may be evaluated in this article, or claim that may be made by its manufacturer, is not guaranteed or endorsed by the publisher.
Supplementary material
The Supplementary Material for this article can be found online at: https://www.frontiersin.org/articles/10.3389/fonc.2025.1626529/full#supplementary-material
Abbreviations
TP, Transperineal; TR, Transrectal; LASSO, Least absolute shrinkage and selection operator; PSA, prostate-specific antigen; AUR, Acute urinary retention; IPSS, International Prostate Symptom Score; PVR, Pre-biopsy post-void residual.
References
1. Siegel RL, Miller KD, Fuchs HE, and Jemal A. Cancer statistics, 2022. CA A Cancer J Clin. (2022) 72:7–33. doi: 10.3322/caac.21708
2. Mottet N, Van Den Bergh RCN, Briers E, Van Den Broeck T, Cumberbatch MG, De Santis M, et al. EAU-EANM-ESTRO-ESUR-SIOG guidelines on prostate cancer—2020 update. Part 1: screening, diagnosis, and local treatment with curative intent. Eur Urol. (2021) 79:243–62. doi: 10.1016/j.eururo.2020.09.042
3. Wagenlehner FME, Van Oostrum E, Tenke P, Tandogdu Z, Çek M, Grabe M, et al. Infective complications after prostate biopsy: outcome of the global prevalence study of infections in urology (GPIU) 2010 and 2011, A prospective multinational multicentre prostate biopsy study. Eur Urol. (2013) 63:521–7. doi: 10.1016/j.eururo.2012.06.003
4. Lindert KA, Kabalin JN, and Terris MK. Bacteremia and bacteriuria after transrectal ultrasound guided prostate biopsy. J Urol. (2000) 164:76–80. doi: 10.1016/S0022-5347(05)67453-8
5. Liss MA, Ehdaie B, Loeb S, Meng MV, Raman JD, Spears V, et al. An update of the american urological association white paper on the prevention and treatment of the more common complications related to prostate biopsy. J Urol. (2017) 198:329–34. doi: 10.1016/j.juro.2017.01.103
6. Efesoylu O, Bozlu M, Cayan S, and Akbay E. Complications of transrectal ultrasound-guided 12-core prostate biopsy: a single center experience with 2049 patients. Turkish J Urol. (2013) 39:6–11. doi: 10.5152/tud.2013.002
7. Skouteris VM, Crawford ED, Mouraviev V, Arangua P, Metsinis MP, Skouteris M, et al. Transrectal ultrasound-guided versus transperineal mapping prostate biopsy: complication comparison. Rev Urol. (2018) 20:19–25. doi: 10.3909/riu0785
8. Miah S, Eldred-Evans D, Simmons LAM, Shah TT, Kanthabalan A, Arya M, et al. Patient reported outcome measures for transperineal template prostate mapping biopsies in the PICTURE study. J Urol. (2018) 200:1235–40. doi: 10.1016/j.juro.2018.06.033
9. Young R, Norris B, Reeves F, and Peters JS. A retrospective comparison of transrectal and transperineal prostate biopsies: experience of a single surgeon. J Endourol. (2019) 33:498–502. doi: 10.1089/end.2019.0170
10. Berry B, Parry MG, Sujenthiran A, Nossiter J, Cowling TE, Aggarwal A, et al. Comparison of complications after transrectal and transperineal prostate biopsy: a national population-based study. BJU Int. (2020) 126:97–103. doi: 10.1111/bju.15039
11. Loeb S, Vellekoop A, Ahmed HU, Catto J, Emberton M, Nam R, et al. Systematic review of complications of prostate biopsy. Eur Urol. (2013) 64:876–92. doi: 10.1016/j.eururo.2013.05.049
12. Sivaraman A, Sanchez-Salas R, Barret E, Ahallal Y, Rozet F, Galiano M, et al. Transperineal template-guided mapping biopsy of the prostate. Int J Urol. (2015) 22:146–51. doi: 10.1111/iju.12660
13. Ding X, Luan Y, Lu S, Zhou G, Huang T, Zhu L, et al. Risk factors for infection complications after transrectal ultrasound-guided transperineal prostate biopsy. World J Urol. (2021) 39:2463–7. doi: 10.1007/s00345-020-03454-y
14. Kum F, Jones A, and Nigam R. Factors influencing urinary retention after transperineal template biopsy of the prostate: outcomes from a regional cancer centre. World J Urol. (2019) 37:337–42. doi: 10.1007/s00345-018-2390-8
15. Buskirk SJ, Pinkstaff DM, Petrou SP, Wehle MJ, Broderick GA, Young PR, et al. Acute urinary retention after transperineal template-guided prostate biopsy. Int J Radiat Oncol Biol Phys. (2004) 59:1360–6. doi: 10.1016/j.ijrobp.2004.01.045
16. Ru B, Tan X, Liu Y, Kannapur K, Ramanan D, Kessler G, et al. Comparison of machine learning algorithms for predicting hospital readmissions and worsening heart failure events in patients with heart failure with reduced ejection fraction: modeling study. JMIR Form Res. (2023) 7:e41775. doi: 10.2196/41775
17. Sabouri M, Rajabi AB, Hajianfar G, Gharibi O, Mohebi M, Avval AH, et al. Machine learning based readmission and mortality prediction in heart failure patients. Sci Rep. (2023) 13:18671. doi: 10.1038/s41598-023-45925-3
18. Zhou H, Xin Y, and Li S. A diabetes prediction model based on Boruta feature selection and ensemble learning. BMC Bioinf. (2023) 24:224. doi: 10.1186/s12859-023-05300-5
19. Li M, Lu X, Yang H, Yuan R, Yang Y, Tong R, et al. Development and assessment of novel machine learning models to predict medication non-adherence risks in type 2 diabetics. Front Public Health. (2022) 10:1000622. doi: 10.3389/fpubh.2022.1000622
20. Meng Z, Wang M, Zhao Z, Zhou Y, Wu Y, Guo S, et al. Development and validation of a predictive model for severe COVID-19: A case-control study in China. Front Med. (2021) 8:663145. doi: 10.3389/fmed.2021.663145
21. Ding X, Qin J, Huang F, Feng F, and Luo L. The combination of machine learning and untargeted metabolomics identifies the lipid metabolism -related gene CH25H as a potential biomarker in asthma. Inflammation Res. (2023) 72:1099–119. doi: 10.1007/s00011-023-01732-0
22. Sandberg M, Whitman W, Greenberg J, Hingu J, Thakker P, Rong A, et al. Risk factors for infection and acute urinary retention following transperineal prostate biopsy. Int Urol Nephrol. (2023) 56:819–26. doi: 10.1007/s11255-023-03854-0
23. Epstein JI, Allsbrook WC, Amin MB, and Egevad LL. The 2005 international society of urological pathology (ISUP) consensus conference on Gleason grading of prostatic carcinoma. Am J Surg Pathol. (2005) 29:1228–42. doi: 10.1097/01.pas.0000173646.99337.b1
24. Weinreb JC, Barentsz JO, Choyke PL, Cornud F, Haider MA, Macura KJ, et al. PI-RADS prostate imaging – reporting and data system: 2015, version 2. Eur Urol. (2016) 69:16–40. doi: 10.1016/j.eururo.2015.08.052
25. Padhani AR, Weinreb J, Rosenkrantz AB, Villeirs G, Turkbey B, and Barentsz J. Prostate imaging-reporting and data system steering committee: PI-RADS v2 status update and future directions. Eur Urol. (2019) 75:385–96. doi: 10.1016/j.eururo.2018.05.035
26. Sauerbrei W, Royston P, and Binder H. Selection of important variables and determination of functional form for continuous predictors in multivariable model building. Stat Med. (2007) 26:5512–28. doi: 10.1002/sim.3148
27. Najjar S, Mirvald C, Danilov A, Labanaris A, Vlaicu AG, Giurca L, et al. Comparative analysis of diagnostic accuracy and complication rate of transperineal versus transrectal prostate biopsy in prostate cancer diagnosis. Cancers. (2025) 17:1006. doi: 10.3390/cancers17061006
28. Reddivari AKR and Mehta P. Prostatic abscess. In: StatPearls. StatPearls Publishing, Treasure Island (FL (2025).
29. Bryant RJ, Marian IR, Williams R, Lopez JF, Mercader C, Raslan M, et al. Local anaesthetic transperineal biopsy versus transrectal prostate biopsy in prostate cancer detection (TRANSLATE): a multicentre, randomised, controlled trial. Lancet Oncol. (2025) 26:583–95. doi: 10.1016/S1470-2045(25)00100-7
30. Stangl FP, Day E, Vallée M, Bilsen MP, Grossmann NC, Falkensammer E, et al. Infectious complications after transrectal versus transperineal prostate biopsy: A systematic review and meta-analysis. Eur Urol Focus. (2025) S2405-4569(25)00209-3:S2405456925002093. doi: 10.1016/j.euf.2025.07.005
31. Huang G-L, Kang C-H, Lee W-C, and Chiang P-H. Comparisons of cancer detection rate and complications between transrectal and transperineal prostate biopsy approaches - a single center preliminary study. BMC Urol. (2019) 19:101. doi: 10.1186/s12894-019-0539-4
32. Castellani D, Pirola GM, Law YXT, Gubbiotti M, Giulioni C, Scarcella S, et al. Infection Rate after Transperineal Prostate Biopsy with and without Prophylactic Antibiotics: Results from a Systematic Review and Meta-Analysis of Comparative Studies. J Urol. (2022) 207:25–34. doi: 10.1097/JU.0000000000002251
33. Pinkstaff DM, Igel TC, Petrou SP, Broderick GA, Wehle MJ, and Young PR. Systematic transperineal ultrasound-guided template biopsy of the prostate: Three-year experience. Urology. (2005) 65:735–9. doi: 10.1016/j.urology.2004.10.067
34. Pepe P and Aragona F. Morbidity After Transperineal Prostate Biopsy in 3000 Patients Undergoing 12 vs 18 vs More Than 24 Needle Cores. Urology. (2013) 81:1142–6. doi: 10.1016/j.urology.2013.02.019
35. Ren C, Ma Y, Jin J, Ding J, Jiang Y, Wu Y, et al. Development and external validation of a dynamic nomogram to predict the survival for adenosquamous carcinoma of the pancreas. Front Oncol. (2022) 12:927107. doi: 10.3389/fonc.2022.927107
36. Zeng W, Huang L, Lin H, Pan R, Liu H, Wen J, et al. Development and validation of a nomogram for predicting postoperative distant metastasis in patients with cervical cancer. Med Sci Monit. (2022) 28:e933379. doi: 10.12659/MSM.933379
37. Lu B, Pan X, Wang B, Jin C, Liu C, Wang M, et al. Development of a nomogram for predicting mortality risk in sepsis patients during hospitalization: A retrospective study. IDR. (2023) 16:2311–20. doi: 10.2147/IDR.S407202
38. Yang S, Song R, Zhang J, Li X, and Li C. Predictive tool for intravenous immunoglobulin resistance of Kawasaki disease in Beijing. Arch Dis Child. (2019) 104:262–7. doi: 10.1136/archdischild-2017-314512
39. Merrick GS, Taubenslag W, Andreini H, Brammer S, Butler WM, Adamovich E, et al. The morbidity of transperineal template-guided prostate mapping biopsy. BJU Int. (2008) 101:1524–9. doi: 10.1111/j.1464-410X.2008.07542.x
40. Zisman A, Leibovici D, Kleinmann J, Cooper A, Siegel Y, and Lindner A. The impact of prostate biopsy on patient well-being: a prospective study of voiding impairment. J Urol. (2001) 166:2242–6. doi: 10.1016/S0022-5347(05)65543-7
41. Sahin C, Sinanoglu O, Karaca Y, Yuksel A, Kucuk EV, Sarica K, et al. Effect of constipation on acute urinary retention following transrectal prostate biopsy. Investig Clin Urol. (2023) 64:272. doi: 10.4111/icu.20230011
42. Hernandez DH, Tesouro RB, and Castro-Diaz D. Urinary retention. Urologia. (2013) 80:257–64. doi: 10.5301/RU.2013.11688
43. Öztürk E, Özden E, Işikdoğan M, Hamidi N, and Savran B. Patient tolerance and complication rates of transperineal prostate biopsy with coaxial technique under local anesthesia: initial experience of a single institution. Eur Rev Med Pharmacol Sci. (2024) 28:3439–46. doi: 10.26355/eurrev_202405_36189
44. Osama S, Serboiu C, Taciuc I-A, Angelescu E, Petcu C, Priporeanu TA, et al. Current approach to complications and difficulties during transrectal ultrasound-guided prostate biopsies. JCM. (2024) 13:487. doi: 10.3390/jcm13020487
45. Cavkaytar S, Kokanali MK, Baylas A, Topcu HO, Laleli B, and Tasci Y. Postpartum urinary retention after vaginal delivery: Assessment of risk factors in a case-control study. J Turkish German Gynecol Assoc. (2014) 15:140–3. doi: 10.5152/jtgga.2014.13102
Keywords: acute urinary retention, prostate biopsy, machine learning, predictive model, Boruta feature selection
Citation: Shen C, Chen G, Chen Z, You J and Zheng B (2025) The risk prediction model for acute urine retention after perineal prostate biopsy based on the LASSO approach and Boruta feature selection. Front. Oncol. 15:1626529. doi: 10.3389/fonc.2025.1626529
Received: 13 May 2025; Accepted: 29 August 2025;
Published: 11 September 2025.
Edited by:
Wenlin Yang, University of Florida, United StatesReviewed by:
Shuai Chen, Affiliated Hospital of Jining Medical University, ChinaManikandan Ganesan, SASTRA University, India
Copyright © 2025 Shen, Chen, Chen, You and Zheng. This is an open-access article distributed under the terms of the Creative Commons Attribution License (CC BY). The use, distribution or reproduction in other forums is permitted, provided the original author(s) and the copyright owner(s) are credited and that the original publication in this journal is cited, in accordance with accepted academic practice. No use, distribution or reproduction is permitted which does not comply with these terms.
*Correspondence: Junjie You, OTcyNDgyNTcwQHFxLmNvbQ==; Bing Zheng, bnR6YjIwMDhAMTYzLmNvbQ==
†These authors have contributed equally to this work