 Yuyang Ma1†
 Xiaoyin Pan1†Jiameng Cui1Wanzhu Lu1Gege Sun1Junlong Pan1Xiao Dong1
 Kejia Hu1
 Wenyuan Li1
 Huakang Tu1*
 Xifeng Wu1,2,3,4*
- 1Department of Big Data in Health Science School of Public Health, Center of Clinical Big Data and Analytics of The Second Affiliated Hospital, Zhejiang University School of Medicine, Hangzhou, China
- 2National Institute for Data Science in Health and Medicine, Zhejiang University, Hangzhou, Zhejiang, China
- 3School of Medicine and Health Science, George Washington University, Washington, DC, United States
- 4Zhejiang Key Laboratory of Intelligent Preventive Medicine, Hangzhou, Zhejiang, China
Background: The role of postoperative carcinoembryonic antigen (CEA) levels in non-small lung cancer (NSCLC) prognostic evaluation remains unclear. Additionally, the dynamic changes in CEA levels during the perioperative period have not been fully characterized.
Methods: We retrospectively reviewed stage I-IIIA NSCLC patients who underwent curative resection. A latent class growth mixed model was employed to categorize patients into distinct CEA trajectory groups. The Kaplan-Meier method assessed the relationship between CEA trajectory groups and recurrence-free survival (RFS) and overall survival (OS). Multivariate analysis of perioperative CEA levels in relation to RFS and overall survival OS was performed using Cox proportional hazards regression.
Results: A total of 5733 patients were included in our study. Elevated postoperative CEA levels were associated with higher risks of recurrence (HR = 2.64, 95% CI: 1.65-4.23) and mortality (HR = 3.34, 95% CI: 2.09-5.80) compared to normal CEA levels. Furthermore, patients with normal preoperative CEA but elevated postoperative levels also had higher risks of recurrence (HR = 3.00, 95% CI: 1.77–5.10) and mortality (HR = 3.30, 95% CI: 1.79–6.07). Three CEA trajectory categories were identified: low-stable, early-rising, and later-rising. Compared to the low-stable group, the early-rising group had significantly higher risks of recurrence (HR = 10.84, 95% CI: 5.57-21.10) and mortality (HR = 13.37, 95% CI: 5.45-32.81). The later-rising group had lower, but still significant, risks of recurrence (HR = 3.56, 95% CI: 1.62-7.81).
Conclusion: Continuous postoperative monitoring of CEA levels in NSCLC patients is essential, especially for those with elevated postoperative CEA levels.
Introduction
On a global scale, lung cancer continues to rank first in both new cancer cases and cancer - related fatalities (1). Among them, NSCLC accounts for around 80% to 85% of all lung cancer instances (2, 3). For patients diagnosed with localized non-small cell lung cancer (stage I-IIIA), the primary therapeutic approach is radical resectional operation. Unfortunately, recurrence-free survival (RFS) decreased from 68% at 1 year to 34% at 5 years for stage III, significantly reducing long-term survival rates (4). Therefore, early identification of patients with poor prognosis has become a key focus in the postoperative management of NSCLC.
CEA, a glycoprotein that contributes to the process of cell adhesion, is widely recognized as a crucial indicator for NSCLC (5, 6). Numerous meta-analyses have established a clear link between high preoperative CEA levels and reduced survival in NSCLC patients (7–9). However, whether the levels of carcinoembryonic antigen (CEA) measured after the operation can accurately predict prognosis remains a matter of debate. While some studies have pinpointed that increased CEA values post-surgery act as a factor indicating a negative outcome for those suffering from NSCLC others have not detected a substantial relationship (10–16). The majority of those research works focused on patients at the initial disease stage and employed different threshold values for elevated CEA. Additionally, the dynamic changes in serum CEA levels following surgery have often been overlooked, and the perioperative CEA trajectory has not been well defined. Consequently, the relationship between these trajectories and NSCLC outcomes is still unclear.
The objective of this study was to assess the role of postoperative serum CEA as a prognostic indicator in NSCLC and to determine whether changes in perioperative CEA levels provide additional insight into patient outcomes. These dynamic changes include variations from preoperative to postoperative CEA levels and the trajectories of CEA changes from preoperative to 36 months post-surgery. Additionally, we examined how pre- and postoperative CEA concentrations, treated as continuous variables, were associated with clinical outcomes in NSCLC patients.
Methods
Study framework and data acquisition
The study, designed as a retrospective cohort analysis, received ethical approval from the Institutional Review Board of the Second Affiliated Hospital of Zhejiang University School of Medicine (2020LSYD829). Patients with stage I to IIIA NSCLC who received curative surgery at the Second Affiliated Hospital between June 2015 and September 2023 were consecutively recruited. The following were the criteria for participants to be included in this research: 1) Histologically confirmed diagnosis of primary NSCLC. 2) No history of other cancers. 3) No local surgical treatments other than radical resection. 4) Negative surgical margins with no residual lesions. 5) No neoadjuvant therapy.
Serum CEA concentrations were measured via chemiluminescent immunoassay using the COBAS 8000 e602 analyzer (Roche Diagnostics, Tokyo, Japan), in accordance with the World Health Organization (WHO) international standard 73/601 (17). The pre-surgical CEA level was defined as the concentration measured within 30 days prior to resection. Patients with preoperative measurements were included in preoperative -related studies (Supplementary Figure S1a). The postoperative CEA level referred to the measurement closest to the surgical date, taken within seven months after resection. Patients with postoperative measurements were included in postoperative-related studies (Supplementary Figure S1b). For trajectory analysis, patients who had CEA measurements taken before the operation and whose CEA levels were measured at least three times during the 36-month period following the surgery were enrolled. All included CEA measurements after surgery were taken before any clinical outcomes occurred.
The study’s follow-up was completed on November 2, 2023. Recurrence-free survival served as the primary outcome, capturing both local and metastatic disease events. The secondary endpoint focused on overall survival (OS). Recurrence-free duration was calculated from the date of surgery to the time of relapse detection. which was established through histological examination of biopsy specimens or positive findings on imaging studies. Survival information was obtained through telephone follow-ups.
Covariates included age, sex, smoking status (yes or no), surgical methods (wedge resection, segmentectomy, or lobectomy), pathological stage (I-IIIA), histological subtype (adenocarcinoma or squamous cell carcinoma), and tumor differentiation grade (highly - matured, intermediately - matured, or poorly - matured). Preoperative CEA levels were also accounted for in the analysis of the relationships between trajectories and NSCLC outcomes. Data were retrieved from internal departmental records and digital medical archives. The pathological staging was assigned based on the 8th edition of the American Joint Committee on Cancer (AJCC) classification criteria for lung malignancies.
Statistical analysis
The study workflow is depicted in the diagram shown in Figure 1. All the statistical analyses were conducted in R (v4.4.2), with missing values addressed through multiple imputation using the “mice” package (v2.1.0). We looked into the differences between groups. For continuous variables (stated as median [interquartile range]), the Kruskal - Wallis test was replaced with a non - parametric bootstrap - based test to assess group differences. Categorical data (presented as n [%]) were compared using the G-test, which serves as a likelihood-ratio alternative to the classical chi-square test.
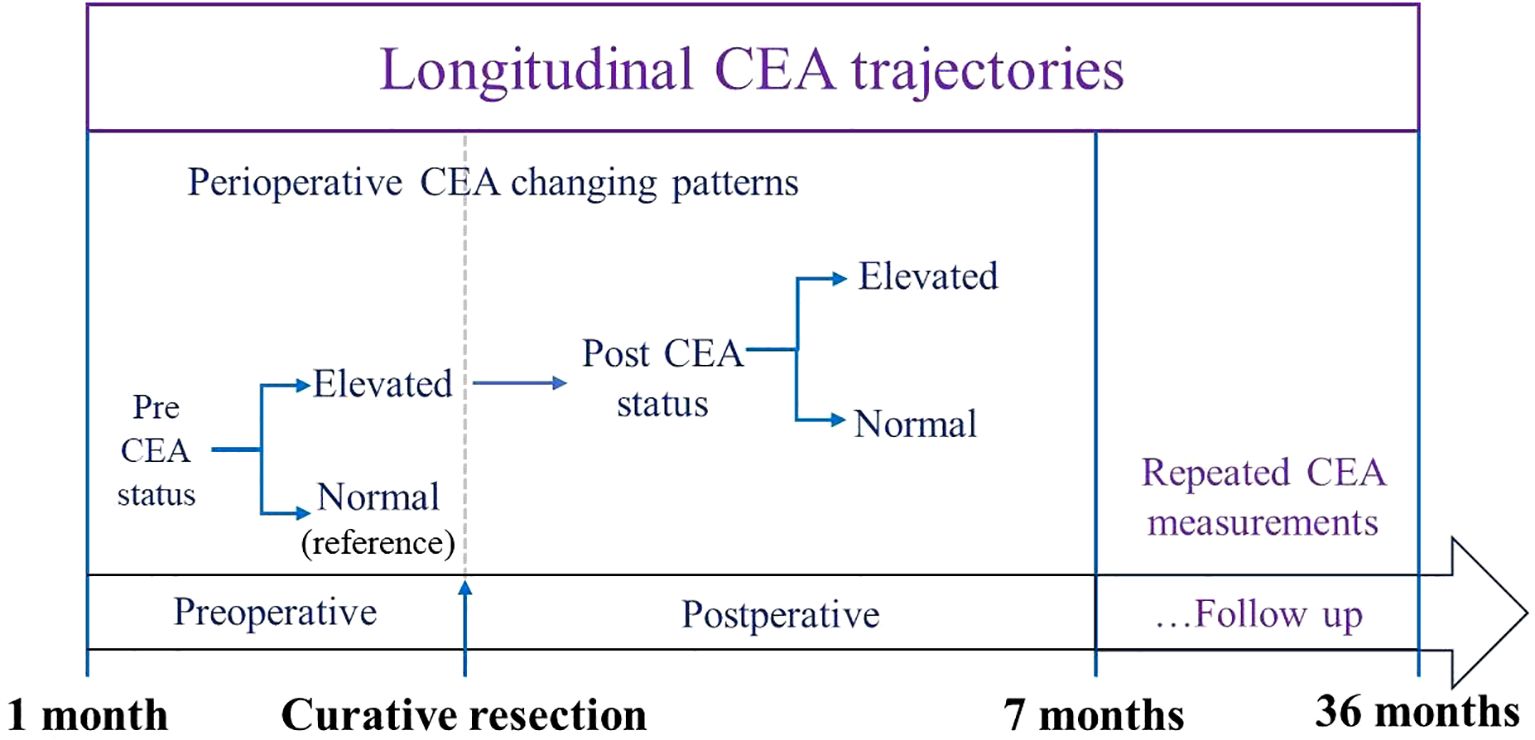
Figure 1. Workflow of CEA trajectory analysis: from preoperative baseline to 36-month postoperative follow-up.
CEA was classified as elevated when exceeding 5 ng/mL, and normal when at or below this threshold, according to standard reference values. Combining preoperative and postoperative levels further categorized into normal preoperative, normalization, and persistently elevated groups. Given the substantial variability within CEA measurements, values were capped at tenfold the upper reference limit to improve trajectory fitting. The logarithms of these truncated values were subsequently employed to model trajectories, due to the fact that they exhibited a non-normal distribution.
The application of a latent class growth mixed model (LCGMM) enabled the identification of distinct trajectory patterns of perioperative CEA levels. This method segments the population into latent classes based on estimated heterogeneity and constructs individual trajectories using a linear mixed model framework (18, 19). We modeled the long - term variations in the measured values as either linear or non - linear relationships with respect to the passage of time. These relationships included time, its second - order or third - order terms. We explored 2 to 5 potential trajectory groups. The number of optimal clusters and the most suitable curve form were selected based on the Bayesian Information Criterion (BIC), with the constraint that each class represented ≥ep of the cohort and exhibited an average posterior probability above 0.7. The “he.eb package (version 1.9.2) was used to perform the latent class growth mixture modeling. Kaplan-Meier curves were generated for overall survival (OS) and recurrence-free survival (RFS), with intergroup differences evaluated using the log-rank test. Associations between trajectory classes and outcomes were further analyzed using Cox regression models. The proportional hazards assumption was assessed using log-log plot. We made use of three models: the first was unadjusted; the second controlled for age, sex, and smoking status; and the third further accounted for surgical type, pathological stage, histological subtype, and tumor differentiation. In analyses involving CEA trajectory groups, preoperative CEA levels were also taken into account. We also constructed three more statistical models incorporating preoperative CEA, postoperative CEA, and both, respectively. Model comparisons were conducted via likelihood ratio tests (LRT). To flexibly characterize nonlinear effects, Restricted cubic splines (RCS) modeling was applied to assess how continuous pre- and postoperative CEA levels relate to recurrence risk in NSCLC. In survival analysis, RCS can model nonlinear relationships in Cox proportional hazards regression models (20, 21). Three knots were selected when modeling. The model took into account factors such as patient’s age, gender, smoking status, types of surgical procedures, disease stage based on pathology reports, pathological characteristics, and the extent of cellular differentiation.
Results
Study participants
The study included 5733 individuals diagnosed with NSCLC. To elaborate, 5309 were incorporated into the preoperative analysis, 2027 into the postoperative investigation, 1860 into the study examining dynamic changes in the perioperative, periods and 988 into the CEA trajectory analysis. A summary of participant evaluation and exclusion rationale can be found in Figure 2.
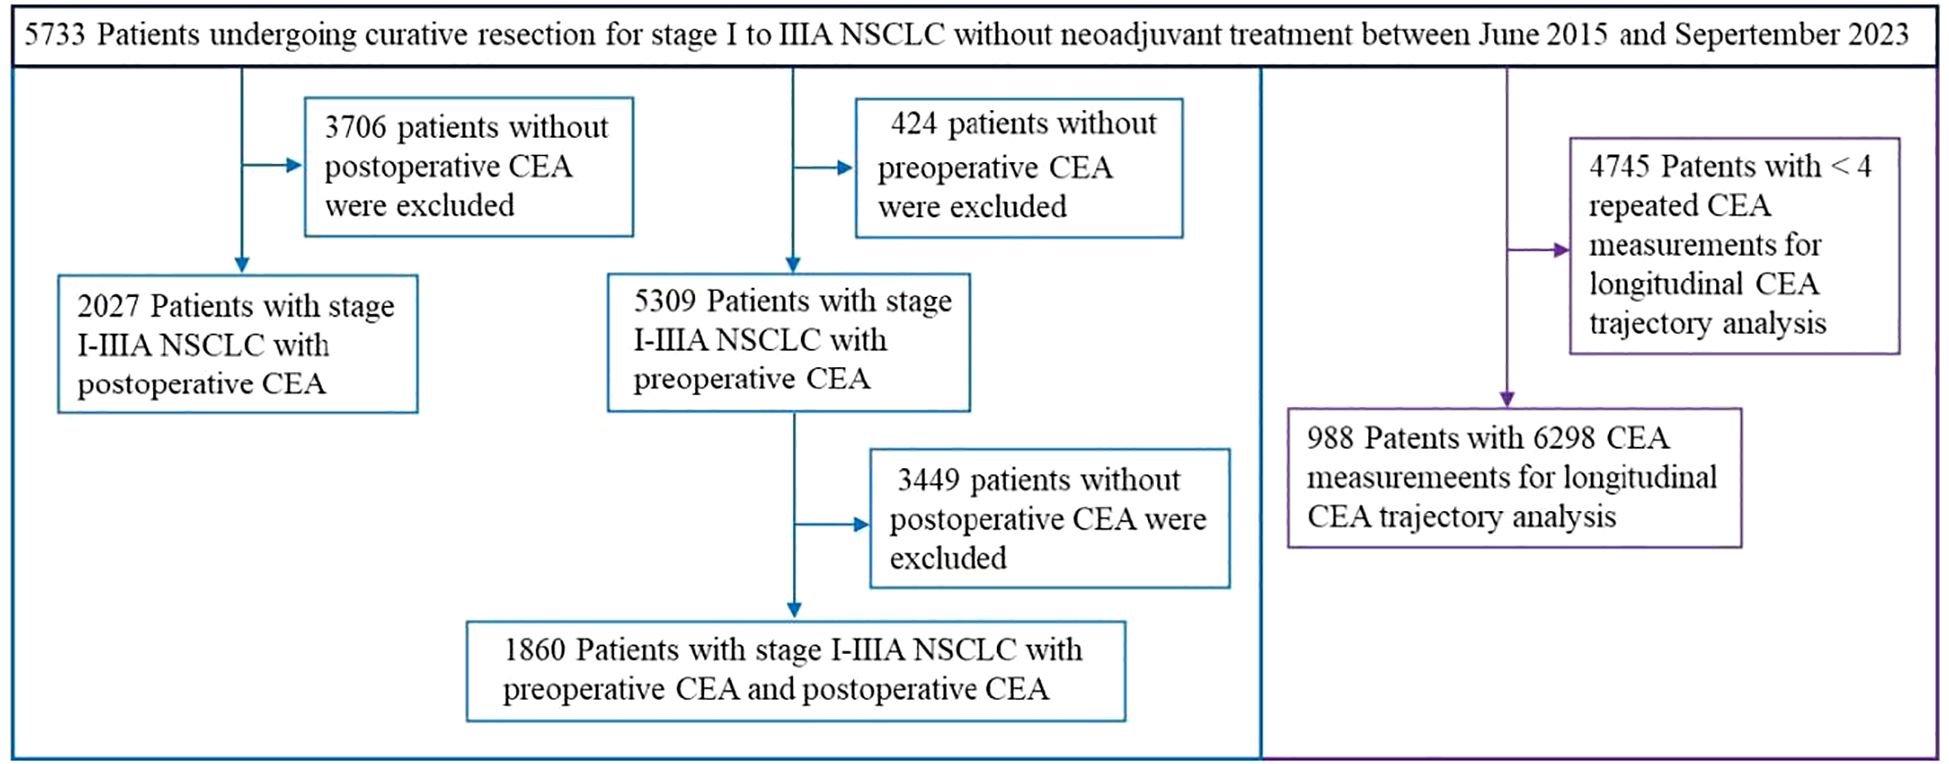
Figure 2. Flowchart of patient selection for longitudinal CEA monitoring in curatively resected NSCLC.
Trajectory analysis of CEA
The study included 988 patients (435 [44.03%] male; median age [interquartile range, IQR]: 60 years [52-67]). The median follow - up duration was 29.54 months (IQR: 18.33-38.21). Recurrence occurred in 98 patients (9.92%) during follow-up, yielding an incidence of 5.44 per 1,000 person-years. Meanwhile, 48 patients (4.86%) died, with a corresponding rate of 2.50 per 1,000 person-years. A total of 6298 individual CEA measurements were assessed, averaging a median of 6 measurements per patient (range: 4-36) (Supplementary Figure S2). The LCGMM model fitting results are presented in Supplementary Table S1. In line with the predefined guidelines, non - linear curves representing three possible clusters were considered the best fit for CEA modeling. Figure 3A depicts the perioperative trajectory of CEA concentration. Three separate trajectory groups were pinpointed for perioperative CEA: low-stable (n = 926, 93.72%), early-rising (n = 34, 3.44%), and later-rising (n = 38, 3.85%). Among the members of the low-stable group, CEA levels consistently remained below 5.0 ng/mL from the preoperative period through 36 months after surgery. In the early -rising group, CEA decreased to its lowest value at 5 months post-surgery, followed by a rapid increase. In the later - rising group, CEA dropped to the standard reference interval within 6 months post - surgery and gradually ascended after 10 months.
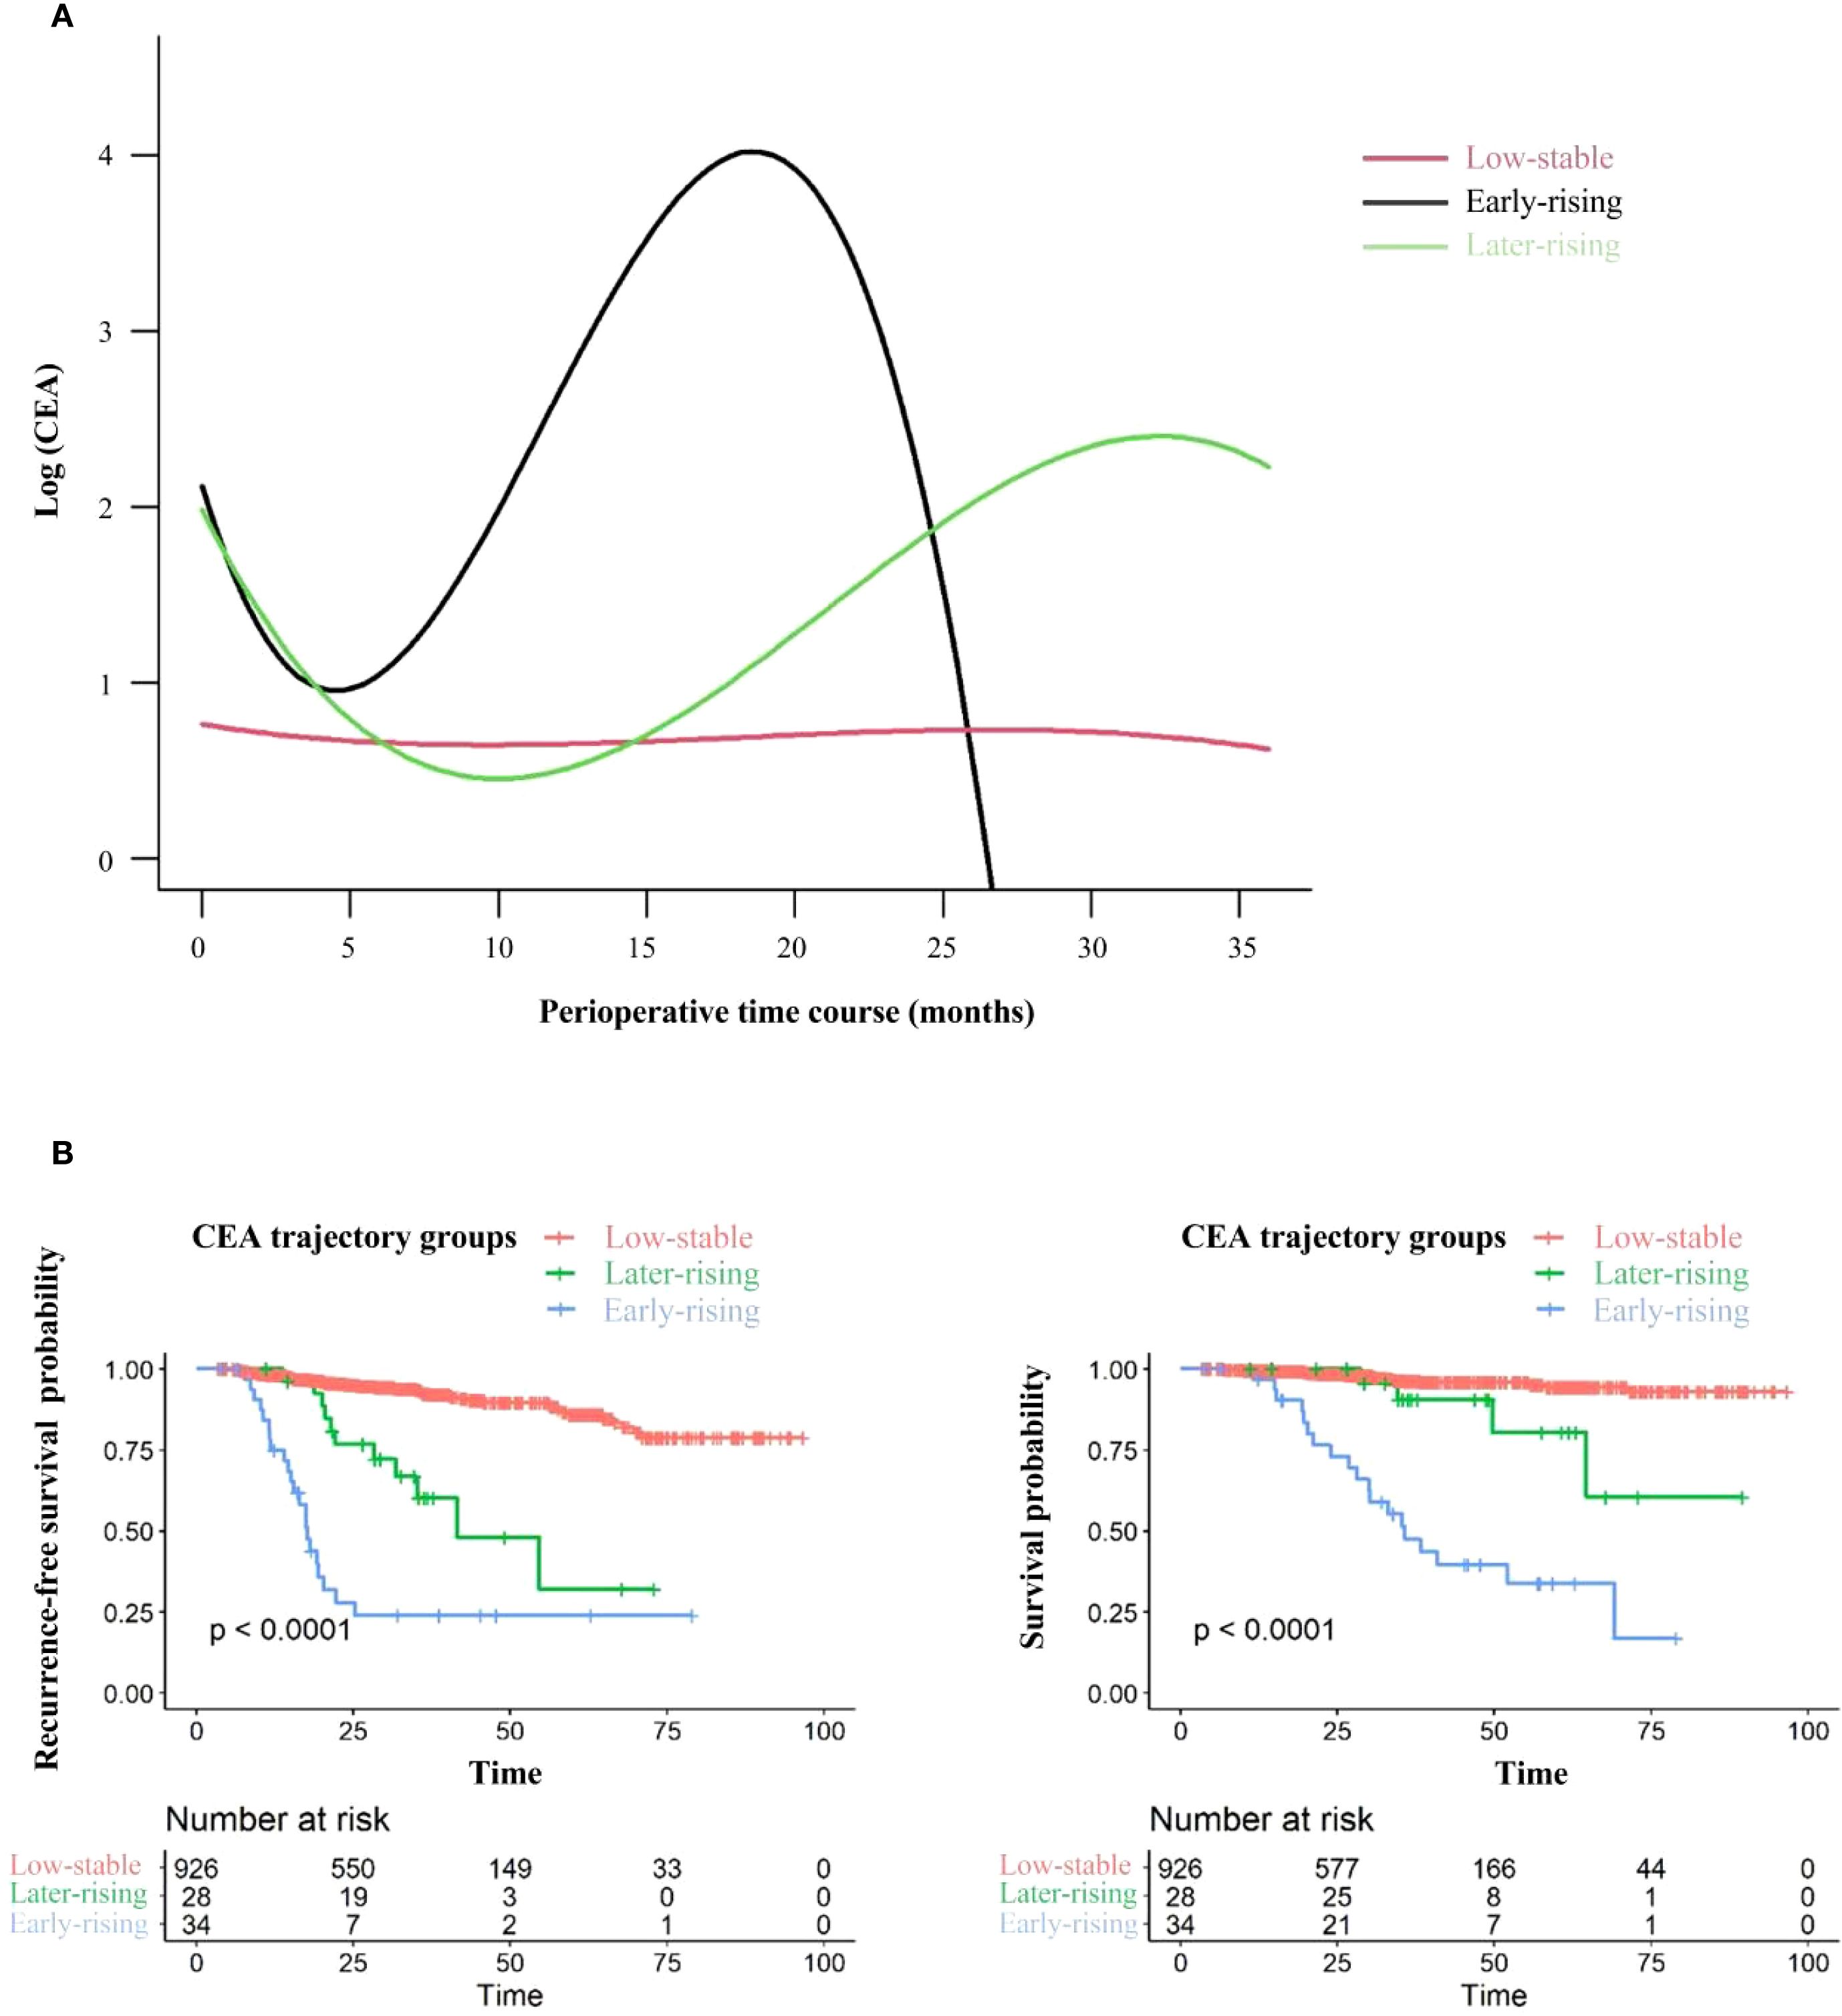
Figure 3. CEA trajectories and related recurrence-free survival (RFS) and overall survival outcomes. (A) CEA trajectories from the preoperative period to 36 months post-surgery. (B) Recurrence-free survival (left) and overall survival (right) stratified by CEA trajectory groups: comparisons between the Low-stable CEA group, Early-rising CEA group, and Later-rising CEA group.
Relative to the group with consistently low CEA levels, the groups demonstrating an early increase and a late increase in CEA levels were characterized by lower tumor stages and differentiation levels. Additionally, fewer patients in these rising groups underwent wedge resection or segmentectomy. Both rising groups also demonstrated elevated risks of recurrence and mortality (Table 1). The 5-year RFS rates were 23.85% (95% CI: 12.10%–47.02%) for the early-rising group, 32.00% (95% CI: 12.00%–85.30%) for the later-rising group, and significantly higher at 86.15% (95% CI: 81.99%–90.52%) in the low-stable group (P < 0.001; Figure 3B, left). A similar trend was observed for overall survival: the 5-year OS rate reached 94.55% (95% CI: 92.00%–97.18%) in the low-stable group, compared to 33.93% (95% CI: 19.47%–59.13%) in the early-rising group and 80.50% (95% CI: 61.60%–100.00%) in the later-rising group (P < 0.001; Figure 3B, right). Sub-analysis stratified by histology shows that in adenocarcinoma patients, the patterns in 5-year RFS and OS across the three CEA trajectory groups are highly consistent with those observed in the overall population (Supplementary Figures S5a, b).
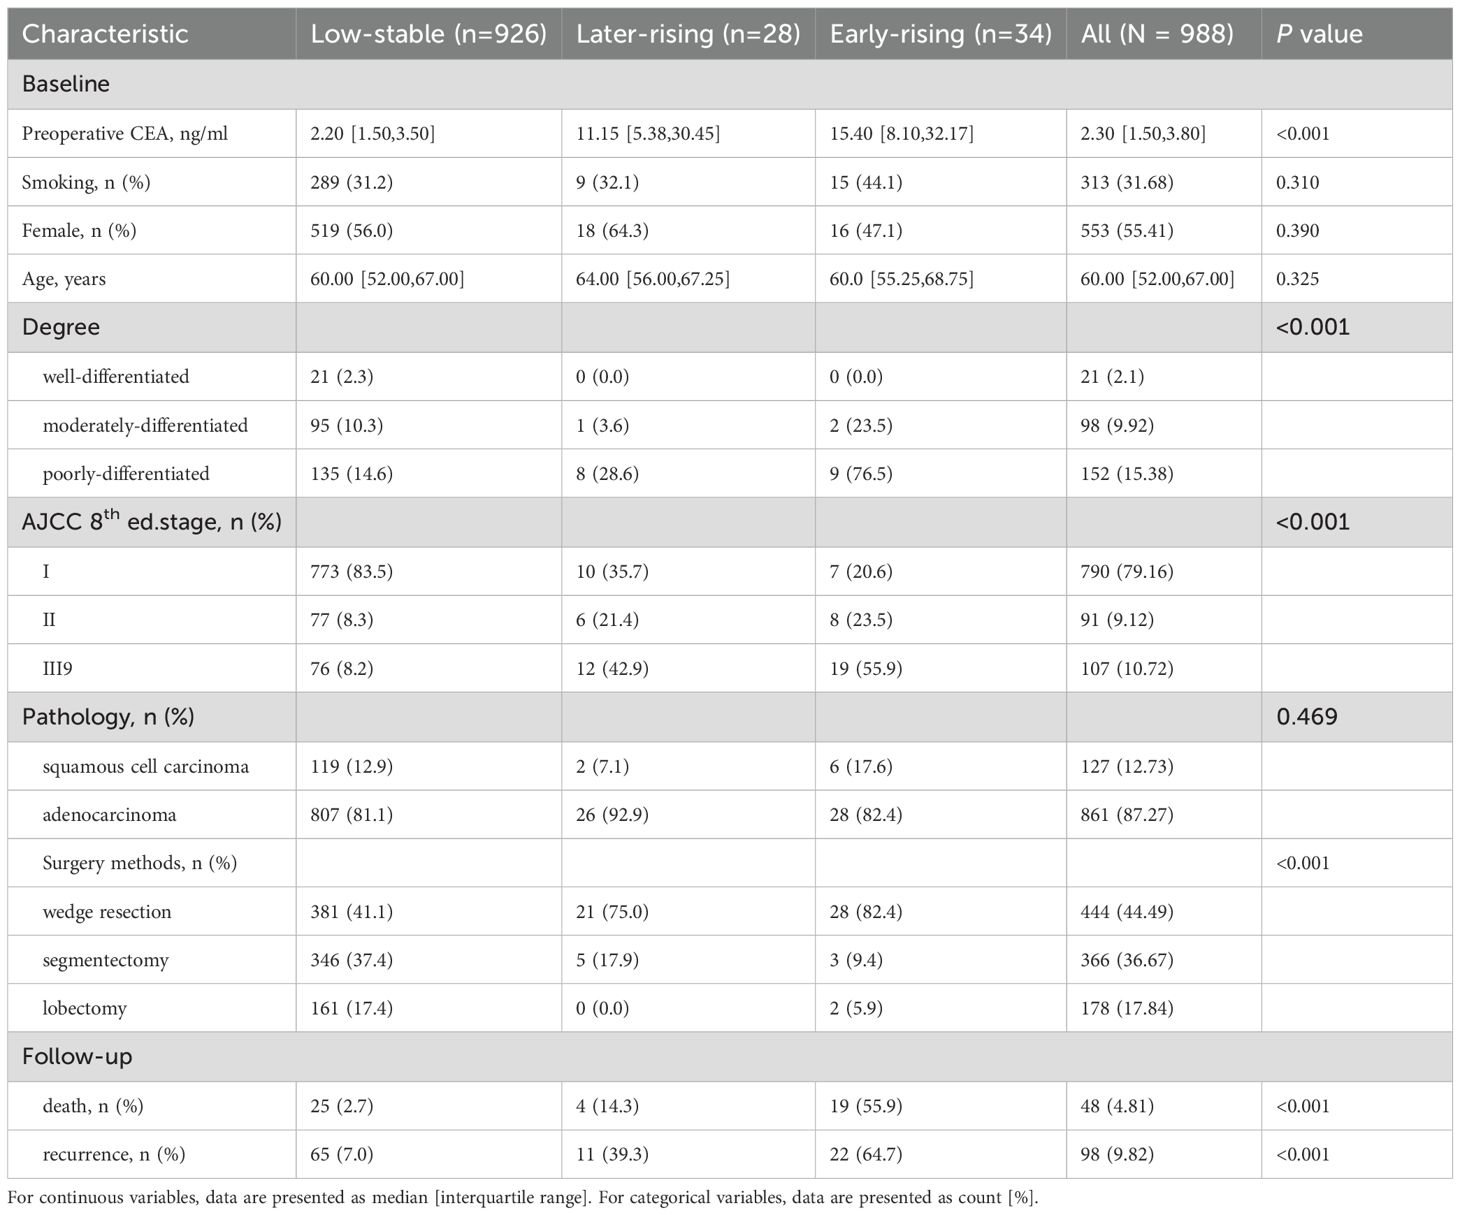
Table 1. Characteristics by serum CEA trajectory groups at baseline and follow-up.
Tables 2, 3 summarize the relationships between perioperative CEA trajectories and both RFS and OS. Relative to the low-stable group, the risk of recurrence was significantly higher in the early- and late-rising groups, with hazard ratios (HRs) of 10.84 (95% CI: 5.57–21.10, P < 0.001) and 3.56 (95% CI: 1.62–7.81, P = 0.002), respectively. After adjustment for demographic characteristics and preoperative CEA, the associations were slightly attenuated but remained significant. The early-rising group showed a markedly higher risk of death (HR = 13.37, 95% CI: 5.45–32.81, P < 0.001) relative to the low-stable group, whereas the mortality risk for the later-rising group was not statistically significant (HR = 2.00, 95% CI: 0.58–6.93, P = 0.276) following full adjustment.
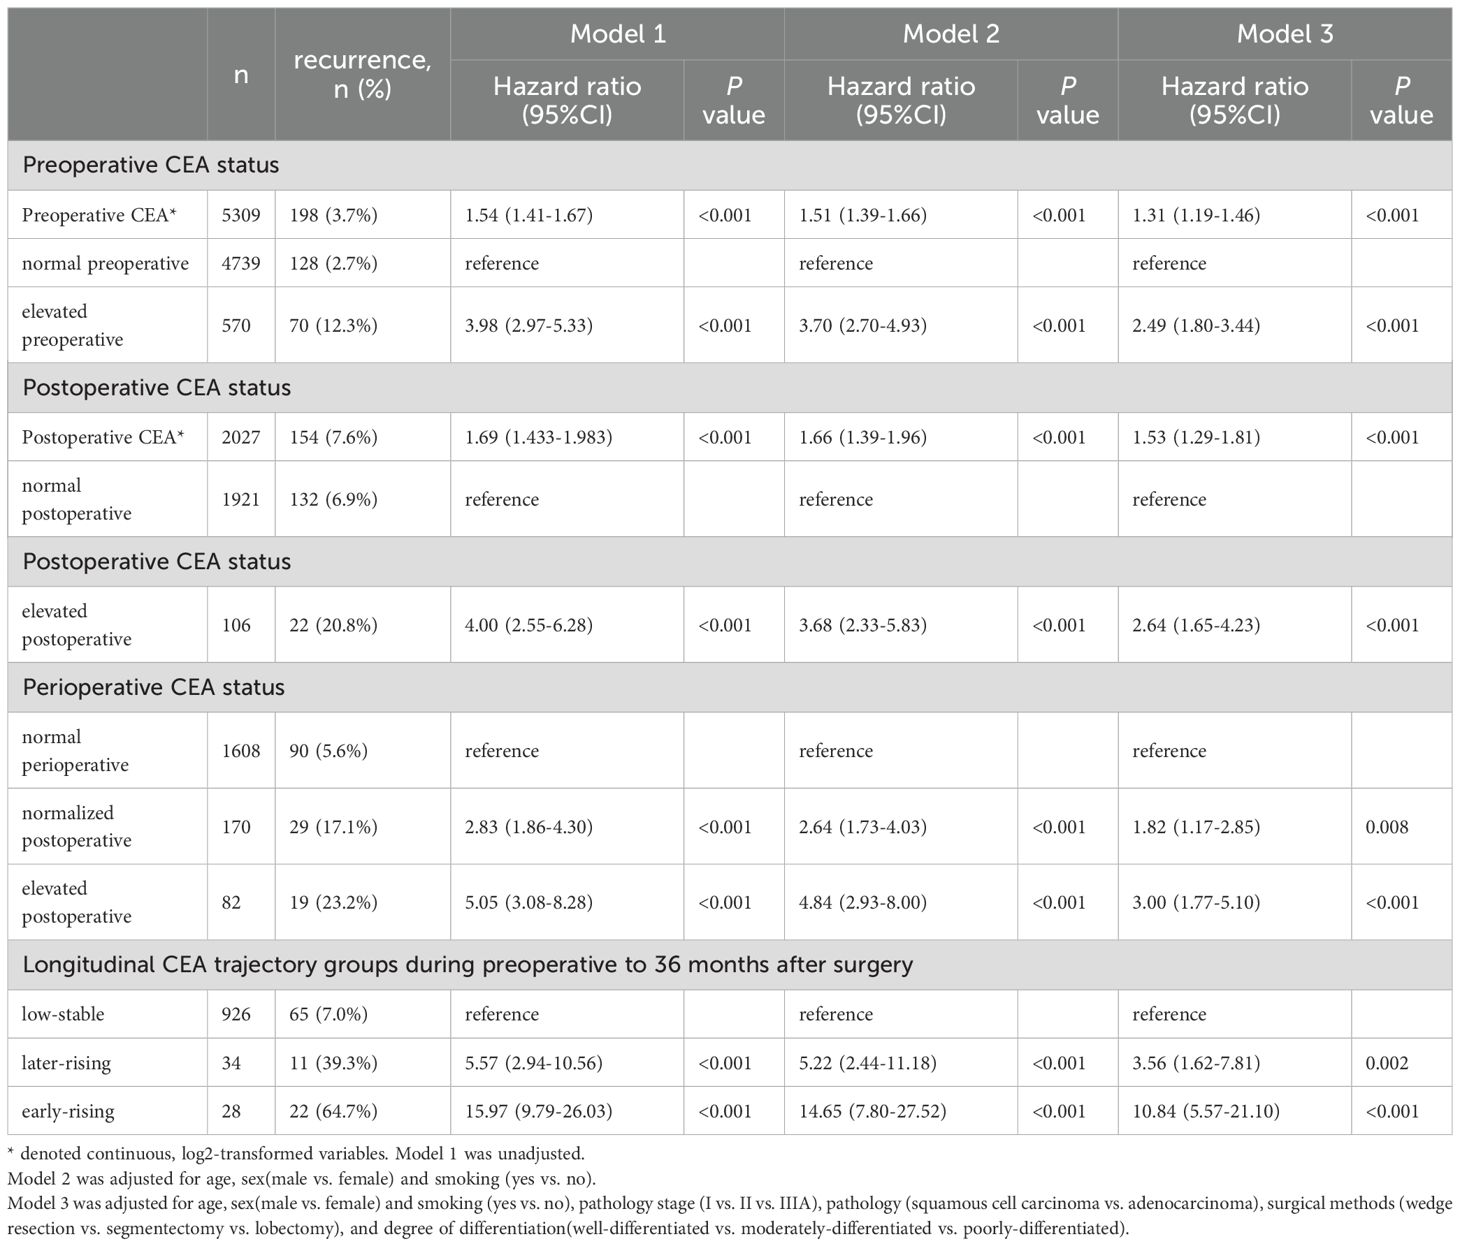
Table 2. Exploration of the relationship between perioperative and longitudinal CEA groups and recurrence based on Cox proportional hazards regression.
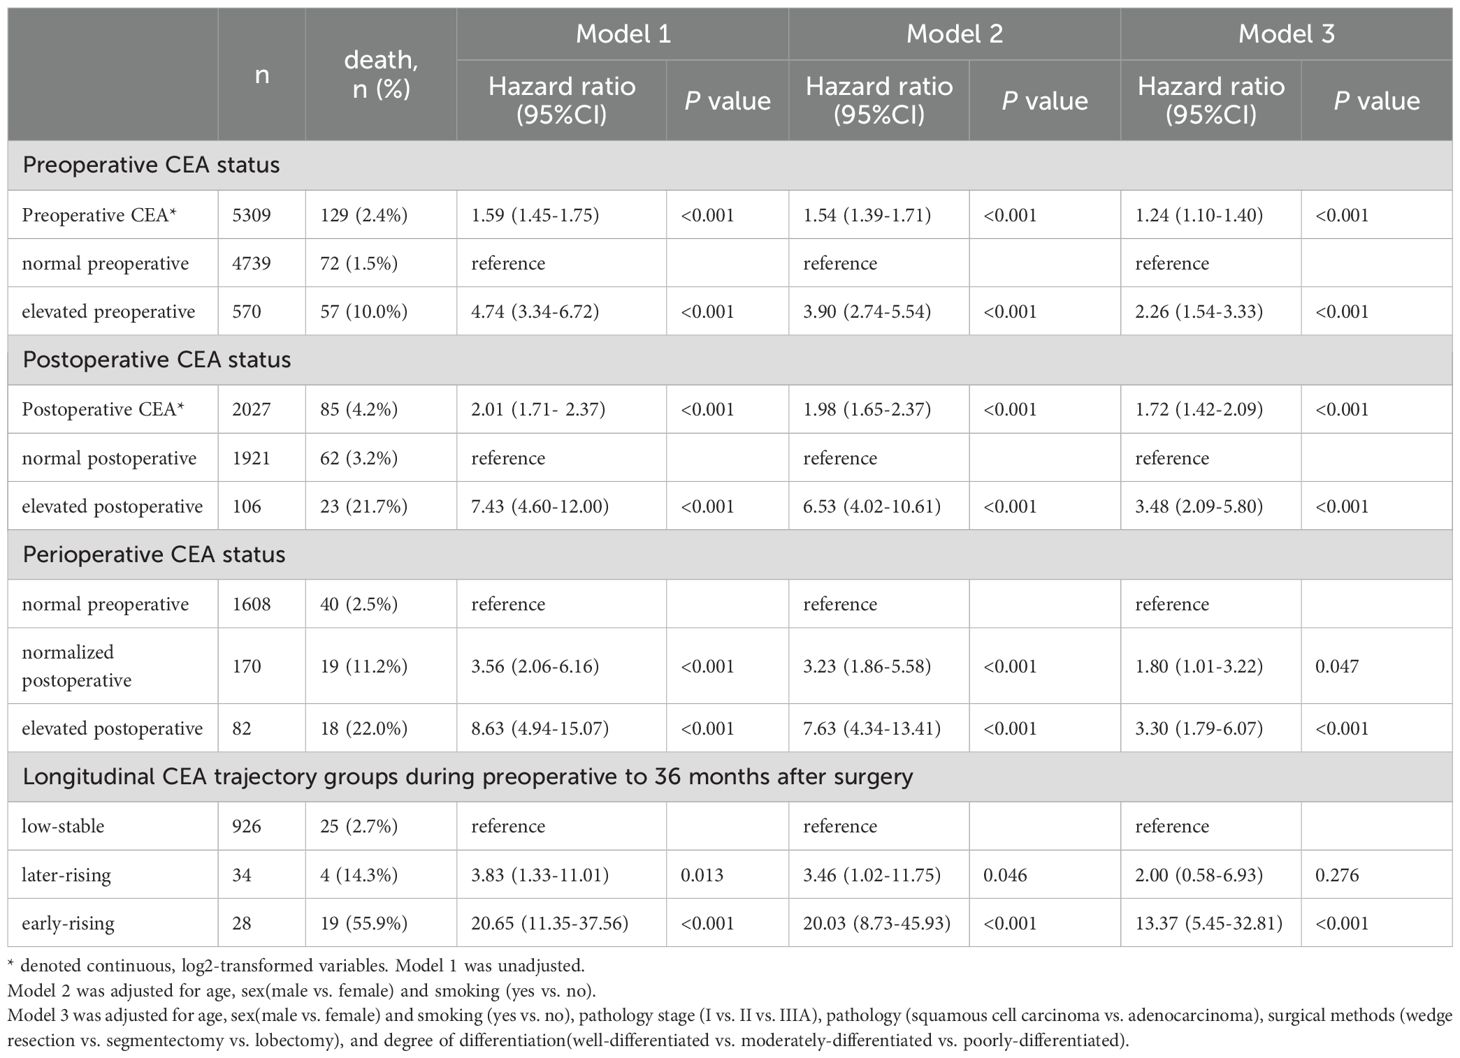
Table 3. Cox proportional hazards regression analysis assessing the effects of perioperative and longitudinal CEA groups on survival outcomes.
Preoperative and postoperative analysis of CEA
Figure 4 displays Kaplan-Meier survival curves stratified by preoperative, postoperative, and perioperative CEA profiles. The 5Cox model revealed that varying CEA levels were significantly associated with NSCLC prognosis, as shown in Tables 2, 3. Higher preoperative log2-transformed CEA was associated with increased risk of recurrence (HR = 1.31, 95% CI: 1.19-1.46) and mortality (HR = 1.24, 95% CI: 1.10-1.40). Individuals with elevated preoperative CEA levels demonstrated significantly higher risks of recurrence (HR = 2.49, 95% CI:1.80-3.44) and mortality (HR = 2.26, (95% CI: 1.54-3.33) compared to those with normal preoperative CEA levels. Likewise, higher postoperative log2-transformed CEA was associated with increased risk of recurrence (HR = 1.53, 95% CI: 1.29-1.81) and mortality (HR = 1.72, 95% CI: 1.42-2.09). Individuals with elevated postoperative CEA levels demonstrated significantly higher risks of recurrence (HR = 2.64, 95% CI: 1.65-4.23) and mortality (HR = 3.34, 95% CI: 2.09-5.80) compared to those with normal postoperative CEA levels. After adjusting for preoperative CEA, postoperative CEA remained an independent predictor of mortality (HR = 2.13, 95% CI: 1.42–2.09), as shown in Supplementary Table S2.
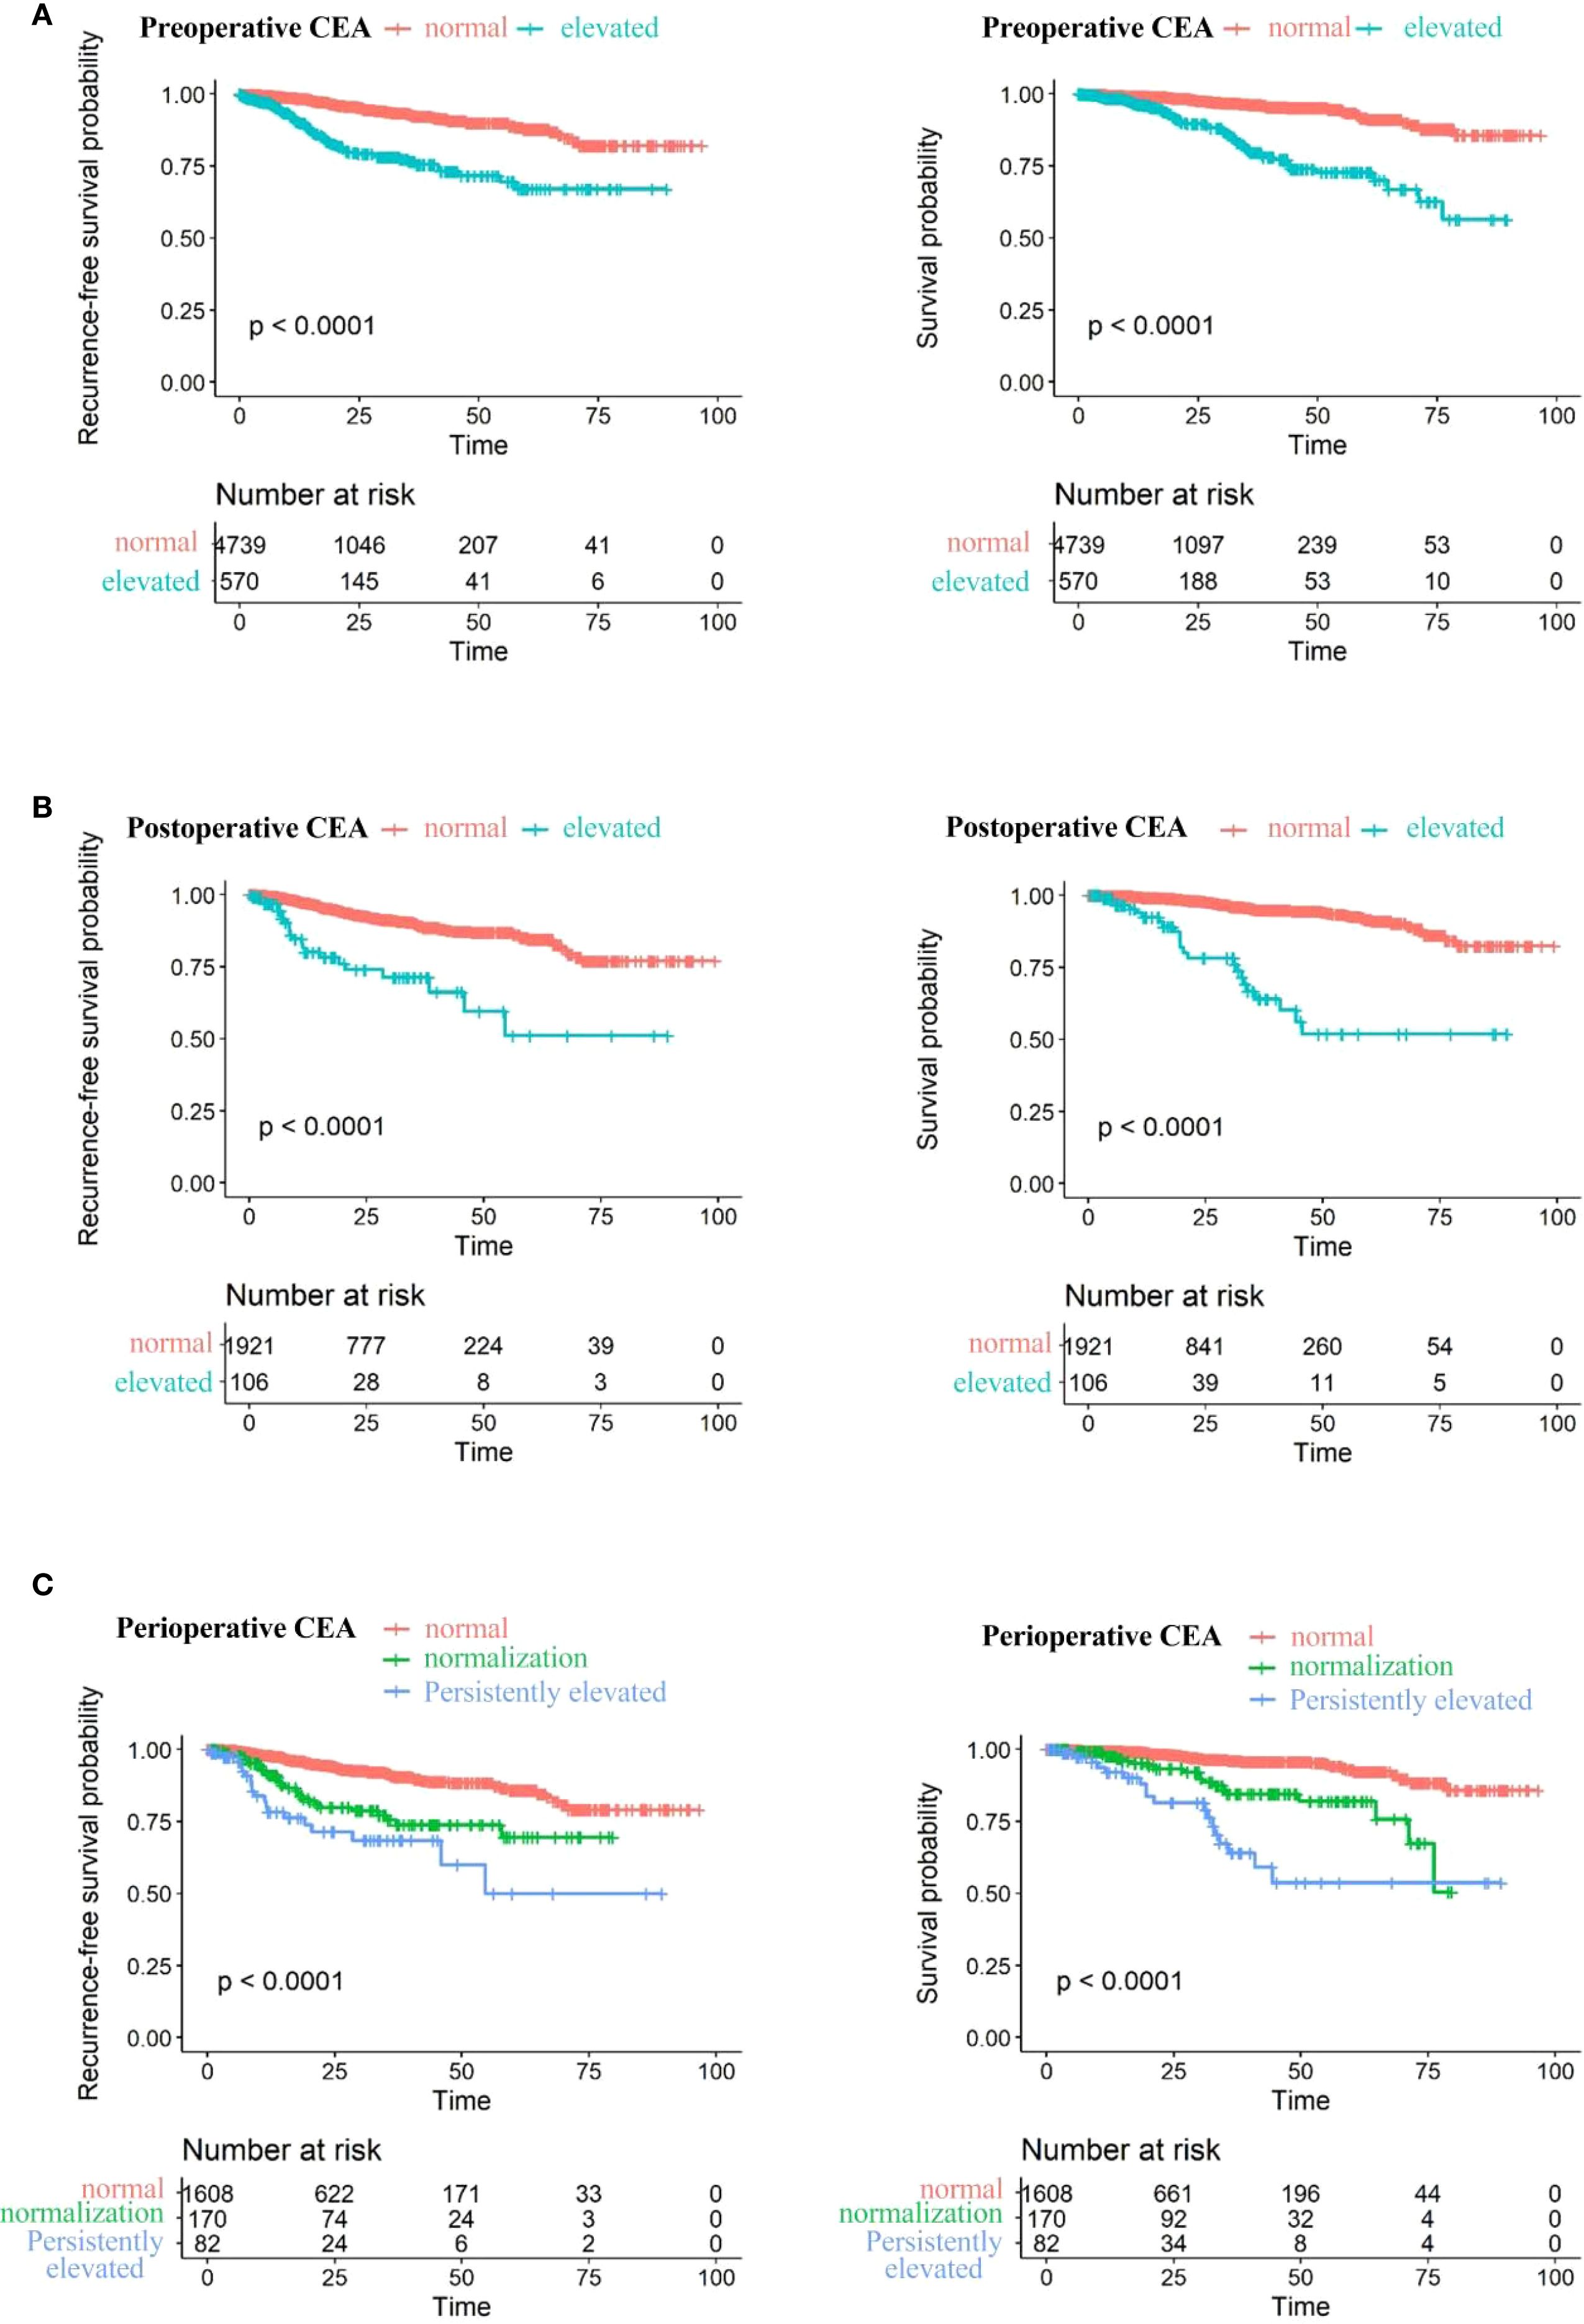
Figure 4. Recurrence-free survival (left) and overall survival (right) stratified by: (A) Preoperative CEA levels: normal (≤5 ng/ml) vs. elevated (>5 ng/ml). (B) stoperative CEA levels: normal (≤5 ng/ml) vs. elevated (>5 ng/ml). (C) Perioperative CEA levels: normal preoperative, elevated preoperative with postoperative normalization, and persistently elevated postoperatively.
Individuals with consistently elevated CEA levels both preoperatively and postoperatively exhibited markedly higher risks of recurrence and mortality, with HRs of 3.00 (95% CI: 1.77-5.10) for recurrence and 3.30 (95% CI: 1.79-6.07) for death. Patients whose CEA levels normalized after surgery still faced elevated risks of recurrence and death—HRs of 1.82 (95% CI: 1.17–2.85) and 1.80 (95% CI: 1.01–3.22), respectively—although these risks remained lower than in those with sustained CEA elevation.
Restricted cubic splines analysis
Through multivariable-adjusted polynomial regression analysis (Figure 5), a positive nonlinear relationship was found between NSCLC recurrence risk and preoperative CEA levels (P for non-linearity=0.007). As preoperative CEA levels increased, so did the recurrence risk. The points where the hazard ratio for preoperative CEA levels equals 1.0 is approximately at 2.1 ng/mL. Below this threshold, the recurrence risk for NSCLC is less than 1.0, whereas above it, the recurrence risk exceeds 1.0. However, no non-linear association was detected between the levels of postoperitive CEA and the occurrence of recurrence (P for non-linearity =0.381).
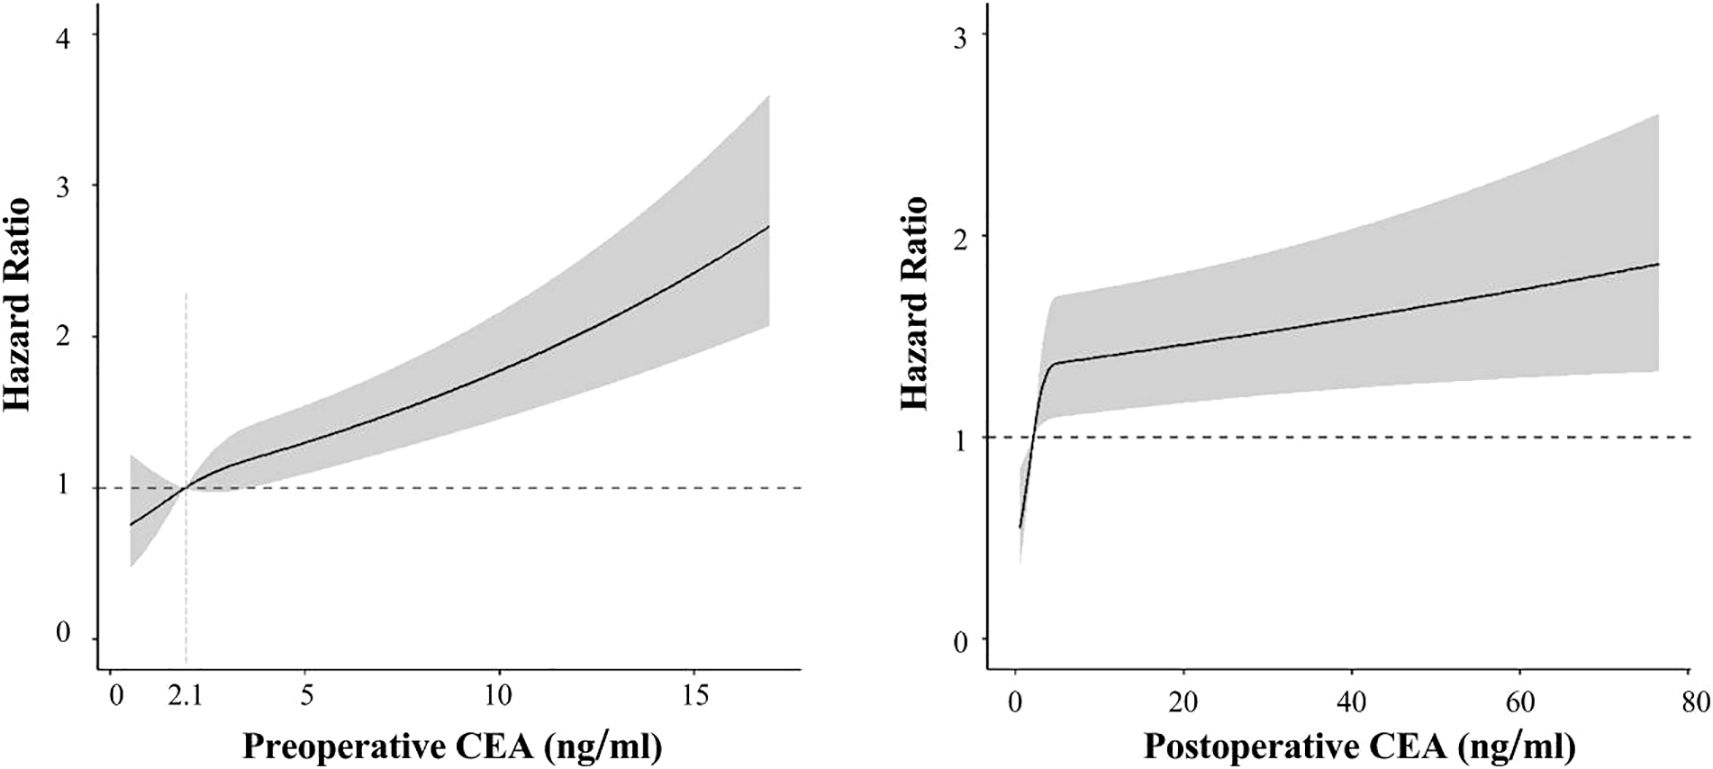
Figure 5. Association of preoperitive CEA (left) and postoperitive CEA (right) with recurrence-free survival in spline analysis.
Discussion
Our study analyzed retrospective data from the SAH Lung Cancer Cohort and characterized three distinct longitudinal patterns of CEA dynamics spanning from the preoperative phase to extended follow-up: low-stable, early-rising, and late-rising. Compared to those with consistently low CEA levels, NSCLC patients with early or delayed increases faced elevated recurrence risks, with the early-rising group also exhibited a higher risks of death.
As research indicates that CEA levels in NSCLC patients typically return to normal within six weeks after surgery (22), our trajectory analysis revealed delayed CEA normalization (≤6 months) in the late-rising group and CEA levels reaching nadir at approximately 5 months in the early-rising group. This delay may reflect the current follow-up protocol, where most stage I-IIIA patients undergo CEA testing at 3–6 month intervals post-surgery. These results suggest that more frequent CEA monitoring could enable earlier detection of high-risk trajectories, particularly in patients with intraoperative findings suggestive of micrometastases such as visceral pleural invasion or lymphovascular invasion.
Our analysis indicated that the rising trend in CEA from preoperative to postoperative periods was closely related to poor prognosis, consistent with conclusions from other studies (16, 23). Persistently elevated postoperative CEA levels often suggest incomplete surgical resection or hidden metastasis, indicating cancer recurrence (14, 15). Even after adjusting for preoperative CEA levels and other clinicopathological covariates, the association between CEA trajectory groups and prognosis remained significant, suggesting that long-term CEA trajectories are independent prognostic factors for NSCLC recurrence and death. These trajectories likely reflect the tumor’s biological behavior, the effectiveness of surgical resection, adjuvant therapy, and the host’s immune defense over time, providing more prognostic information than preoperative CEA alone.
Our results are consistent with prior evidence, showing that heightened CEA concentrations before and after surgery are linked to poor outcomes in NSCLC. Notably, sustained elevation is strongly associated with increased recurrence and mortality risks. NSCLC patients whose preoperative CEA levels were elevated but returned to normal postoperatively still showed increased likelihood of disease relapse and mortality, though to a lesser extent than those with persistently high CEA levels. Therefore, a postoperative decrease in CEA to the normal range is a protective factor for NSCLC prognosis compared to levels remaining elevated postoperatively (24, 25).
A major advantage of this study is the analysis of discrete and irregular longitudinal CEA data collected during postoperative follow-up from a sizable patient cohort. This can help clinicians develop individualized follow-up strategies by observing changes in patients’ CEA trajectories. Although different immunoassay methods may be used to measure CEA, the normal range for CEA is consistent across methods (0–5 ng/mL), suggesting minimal impact of measurement differences on CEA values in future clinical practice.
However, there are limitations to our study. Firstly, we did not control for confounding factors such as comorbidities and postoperative adjuvant therapy, which could influence patient prognosis, although the number of patients receiving postoperative adjuvant therapy was relatively small (<5%). Thus, Renal failure can cause false-positive elevations in tumor markers, potentially affecting the results. Secondly, subgroup sizes for early- and late-rising CEA patterns were limited by their low occurrence rates. Additionally, as the cohort was confined to a single institution -Zhejiang Second Lung Cancer Cohort – this may limit the representativeness of the findings. Further investigation is warranted to assess the applicability of these findings to a more diverse lung cancer population. The long time span for postoperative CEA measurement (within seven months) could also affect the results. Restricting this to three months might provide more rigorous data. Furthermore, the exclusion of patients who underwent neoadjuvant therapy may limit the generalizability of the findings. Future studies will investigate the impact of serum CEA trajectories after neoadjuvant therapy on prognosis. Lastly, our study was retrospective, and its conclusions need validation in prospective cohorts or clinical trials.
In summary, our findings highlight the prognostic relevance of perioperative serum CEA dynamics in resected lung cancer patients. The results indicate that postoperative CEA trends may inform personalized surveillance strategies and provide clinically meaningful insights to support post-surgical management.
Conclusion
CEA serves as a strong prognostic indicator for patients with NSCLC. Sustained elevations, whether observed preoperatively, postoperatively, or both, are linked to heightened risks of disease recurrence and mortality. Patients exhibiting persistently elevated CEA levels around the time of surgery are particularly vulnerable compared to those maintaining normal values throughout.
Our analysis identifies three distinct perioperative CEA trajectory groups in NSCLC patients: early-rising, late-rising, and stable. Both early- and late-rising groups exhibit higher recurrence rates compared to the stable group, with the early-rising group demonstrating the highest risk of mortality. This study underscores the critical importance of ongoing postoperative monitoring of CEA levels in NSCLC patients. Close surveillance is particularly warranted for those with rising CEA levels after surgery.
Data availability statement
The datasets generated and analyzed during this study are not publicly available due to restrictions imposed by the hospital’s data protection policy. Requests for data access may be directed to the corresponding author. Requests to access these datasets should be directed to XW, eGlmZW5nd0B6anUuZWR1LmNu.
Ethics statement
The studies involving humans were approved by the Institutional Review Board of the Second Affiliated Hospital of Zhejiang University School of Medicine (2020LSYD829). The studies were conducted in accordance with the local legislation and institutional requirements. The participants provided their written informed consent to participate in this study.
Author contributions
YM: Conceptualization, Data curation, Formal analysis, Investigation, Methodology, Project administration, Writing – original draft. XP: Conceptualization, Formal analysis, Methodology, Writing – original draft. JC: Data curation, Methodology, Validation, Writing – original draft. WZL: Data curation, Investigation, Writing – original draft. GS: Investigation, Software, Writing – original draft. JP: Data curation, Investigation, Software, Writing – original draft. XD: Data curation, Investigation, Software, Writing – original draft. KH: Methodology, Resources, Writing – original draft. WYL: Methodology, Writing – review & editing. HT: Methodology, Supervision, Writing – review & editing. XW: Funding acquisition, Resources, Supervision, Writing – review & editing.
Funding
The author(s) declare financial support was received for the research and/or publication of this article. This study was supported by Healthy Zhejiang One Million People Cohort (K20230085), Zhejiang Key Laboratory of Intelligent Preventive Medicine (2020E10004), the Leading Innovative and Entrepreneur Team Introduction Program of Zhejiang (2019R01007), Cancer Center, Zhejiang University and Key Research and Development Program of Zhejiang Province (2020C03002) to Xifeng Wu. The funding organizations had no role in the design and conduct of the study; collection, management, analysis, and interpretation of the data; preparation, review, or approval of the manuscript; and decision to submit the manuscript for publication.
Acknowledgments
The authors thank all participants and all investigators.
Conflict of interest
The authors declare that the research was conducted in the absence of any commercial or financial relationships that could be construed as a potential conflict of interest.
Generative AI statement
The author(s) declare that no Generative AI was used in the creation of this manuscript.
Any alternative text (alt text) provided alongside figures in this article has been generated by Frontiers with the support of artificial intelligence and reasonable efforts have been made to ensure accuracy, including review by the authors wherever possible. If you identify any issues, please contact us.
Publisher’s note
All claims expressed in this article are solely those of the authors and do not necessarily represent those of their affiliated organizations, or those of the publisher, the editors and the reviewers. Any product that may be evaluated in this article, or claim that may be made by its manufacturer, is not guaranteed or endorsed by the publisher.
Supplementary material
The Supplementary Material for this article can be found online at: https://www.frontiersin.org/articles/10.3389/fonc.2025.1627122/full#supplementary-material
References
1. Bray F, Laversanne M, Sung H, Ferlay J, Siegel RL, Soerjomataram I, et al. Global cancer statistics 2022: GLOBOCAN estimates of incidence and mortality worldwide for 36 cancers in 185 countries. CA A Cancer J Clin. (2024) 74:229–63. doi: 10.3322/caac.21834
2. Miao D, Zhao J, Han Y, Zhou J, Li X, Zhang T, et al. Management of locally advanced non-small cell lung cancer: State of the art and future directions. Cancer Commun. (2024) 44:23–46. doi: 10.1002/cac2.12505
3. Travis WD, Brambilla E, Nicholson AG, Yatabe Y, Austin JHM, Beasley MB, et al. The 2015 world health organization classification of lung tumors: impact of genetic, clinical and radiologic advances since the 2004 classification. J Thorac Oncol. (2015) 10:1243–60. doi: 10.1097/JTO.0000000000000630
4. Rajaram R, Huang Q, Li RZ, Chandran U, Zhang Y, Amos TB, et al. Recurrence-free survival in patients with surgically resected non-small cell lung cancer: a systematic literature review and meta-analysis. Chest. (2024) 165:1260–70. doi: 10.1016/j.chest.2023.11.042
5. Duffy MJ and O’Byrne K. Tissue and blood biomarkers in lung cancer: A review. Adv Clin Chem. (2018) 86:1–21. doi: 10.1016/bs.acc.2018.05.001
6. Grunnet M and Sorensen JB. Carcinoembryonic antigen (CEA) as tumor marker in lung cancer. Lung Cancer. (2012) 76:138–43. doi: 10.1016/j.lungcan.2011.11.012
7. Nasralla A, Lee J, Dang J, and Turner S. Elevated preoperative CEA is associated with subclinical nodal involvement and worse survival in stage I non-small cell lung cancer: a systematic review and meta-analysis. J Cardiothoracic Surgery. (2020) 15:318. doi: 10.1186/s13019-020-01353-2
8. Wang XB, Li J, and Han Y. Prognostic significance of preoperative serum carcinoembryonic antigen in non-small cell lung cancer: a meta-analysis. Tumor Biol. (2014) 35:10105–10. doi: 10.1007/s13277-014-2301-6
9. Zhang ZH, Han YW, Liang H, and Wang LM. Prognostic value of serum CYFRA21–1 and CEA for non-small-cell lung cancer. Cancer Med. (2015) 4:1633–8. doi: 10.1002/cam4.493
10. Reinmuth N, Brandt B, Semik M, Kunze WP, Achatzy R, Scheld HH, et al. Prognostic impact of Cyfra21–1 and other serum markers in completely resected non-small cell lung cancer. Lung Cancer. (2002) 36:265–70. doi: 10.1016/s0169-5002(02)00009-0
11. Kobayashi N, Toyooka S, Soh J, Ichimura K, Yanai H, Suehisa H, et al. Risk factors for recurrence and unfavorable prognosis in patients with stage I non-small cell lung cancer and a tumor diameter of 20 mm or less. J Thorac Oncol. (2007) 2:808–12. doi: 10.1097/JTO.0b013e31814617c7
12. Buccheri G, Ferrigno D, and Vola F. Carcinoembryonic antigen (CEA), tissue polypeptide antigen (TPA) and other prognostic indicators in squamous cell lung cancer. Lung Cancer. (1993) 10:21–33. doi: 10.1016/0169-5002(93)90306-i
13. Molina R, Filella X, Augé JM, Fuentes R, Bover I, Rifa J, et al. Tumor markers (CEA, CA 125, CYFRA 21-1, SCC and NSE) in patients with non-small cell lung cancer as an aid in histological diagnosis and prognosis. Tumor Biol. (2003) 24:209–18. doi: 10.1159/000074432
14. Kozu Y, Maniwa T, Takahashi S, Isaka M, Ohde Y, and Nakajima T. Prognostic significance of postoperative serum carcinoembryonic antigen levels in patients with completely resected pathological-stage I non-small cell lung cancer. J Cardiothorac Surg. (2013) 8:106. doi: 10.1186/1749-8090-8-106
15. Okada M, Nishio W, Sakamoto T, Uchino K, Yuki T, Nakagawa A, et al. Prognostic significance of perioperative serum carcinoembryonic antigen in non-small cell lung cancer: analysis of 1,000 consecutive resections for clinical stage I disease. Ann Thorac Surg. (2004) 78:216–21. doi: 10.1016/j.athoracsur.2004.02.009
16. Sawabata N, Ohta M, Takeda ichi S, Hirano H, Okumura Y, Asada H, et al. Serum carcinoembryonic antigen level in surgically resected clinical stage I patients with non-small cell lung cancer. Ann Thorac Surg. (2002) 74:174–9. doi: 10.1016/s0003-4975(02)03662-7
17. Laurence DJ, Turberville C, Anderson SG, and Neville AM. First british standard for carcinoembryonic antigen (CEA). Br J Cancer. (1975) 32:295–9. doi: 10.1038/bjc.1975.227
18. Proust-Lima C, Philipps V, and Liquet B. Estimation of extended mixed models using latent classes and latent processes: the R package lcmm. J Stat Soft. (2017) 78:1–56. doi: 10.18637/jss.v078.i02
19. Andruff H, Carraro N, Thompson A, Gaudreau P, and Louvet B. Latent class growth modelling: A tutorial. TQMP. (2009) 5:11–24. doi: 10.20982/tqmp.05.1.p011
20. Desquilbet L and Mariotti F. Dose-response analyses using restricted cubic spline functions in public health research. Stat Med. (2010) 29:1037–57. doi: 10.1002/sim.3841
21. Gauthier J, Wu QV, and Gooley TA. Cubic splines to model relationships between continuous variables and outcomes: a guide for clinicians. Bone Marrow Transplant. (2020) 55:675–80. doi: 10.1038/s41409-019-0679-x
22. Vincent RG, Chu TM, and Lane WW. The value of carcinoembryonic antigen in patients with carcinoma of the lung. Cancer. (1979) 44:685–91. doi: 10.1002/1097-0142(197908)44:2<685::aid-cncr2820440241>3.0.co;2-1
23. Lou E, Johnson M, Sima C, Gonzalez-Espinoza R, Fleisher M, Kris MG, et al. Serum biomarkers for assessing histology and outcomes in patients with metastatic lung cancer. Cancer biomark. (2014) 14:207–14. doi: 10.3233/CBM-140399
24. Jiao Z, Cao S, Li J, Hu N, Gong Y, Wang L, et al. Clinical associations of preoperative and postoperative serum CEA and lung cancer outcome. Front Mol Biosciences. (2021) 8:686313. doi: 10.3389/fmolb.2021.686313
Keywords: non-small lung cancer, curative resection, carcinoembryonic antigen, perioperative period, trajectories
Citation: Ma Y, Pan X, Cui J, Lu W, Sun G, Pan J, Dong X, Hu K, Li W, Tu H and Wu X (2025) Trajectories of perioperative serum CEA and non-small cell lung cancer prognosis: a retrospective longitudinal cohort study. Front. Oncol. 15:1627122. doi: 10.3389/fonc.2025.1627122
Received: 12 May 2025; Accepted: 25 September 2025;
Published: 14 October 2025.
Edited by:
Alfredo Addeo, Hôpitaux universitaires de Genève (HUG), SwitzerlandReviewed by:
Johannes Fahrmann, University of Texas MD Anderson Cancer Center, United StatesKubilay İnan, Ankara Yildirim Beyazit University, Türkiye
Copyright © 2025 Ma, Pan, Cui, Lu, Sun, Pan, Dong, Hu, Li, Tu and Wu. This is an open-access article distributed under the terms of the Creative Commons Attribution License (CC BY). The use, distribution or reproduction in other forums is permitted, provided the original author(s) and the copyright owner(s) are credited and that the original publication in this journal is cited, in accordance with accepted academic practice. No use, distribution or reproduction is permitted which does not comply with these terms.
*Correspondence: Xifeng Wu, eGlmZW5nd0B6anUuZWR1LmNu; Huakang Tu, aHVha2FuZ3R1QHpqdS5lZHUuY24=
†These authors have contributed equally to this work