- 1The Second School of Clinical Medicine, Binzhou Medical University, Yantai, Shandong, China
- 2Liuzhou Traditional Chinese Medicine Hospital, Liuzhou, Guangxi, China
- 3Otorhinolaryngology Head and Neck Surgery, Yantai Yuhuangding Hospital, Yantai, Shandong, China
Background: Sinonasal inverted papilloma (IP) is a benign tumor of the sinonasal mucosa, which may become malignant. Machine learning (ML) has been applied to improve the accuracy in the diagnosis of various diseases, but no studies have evaluated the performance of ML for IP diagnosis. This systematic review and meta-analysis aimed to explore the diagnostic performance of ML for IP.
Methods: We systematically searched articles from PubMed, Cochrane, Embase, and Web of Science up to July 22, 2025. The quality assessment of diagnostic accuracy studies tool (QUADAS-2) was used to assess the risk of bias, and the bivariate mixed-effect model was used for meta-analysis.
Results: 17 studies involving 3321 participants were included. In the validation set, the sensitivity and specificity of ML constructed based on radiomics for identifying IP and malignant tumors were 0.84 (95%CI: 0.77-0.89) and 0.82 (95% CI: 0.74 ~ 0.88), respectively. The sensitivity and specificity of ML constructed based on radiomics and clinical features for identifying IP and malignant tumors were 0.85 (95%CI: 0.78-0.90) and 0.87 (95% CI: 0.80 ~ 0.92), respectively.
Conclusion: Our study shows that ML has a favorable performance in the differential diagnosis of IP. More prospective studies are needed to validate and develop universal tools.
Systemic Review Registration: https://www.crd.york.ac.uk/PROSPERO/view/CRD42023430417, identifier CRD42023430417.
1 Introduction
Sinonasal inverted papillomas (IPs) are benign but locally aggressive tumors that arise from the Schneiderian membrane in the sinus cavity with a high rate of recurrence and a tendency toward malignant transformation (1). The incidence of this tumor is 0.2 to 1.5/100,000 people per year with a higher incidence in men, and it affects individuals of all age groups (1). The clinical symptoms and imaging characteristics of IP closely resemble malignant tumors, often leading to diagnostic confusion. However, their prognosis and treatment strategies differ significantly (2). Therefore, accurate preoperative diagnosis of sinus tumors is essential for developing appropriate treatment strategies and assessing patient outcomes.
The diagnosis of IP can be made from clinical manifestations, imaging and pathological examination. However, the results are not satisfactory (1), especially in areas with underdeveloped medical resources. Radiomics, a field focusing on extracting image features quantitatively from standard medical imaging, has emerged as a valuable tool for improving diagnostic accuracy, prognosis assessment, and predictive capabilities in clinical decision support systems (3). Radiomics is widely used in the qualitative analysis, therapeutic effect evaluation and prognosis prediction of various tumors, and has developed rapidly in the field of tumor management (4).
Most studies have been conducted to distinguish IP from malignant tumors, while few studies focus on evaluating the diagnostic performance of machine learning methods. Therefore, we conducted this study to explore the diagnostic value of machine learning methods in IP diagnostics.
2 Materials and methods
2.1 Study registration
This study was conducted in accordance with reporting guidelines for systematic reviews and meta-analyses (PRISMA_2020) and prospectively registered on Prospero.
2.2 Eligibility criteria
Inclusion criteria were as follows:
1. The participants of this systematic review were individuals with nasal lesions;
2. The included studies were case-control studies, cohort studies and cross-sectional studies;
3. Studies has to construct a machine learning model for differential diagnosis of sinonasal inverted papilloma;
4. Some studies had difficulty achieving external validation, but they only provided K-fold cross-validation or internal validation of random sampling. Although it might overstate the accuracy of the model, its value was still fairly representative. Therefore, studies without external validation were also included in this systematic review and meta-analysis.
5. Studies that used the same dataset to construct different machine learning models were also included;
6. Studies written in English were included.
Exclusion criteria were as follows:
1. The research types were meta-analyses, reviews, guides, expert opinions, etc.;
2. Studies that only performed univariate analysis but did not construct a machine learning model were excluded;
3. The outcome indicators such as the Roc, c-statistic, c-index, sensitivity, specificity, accuracy, recovery rate, accuracy rate, confusion matrix, diagnosis four-cell table, F1 score, and calibration curve were missing to evaluate the accuracy of the machine learning models;
4. Studies with a sample size of less than 20 cases were excluded.
2.3 Data sources and search strategy
We searched the literature via PubMed, Cochrane, Embase, and Web of Science, up to July 22, 2025. The retrieval used subject-specific and free-text keywords, and the subject headings encompassed “machine learning” and “Nose Neoplasms”, with no restriction on the region. The detailed search strategy is shown in Supplementary Table S1.
2.4 Study selection
We used endnotes to filter the literature. The literature screening was completed by two investigators. After completion, they cross-checked their results to ensure accuracy. Disputes, if any, were resolved by a third investigator.
2.5 Data extraction
Prior to data extraction, we designed a standardized spreadsheet that included information such as title, first author, year of publication, country of author, type of study (case-control, cohort study (retrospective, prospective), nested cohort study, case-cohort study), patient origin (single center, multicenter, registry database), diagnostic criteria for inverted papilloma, reference subjects, number of inverted papilloma cases, total number of cases, the number of inverted papilloma cases in the training set, total number of cases in the training set, generation method of validation set [internal validation (random sampling, K-fold cross-validation, leave one method), external validation (prospective, multicenter)], overfitting method, number of cases of inverted papilloma in validation set, number of cases in validation set, variable screening/feature selection method, type of model used, and modeling variables (radiomics, clinical features).
The data extraction was completed by three independent investigators. After completion, they cross-checked their results to ensure accuracy. Dissents, if any, were resolved by a third investigator.
2.6 Risk of bias in studies
The risk of bias in the included studies was assessed using the diagnostic test evaluation tool QUADAS-2 (5). It assesses the risk of bias in data compilation and the clinical applicability of the original diagnostic test. QUADAS-2 is composed of 4 domains: patient selection, index test, reference standard, and flow and timing (5). Each domain contains several specific questions with three response options: “yes,” “No,” or “inconclusive,”. The responses correspond to a “low,” “high,” or “uncertain” risk of bias, respectively. If the answers to all the questions are “yes”, then the risk of bias is deemed to be low; if any of the questions receive “no”, then there is a possibility of bias, and the evaluator must determine the risk of bias according to the established guidelines. An “uncertain” risk means that the literature lacks detailed information to make a conclusive judgment. Supplementary Figure S2 provides a comprehensive overview of the risk of bias assessment using the QUADAS-2 approach for each study included in the analysis.
2.7 Outcomes
Results Measures included sensitivity, specificity, positive likelihood ratio, negative likelihood ratio and diagnostic odds ratio. Sensitivity and specificity were extracted from the ROC curve and combined with the number of cases, a four-cell diagnostic table was made.
2.8 Synthesis methods
Data analysis was conducted by using Stata15.0 (StataCorp LLC, College Station, TX). A bivariate mixed-effect model was used to analyze the differential diagnosis of IP. The combined sensitivity, specificity, positive likelihood ratio, negative likelihood ratio, diagnostic odds ratio and 95% confidence interval (95% CI) of the effect size were calculated, and the area under the integrated receiver operating characteristic (SROC) curve was estimated. The Deek funnel plot was used to assess publication bias. P<0.05 indicated a significant difference between/among treatments.
3 Results
3.1 Study selection
We initially identified 2,111 studies, of which 193 were duplicates (143 duplicated articles were automatically detected by software and 50 duplicated articles were manually removed). After screening the title and abstract, 1,885 articles were further deleted, and the full texts of the remaining 33 articles were downloaded. Subsequently, we evaluated the full texts and discarded 16 articles for several reasons: three conference abstracts were published without peer review; in 10 studies, the control events were non-IP, and only image segmentation was performed; two studies did not construct a complete model; and one study investigated the accuracy of unresponsive machine learning. Finally, we included 17 studies for further analysis (6–22). The literature screening process is illustrated in Supplementary Figure S1.
3.2 Study characteristics
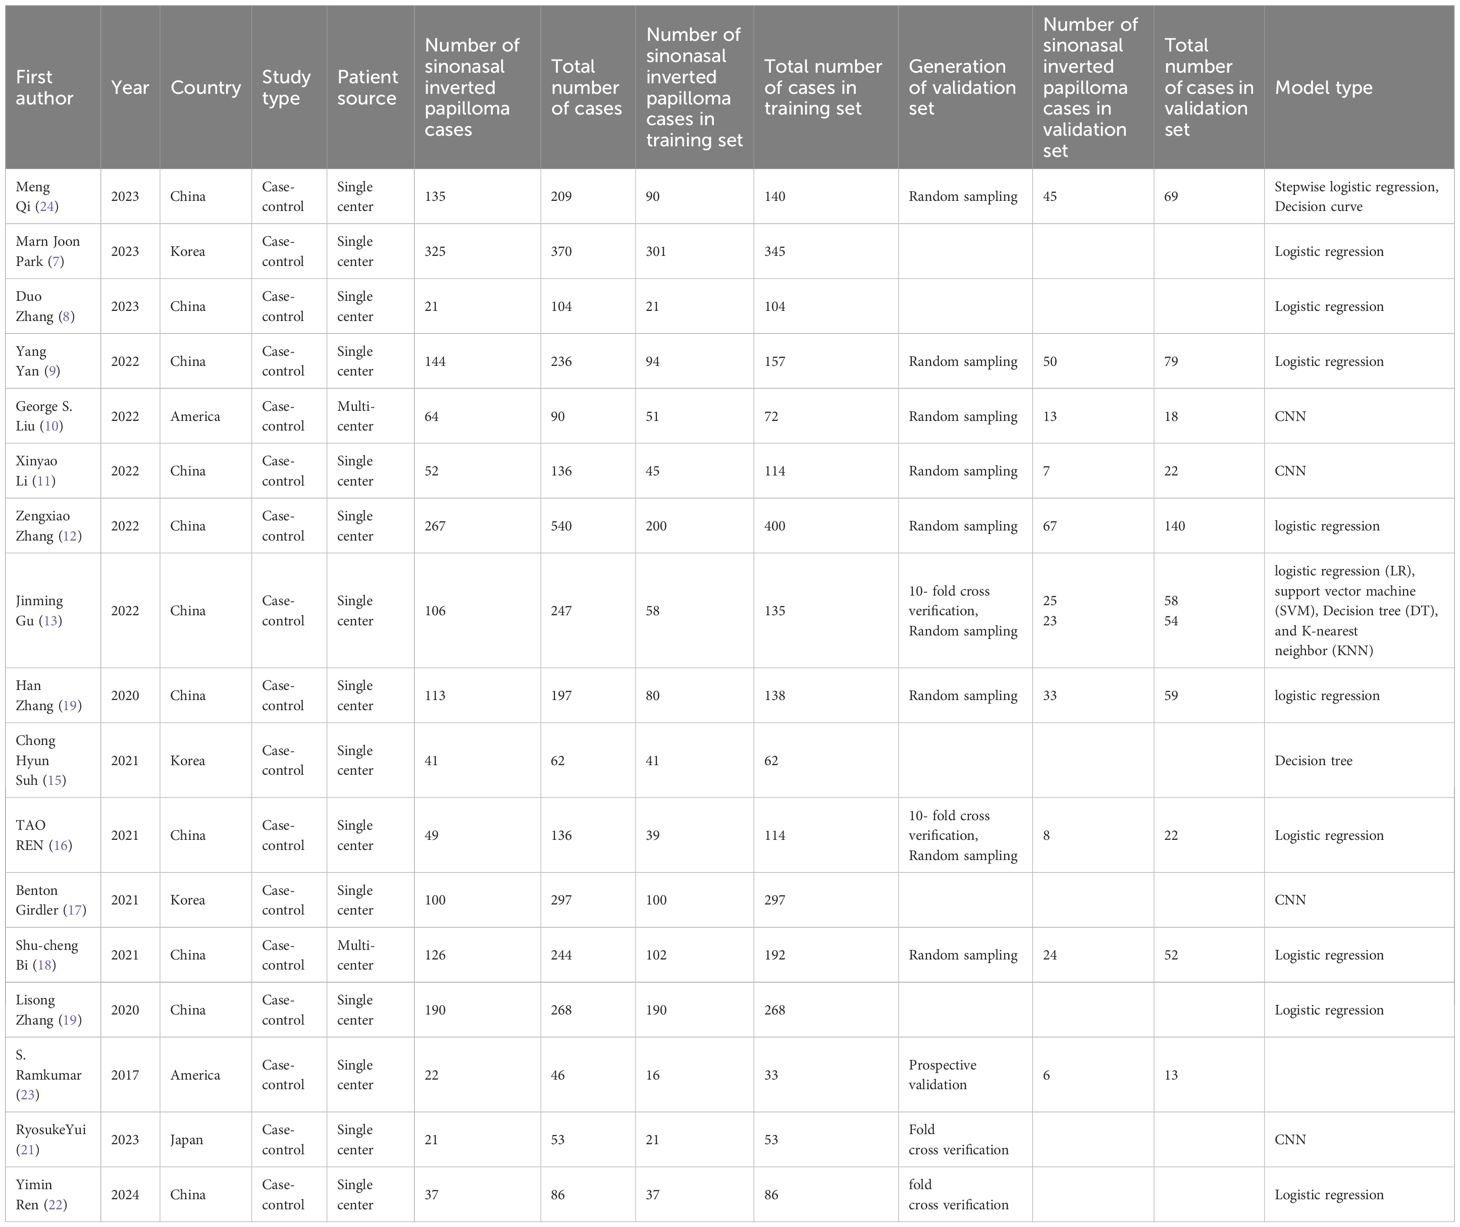
The 17 eligible studies were published between 2016 and 2024. Among the included studies, 13 studies focused on IP and malignancy (6–10, 13–15, 18, 19, 21–23); 3 studies investigated inverted papilloma and nasal polyps (11, 16, 17), and one study investigated inverted papilloma and sinusitis (12). Of the studies that identified IP and malignancy, eight studies constructed a machine learning model based on radiomics (7, 9, 10, 13–15, 18, 23), and seven studies constructed a machine learning model based on radiomics and clinical features (6–9, 13, 14). Studies on IP and nasal polyps constructed machine learning models using radiomics, whereas the studies on IP and sinusitis constructed machine learning models based on radiomics and clinical features. Six studies focused on automatic segmentation from images using deep learning methods (6, 11, 13, 14, 16, 18). Table 1 lists the basic features of the included studies.
3.3 Risk of bias in studies
In the included retrospective study, a diagnostic model based on machine learning was constructed, and the modeling variables were mostly radiomic characteristics. Therefore, no high risk of bias was found. The modeling variables in the included studies were radiomic features, identifying diseases according to machine learning rules. Therefore, knowledge of the gold standard does not create a risk of biased results. IP was diagnosed by pathological biopsy, so the risk of bias in all studies was low. There is an appropriate time interval between the IP evaluation test and the gold standard. Each patient receives the same gold standard. The evaluation results are shown in Supplementary Figure S2.
3.4 Meta-analysis
3.4.1 IP vs. malignant tumors
3.4.1.1 Training set
Twelve studies (6–10, 13–15, 19, 21–23) employed machine learning to differentiate IP from malignant tumors. The pooled sensitivity, specificity, positive likelihood ratio, negative likelihood ratio, and diagnostic odds ratio of machine learning to differentiate IP from malignant tumors were 0.85 (95% CI: 0.81-0.88), 0.88 (95%CI: 0.83-0.91), 6.8 (95%CI: 4.7-9.8), 0.17 (95%CI: 0.13-0.23), and 40 (95%CI: 22-70), respectively (Figures 1A, B). Publication bias was not detected among these models in the training set (Figure 1C). The prevalence of IP in the included studies was 33%. Based on this prevalence, we established a prior probability of 33%. If the machine learning suggested IP, then the posterior probability of diagnosis of IP in positive patients was 77% and that of diagnosis of IP in negative patients was 8% (Figure 1D).
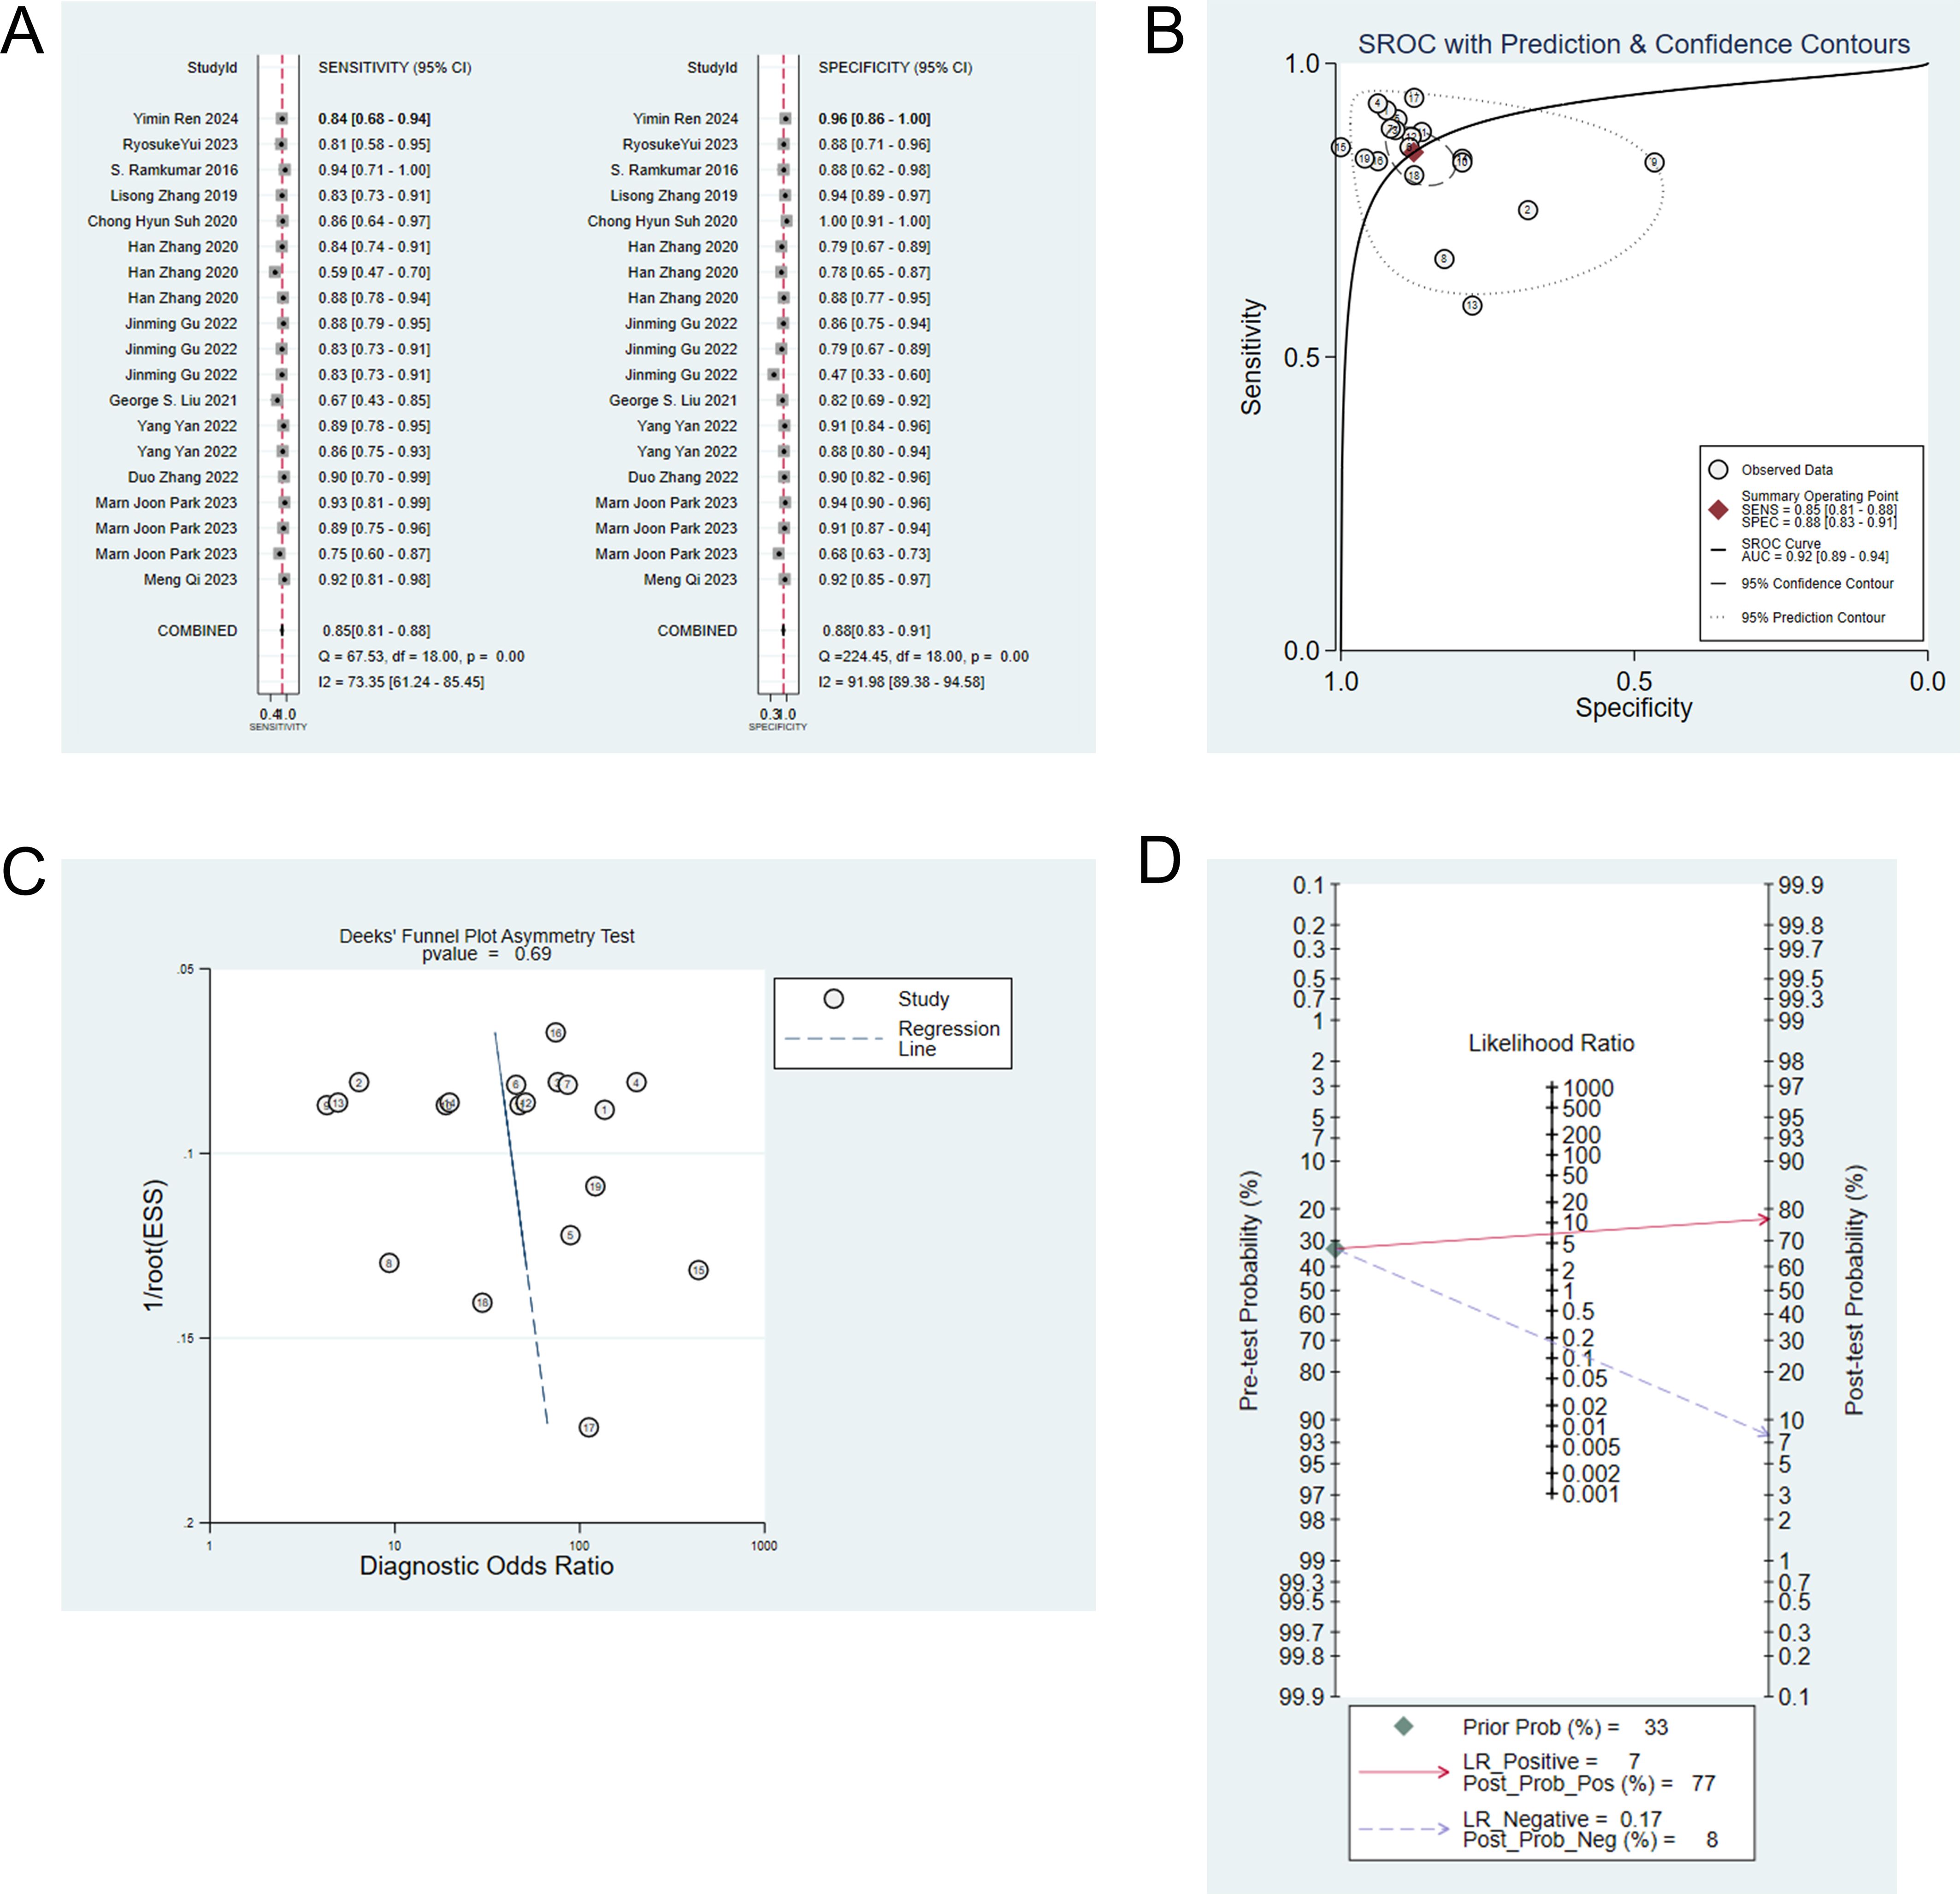
Figure 1. (A) Forest map of machine learning for identifying IP and nasal malignancies in the training set. (B) SROC of machine learning for identifying IP and nasal malignancy in the training set. (C) Funnel plot of machine learning for identifying IP and nasal malignancies in the training set. (D) Nomogram of machine learning for identifying IP and nasal malignancies in the training set.
Eight studies (7, 9, 10, 13–15, 21, 23) constructed machine learning models based on radiomic for the differential diagnosis of IP and malignant tumors. The analysis showed that the sensitivity, specificity, positive likelihood ratio, negative likelihood ratio and diagnostic odds ratio of the models for identifying IP and malignant tumors were 0.85 (95% CI: 0.80-0.88), 0.88 (95%CI: 0.82-0.91), 6.8 (95%CI: 4.7-9.8), 0.18 (95%CI: 0.13-0.24), 38 (95%CI: 21-68), respectively (Figures 2A, B). Publication bias was not identified among these models in the training set (Figure 2C), and the prevalence of IP in the included studies was approximately 34%. Based on this prevalence, we established a prior probability of 34%. If the machine learning suggested IP, then the posterior probability of diagnosis of IP in positive patients was 78% and that of diagnosis of IP in negative patients was 8% (Figure 2D).
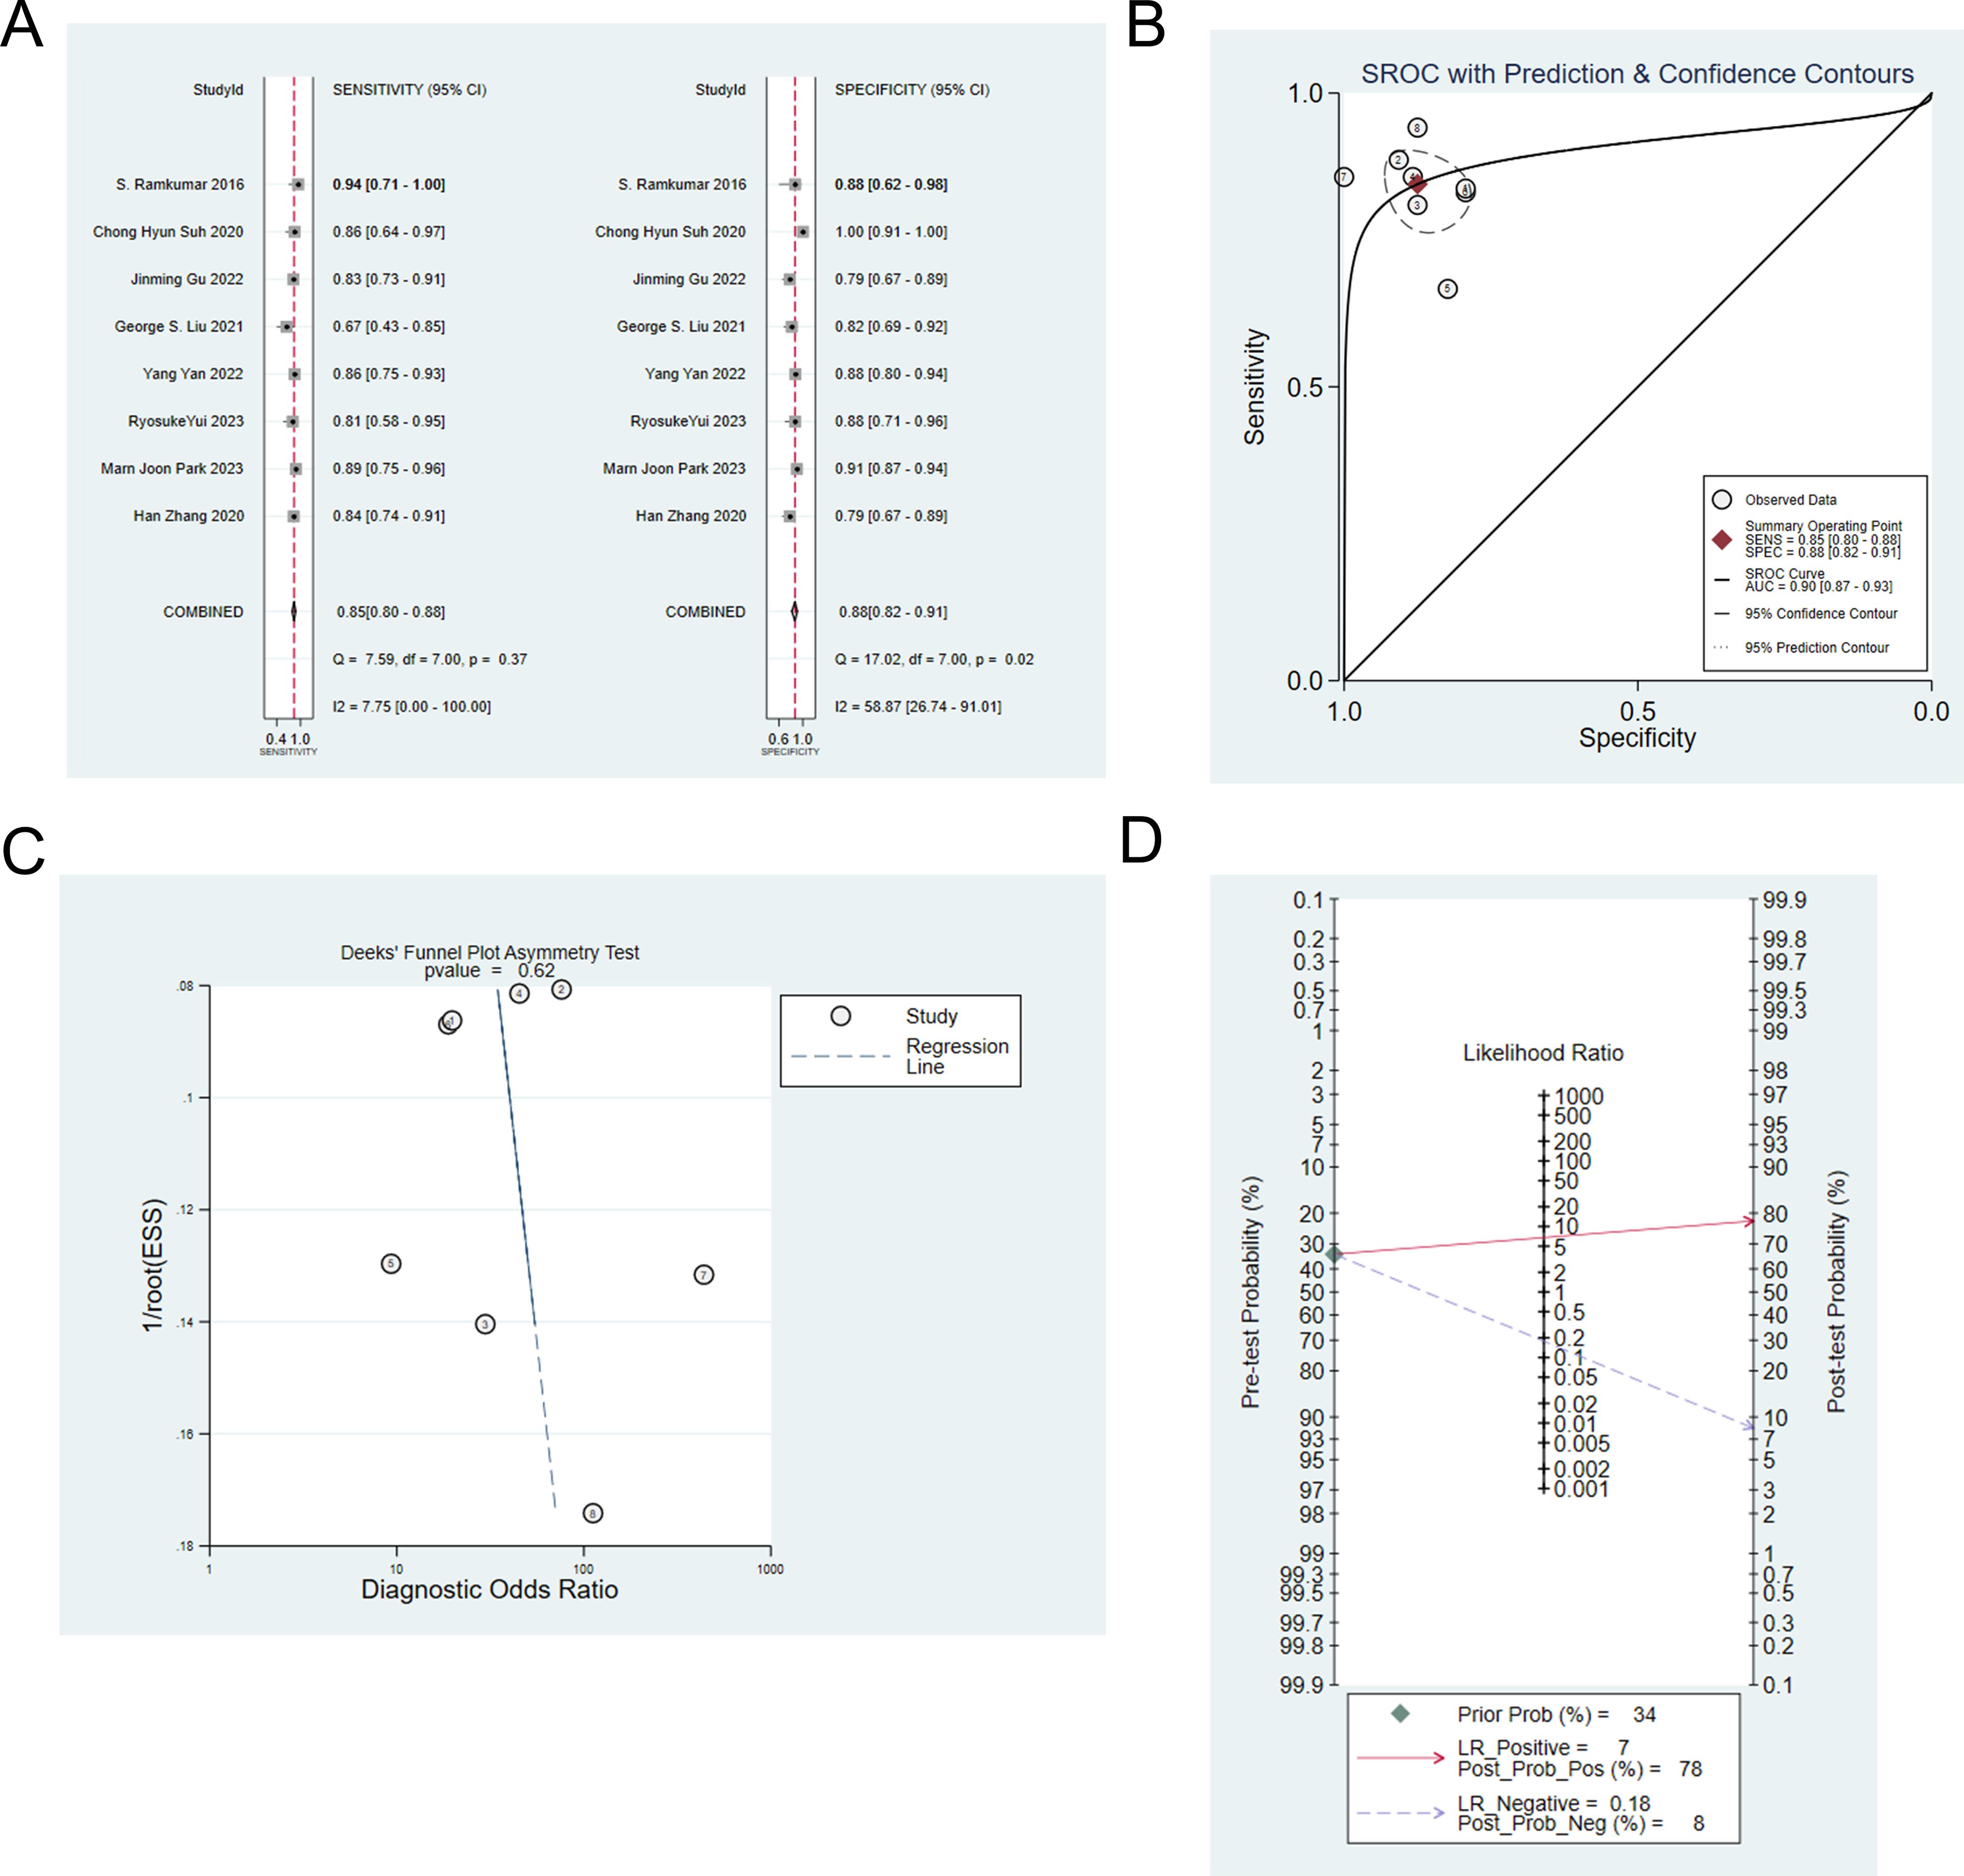
Figure 2. (A) Forest map of machine learning based on radiomic for identifying IP and nasal malignancies in the training set. (B) SROC of machine learning based on radiomic for identifying IP and nasal malignancy in the training set. (C) Funnel plot of machine learning based on radiomic for identifying IP and nasal malignancies in the training set. (D) Nomogram of machine learning based on radiomic for identifying IP and nasal malignancies in the training set.
Eight studies (6–9, 13, 14, 19, 22) constructed machine learning model based on radiomic and clinical features to differentiate IP from malignant tumors. The analysis showed that the sensitivity, specificity, positive likelihood ratio, negative likelihood ratio and diagnostic odds ratio were: 0.88 (95% CI: 0.85 ~ 0.91), 0.92 (95%CI: 0.90 ~ 0.94), 11.4 (95%CI: 9.1 ~14.3), 0.13 (95%CI: 0.10 ~ 0.17), and 88 (95%CI: 61 ~ 128), respectively (Figures 3A, B). Publication bias was not observed among these models in the training set (Figure 3C), and the prevalence of IP in the included studies was about 32%. Based on this prevalence, we established a prior probability of 32%. If the machine learning suggested IP, then the posterior probability of diagnosis of IP in positive patients was 84% and that of diagnosis of IP in negative patients was 6% (Figure 3D).
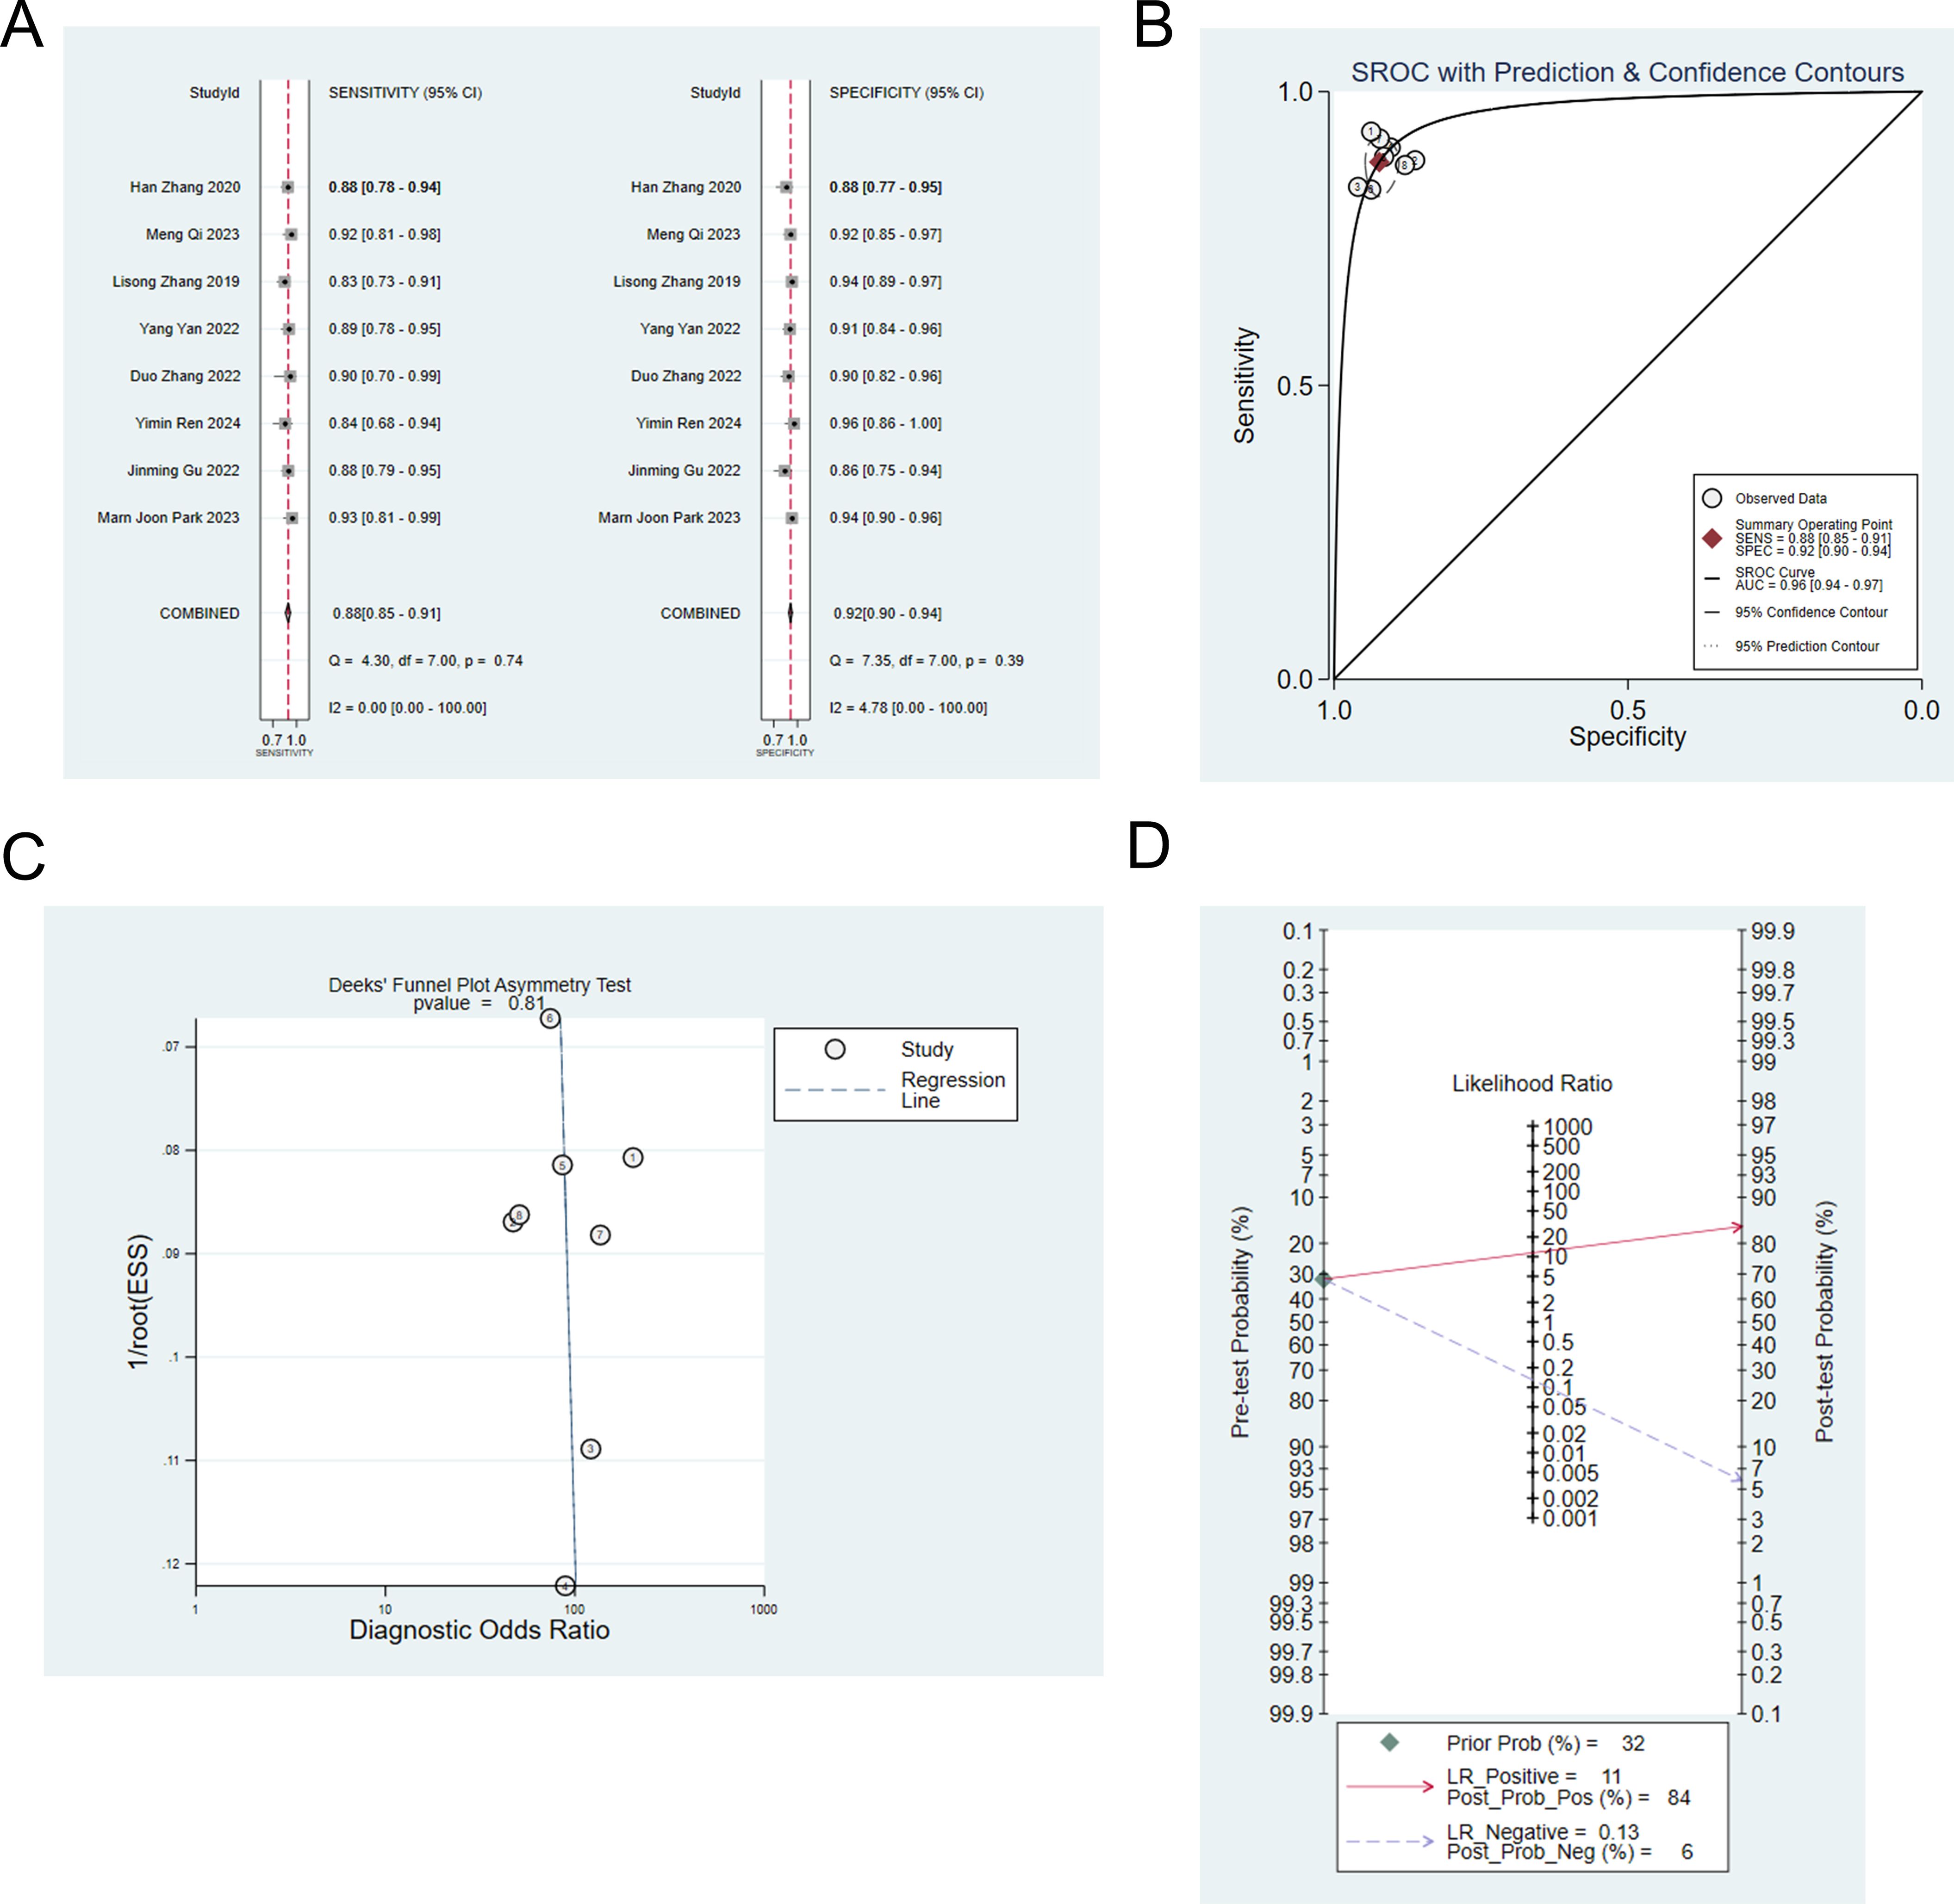
Figure 3. (A) Forest map of machine learning based on radiomic and clinical features for identifying IP and nasal malignancies in the training set. (B) SROC of machine learning based on radiomic and clinical features for identifying IP and nasal malignancy in the training set. (C) Funnel plot of machine learning based on radiomic and clinical features for identifying IP and nasal malignancies in the training set. (D) Nomogram of machine learning based on radiomic and clinical features for identifying IP and nasal malignancies in the training set.
3.4.1.2 Validation set
Six studies validated the performance of machine learning to differentiate IP from malignant tumors (9, 13, 14, 18, 23, 24). The sensitivity, specificity, positive likelihood ratio, negative likelihood ratio, and diagnostic odds ratio of machine learning to differentiate IP from malignant tumors were 0.83 (95% CI: 0.79 ~ 0.86), 0.81 (95% CI: 0.74 ~ 0.86), 4.4 (95% CI: 3.2 ~6.0), 0.21 (95% CI: 0.17 ~ 0.27), and 21 (95% CI: 13 ~ 33), respectively (Figures 4A, B). Publication bias was identified among these models in the validation set (Figure 4C), and the prevalence of IP in the included studies was about 50%. Based on this prevalence, we established a prior probability of 50%. If the machine learning suggested IP, then the posterior probability of diagnosis of IP in positive patients was 81% and that of diagnosis of IP in negative patients was 18% (Figure 4D).
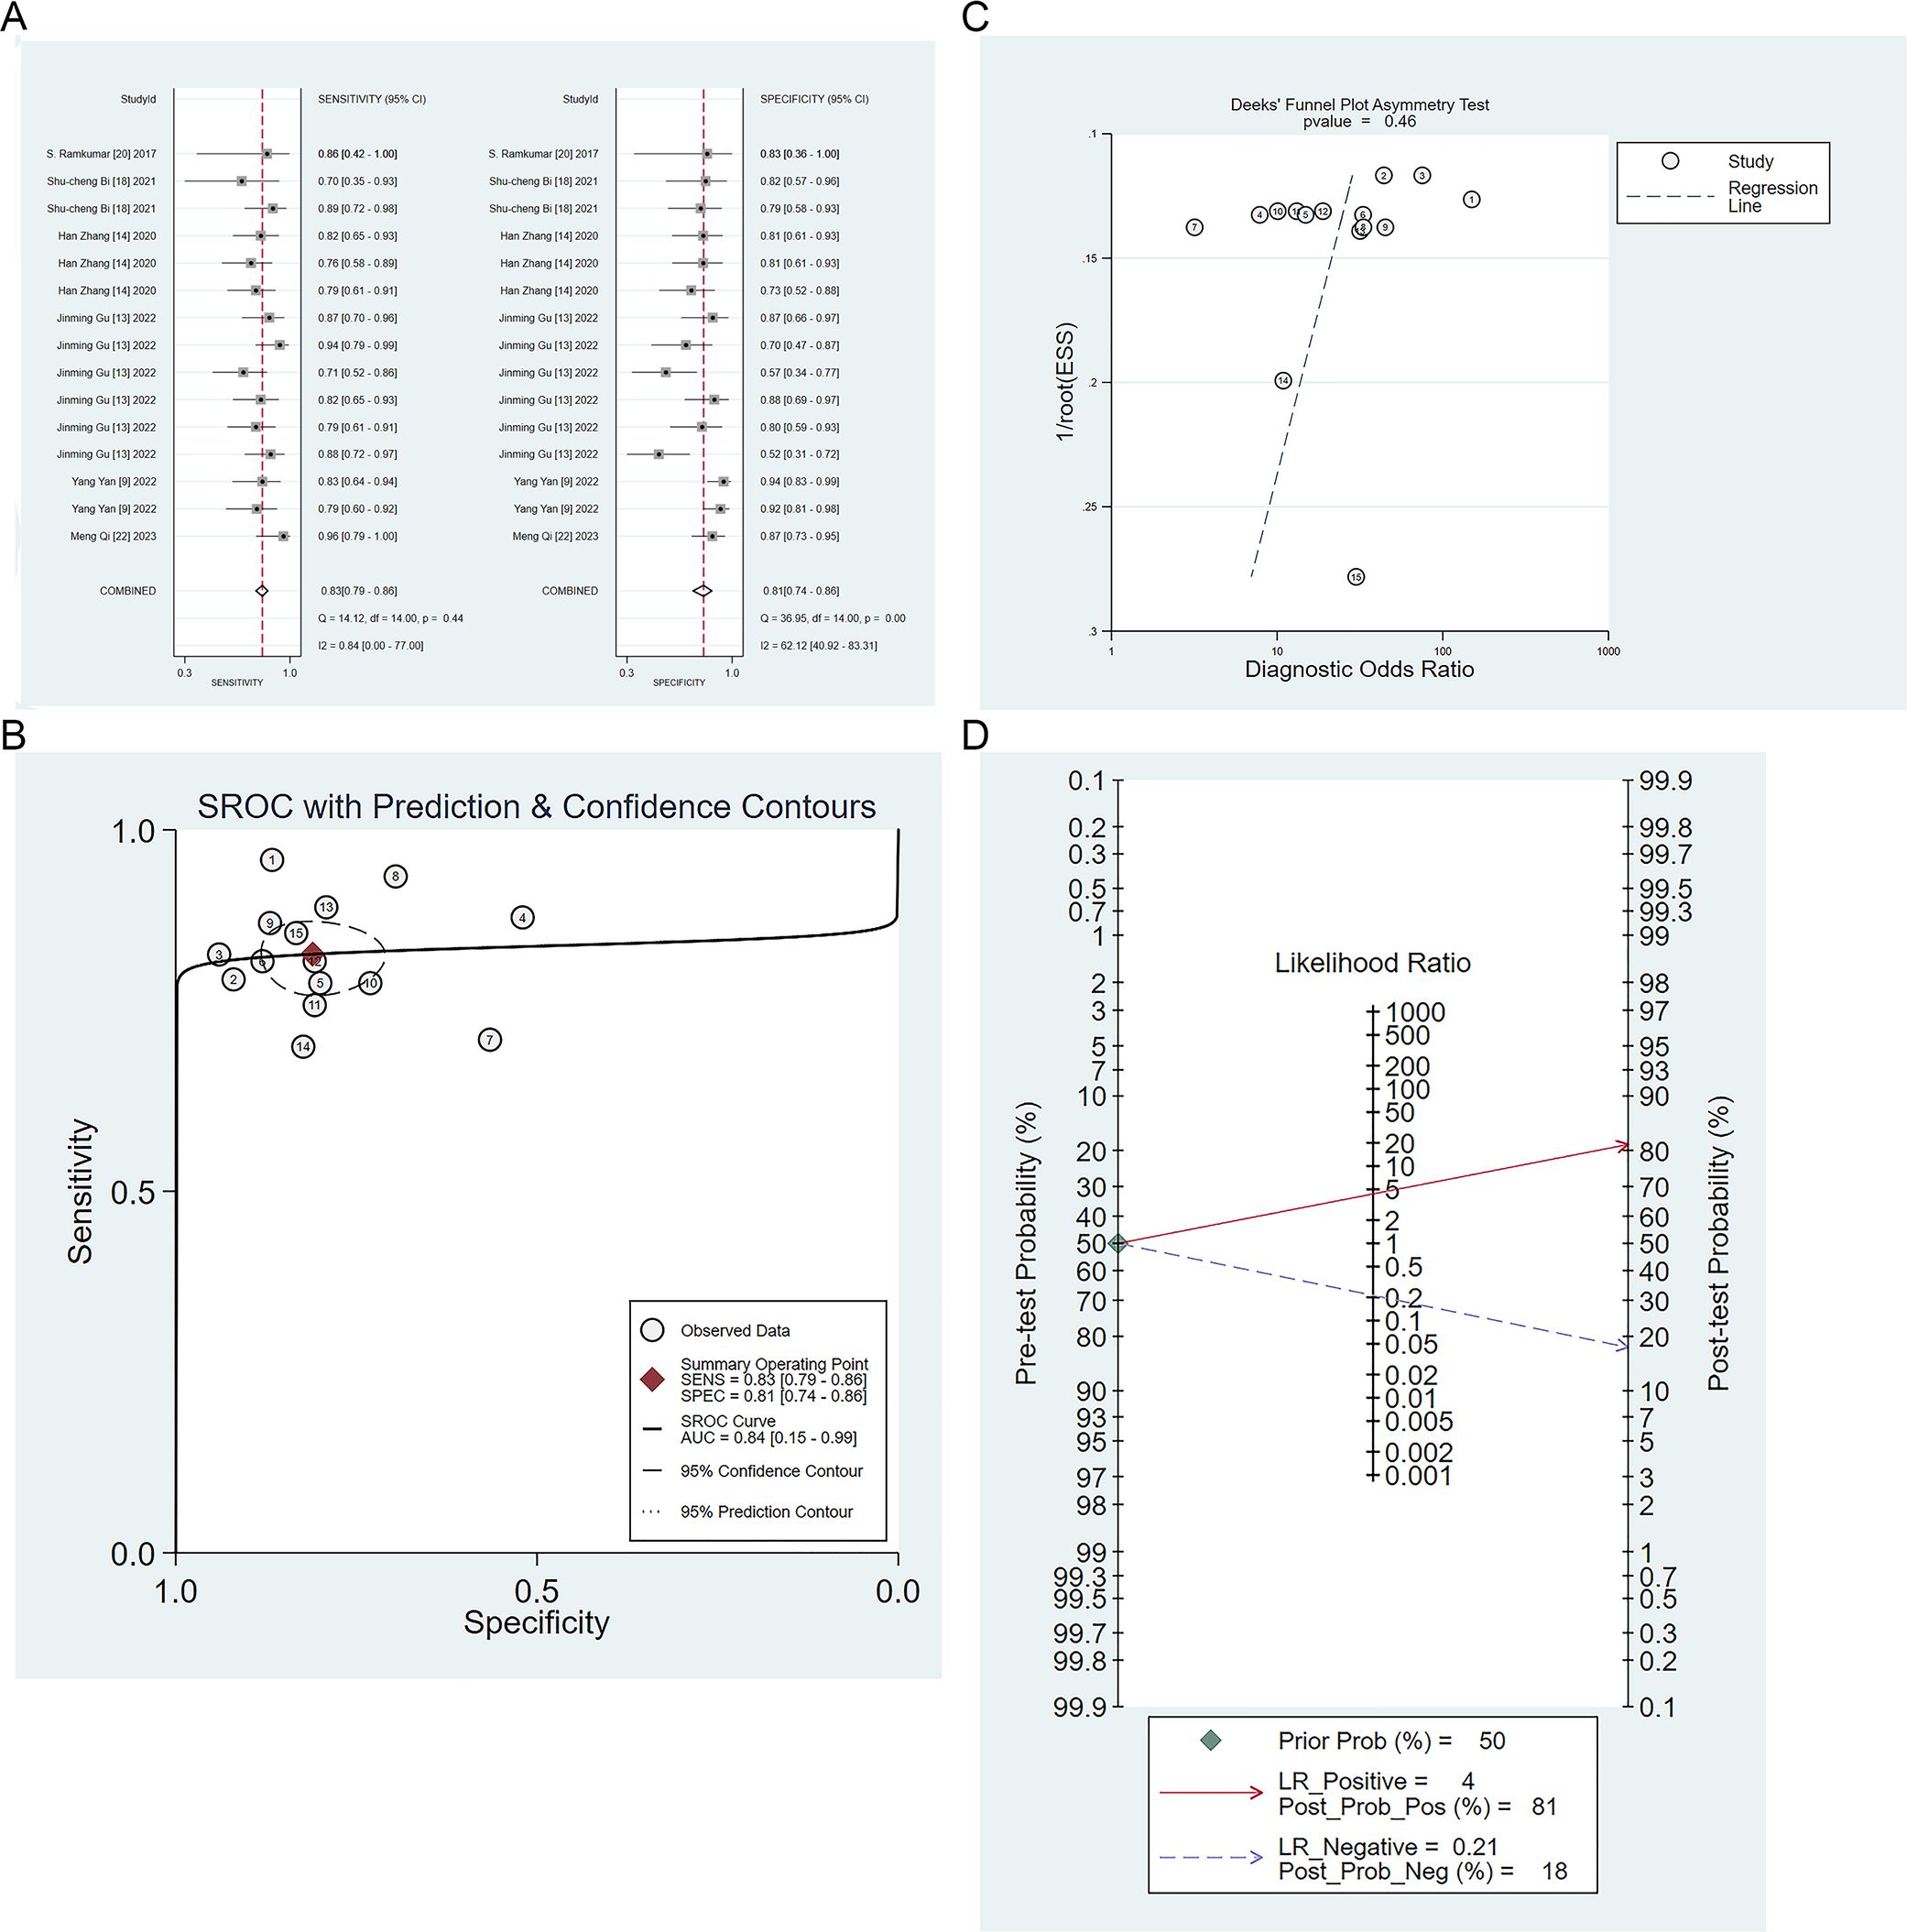
Figure 4. (A) Forest map of machine learning for identifying IP and nasal malignancies in the validation set. (B) SROC of machine learning for identifying IP and nasal malignancy in the validation set. (C) Funnel plot of machine learning for identifying IP and nasal malignancies in the validation set. (D) Nomogram of machine learning for identifying IP and nasal malignancies in the validation set.
Five studies validated the performance of radiomics-based models for the differential diagnosis of IP and malignant tumors (9, 13, 14, 18, 23). The sensitivity, specificity, positive likelihood ratio, negative likelihood ratio, and diagnostic odds ratio of radiomics-based models for identifying IP and malignant tumors were 0.84 (95% CI: 0.77 ~ 0.89), 0.82 (95%CI: 0.74 ~ 0.88), 4.7 (95%CI: 3.3 ~6.9), 0.20 (95%CI: 0.14 ~ 0.29), 24 (95%CI: 13 ~ 43), respectively (Figures 5A, B). There was no publication bias among these models in the validation set (Figure 5C), and the prevalence of IP in the included studies was about 50%. Based on this prevalence, we established a prior probability of 50%. If the machine learning suggested IP, then the posterior probability of diagnosis of IP in positive patients was 83% and that of diagnosis of IP in negative patients was 16% (Figure 5D).
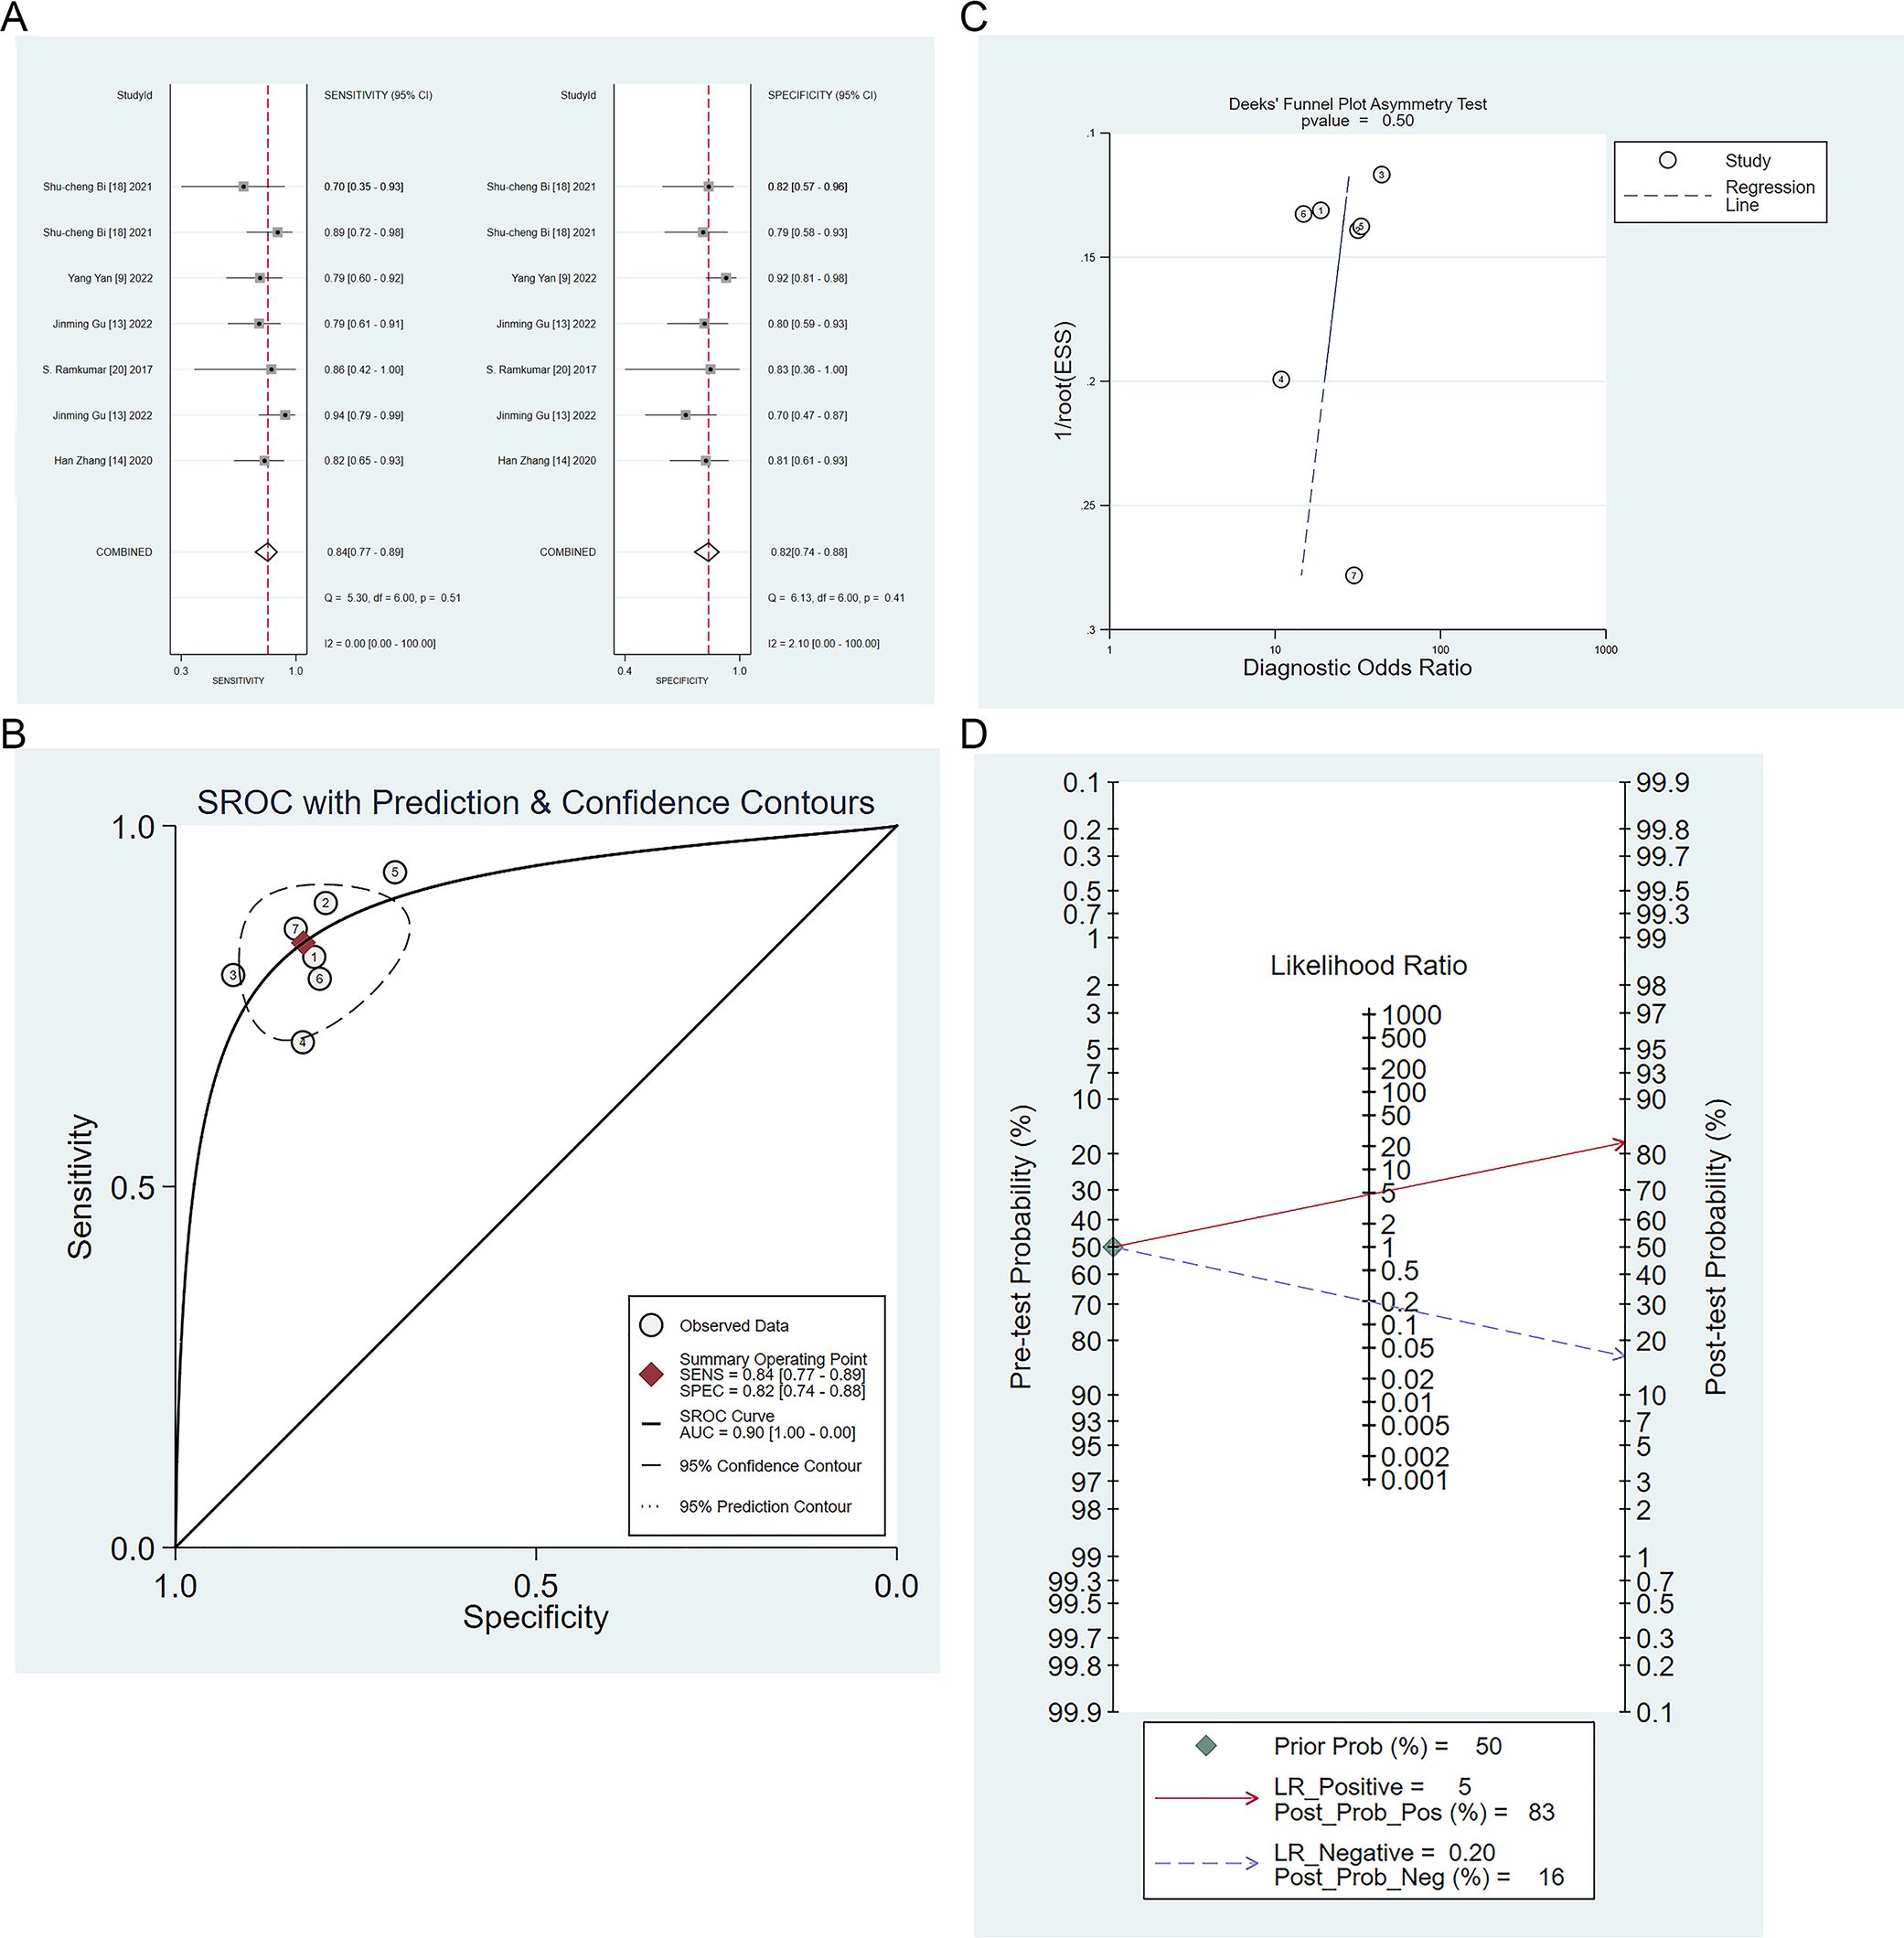
Figure 5. (A) Forest map of radiomics-based models for identifying IP and nasal malignancies in the validation set. (B) SROC of radiomics-based models for identifying IP and nasal malignancy in the validation set. (C) Funnel plot of radiomics-based models for identifying IP and nasal malignancies in the validation set. (D) Nomogram of radiomics-based models for identifying IP and nasal malignancies in the validation set.
Four studies (9, 13, 14, 24) validated the performance of machine learning models based on radiomic and clinical features to differentiate IP from malignant tumors. The analysis of these models revealed that the sensitivity, specificity, positive likelihood ratio, negative likelihood ratio, and diagnostic odds ratio were 0.85 (95% CI: 0.78 ~ 0.90), 0.87 (95%CI: 0.80 ~ 0.92), 6.5 (95%CI: 4.0 ~10.5), 0.18 (95%CI: 0.12 ~ 0.26), and 37 (95%CI: 18 ~ 77), respectively (Supplementary Figure S3A, B). There was no publication bias among these models in the validation set (Supplementary Figure S3C), and the prevalence of IP in the included studies was about 47%. Based on this prevalence, we established a prior probability of 47%. If the machine learning suggested IP, then the posterior probability of diagnosis of IP in positive patients was 85% and that of diagnosis of IP in negative patients was 13% (Supplementary Figure S3D).
3.4.2 IP vs. benign lesions
Benign lesions, including sinusitis and nasal polyps, share similar clinical symptoms with IP and thus require distinction. There were three studies on the differential diagnosis of IP and nasal polyps (11, 16, 17), with the sensitivity and specificity ranges of (0.7140~0.9060) and (0.8160~0.8970), respectively. In one study, the sensitivity and specificity of differential diagnosis of IP and sinusitis (12) ranged from 0.9212 to 0.9548 and 0.8899 to 0.9097, respectively.
3.5 Clinical features that play an important role in the machine learning process
Three studies (7, 14, 25) constructed machine learning models based on clinical features for the differential diagnosis of IP and malignant tumors. The sensitivity and specificity were (0.5858~0.8790) and (0.4660~0.8001), respectively. Therefore, the role of clinical features should be considered in the development of machine learning models in the future.
4 Discussion
It has been found that the differential diagnosis of IP and malignancy relying on radiomics alone does not yield the best results. Therefore, we recommend integrating clinical features to improve the effectiveness of machine learning in IP differential diagnosis.
Imaging methods (such as CT or MRI) the first choice for the IP diagnosis (26, 27). In particular, there have been limited attempts to explore the diagnostic accuracy of CT or MRI for IP. Li Z et al. (28) investigated the diagnostic performance of dynamic contrast-enhanced MRI-derived parameters in distinguishing IP from squamous cell carcinoma. The AUC of the combination of the volume of extravascular extracellular space and rate constant was 0.831, with a specificity of 83% and sensitivity of 76.5%. However, effective preoperative diagnosis of IP remained a challenge. Radiomics methods can help determine the extent of tumors. This study evaluated the diagnostic performance of radiomics-based models in distinguishing IP from malignant tumors and benign lesions, which can not only improve the accuracy of diagnosis but also help increase the probability of complete surgical resection of tumors (20). Our analysis showed that the radiomics-based models showed high sensitivity [0.84 (95%CI: 0.77-0.89)] and specificity [0.82 (95% CI: 0.74 ~ 0.88)] in the validation set. This highlighted the importance of expanding the application of radiomics in the differential diagnosis of IP.
While our study focused on radiomics, we could not ignore the differences in clinical variables between IP and malignancy, such as age, smoking, and alcohol dependence. For instance, Hong SL et al. (29) discovered a correlation between smoking and malignant transformation in IP patients.
We found that there may be a high degree of bias in the modeling process. First, the number of cases in the modeling process should exceed 20, however, only a few included studies meet this condition, which may lead to overfitting of the constructed models. Second, model validation is required. At present, common clinical validation methods can be divided into internal validation and external validation. Internal verification is established according to the specific distribution trend of the data, mainly using random sampling. Random sampling can’t change the data distribution to some extent; Therefore, it does not explain the universality of this model. Only one study used prospective external validation and the remaining studies used random sampling. Third, there was a lack of consideration of overfitting in the included literature. Fourth, variable screening methods were different. Fifth, the selection of the model was predominantly based on logistic regression. While logistic regression is valuable in clinical applications with strong interpretability, there are limitations related to its application in radiomics.
Furthermore, another aspect that should be considered in the implementation of radiomics is the ignorance of variations in equipment, both across different manufacturers and different parameters within the same manufacturer. This oversight failed to address the potential effects of equipment over-configuration. This limitation highlights that radiomics is still in the theoretical stage and it is difficult to implement. It is important to formulate standardized research guidelines for future research and promote the development of radiomics according to the research guidelines.
For the first time, we explored the use of AI to distinguish IP from benign lesions and malignant tumors, and confirmed the feasibility of this approach. However, there are some limitations. First, due to the limited number of included studies, we did not specifically discuss different machine learning types under the same modeling variables. The predictive performance of various machine learning methods varies greatly. Future research should consider comparing the diagnostic performance of different machine learning methods for IP and developing intelligent assessment tools using the best performing machine learning methods. Secondly, the validation set is mainly generated by random sampling, and an independent external validation data set is lacking. Therefore, the results of the validation set need to be further verified.
5 Conclusions
Artificial intelligence methods can greatly improve the diagnosis of IP and reduce the misdiagnosis rate, thereby providing favorable support for clinical work, such as the formulation of surgical plans, frequency of postoperative re-examination, and the assessment of prognosis. Furthermore, artificial intelligence methods can be used to accurately identify the extent of a tumor, thus greatly increasing the probability of complete surgical resection and reducing the risk of recurrence. However, due to the small number of included studies, more prospective studies are needed to validate and develop universal radiomics-based diagnostic tools.
Data availability statement
The original contributions presented in the study are included in the article/Supplementary Material. Further inquiries can be directed to the corresponding authors.
Author contributions
XQ: Conceptualization, Investigation, Methodology, Supervision, Writing – original draft, Writing – review & editing. JS: Data curation, Formal Analysis, Validation, Writing – original draft, Writing – review & editing. XZ: Methodology, Project administration, Resources, Writing – original draft, Writing – review & editing. YZ: Methodology, Validation, Visualization, Writing – original draft, Writing – review & editing. XL: Data curation, Investigation, Validation, Writing – original draft, Writing – review & editing. LW: Conceptualization, Data curation, Formal Analysis, Investigation, Methodology, Resources, Writing – original draft, Writing – review & editing.
Funding
The author(s) declare that no financial support was received for the research, and/or publication of this article.
Conflict of interest
The authors declare that the research was conducted in the absence of any commercial or financial relationships that could be construed as a potential conflict of interest.
Generative AI statement
The author(s) declare that no Generative AI was used in the creation of this manuscript.
Any alternative text (alt text) provided alongside figures in this article has been generated by Frontiers with the support of artificial intelligence and reasonable efforts have been made to ensure accuracy, including review by the authors wherever possible. If you identify any issues, please contact us.
Publisher’s note
All claims expressed in this article are solely those of the authors and do not necessarily represent those of their affiliated organizations, or those of the publisher, the editors and the reviewers. Any product that may be evaluated in this article, or claim that may be made by its manufacturer, is not guaranteed or endorsed by the publisher.
Supplementary material
The Supplementary Material for this article can be found online at: https://www.frontiersin.org/articles/10.3389/fonc.2025.1628999/full#supplementary-material
Supplementary Table 1 | Literature search strategy.
References
1. Lisan Q, Laccourreye O, and Bonfils P. Sinonasal inverted papilloma: From diagnosis to treatment. Eur Ann Otorhinolaryngol Head Neck Dis. (2016) 133:337–41. doi: 10.1016/j.anorl.2016.03.006
2. Eide JG, Welch KC, Adappa ND, Palmer JN, and Tong CCL. Sinonasal inverted papilloma and squamous cell carcinoma: contemporary management and patient outcomes. Cancers. (2022) 14. doi: 10.3390/cancers14092195
3. Lambin P, Leijenaar RTH, Deist TM, Peerlings J, de Jong EEC, van Timmeren J, et al. Radiomics: the bridge between medical imaging and personalized medicine. Nat Rev Clin Oncol. (2017) 14:749–62. doi: 10.1038/nrclinonc.2017.141
4. Gillies RJ, Kinahan PE, and Hricak H. Radiomics: images are more than pictures, they are data. Radiology. (2016) 278:563–77. doi: 10.1148/radiol.2015151169
5. Whiting PF, Rutjes AW, Westwood ME, Mallett S, Deeks JJ, Reitsma JB, et al. QUADAS-2: a revised tool for the quality assessment of diagnostic accuracy studies. Ann Intern Med. (2011) 155:529–36. doi: 10.7326/0003-4819-155-8-201110180-00009
6. Zills G, Datta T, and Malmi-Kakkada AN. Enhanced mechanical heterogeneity of cell collectives due to temporal fluctuations in cell elasticity. Phys Rev E. (2023) 107:014401. doi: 10.1103/PhysRevE.107.014401
7. Park MJ, Cho W, Kim JH, Chung YS, Jang YJ, and Yu MS. Preoperative prediction of sinonasal inverted papilloma-associated squamous cell carcinoma (IP-SCC). Laryngoscope. (2023) 133:2502–10. doi: 10.1002/lary.30583
8. Zhang D, Zhang J, Zhou J, Xu J, Guo Y, Zhang Z, et al. Predictive value of magnetic resonance imaging multi-parametric analysis for Malignant transformation of sinonasal inverted papilloma: A comprehensive prediction model. Curr Med Imaging. (2023) 19:596–604. doi: 10.2174/1573405618666220928091936
9. Yan Y, Liu Y, Tao J, Li Z, Qu X, Guo J, et al. Preoperative prediction of Malignant transformation of sinonasal inverted papilloma using MR radiomics. Front Oncol. (2022) 12:870544. doi: 10.3389/fonc.2022.870544
10. Liu GS, Yang A, Kim D, Hojel A, Voevodsky D, Wang J, et al. Deep learning classification of inverted papilloma Malignant transformation using 3D convolutional neural networks and magnetic resonance imaging. Int Forum Allergy Rhinol. (2022) 12:1025–33. doi: 10.1002/alr.22958
11. Li X, Zhao H, Ren T, Tian Y, Yan A, and Li W. Inverted papilloma and nasal polyp classification using a deep convolutional network integrated with an attention mechanism. Comput Biol Med. (2022) 149:105976. doi: 10.1016/j.compbiomed.2022.105976
12. Zhang Z, Yu L, Jiang J, Wang L, Zhou S, Hao D, et al. Development and validation of a clinical prediction model to diagnose sinonasal inverted papilloma based on computed tomography features and clinical characteristics. Ear Nose Throat J. (2022) 1455613221134421. doi: 10.1177/01455613221134421
13. Gu J, Yu Q, Li Q, Peng J, Lv F, Gong B, et al. MRI radiomics-based machine learning model integrated with clinic-radiological features for preoperative differentiation of sinonasal inverted papilloma and Malignant sinonasal tumors. Front Oncol. (2022) 12:1003639. doi: 10.3389/fonc.2022.1003639
14. Zhang H, Wang H, Hao D, Ge Y, Wan G, Zhang J, et al. An MRI-based radiomic nomogram for discrimination between Malignant and benign sinonasal tumors. J Magnetic Resonance Imaging: JMRI. (2021) 53:141–51. doi: 10.1002/jmri.27298
15. Suh CH, Lee JH, Chung MS, Xu XQ, Sung YS, Chung SR, et al. MRI predictors of Malignant transformation in patients with inverted papilloma: A decision tree analysis using conventional imaging features and histogram analysis of apparent diffusion coefficients. Korean J Radiol. (2021) 22:751–8. doi: 10.3348/kjr.2020.0576
16. Ren T, Li X, Tian Y, and Li W. Deep learning framework for preoperative recognition of inverted papilloma and nasal polyp. IEEE Access. (2021) 9:120502–11. doi: 10.1109/ACCESS.2021.3099687
17. Girdler B, Moon H, Bae MR, Ryu SS, Bae J, and Yu MS. Feasibility of a deep learning-based algorithm for automated detection and classification of nasal polyps and inverted papillomas on nasal endoscopic images. Int Forum Allergy Rhinol. (2021) 11:1637–46. doi: 10.1002/alr.22854
18. Bi SC, Zhang H, Wang HX, Ge YQ, Zhang P, Wang ZC, et al. Radiomics nomograms based on multi-parametric MRI for preoperative differential diagnosis of Malignant and benign sinonasal tumors: A two-centre study. Front Oncol. (2021) 11:659905. doi: 10.3389/fonc.2021.659905
19. Zhang L, Fang G, Yu W, Yang B, Wang C, and Zhang L. Prediction of Malignant sinonasal inverted papilloma transformation by preoperative computed tomography and magnetic resonance imaging. Rhinology. (2020) 58:248–56. doi: 10.4193/Rhin19.240
20. Guo M, Zang X, Fu W, Yan H, Bao X, Li T, et al. Classification of nasal polyps and inverted papillomas using CT-based radiomics. Insights Imaging. (2023) 14:188. doi: 10.1186/s13244-023-01536-0
21. Yui R, Takahashi M, Noda K, Yoshida K, Sakurai R, Ohira S, et al. Preoperative prediction of sinonasal papilloma by artificial intelligence using nasal video endoscopy: a retrospective study. Sci Rep. (2023) 13:12439. doi: 10.1038/s41598-023-38913-0
22. Ren Y, Fang G, Wang K, Yan B, and Wang C. The diagnostic value of image-enhanced endoscopy system in sinonasal inverted papilloma. Eur Arch Otorhinolaryngol. (2024) 281:4221–30. doi: 10.1007/s00405-024-08707-9
23. Ramkumar S, Ranjbar S, Ning S, Lal D, Zwart CM, Wood CP, et al. MRI-based texture analysis to differentiate sinonasal squamous cell carcinoma from inverted papilloma. AJNR Am J Neuroradiol. (2017) 38:1019–25. doi: 10.3174/ajnr.A5106
24. Qi M, Xia Z, Zhang F, Sha Y, and Ren J. Development and validation of apparent diffusion coefficient histogram-based nomogram for predicting Malignant transformation of sinonasal inverted papilloma. Dentomaxillofac Radiol. (2023) 52:20220301. doi: 10.1259/dmfr.20220301
25. Stoeter P and Ebeling U. The value of CT in the diagnosis of traumatic fronto-basal CSF fistulae (author’s transl). Rofo. (1982) 136:295–301. doi: 10.1055/s-2008-1056049
26. Karkos PD, Khoo LC, Leong SC, Lewis-Jones H, and Swift AC. Computed tomography and/or magnetic resonance imaging for pre-operative planning for inverted nasal papilloma: review of evidence. J Laryngol Otol. (2009) 123:705–9. doi: 10.1017/S0022215109004575
27. Yan CH, Tong CCL, Penta M, Patel VS, Palmer JN, Adappa ND, et al. Imaging predictors for Malignant transformation of inverted papilloma. Laryngoscope. (2019) 129:777–82. doi: 10.1002/lary.27582
28. Li Z, Xian M, Guo J, Wang CS, Zhang L, and Xian J. Dynamic contrast-enhanced MRI can quantitatively identify Malignant transformation of sinonasal inverted papilloma. Br J Radiol. (2022) 95:20211374. doi: 10.1259/bjr.20211374
Keywords: machine learning, meta-analysis, radiomics, sinonasal inverted papilloma, systematic review
Citation: Qin X, Shi J, Zhao X, Zhang Y, Liu X and Wang L (2025) Identifying sinonasal inverted papilloma by machine learning: a systematic review and meta-analysis. Front. Oncol. 15:1628999. doi: 10.3389/fonc.2025.1628999
Received: 15 May 2025; Accepted: 11 August 2025;
Published: 26 August 2025.
Edited by:
Emma Gangemi, Hospital Physiotherapy Institutes (IRCCS), ItalyReviewed by:
Tao Huang, University of California, San Diego, United StatesEmanuela Ruberto, Ospedale Cardinale Panico, Italy
Copyright © 2025 Qin, Shi, Zhao, Zhang, Liu and Wang. This is an open-access article distributed under the terms of the Creative Commons Attribution License (CC BY). The use, distribution or reproduction in other forums is permitted, provided the original author(s) and the copyright owner(s) are credited and that the original publication in this journal is cited, in accordance with accepted academic practice. No use, distribution or reproduction is permitted which does not comply with these terms.
*Correspondence: Xueyan Liu, bGl1eHVleWFuMTAwMkAxMjYuY29t; Li Wang, d2VsbGFuZGdvb2RAMTI2LmNvbQ==
†These authors have contributed equally to this work and share first authorship
 Xianfei Qin1,2†
 Yu Zhang
 Li Wang