 Yuhao Liu
 Jinting Li2†
 Mengzhu Lv
- 1Key Laboratory of Carcinogenesis and Translational Research (Ministry of Education), Department of Radiation Oncology, Peking University Cancer Hospital and Institute, Beijing, China
- 2Key Laboratory of Carcinogenesis and Translational Research (Ministry of Education), Laboratory of Molecular Oncology, Peking University Cancer Hospital and Institute, Beijing, China
A Corrigendum on
Rewired glycolysis by DTL accelerates oncometabolite L-lactate generation to promote breast cancer progression
by Liu Y, Li J, Cao Y and Lv M (2025) Front. Oncol. 15:1583752. doi: 10.3389/fonc.2025.1583752
In the published article, there was an error in Figure 6C as published. We regrettably discovered an inadvertent duplication of loading control bands (β-actin and GAPDH for CAL-51 cell line) between Figures 5A and Figure 6C during figure reorganization. We wish to emphasize that the duplicated controls originated from concurrent experiments — both Figures 5A and 6C datasets were generated during the same experimental batch, though logically separated into two figures to enhance manuscript readability. The corrected Figure 6C and its caption “Western blot analysis for the expression of stemness-associated genes in MDA-MB-231 and CAL-51 cells after DTL knockdown” appear below.
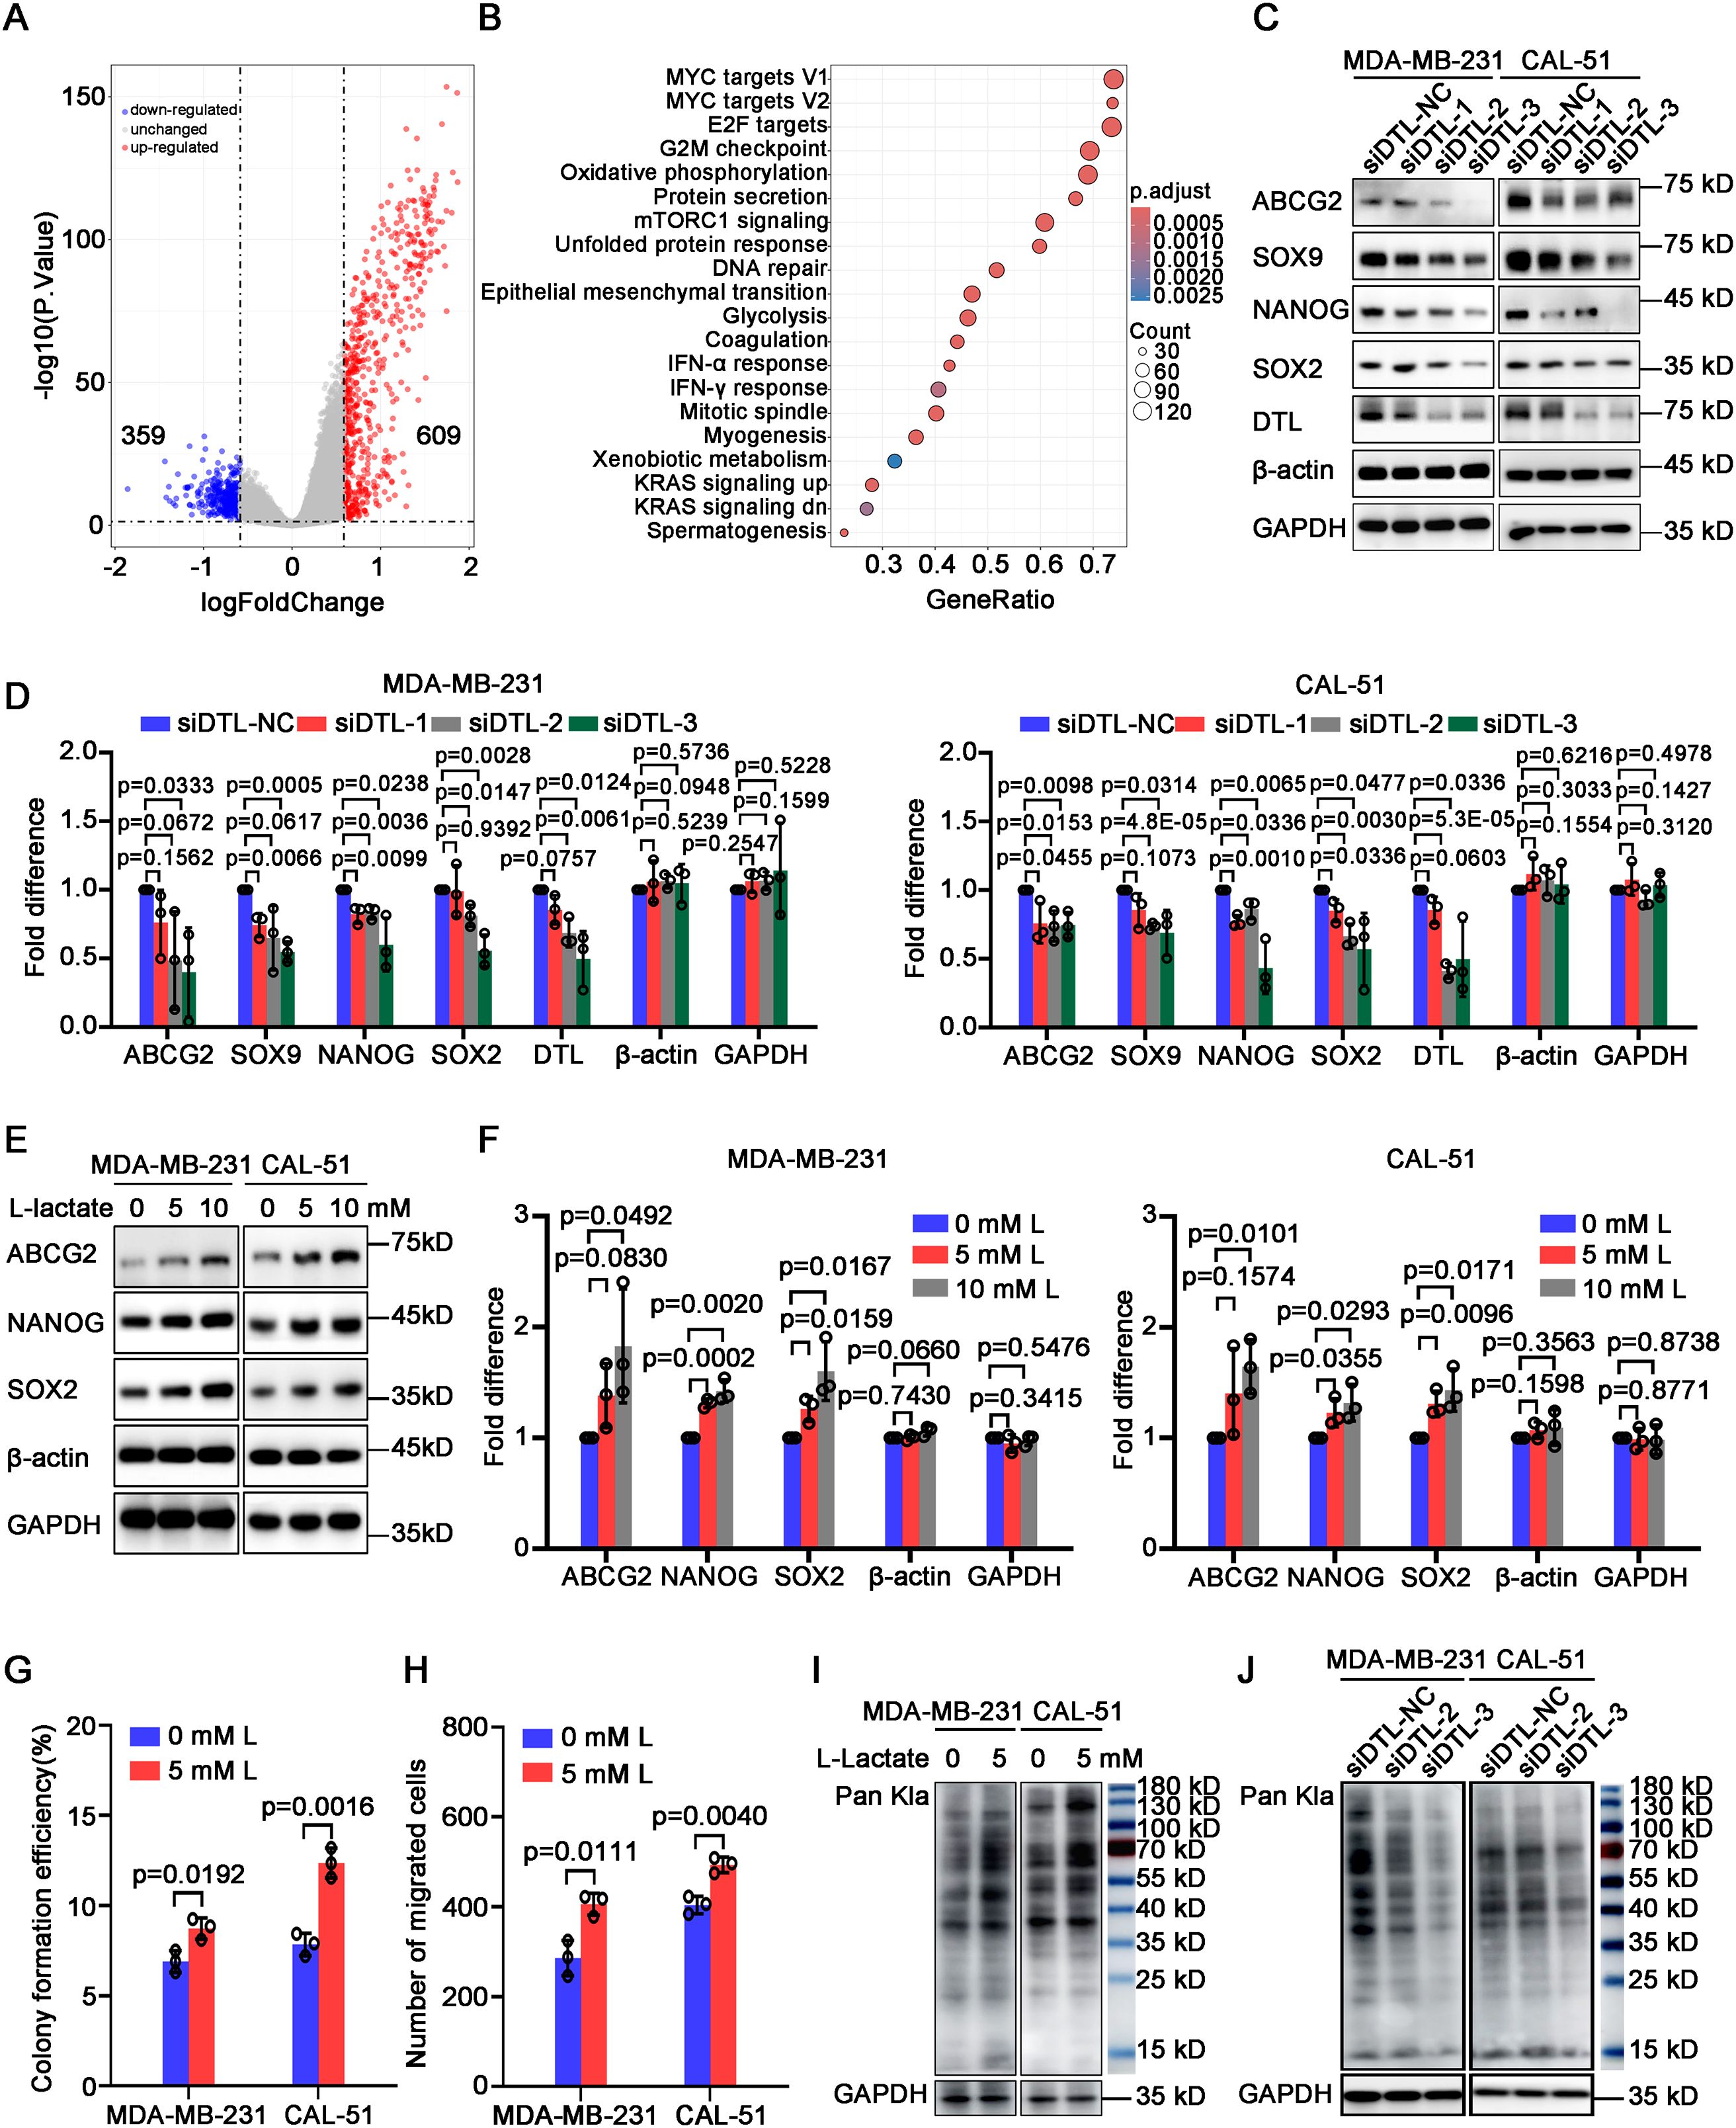
Figure 6. L-lactate supports cell proliferation and migration of breast cancer depending on DTL. (A) Volcano plot showing differentially expressed genes in breast cancer patients with low and high DTL expression. (B) Dot plot indicating the alternative signal pathways of KEGG enrichment analysis. (C) Western blot analysis for the expression of stemness-associated genes in MDA-MB-231 and CAL-51 cells after DTL knockdown. (D) Histogram showing the expression of indicated molecules after DTL knockdown in MDA-MB-231 and CAL-51 cells. (E) Immunoblotting analysis for the expression of stemness-related indicators in MDA-MB-231 and CAL-51 cells treated with different concentrations of L-lactate. (F) Histogram showing the levels of indicated molecules in MDA-MB-231 and CAL-51 cells treated with 5 mM L-lactate. (G) Histogram indicating the colony-forming efficiency of MDA-MB-231 and CAL-51 cells with 5 mM L-lactate treatment. (H) Histogram displaying the number of migrated breast cancer cells treated with 5 mM L-lactate. (I) Western blot analysis indicating the total L-lactylated levels of lysine in MDA-MB-231 and CAL-51 cells treated with 5 mM L-lactate. (J) Western blot analysis for the total L-lactylated levels of lysine in MDA-MB-231 and CAL-51 cells after DTL knockdown. Data in D, F, G and H were presented as mean ± S.D (n = 3). Two-tailed Student’s t-test.
The authors apologize for this error and state that this does not change the scientific conclusions of the article in any way. The original article has been updated.
Publisher’s note
All claims expressed in this article are solely those of the authors and do not necessarily represent those of their affiliated organizations, or those of the publisher, the editors and the reviewers. Any product that may be evaluated in this article, or claim that may be made by its manufacturer, is not guaranteed or endorsed by the publisher.
Keywords: DTL, glycolysis, L-lactate, breast cancer, progression
Citation: Liu Y, Li J, Cao Y and Lv M (2025) Corrigendum: Rewired glycolysis by DTL accelerates oncometabolite L-lactate generation to promote breast cancer progression. Front. Oncol. 15:1630154. doi: 10.3389/fonc.2025.1630154
Received: 16 May 2025; Accepted: 10 June 2025;
Published: 27 June 2025.
Edited and reviewed by:
Juan Carlos Gallardo-Pérez, National Institute of Cardiology Ignacio Chavez, MexicoCopyright © 2025 Liu, Li, Cao and Lv. This is an open-access article distributed under the terms of the Creative Commons Attribution License (CC BY). The use, distribution or reproduction in other forums is permitted, provided the original author(s) and the copyright owner(s) are credited and that the original publication in this journal is cited, in accordance with accepted academic practice. No use, distribution or reproduction is permitted which does not comply with these terms.
*Correspondence: Yiren Cao, Y2FveWlyZW4zMTVAMTYzLmNvbQ==; Mengzhu Lv, TWVuZ3podUx2QGJqbXUuZWR1LmNu
†These authors have contributed equally to this work