 Jinyu Zheng
 Xiaoyi Xu1†
 Jie Yang
- 1Department of Cardiothoracic Surgery, Affiliated Jinhua Hospital, Zhejiang University School of Medicine, Jinhua, China
- 2Department of Clinical Laboratory, Affiliated Jinhua Hospital, Zhejiang University School of Medicine, Jinhua, China
Introduction: Lung adenocarcinoma is a leading subtype of lung cancer with high rates of recurrence and metastasis. Identifying novel prognostic biomarkers is essential for improving patient outcomes.
Methods: Transcriptomic and clinicopathological data from TCGA (55 tumor samples and 38 normal samples) were used to construct a prognostic model, with 30 samples for internal validation. An external validation cohort (10 tumor-normal pairs) was obtained from the First Affiliated Hospital of Wenzhou Medical University. Differentially expressed genes and immune-related genes from the IMMPORT database were integrated using WGCNA. Three machine learning algorithms—Random Forest, LASSO, and SVM-RFE—were applied to identify key hub genes. A multivariate Cox regression model was built to predict survival. Model performance was assessed by time-dependent ROC and ANN models. Immune infiltration was analyzed using TIMER and ssGSEA, with consensus clustering performed to explore immune subtypes. Protein expression and biological functions of hub genes were validated using the HPA database and GSEA.
Results: A total of 1,822 DEGs were identified, with 68 immune-related genes significantly associated with LUAD prognosis. Four hub genes—CBLC, GDF10, LTBP4, and FABP4—were selected to construct the prognostic model, which showed strong predictive performance in both ROC and ANN analyses. Immune profiling revealed elevated CD4⁺ T cells, macrophages, and dendritic cells in LUAD. Consensus clustering identified two immune subtypes with distinct prognoses and immune landscapes.
Discussion: This study established a robust immune-related prognostic model for LUAD and identified key biomarkers associated with immune infiltration and survival. These findings offer valuable insights for personalized diagnosis and treatment strategies in LUAD.
1 Introduction
Lung cancer remains the leading cause of cancer deaths (1, 2), with lung adenocarcinoma (LUAD) accounting for about 40% of cases and a poor five-year survival rate of 12%-15% (3). Early diagnosis is critical, but current methods often fail to predict recurrence or metastasis effectively. Therefore, identifying reliable prognostic biomarkers is urgently needed (4).
Immune-related genes (IRGs) have shown strong prognostic value in several cancers, but their role in LUAD remains underexplored, limiting immunotherapy advances. Discovering new IRGs could refine LUAD treatment and enhance personalized care.
Weighted Gene Co-expression Network Analysis (WGCNA) is a powerful tool that identifies gene modules related to clinical traits, uncovering disease mechanisms and novel biomarkers (5–8). Widely applied across fields, it enhances understanding beyond single-gene analyses.
Meanwhile, machine learning, including algorithms like Random Forest (RF), Least absolute shrinkage and selection operato (LASSO), Support vector machine - recursive feature elimination (SVM-RFE), and Artificial Neural Networks (ANN), has revolutionized biomarker discovery and prognosis modeling, offering precise insights from complex data (9).
In this study, we combined WGCNA and machine learning to analyze TCGA LUAD data, identifying four key immune genes linked to overall survival. We constructed an immune prognostic model, explored their clinical correlations and immune infiltration mechanisms, providing a new basis for LUAD diagnosis, treatment, and prognosis improvement.
2 Materials and methods
2.1 Research process
The detailed research workflow is illustrated in Figure 1.
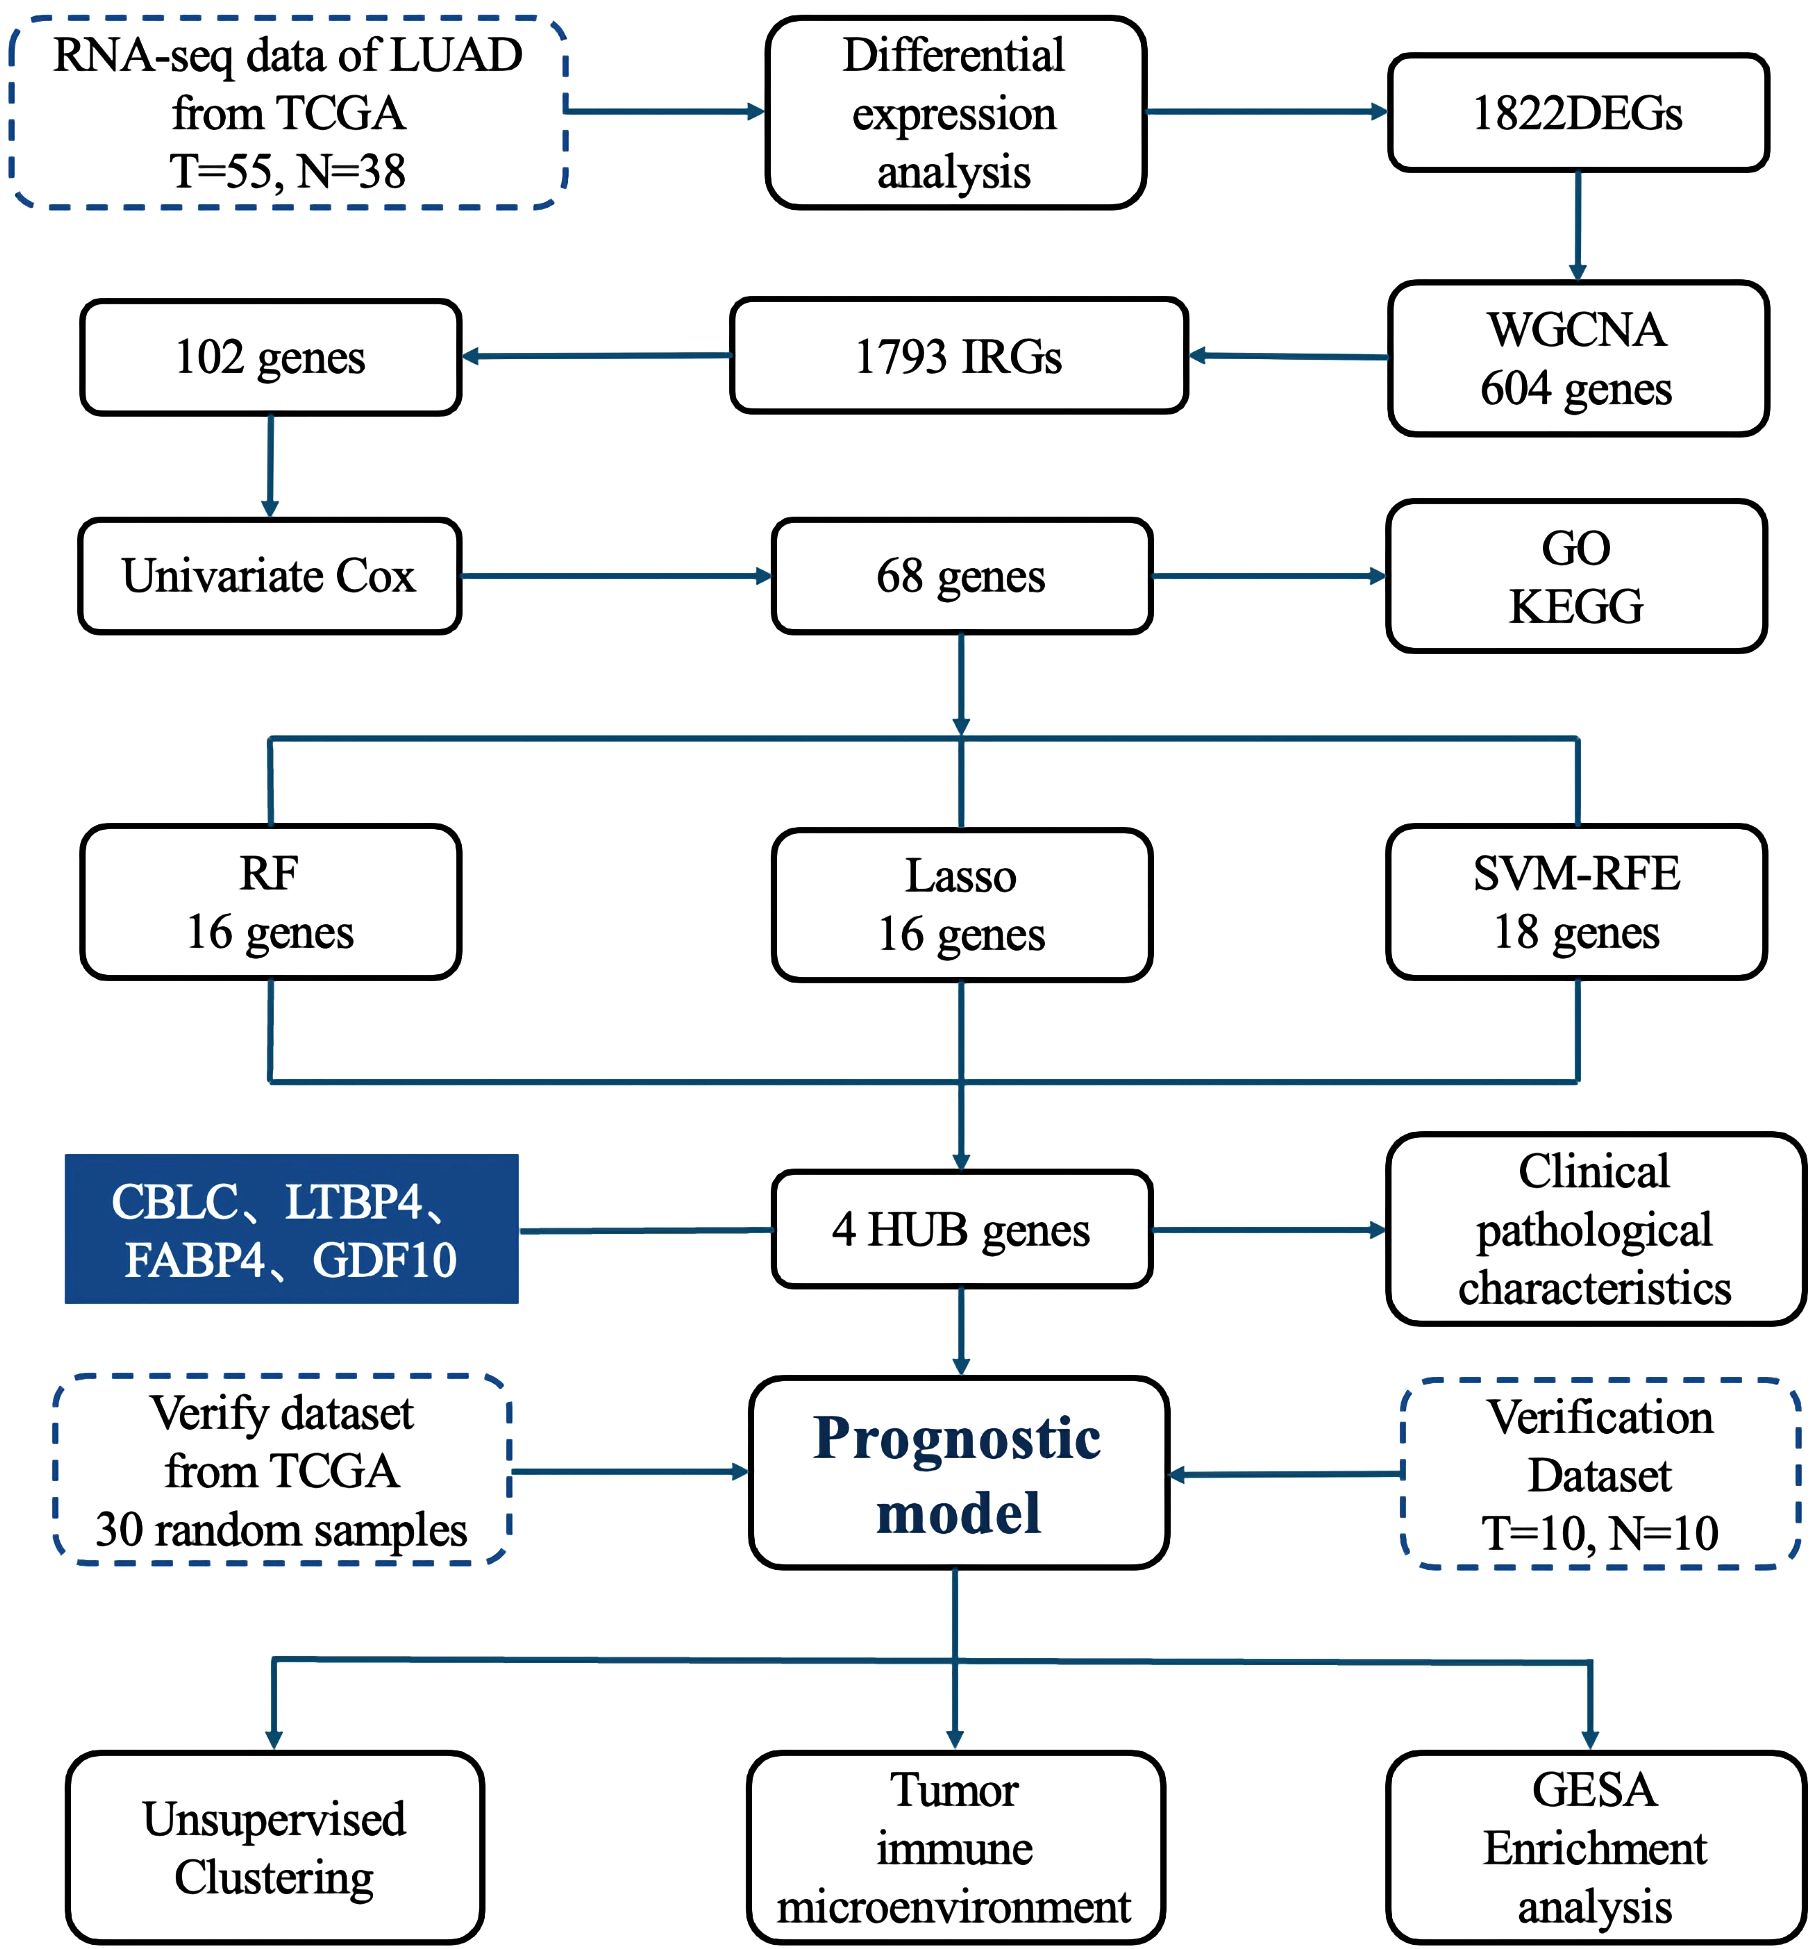
Figure 1. Research process.
2.2 Data acquisition and processing
Gene expression data for LUAD were obtained from The Cancer Genome Atlas (TCGA) database (https://portal.gdc.cancer.gov/) using the R software package “TCGAbiolinks”.
Clinical data were directly acquired from TCGA, comprising 535 LUAD patients and 59 healthy controls. After rigorous quality control and preprocessing, which included removal of duplicate and incomplete records, we established our training set with 55 LUAD patients and 38 healthy controls. Concurrently, we constructed a TCGA validation set by randomly selecting 30 samples with complete grouping information and unbiased gene expression profiles, excluding those used in the training set.
2.3 Clinical sample acquisition
From January 2020 to April 2022, we prospectively collected medical records and tissue specimens from 10 patients undergoing surgical resection for primary LUAD at the First Affiliated Hospital of Wenzhou Medical University. These 10 LUAD specimens and their matched adjacent normal tissues (n = 10) were subsequently processed for gene sequencing analysis, serving as an independent external validation cohort. This study protocol was approved by the Institutional Review Board of the First Affiliated Hospital of Wenzhou Medical University (Approval No. YS2023-706).
2.4 RNA preparation and sequencing protocol
Paired-end sequencing (150 bp) was conducted on the Illumina NovaSeq platform (Illumina, California, USA) following standard protocols. Raw sequencing data were processed on the BMK Cloud bioinformatics platform (https://www.biocloud.net) for downstream analysis.
2.5 Differential expression gene analysis
In the R software environment, the “limma” package was used to normalize and annotate probe data from a training set of LUAD patients (55 cases) and control population (38 cases) in public databases. Differential gene expression analysis was performed to identify differentially expressed genes (DEGs) between the lung cancer group and the control group. To visualize the expression patterns of these DEGs, hierarchical clustering was conducted using the heatmap package, while the ggplot2 package was employed to generate volcano plots, providing an intuitive representation of gene expression differences.
2.6 Construction of gene co-expression networks
To elucidate the interactions among genes in LUAD, we employed WGCNA on expression profile data from the TCGA training set. Data integrity was assessed using the “Good Samples Genes” function to ensure robust downstream analysis.
2.7 Immune-related gene screening
Following the removal of duplicate entries, IRGs were retrieved from the Immunology Database and Analysis Portal (ImmPort, https://www.immport.org), yielding a total of 1,793 unique genes (10). These genes were subsequently cross-referenced with those identified through gene clustering analysis using Venn diagrams, enabling the precise selection of immune-related genes.
2.8 Cox analysis related to prognosis
To investigate the association between DEGs and patient overall survival, univariable Cox regression analysis was performed. Hazard ratios (HRs) were calculated to classify genes as either protective (HR < 1) or risk factors (HR > 1) for prognosis. For visual representation of the results, a volcano plot was generated to illustrate the statistical significance and risk ratios of DEGs. Additionally, a forest plot was employed to display detailed univariable Cox regression results, including HR values and their 95% confidence intervals (CIs).
2.9 GO enrichment analysis and KEGG pathway analysis
Gene Ontology (GO) term (https://www.geneontology.org/) and Kyoto Encyclopedia of Genes and Genomes (KEGG) pathway (https://www.genome.jp/kegg/) enrichment analyses were conducted using the R package “cluster Profiler” (11).
2.10 Machine learning
In this study, we adopted three distinct machine learning algorithms—LASSO, SVM-RFE, and RF—to screen out HUB genes from specific modules. By independently applying these three algorithms and intersecting their selected genes, we identified robust diagnostic biomarkers.
2.11 Gene expression difference analysis
To evaluate the differential expression of HUB genes between tumor and normal tissues, we generated box plots using the “ggplot2” package. Statistical significance was assessed using Student’s t-tests. To ensure the robustness of our results, we further validated these findings in an independent external dataset.
2.12 Single-gene diagnostic ROC analysis
For the key genes identified during screening and validation, we utilized RNA-Seq data from LUAD, and adjacent non-tumor tissues obtained from the TCGA database. To assess the diagnostic potential of individual genes, we performed logistic regression analysis, treating gene expression levels as the independent variable and LUAD status (tumor vs. non-tumor) as the dependent variable. The diagnostic performance of each gene was quantified by calculating the area under the receiver operating characteristic (ROC) curve (AUC).
2.13 Gene expression correlation analysis
We employed Pearson correlation analysis to examine pairwise relationships between key genes, followed by visualization using heatmaps. This approach enables the identification of co-expression patterns and potential functional interactions among genes, providing insights into their regulatory networks.
2.14 Analysis of clinical and pathological features
To investigate the potential associations between gene expression levels and clinicopathological characteristics, we performed chi-square tests in this study.
2.15 Development of an immune-related prognostic model
We constructed a prognosis model for lung adenocarcinoma patients using univariate and multivariate Cox regression analysis methods. First, univariate Cox regression analysis was used to identify individual variables significantly associated with patient survival time. Subsequently, multivariate Cox regression analysis further evaluated the independent effects of these variables on patient prognosis while considering other potential confounding factors. The risk score was calculated as a linear combination of gene expression levels and corresponding Cox regression coefficients. To facilitate clinical use, we created a nomogram using the “rms” package in R.
Model performance was assessed through: 1. Calibration curves to compare predicted vs. actual survival, validated on an independent dataset; 2. ROC curves via the “pROC” package, with AUC values measuring predictive accuracy across thresholds.
2.16 Construction of an artificial neural network diagnostic model
We used the “neuralnet” and “neuralnettools” packages in R to construct an ANN diagnostic model based on hub gene expression. The model architecture included an input layer (hub genes), two hidden layers (with 8 and 3 neurons, respectively), and an output layer representing “normal” and “tumor” classes, with softmax activation. To avoid overfitting, we applied 10-fold cross-validation and used gene weight information during training.
Model performance was assessed using accuracy, precision, recall, F1-score, and AUC in both the training and validation sets. ROC curves were also used to evaluate the discriminative ability of both individual hub genes and the ANN model across the TCGA training set, internal validation set, and external cohort. ROC analysis assessed diagnostic accuracy, with AUC values reflecting its classification ability.
2.17 Consensus clustering analysis
To identify potential molecular subgroups in LUAD samples, we applied the ConsensusClusterPlus algorithm (12), which determines the optimal number of clusters (k) by resampling the dataset and evaluating clustering stability.
To validate the robustness of the classification, we used two high-dimensional visualization techniques: UMAP and t-SNE. Additionally, Kaplan-Meier survival analysis was performed to assess the prognostic relevance of the identified subgroups by comparing survival curves across groups.
2.18 Analysis of immune cell infiltration
To assess immune infiltration patterns in LUAD, we leveraged the TIMER database (https://cistrome.shinyapps.io/timer) (13). Here, we utilized TIMER to examine correlations between the expression of four candidate genes (CBLC, GDF10, LTBP4, and FABP4) and Tumor immune infiltrating cells (TII Cs) populations, providing insights into their potential immunomodulatory roles in LUAD.
For a more comprehensive evaluation of the tumor immune microenvironment, we applied single-sample gene set enrichment analysis (ssGSEA) (14). Using the GSVA and GSEA Base R packages, we quantified immune infiltration levels in each LUAD sample based on 28 immune-related gene sets curated from the TISIDB (http://cis.hku.hk/TISIDB/) database.
2.19 Gene Set Enrichment Analysis
To investigate the transcriptomic characteristics of LUAD tumor samples and identify key biological pathways potentially involved in disease pathogenesis, we performed Gene Set Enrichment Analysis (GSEA). Pathways with a nominal P-value (NOM P) < 0.05 and a false discovery rate (FDR Q-value) < 0.05 were considered statistically significant.
2.20 Immunohistochemical staining
The Human Protein Atlas (HPA; https://www.proteinatlas.org/) is a comprehensive online repository that maps the expression and localization of human proteins across various cells, tissues, and organs using diverse biological techniques. We analyzed the immunohistochemical (IHC) staining patterns of selected hub genes in normal lung tissue and lung cancer specimens using data and analytical tools available on the Human Protein Atlas platform.
2.21 Statistical analysis
Significant differences between groups were assessed using the log-rank test and univariate COX regression analysis, with P-values and HR with 95% CI calculated. Multivariate COX regression analysis and stratified analysis were performed to evaluate the independence of the risk score model. The performance of gene prognostic signatures was assessed using ROC curves, with the area under the curve (AUC) as the metric. Statistical significance was defined as P < 0.05. All statistical analyses were conducted using R language version 4.3.0.
3 Results
3.1 Patient information
The original mRNA expression data for LUAD were obtained from TCGA database, comprising 535 LUAD tumor samples and 59 matched adjacent normal tissue samples. Following quality control and data filtering, our final study cohort consisted of 55 LUAD samples as the experimental group and 38 adjacent normal tissue samples as controls. The complete clinical characteristics of the 55 LUAD cases are summarized in Table 1.
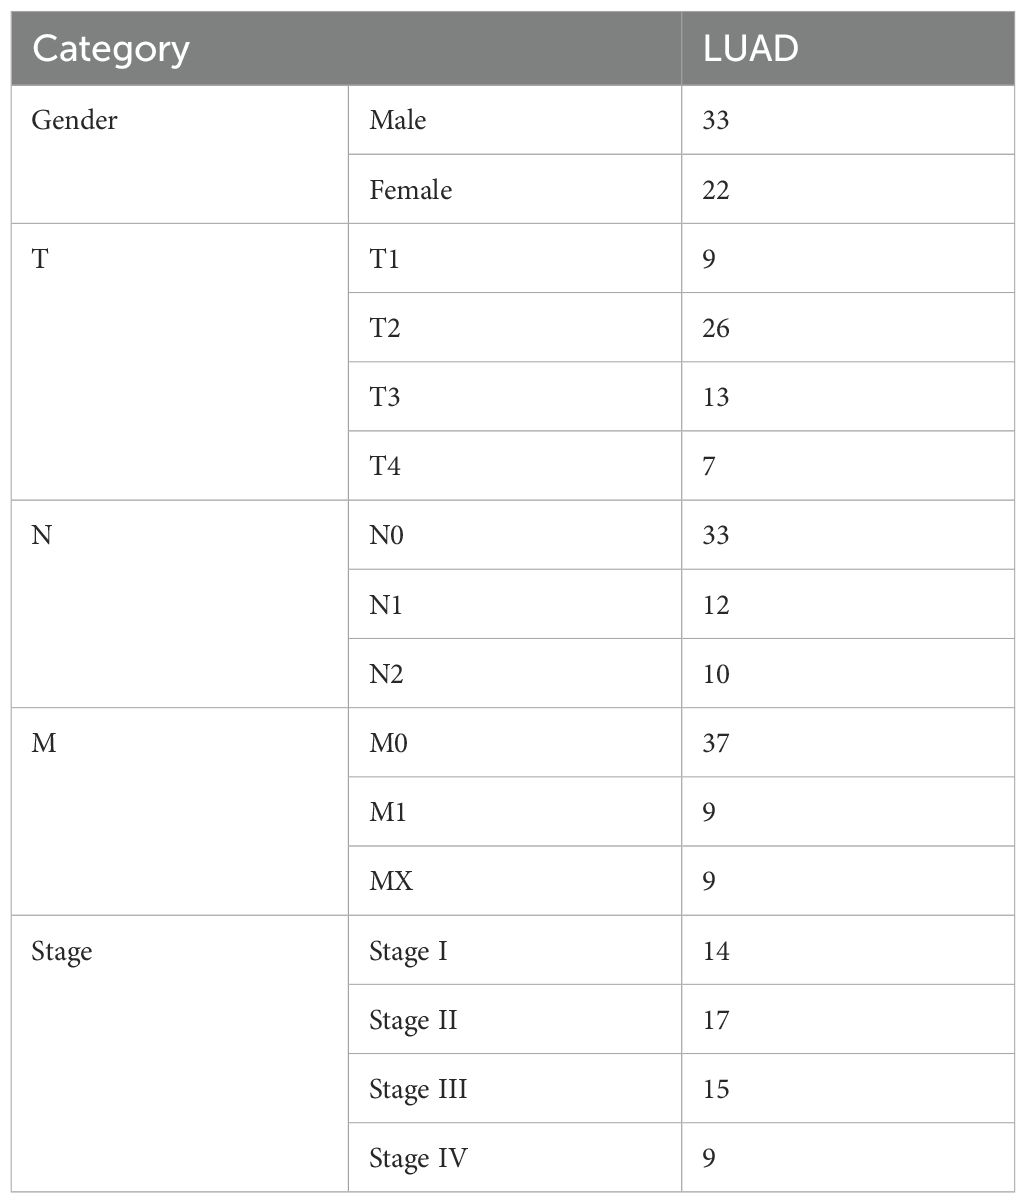
Table 1. Patient clinical characteristics table.
3.2 Differential analysis
There is a significant difference between the tumor group and the control group. Differential analysis identified a total of 1822 DEGs (log2FC > 2, P < 0.001), including 719 downregulated genes and 1103 upregulated genes. These differences are intuitively displayed in the volcano plot (Figure 2A) and heat map (Figure 2B).
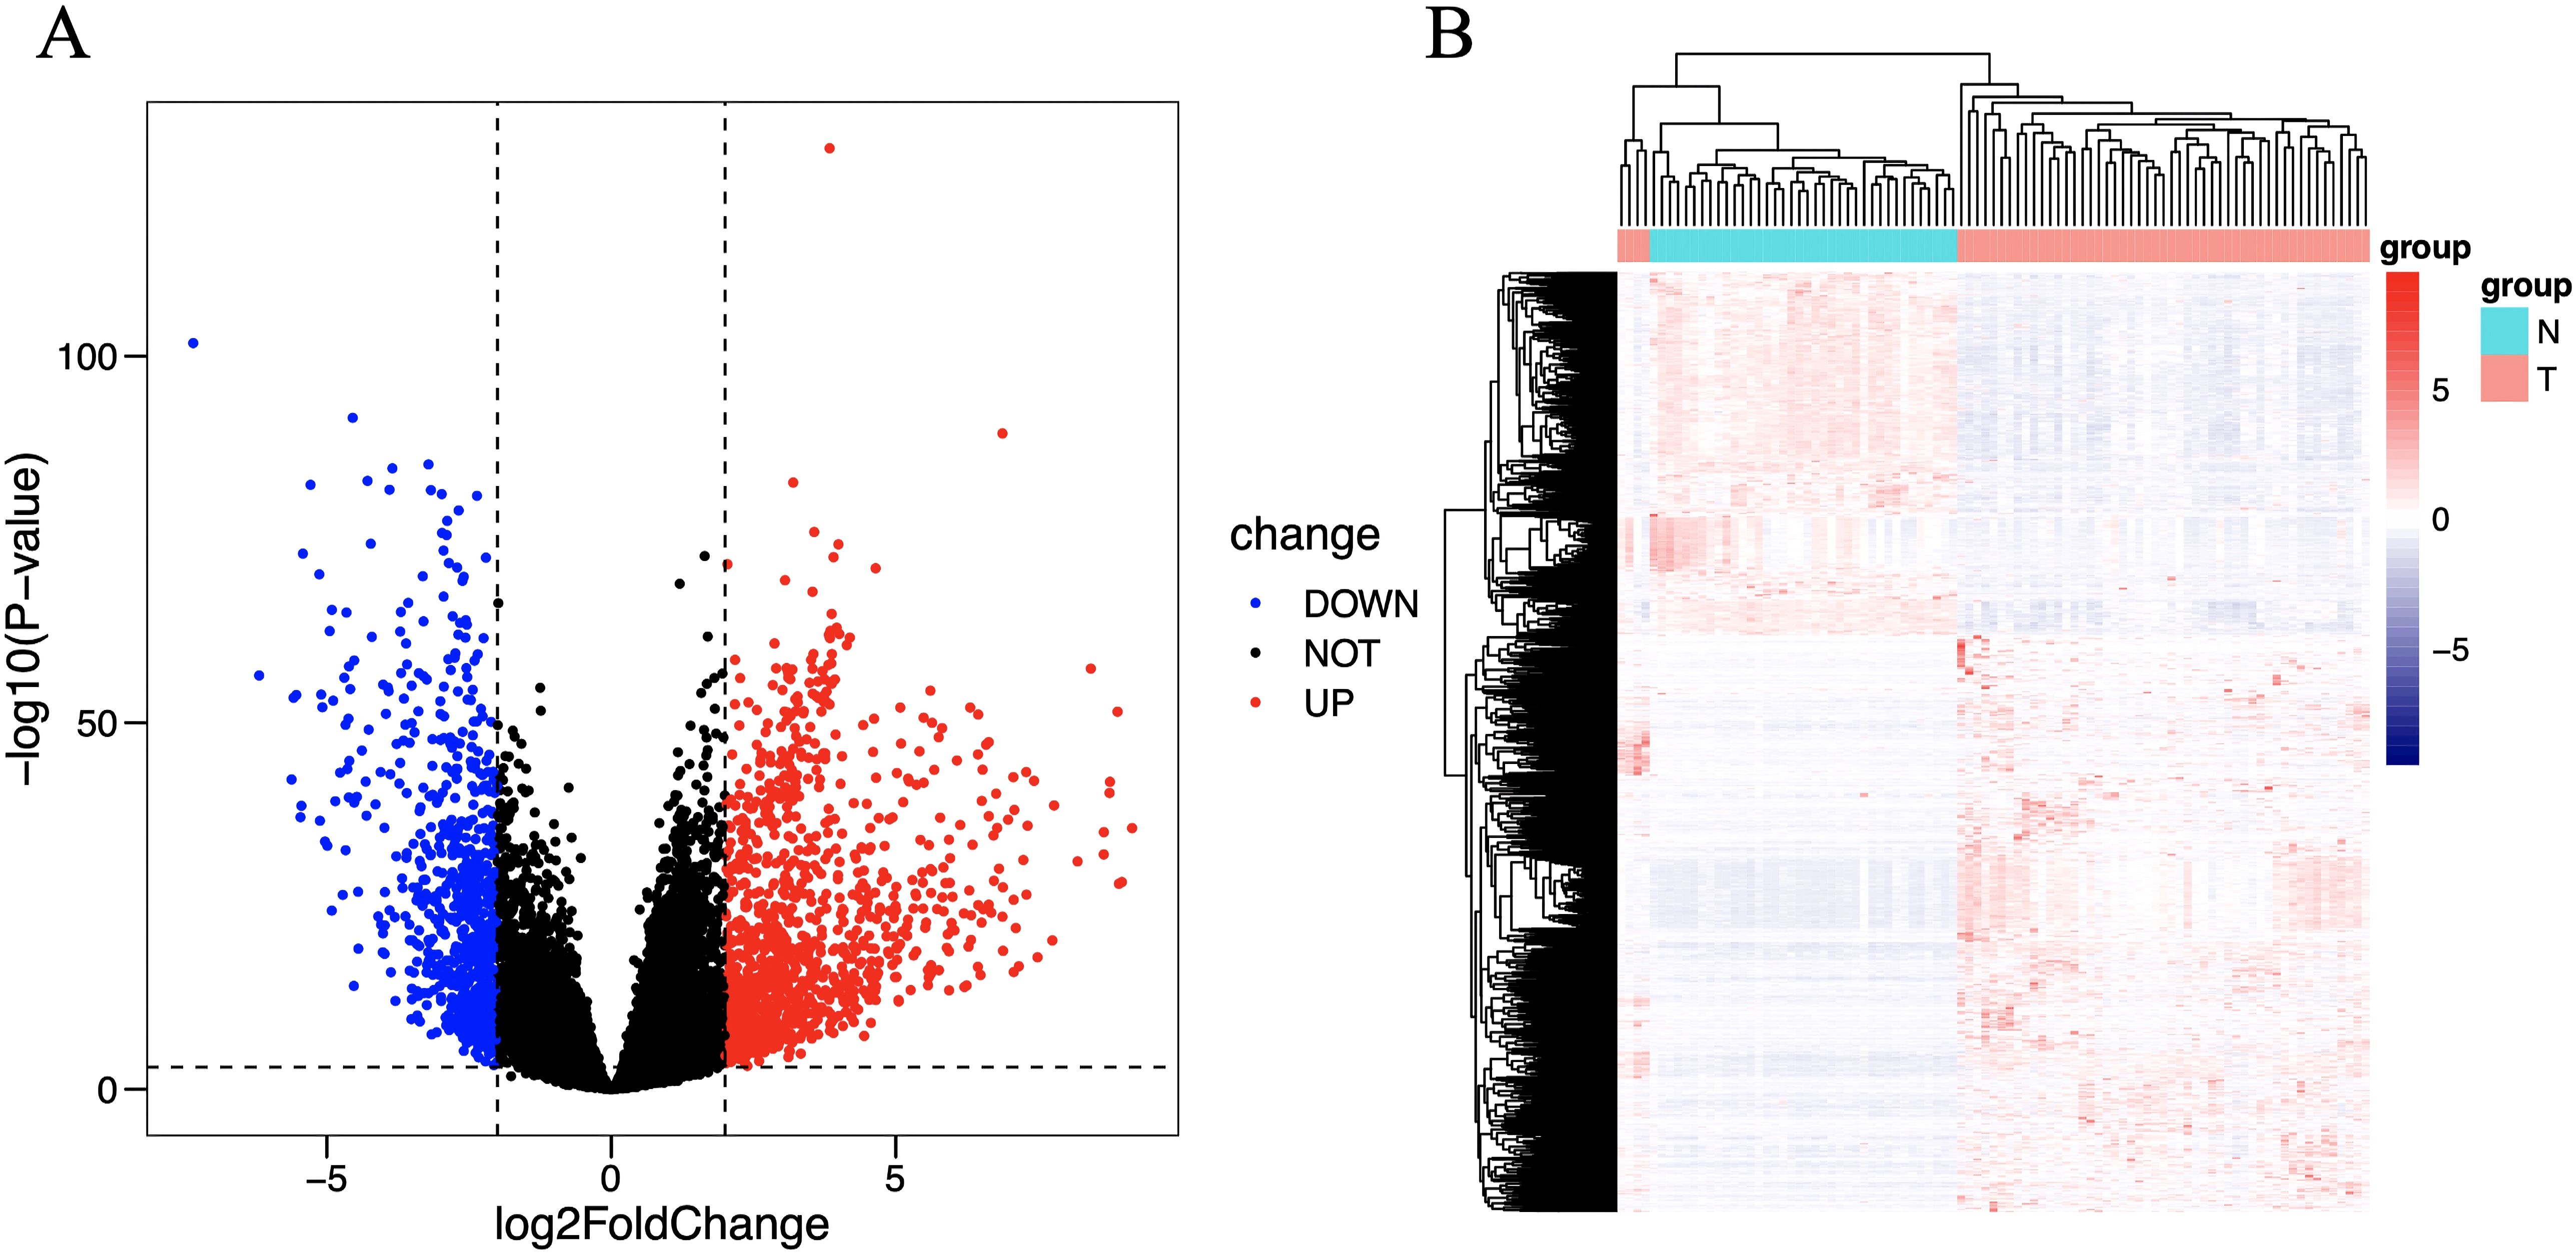
Figure 2. Volcano plot (A) and heat map (B) of differentially expressed immune genes. The horizontal axis of the heat map represents the samples: the blue area represents normal tissue, and the red area represents tumor tissue; the vertical axis represents genes. On the volcano map, the blue area represents downregulated differentially expressed genes, and the red area represents upregulated differentially expressed genes.
3.3 WGCNA
We adopted the WGCNA method to identify gene modules associated with LUAD. First, by evaluating the scale-free fit index and average connectivity under different soft thresholds, the optimal soft threshold was determined to be β=17 (Figure 3A). Subsequently, sample clustering analysis was performed (Figure 3B), a topological overlap matrix was constructed, and hierarchical clustering was applied to identify modules. By using the dynamic tree cut algorithm and merging modules with similarity greater than 0.75, a final module clustering map was obtained (Figure 3C). Then, correlation analysis between modules and clinical features was conducted, and a heatmap was drawn to show the correlation coefficients and P-values (Figure 3D). A total of 4 modules were identified, among which the blue module with the highest correlation with the tumor group (r=0.96, P=4e-50) was selected, containing 604 genes.
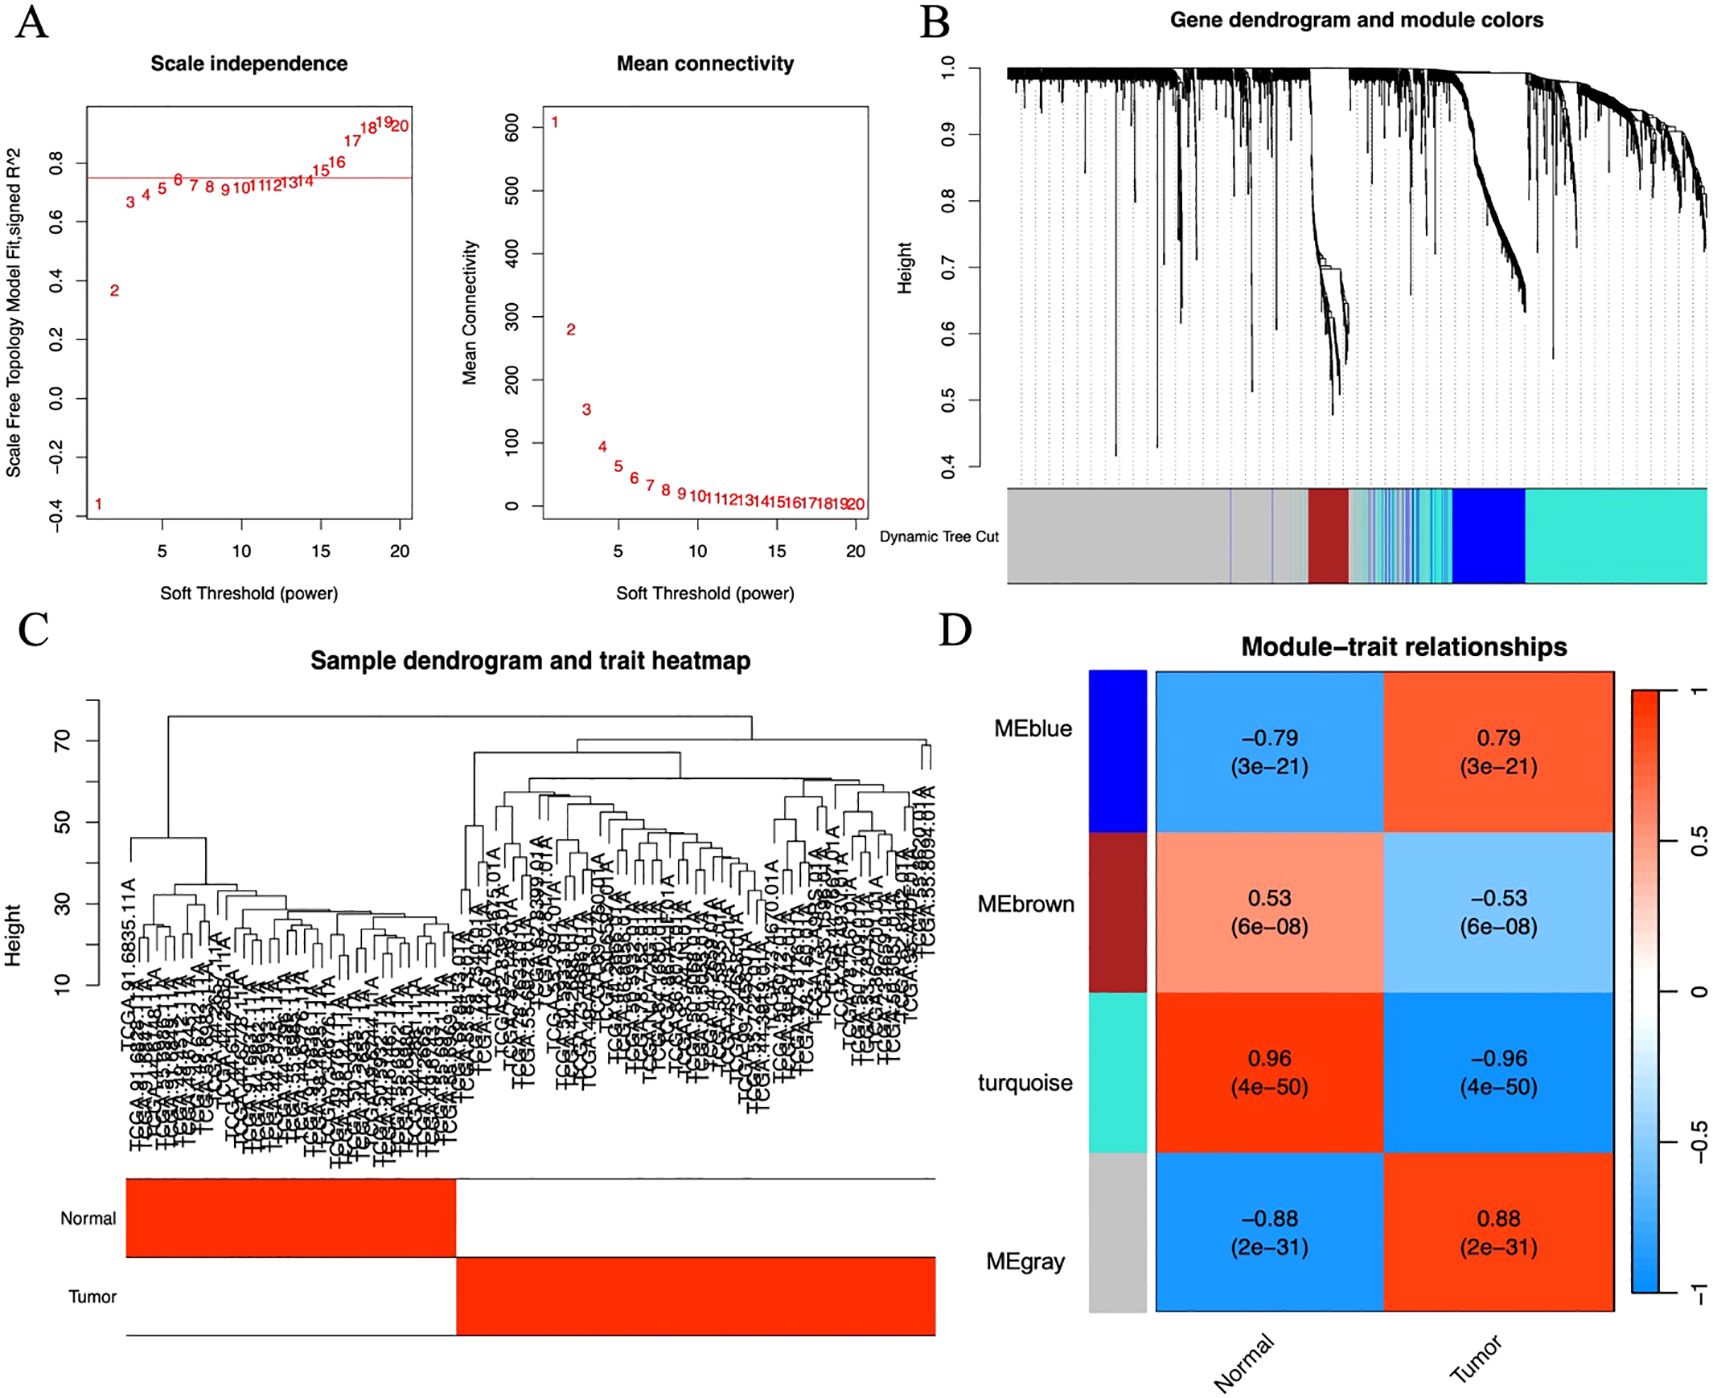
Figure 3. (A) Scatter plot of fitting index and average connectivity: The left figure shows the relationship between soft threshold (power) and fitting index, and the right figure shows the relationship between soft threshold and average connectivity. To achieve a correlation of 0.9, β=17 is selected as the optimal soft threshold. (B) Sample clustering diagram and trait heat map: Show the results of sample clustering and grouping information of tumor and normal samples, with red representing the tumor group and white representing the normal group. (C) Module clustering tree diagram: Construct a scale-free network and topological overlap matrix (TOM), and perform hierarchical clustering based on the hclust function. Set the minimum number of module genes to 100, depth split=2, and module merging threshold to 0.25 (merge when similarity > 0.75). (D) Module and clinical trait correlation heat map: The horizontal axis represents traits (tumor and control), and the vertical axis represents each module. The blue module with the highest correlation with the tumor group (Cor=0.96, P=4e-50) is selected for subsequent analysis.
3.4 Immune gene screening
A set of data consisting of 1793 IRGs was obtained from IMMPORT database (15). To further explore the immune genes associated with LUAD, we compared these immune genes with 604 genes screened by gene clustering methods. A total of 102 immune genes closely associated with LUAD were identified, and these findings were visualized in a Venn diagram (Figure 4A).
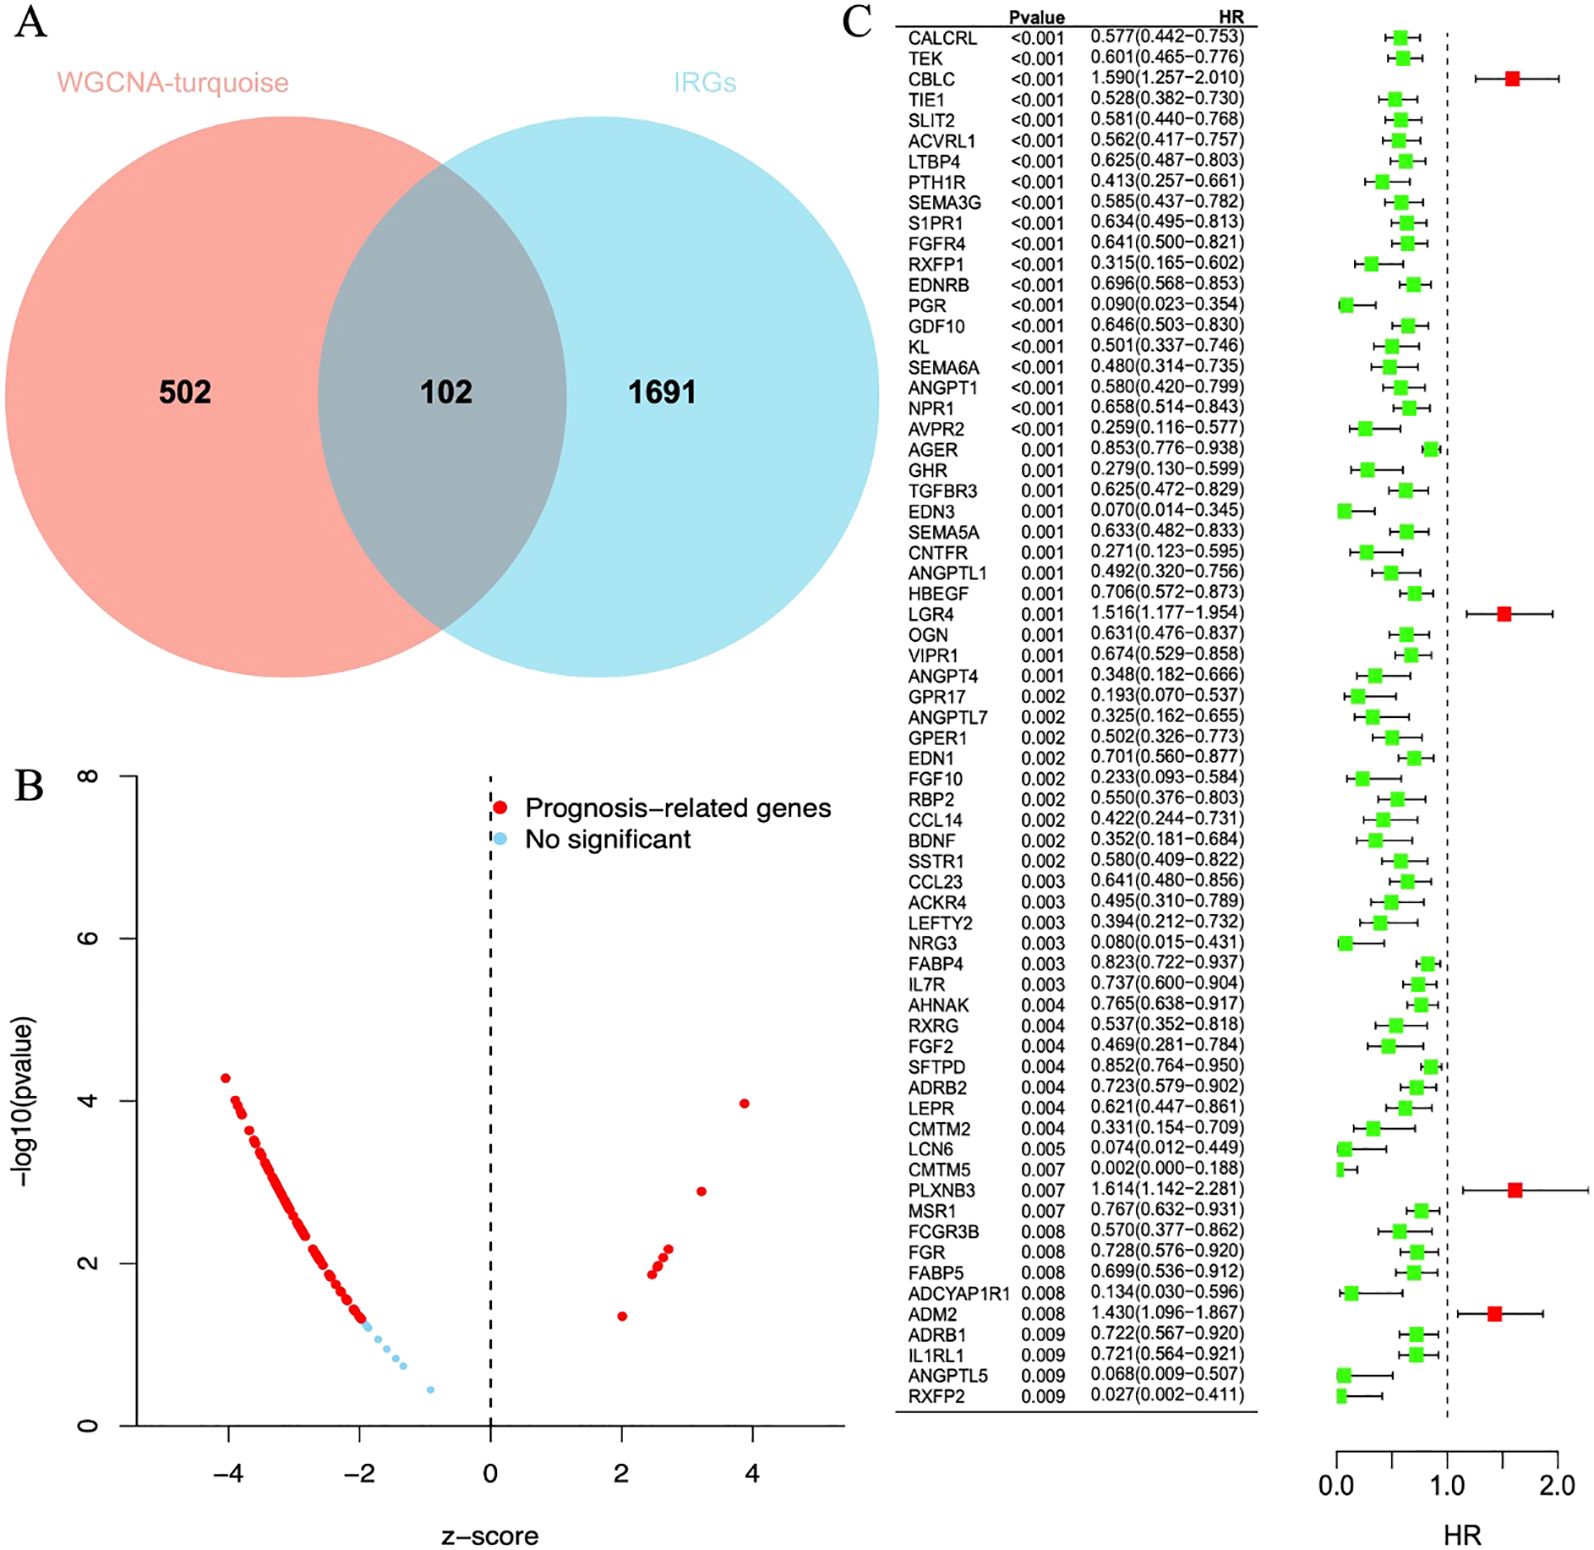
Figure 4. (A) The Venn diagram shows reliable biomarkers between WGCNA and IRGs. (B) Volcano plot of prognostic genes. Red indicates genes related to prognosis, and blue indicates genes without significant prognostic correlation. (C) Forest plot of 68 differentially expressed immune genes in a single-factor COX regression model. The brackets indicate the 95% confidence intervals. HR stands for hazard ratio, with HR < 1 displayed in green, indicating a risk factor; HR > 1 displayed in red, indicating a protective factor.
3.5 Prognostic analysis
After a one-way regression analysis of 102 differential immune genes related to LUAD, the results showed that 68 differential immune genes were significantly correlated with the overall survival rate of LUAD patients (P < 0.05) (Figures 4B,C). These significantly related differential immune genes may affect tumor progression and patient survival prognosis by affecting the immune microenvironment of LUAD.
3.6 Enrichment analysis
GO and KEGG analyses revealed the functional localization of 68 differentially expressed immune genes significantly associated with overall survival in lung adenocarcinoma. GO analysis indicated that these genes are mainly involved in signal pathway regulation (such as cell surface receptor signaling, G protein-coupled receptor pathway), cell proliferation, substance metabolism (such as protein phosphorylation), and immune inflammatory response (such as chemotaxis, MAPK cascade regulation) (Figure 5A). KEGG analysis further found that these genes are enriched in immune-related pathways (such as PI3K-Akt and Jak-STAT pathways) and tumor proliferation-related pathways (such as Ras, Rap1, and MAPK signaling pathways) (Figure 5B). These results help to better understand the role of differentially expressed immune genes in the occurrence and development of LUAD.
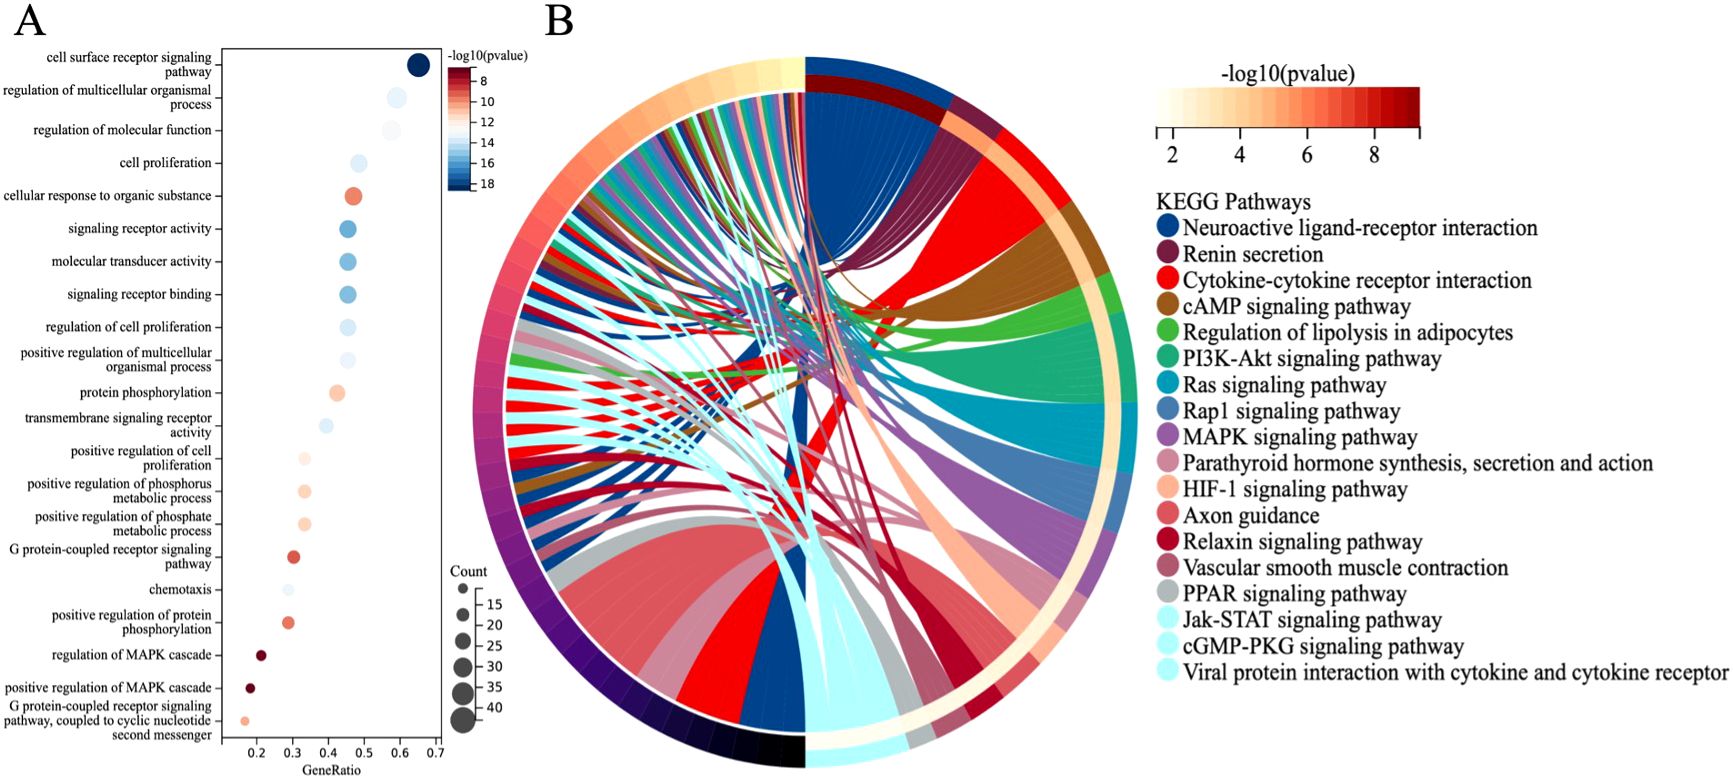
Figure 5. (A) GO enrichment analysis. (B) KEGG major pathway enrichment analysis.
3.7 Identification of diagnostic biomarkers
Machine learning identified 68 candidate genes. LASSO, SVM-RFE, and RF algorithms further narrowed them to 16, 18, and 16 genes, respectively. By overlapping the three groups, four key diagnostic biomarkers were finally identified (Figure 6). The information related to 4 genes is shown in Table 2.
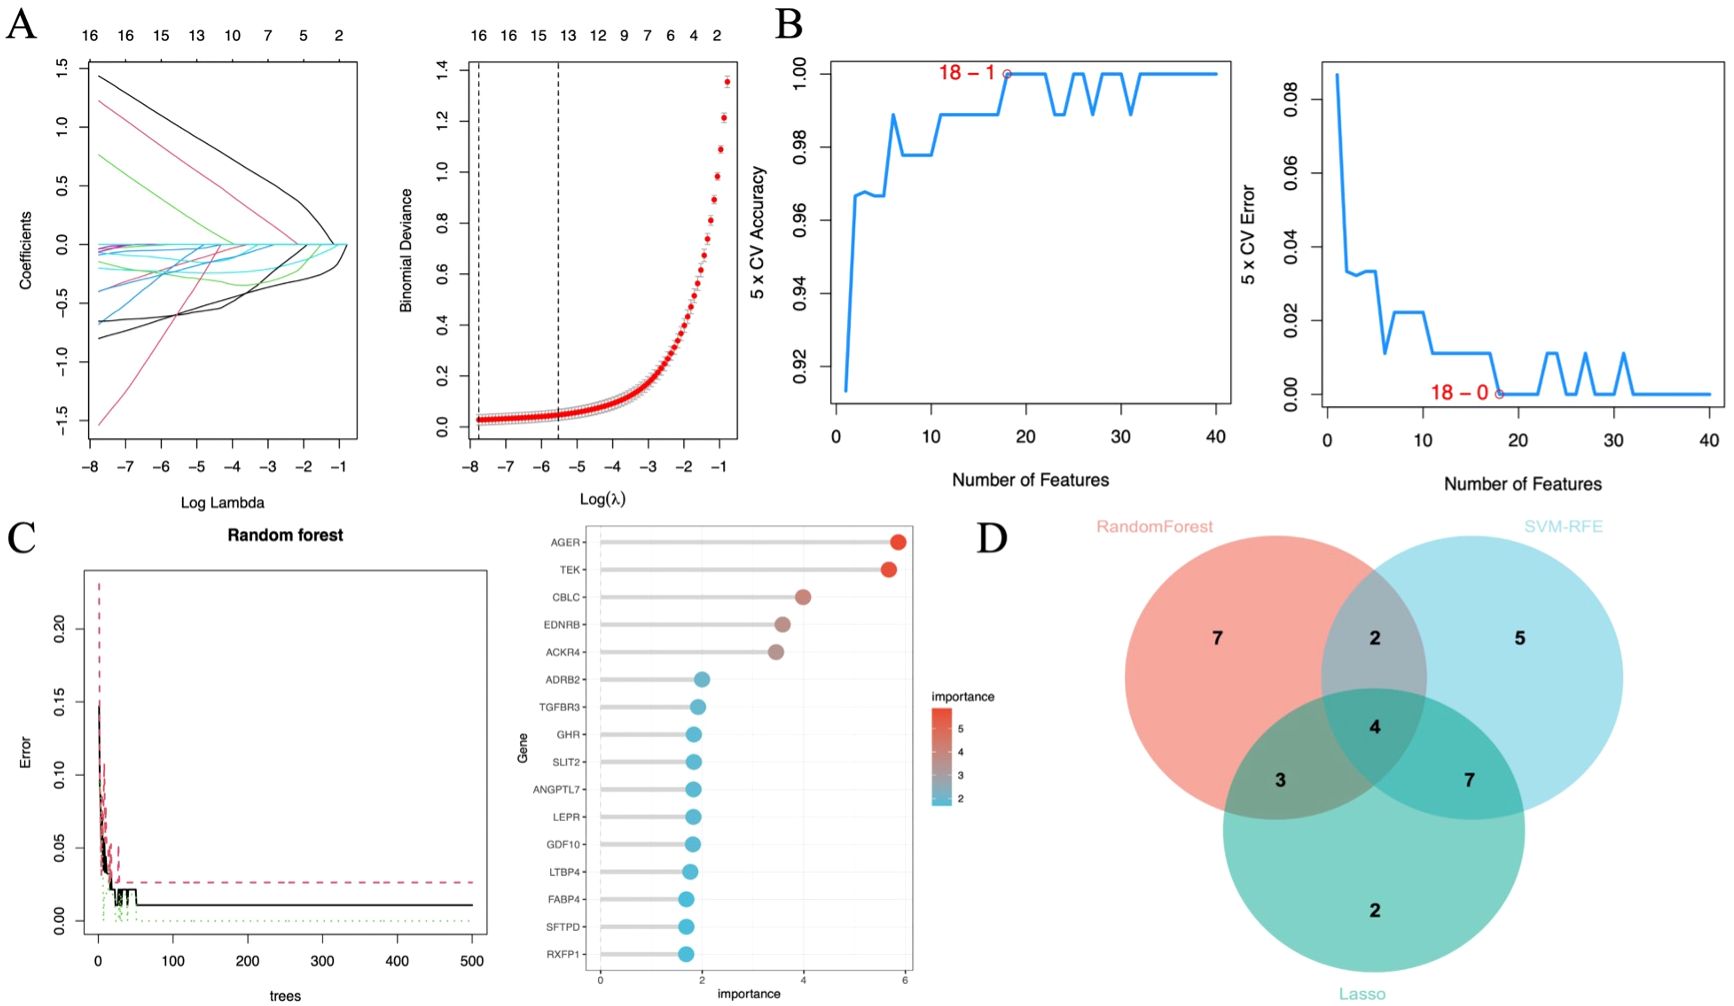
Figure 6. Diagnostic biomarker screening based on machine learning. (A) Variable selection in the LASSO model (n=3). (B) SVF-RFE algorithm screens the best biomarkers (n=6). (C) Significant features selected by the random forest algorithm (n=7). (D) Venn diagram of overlapping genes in the three algorithms.
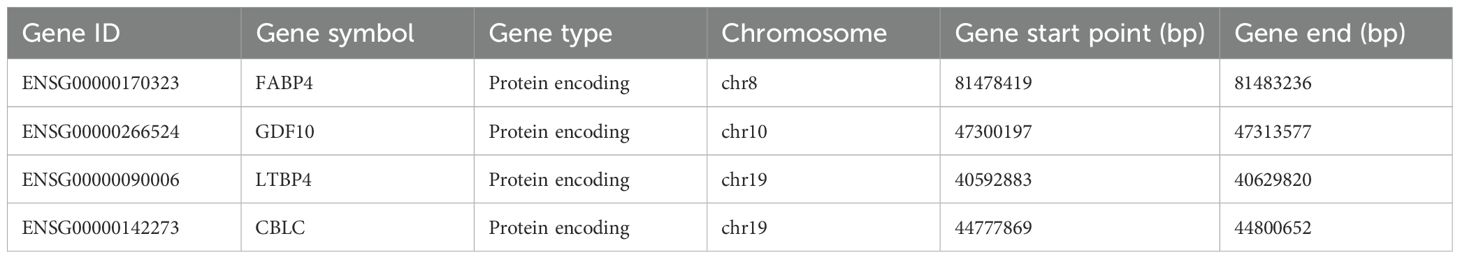
Table 2. Overall information of the 4 genes constructing prognostic features.
3.8 Diagnostic biomarker verification
In lung cancer research, by comparing the lung cancer samples in the TCGA cohort with the normal control group, it was found that the expression level of CBLC genes was significantly increased, while the expression levels of the three genes FABP4, GDF10, and LTBP4 were significantly decreased (Figure 7A). This result was validated in an independent externally sequencing sample cohort (Figure 7B), showing gene expression patterns consistent with the TCGA cohort, enhancing the reliability and universality of this finding.
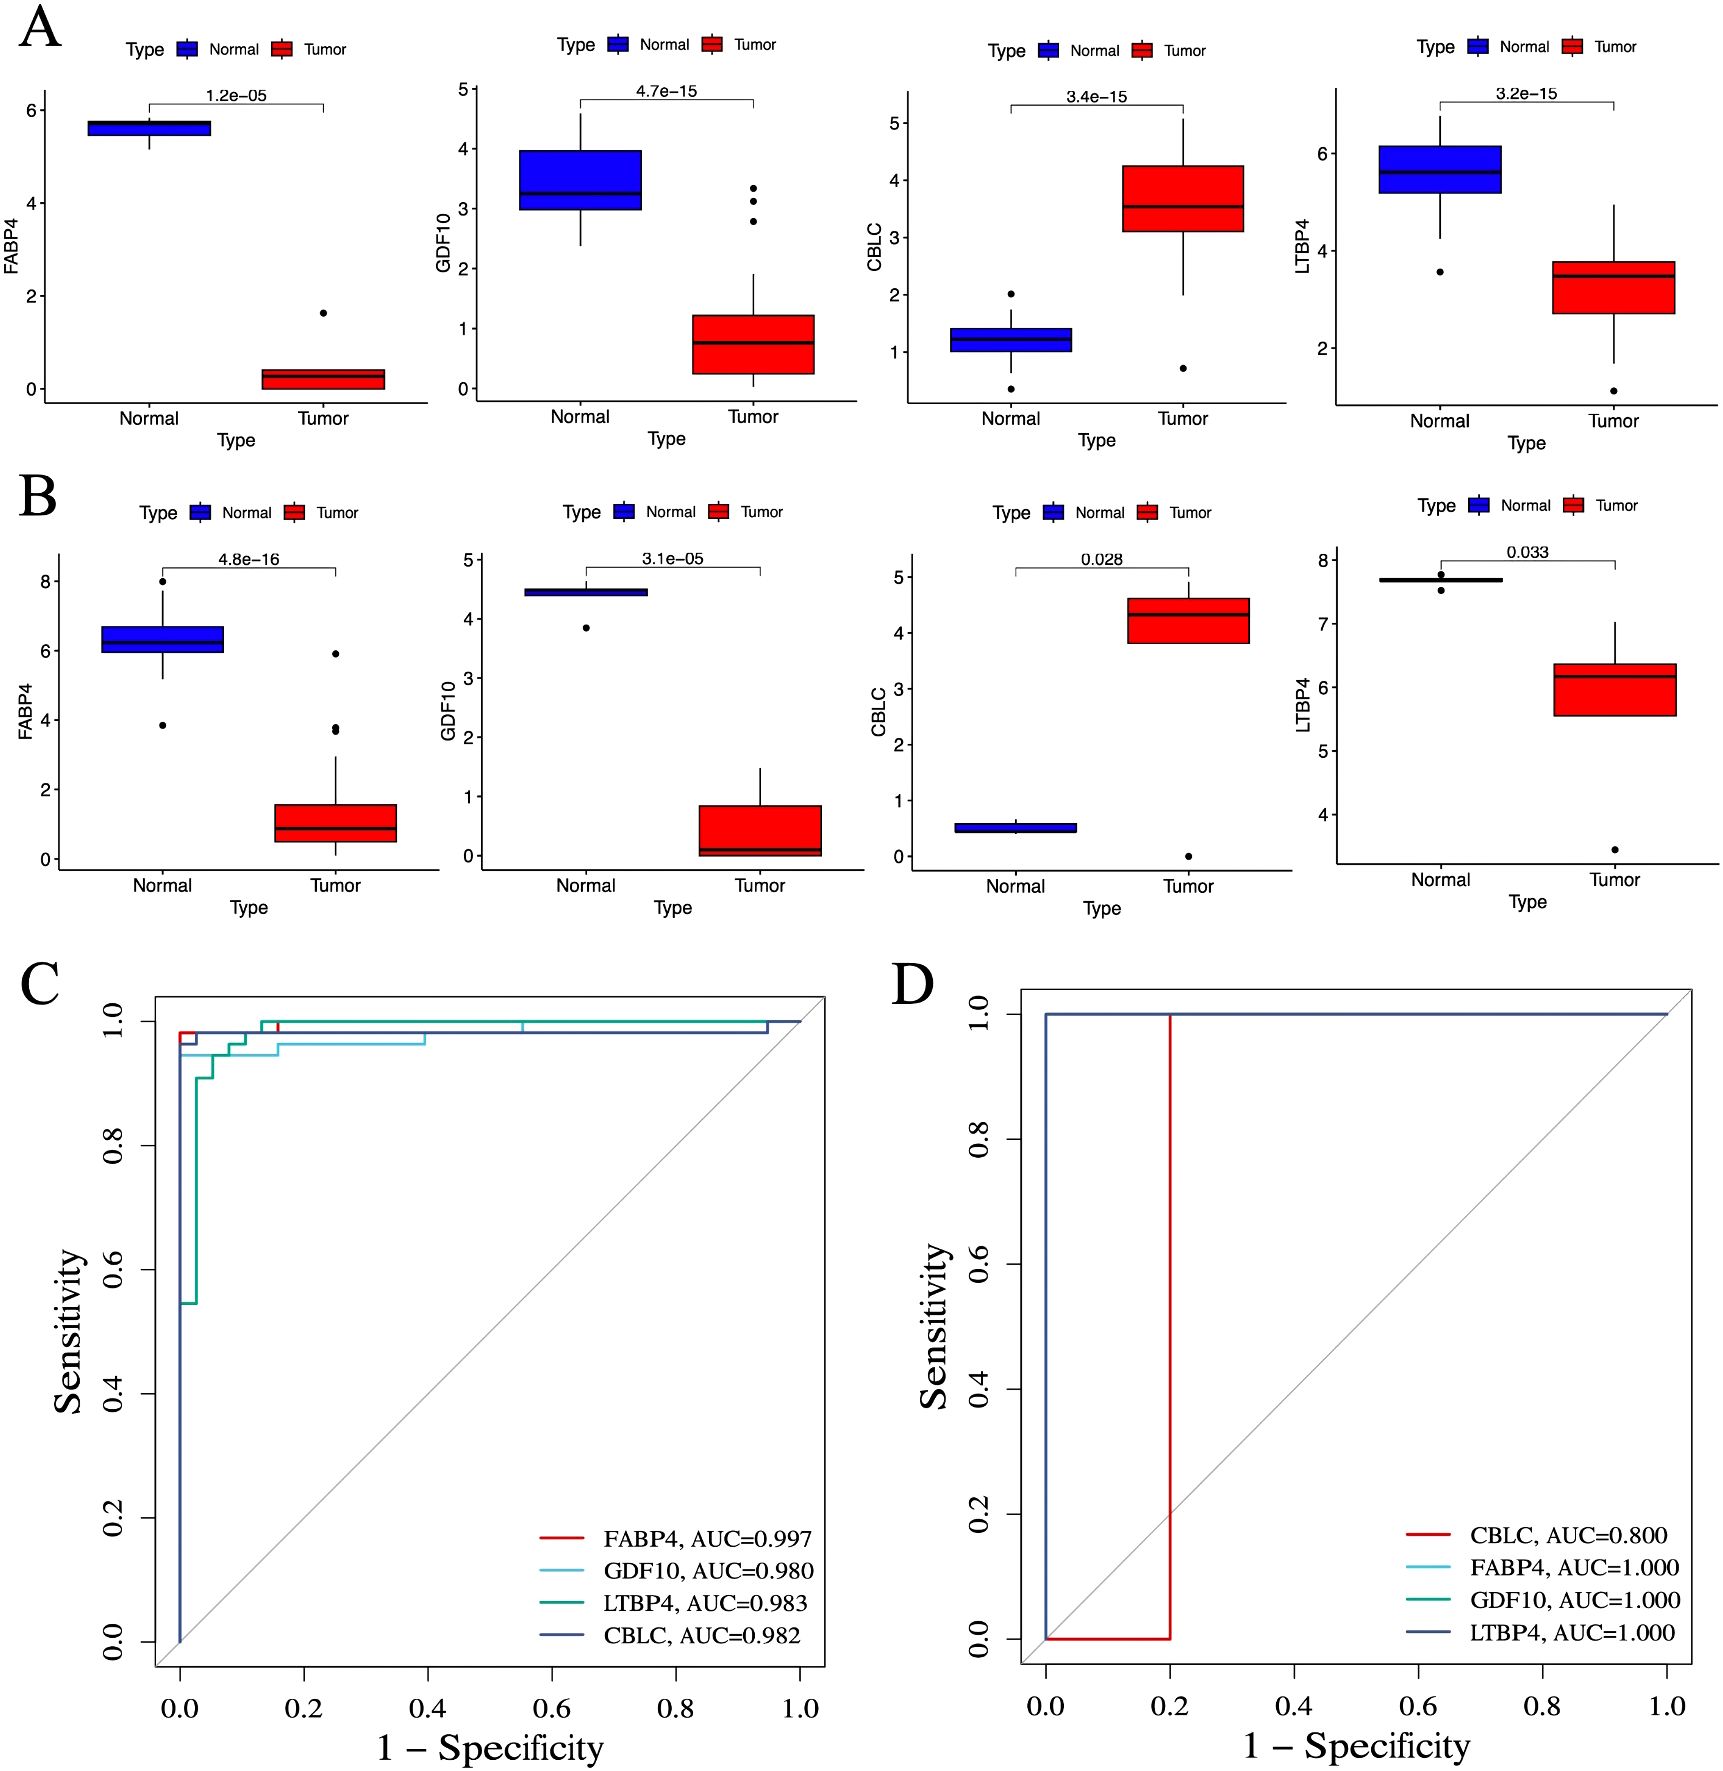
Figure 7. Verification of identified biomarkers. (A) Box plot for differential expression analysis in TCGA cohort (n =55). (B) Box plot for differential expression analysis in independent external sequencing cohorts (n =10). (C) ROC curve for evaluating the diagnostic ability of the TCGA cohort. (D) ROC curve for evaluating the diagnostic ability of the independent external sequencing cohort. P < 0.05 is considered statistically significant.
To evaluate the predictive utility of these genes as biomarkers of lung cancer, the study performed a ROC curve analysis. In the TCGA cohort, the AUC values of CBLC, FABP4, GDF10, and LTBP4 genes were 0.982, 0.997, 0.980, and 0.983, respectively (Figure 7C), indicating that these genes have a high diagnostic efficiency in distinguishing lung cancer samples from normal control groups. In an independent external sequencing sample cohort, these genes also performed impressively, with the AUC value for CBLC at 0.800, while the AUC values for FABP4, GDF10, and LTBP4 all reached 1.000 (Figure 7D), further validating their potential as diagnostic markers for lung cancer.
3.9 Analysis of clinical staging and genetic correlation
To gain a deeper understanding the role of the four genes CBLC, FABP4, GDF10, and LTBP4, and their genetic interactions in LUAD, Pearson correlation coefficients were calculated. The calculation results (Figure 8A) show that, except for CBLC, there is a good correlation between the three genes FABP4, GDF10, and LTBP4, indicating that they may play similar or synergistic roles in the development of LUAD.
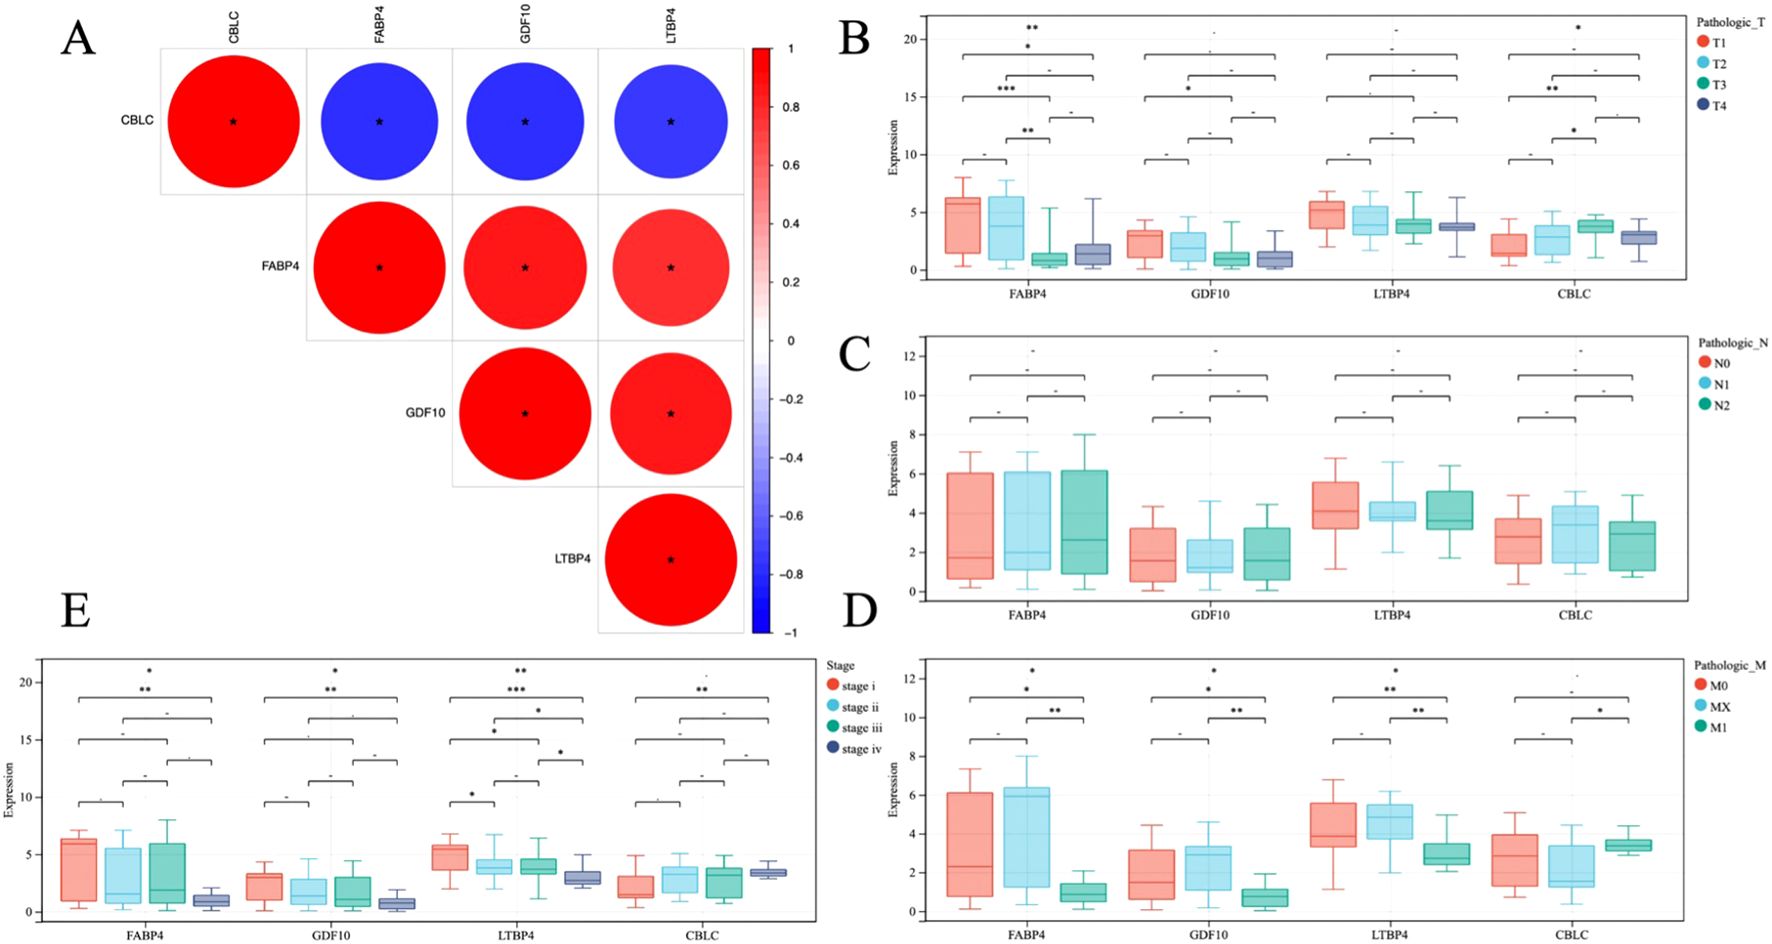
Figure 8. (A) Heat map of gene correlation analysis, blue and red indicate positive and negative correlation, respectively. (B–E) Analysis of correlation between gene and clinical stage. * P < 0.05, **P < 0.01, *** P < 0.001.
In addition, through statistical analysis of the TCGA dataset, the study further explored the relationship between these gene expression levels and the clinicopathological status of patients with LUAD (Figures 8B–E). The analysis results revealed, the high expression of CBLC in LUAD is positively correlated with poor clinical and pathological stages in patients, which means that the high expression of CBLC may be an indicator of poor progression and prognosis of lung adenocarcinoma. In contrast, high expression of FABP4, GDF10, and LTBP4 is associated with better clinical and pathological stages, indicating that the increased expression levels of these genes may be related to a better prognosis of LUAD.
3.10 Establishment of immune prognostic model
A multi-factor COX regression analysis was used to construct an immune prognostic model for predicting the 1-year, 3-year, and 5-year survival rates of LUAD patients, which was visualized as a nomogram (Figure 9). The analysis results of the calibration curve (Figures 10A, C) showed that there is a good consistency between the model predictions and the ideal model. In addition, the AUCvalues of the model training set were 0.80 (95% CI: 0.91–0.69) for 1-year survival rate, 0.85 (95% CI: 0.95–0.76) for 3-year survival rate, and 0.83 (95% CI: 0.95–0.70)for 5-year survival rate, respectively (Figure 10B), while in the TCGA validation set, the AUC values were 0.76 (95% CI: 0.97–0.55), 0.76 (95% CI: 0.88–0.65), and 0.77 (95% CI: 0.93–0.61), respectively (Figure 10D).
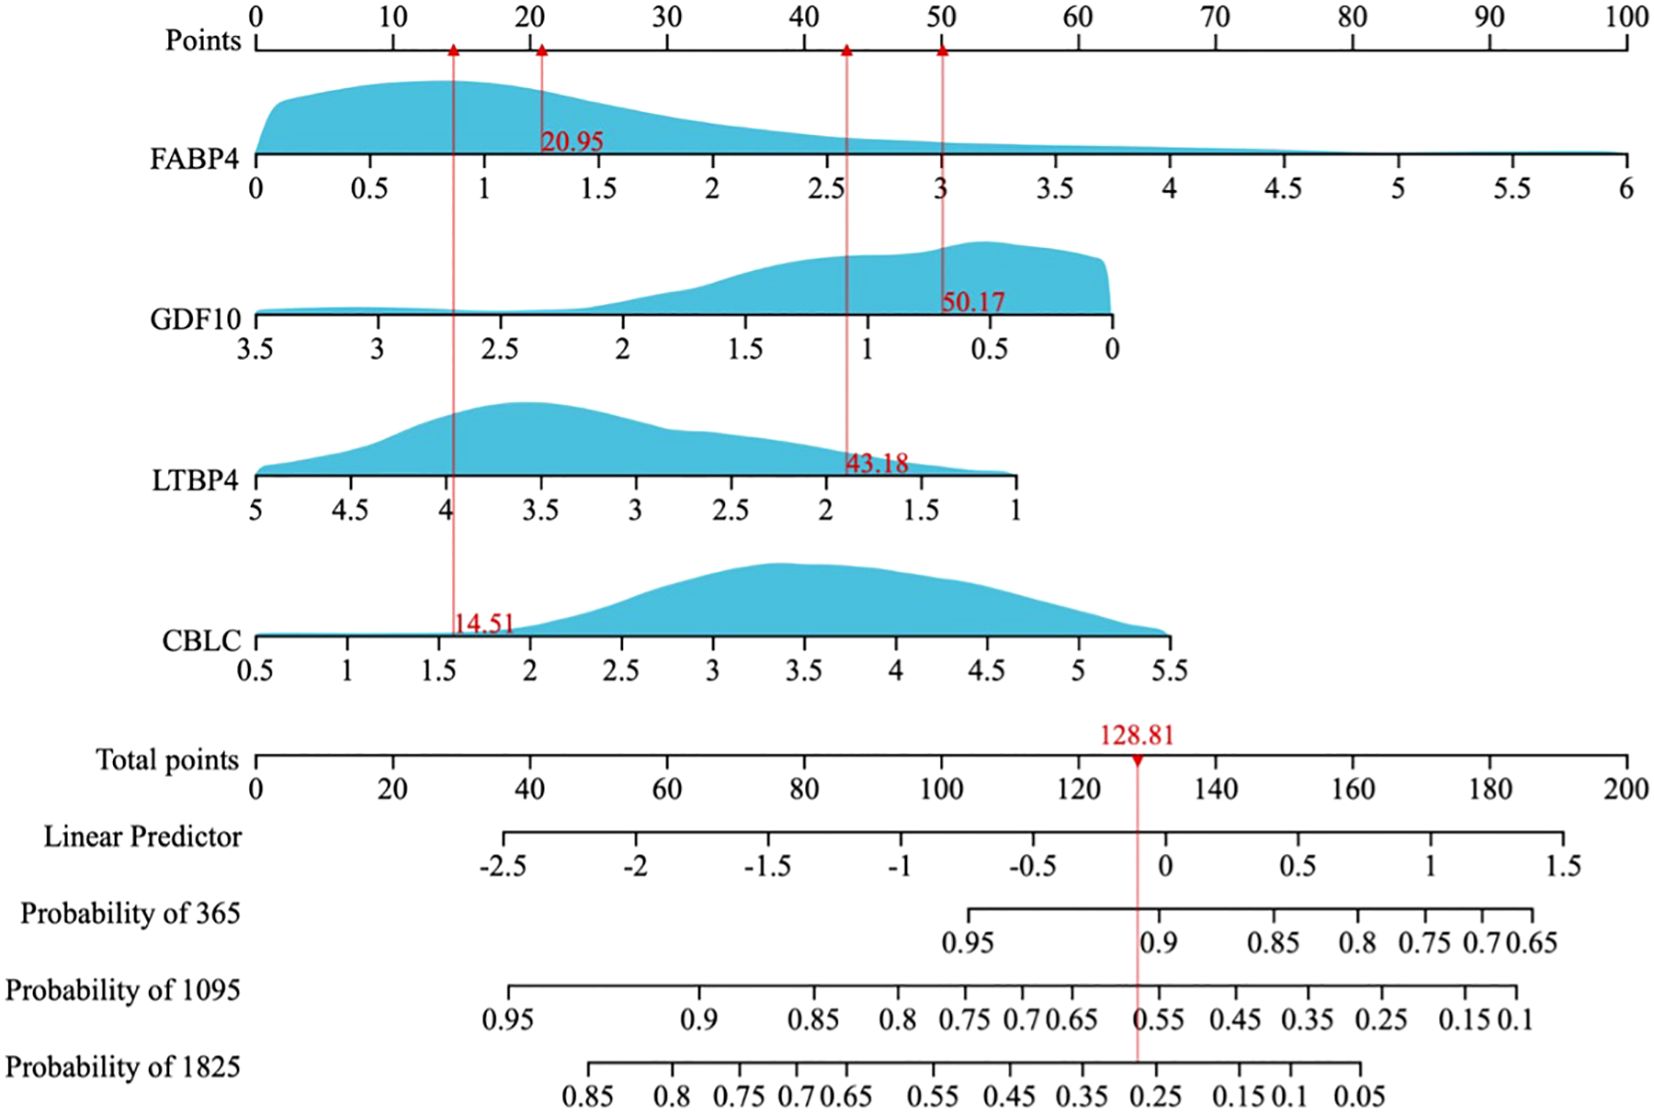
Figure 9. A nomogram for predicting the 1-year, 3-year, and 5-year overall survival (OS) probabilities in LUAD patients.
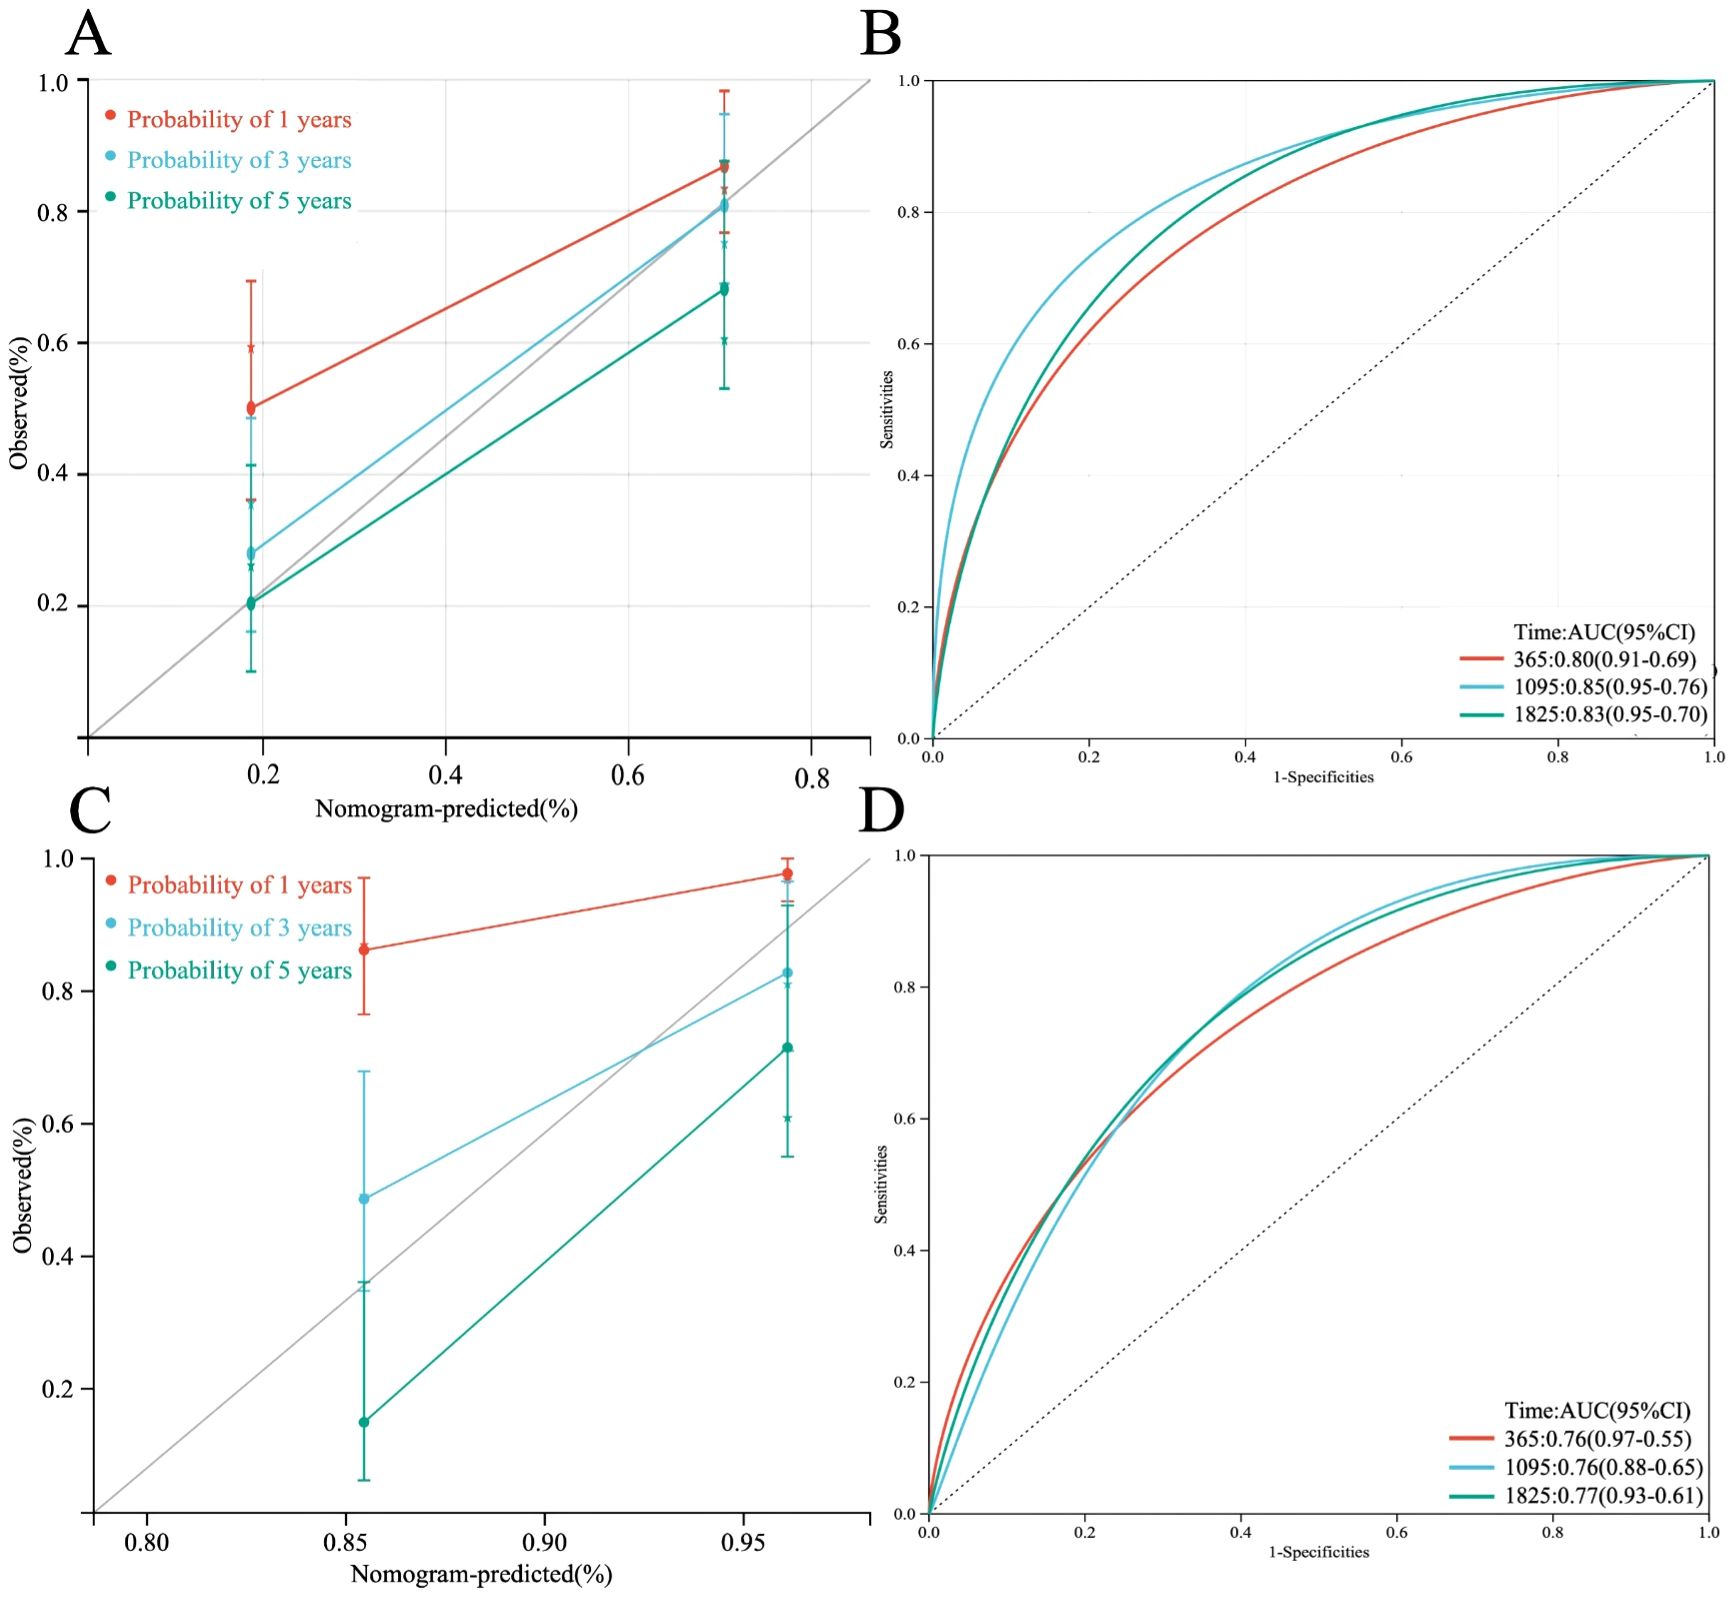
Figure 10. (A) Calibration plot of the line chart for the training group, used to predict the probability of OS at 1, 3, and 5 years. (B) Time-dependent ROC curve analysis of the immunological prognostic model line chart for the training group. (C) Calibration plot of the line chart for the TCGA validation group, used to predict the probability of OS at 1, 3, and 5 years. (D) Time-dependent ROC curve analysis of the immunological prognostic model line chart for the TCGA validation group.
3.11 Validation of the immunoprognostic model
Furthermore, based on four HUB genes, an ANN model was developed (Figure 11A) to enhance prediction accuracy. The TCGA dataset was used as the training set, while independent sequencing results served as the test set. The diagnostic performance of the ANN model was evaluated using ROC curves. In the training set, the model achieved an AUC of 0.929 (95% CI: 0.878–0.980) (Figure 11B), while in the TCGA validation set and independent external validation set, the AUC values were 0.876 (95% CI: 0.812–0.940) and 0.906 (95% CI: 0.849–0.963), respectively (Figures 11C, D).
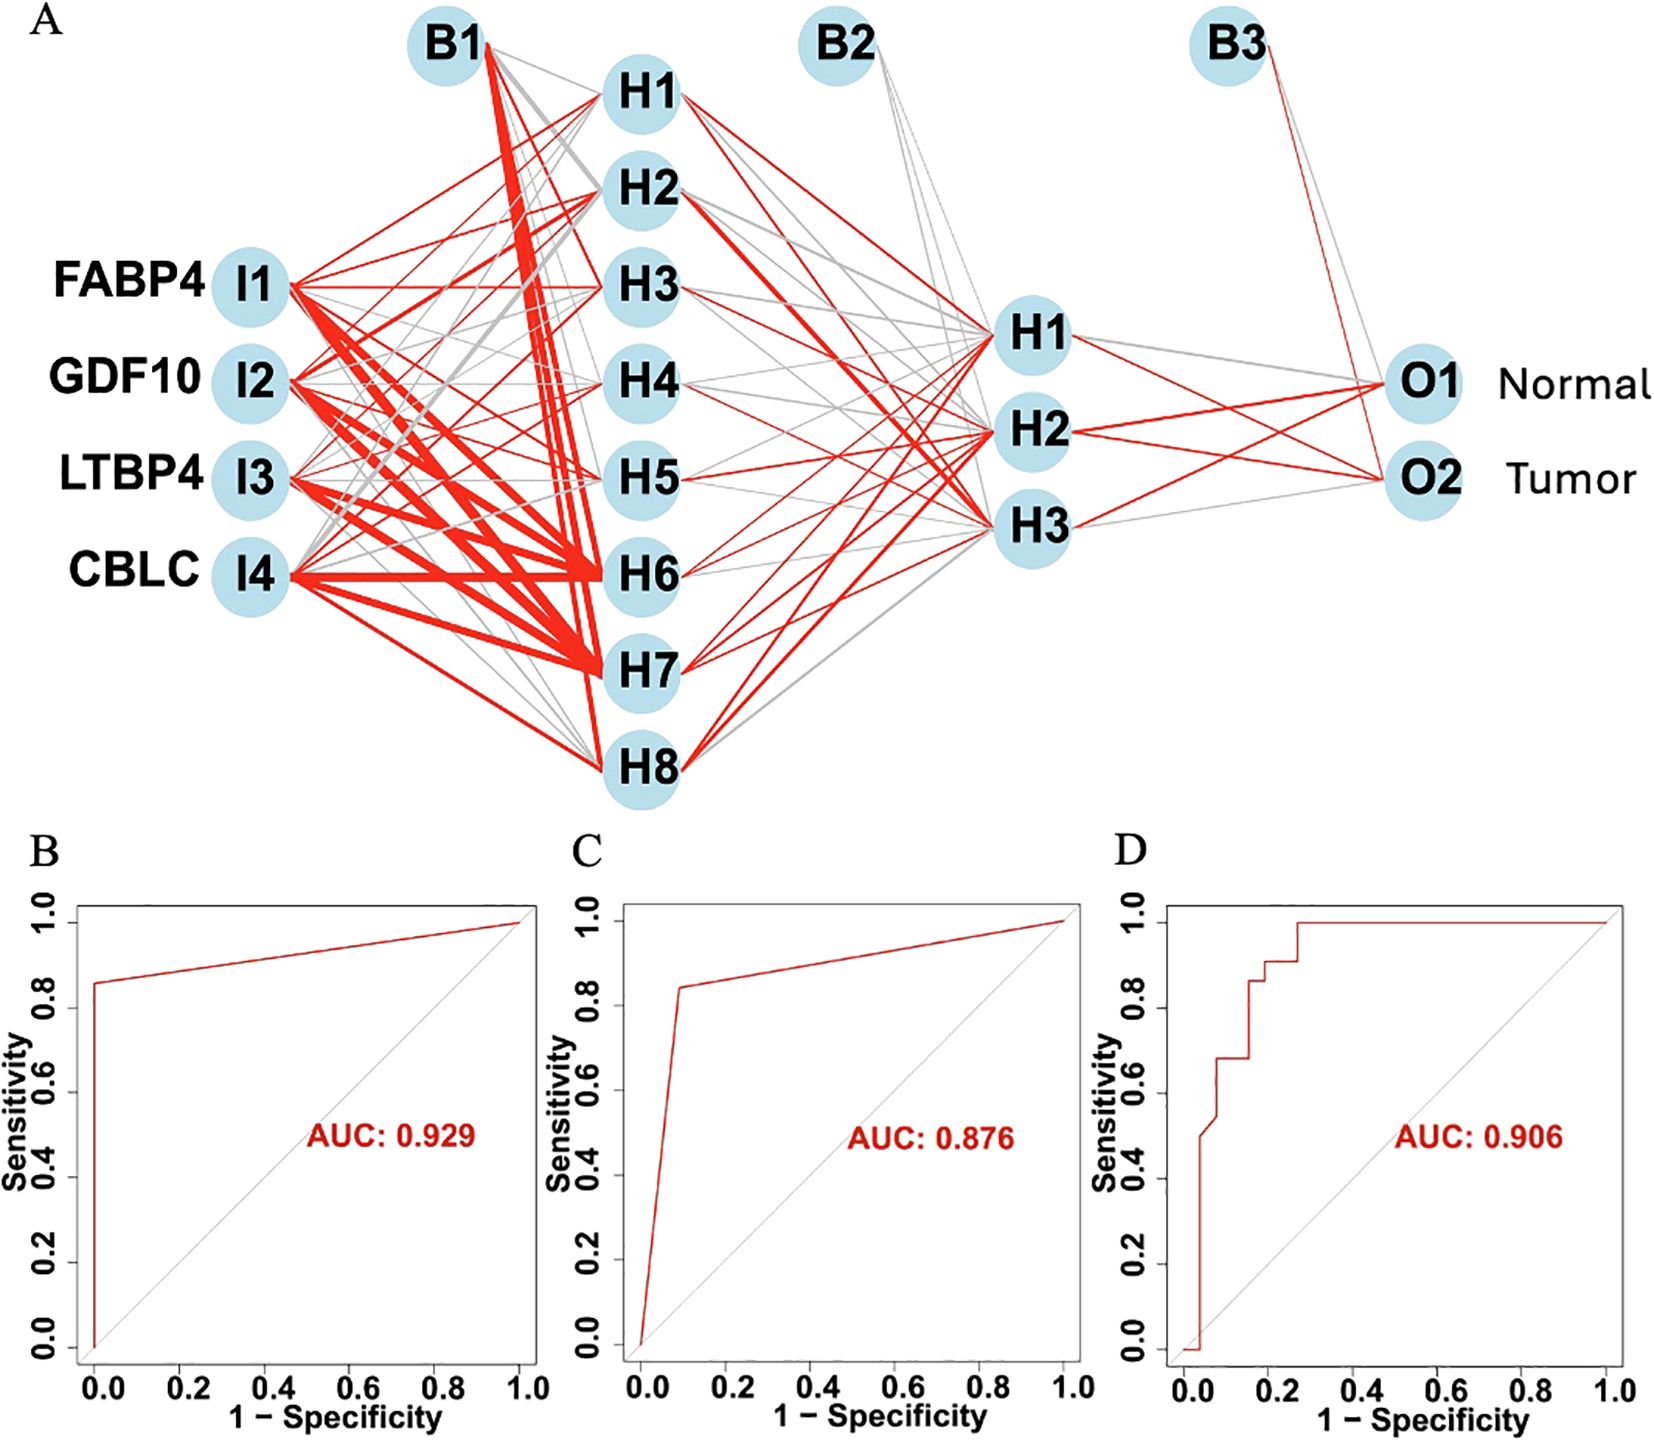
Figure 11. (A) Schematic diagram of the ANN model. (B) ROC curve of the ANN model in the training set. (C) ROC curve of the ANN model in the TCGA validation set. (D) ROC curve of the ANN model in the independent external validation set.
3.12 Immune prognostic model subtype analysis
When analyzing the gene expression profiles of 55 tumor samples in the TCGA training set cohort, we first performed cluster analysis using the consensus clustering method. The analysis determined that when k=2, the classification of the samples was both highly reliable and stable (Figures 12A–C). To further validate the differences between these two subgroups, two dimensionality reduction techniques, Uniform Manifold Approximation and Projection (UMAP) and t-Distributed Stochastic Neighbor Embedding (t-SNE), were employed. The results confirmed the significant differences between the two subgroups (Figure 12D). Based on this classification, the samples were divided into two clusters: Cluster 1 (C1, N=29) and Cluster 2 (C2, N=26). Next, survival analysis was performed to explore the prognostic differences between these two subgroups. The analysis results showed (Figure 12E) that there were significant survival differences between the two subgroups (P < 0.001).
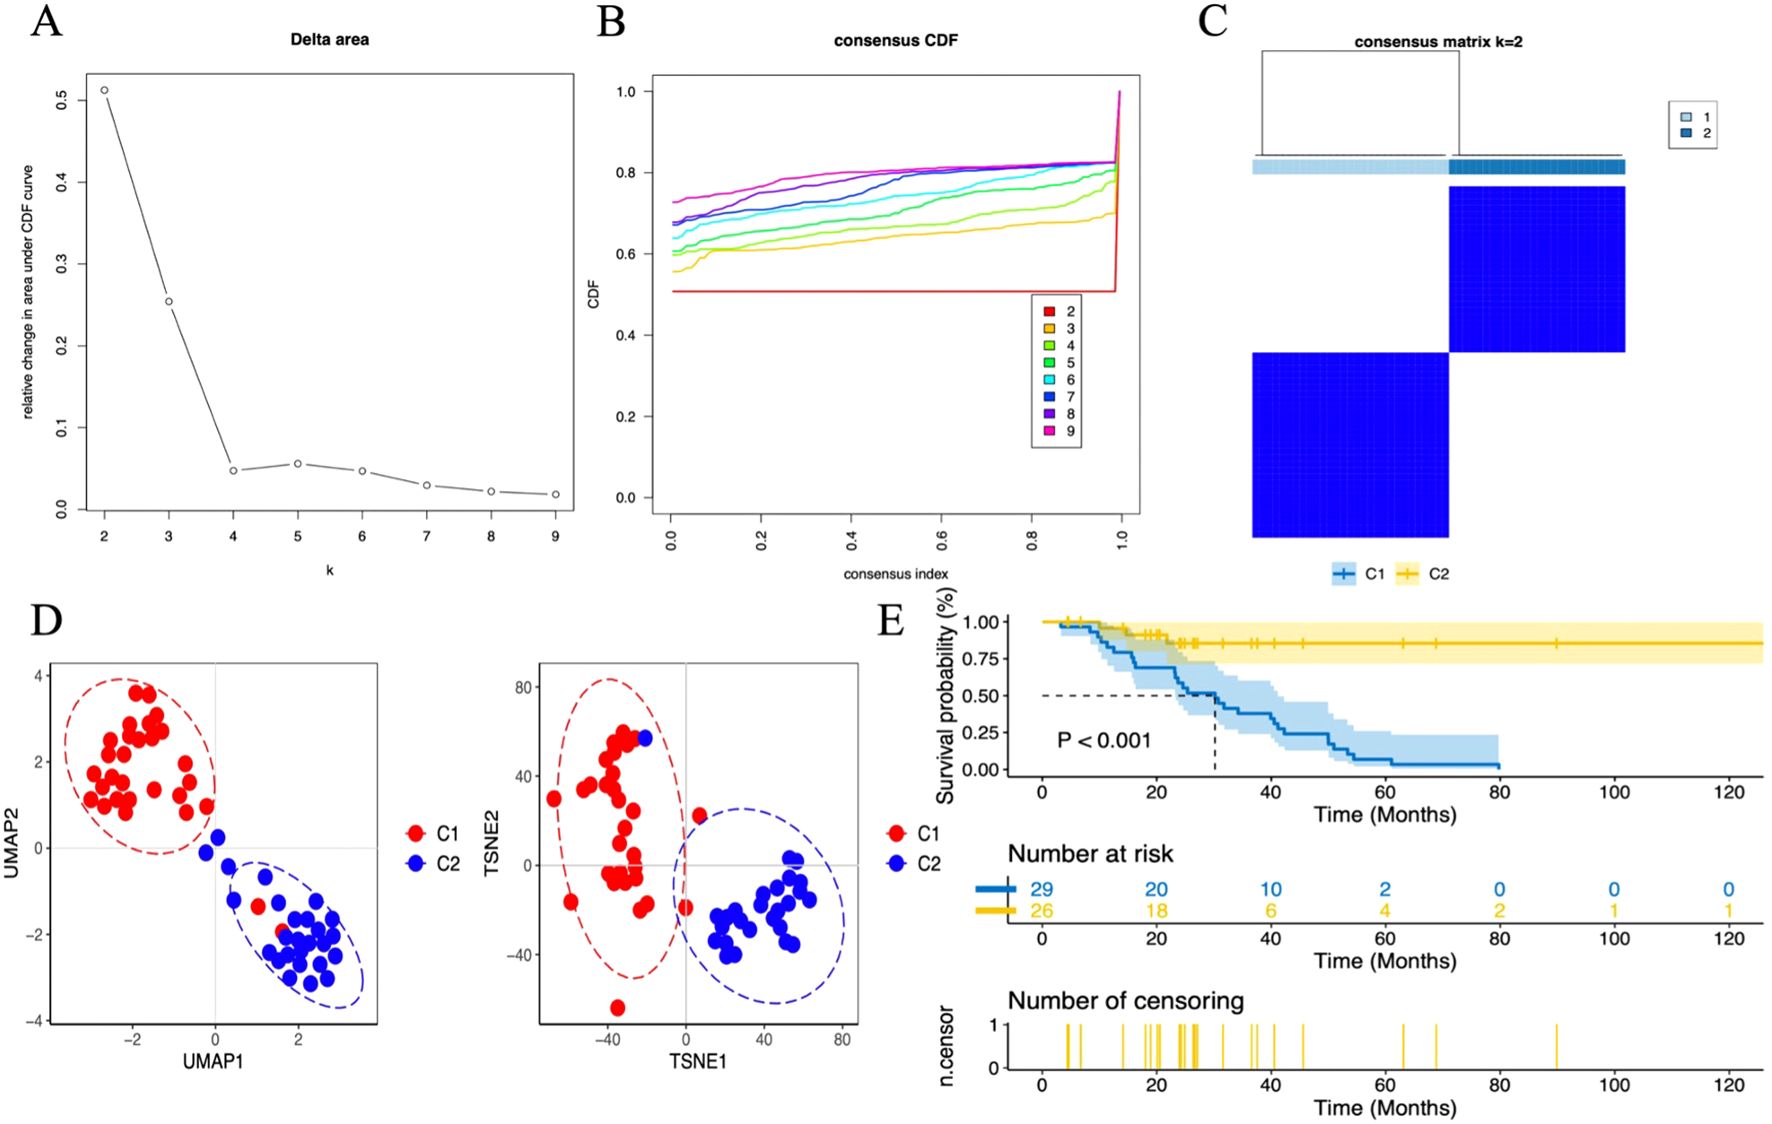
Figure 12. Unsupervised consensus clustering in the TCGA cohort. (A) Delta plot showing the change in the area under the consensus clustering CDF curve for k = 2 to 9. (B) Cumulative distribution function (CDF) for k = 2 to 9. (C) Heatmap displaying two DN sample clusters at k = 2. (D) Dimensionality reduction based on consensus clustering results, with UMAP on the left and t-SNE on the right. (E) Survival analysis of C1 and C2 subgroups.
3.13 Immune cell infiltration
This study utilized the ssGSEA algorithm to analyze the immune cell infiltration and immune gene correlation in LUAD samples and the control group. The results show (Figure 13B): CBLC is negatively correlated with various immune cells (such as activated CD8 T cells, dendritic cells, regulatory T cells, etc.); FABP4 is positively correlated with various immune cells (such as memory T cells, macrophages, neutrophils, etc.); GDF10 is positively correlated with memory CD4 T cells, eosinophils, plasma cell-like dendritic cells, etc.; LTBP4 is positively correlated with memory T cells, eosinophils, and dendritic cells. Further analysis (Figure 13C) found that CBLC is mainly negatively correlated with dendritic cells, macrophages, and CD8 T cells; FABP4 is positively correlated with dendritic cells, macrophages, and neutrophils; GDF10 and LTBP4 are mainly positively correlated with macrophages and CD4 T cells, and LTBP4 is also positively correlated with dendritic cells. These results indicate that different genes play different roles in immune cell infiltration, reflecting the complexity and diversity of the LUAD tumor microenvironment.
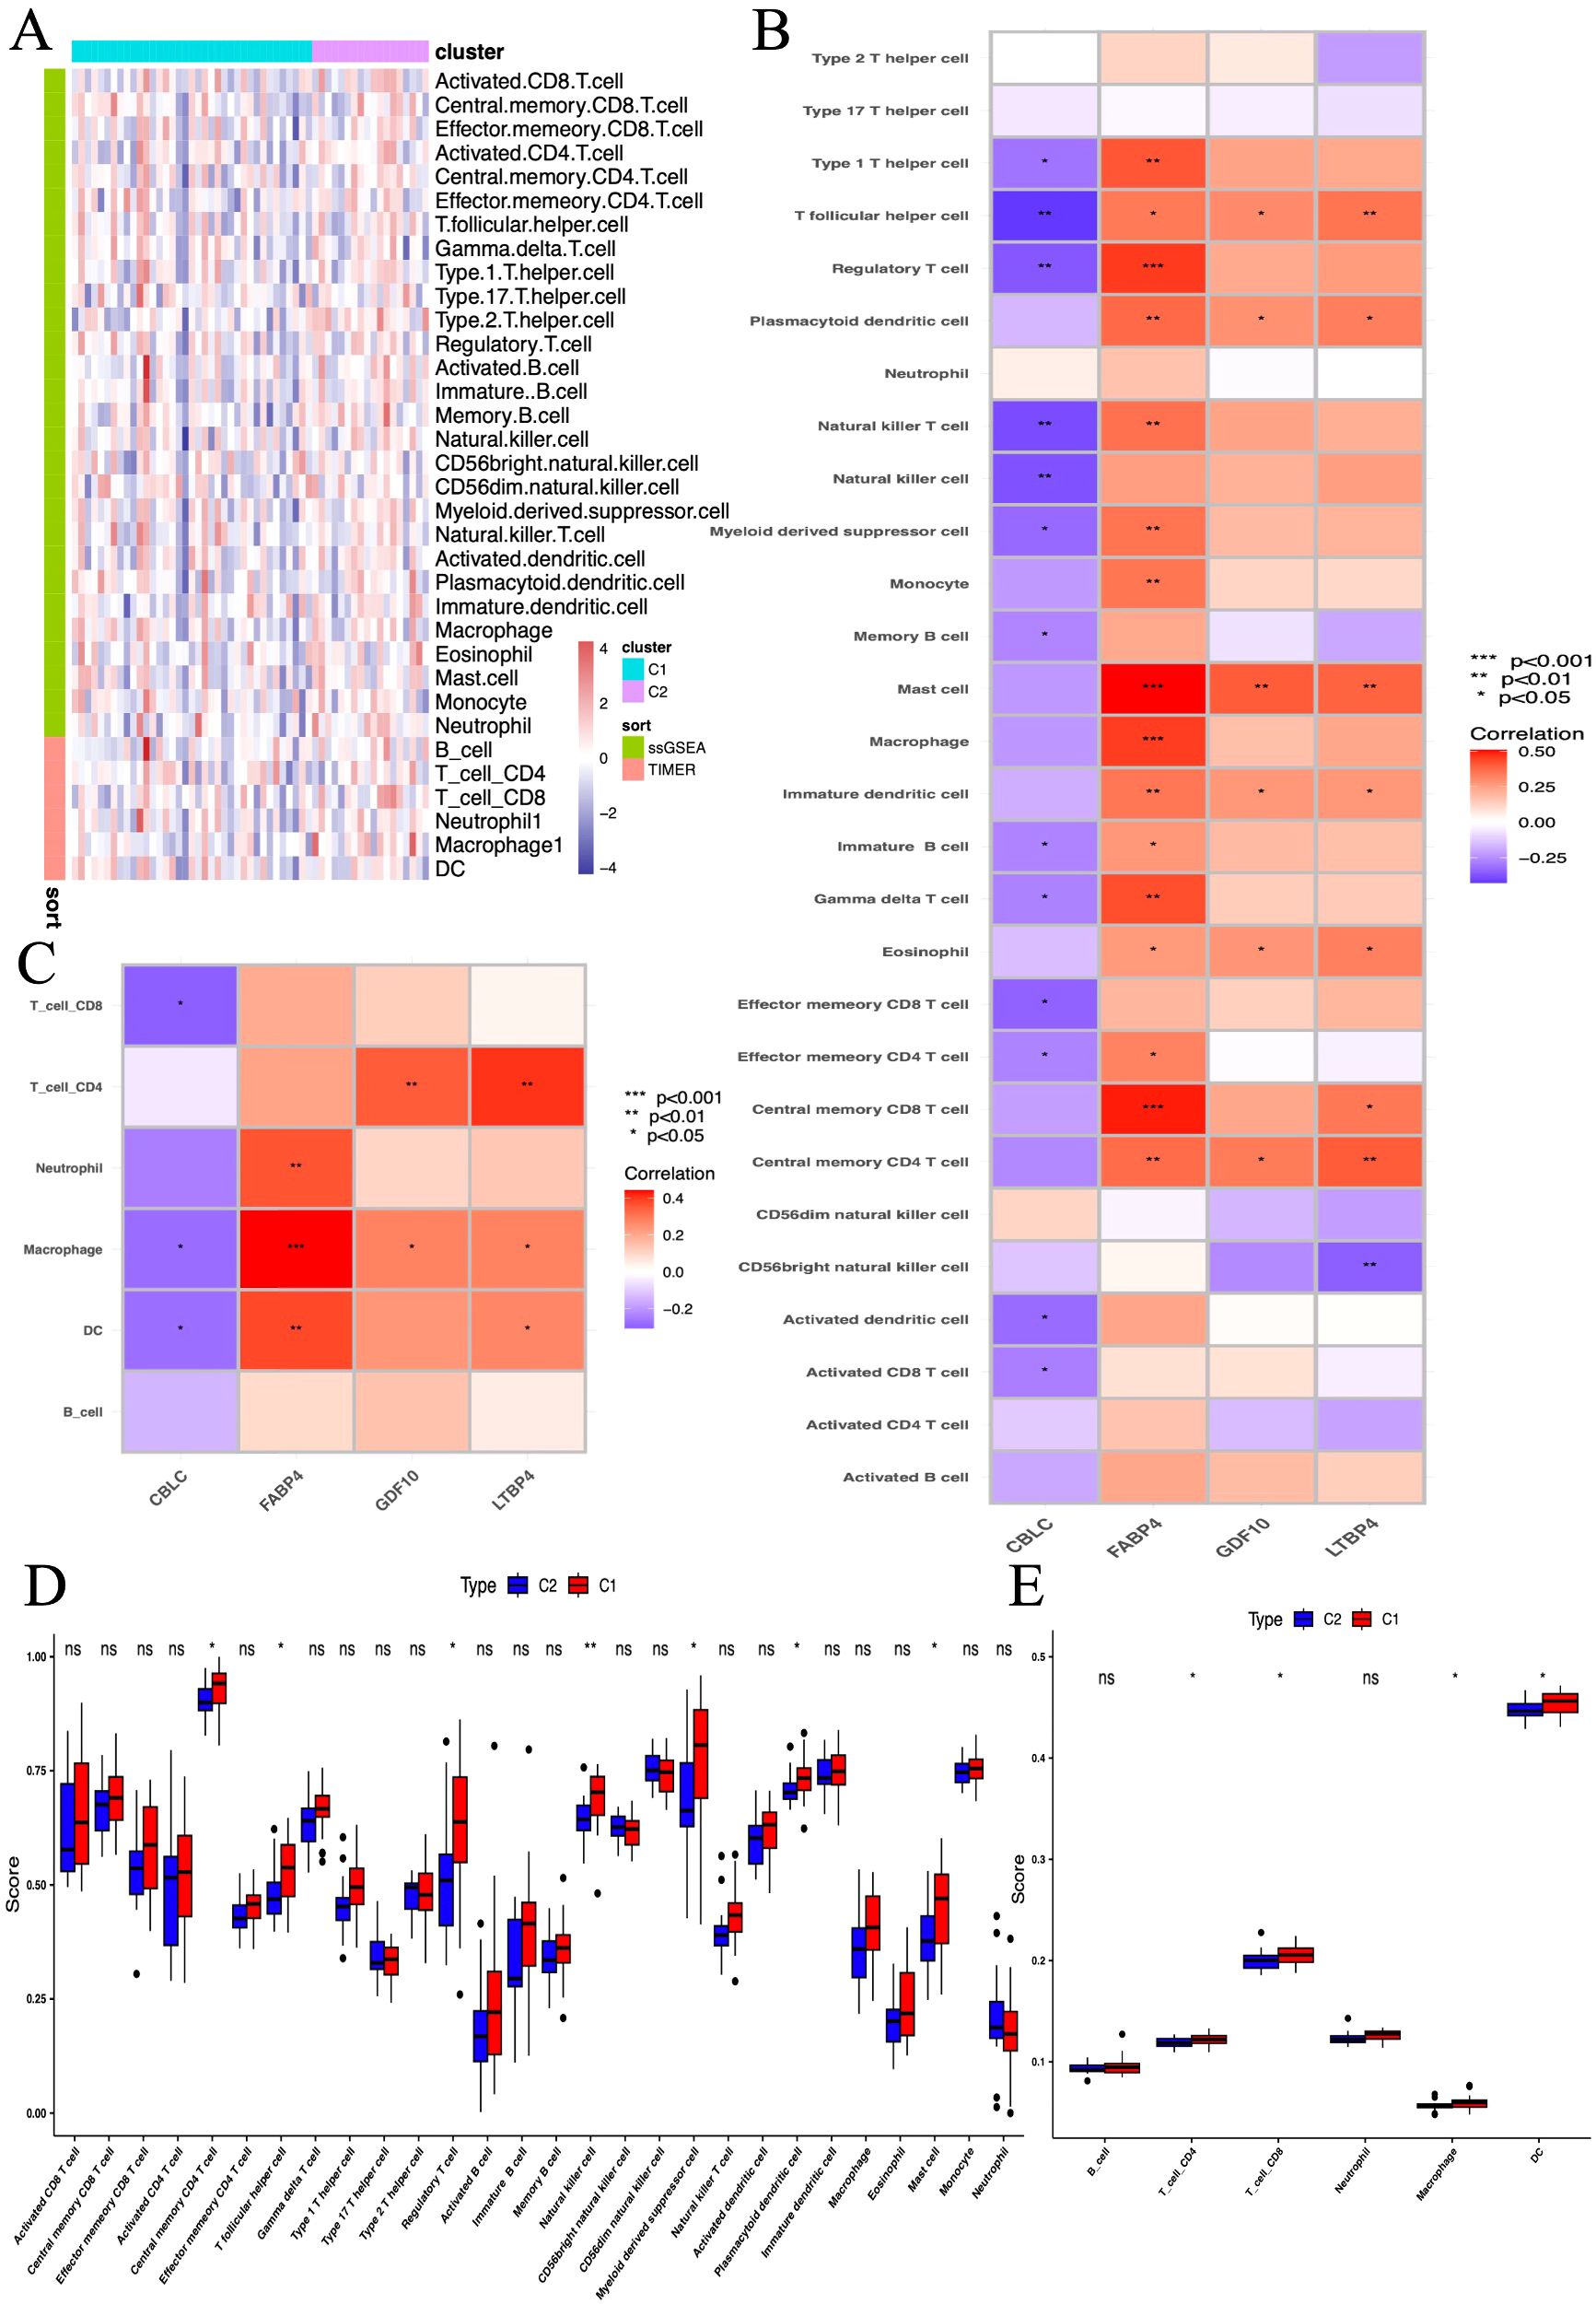
Figure 13. The association between biomarkers and immune infiltration in samples. (A) Heatmap of metabolic and immune-related gene sets from GSVA. (B, C) Heatmap of immune landscape from ssGSEA. (D, E) Box plots showing the correlation between immune subgroups and infiltrating immune cells. *P < 0.05, **P < 0.01, *** P < 0.001.
Further research compared the differences in 28 immune cell types between two immune subgroups and found significant differences and heterogeneity in immune cell infiltration between the high-risk and low-risk groups (Figure 13A). Compared to the C2 group, the C1 group had significantly elevated levels of central memory CD4 T cells, follicular helper T cells, regulatory T cells, natural killer cells, myeloid-derived suppressor cells, plasmacytoid dendritic cells, and mast cells (Figure 13D). In further studies, we found significant increases in CD4 T cells, CD8 T cells, macrophages, and dendritic cells in the C1 group (Figure 13E).
3.14 Immunohistochemical staining of HUB genes in normal and tumor tissues
According to the immune staining intensity comparisons provided by the HPA database (Figure 14), the expression levels of FABP4, GDF10, and LTBP4 were higher in normal samples, while the expression level of CBLC was higher in lung adenocarcinoma samples. This result is consistent with previous studies on gene expression differences.
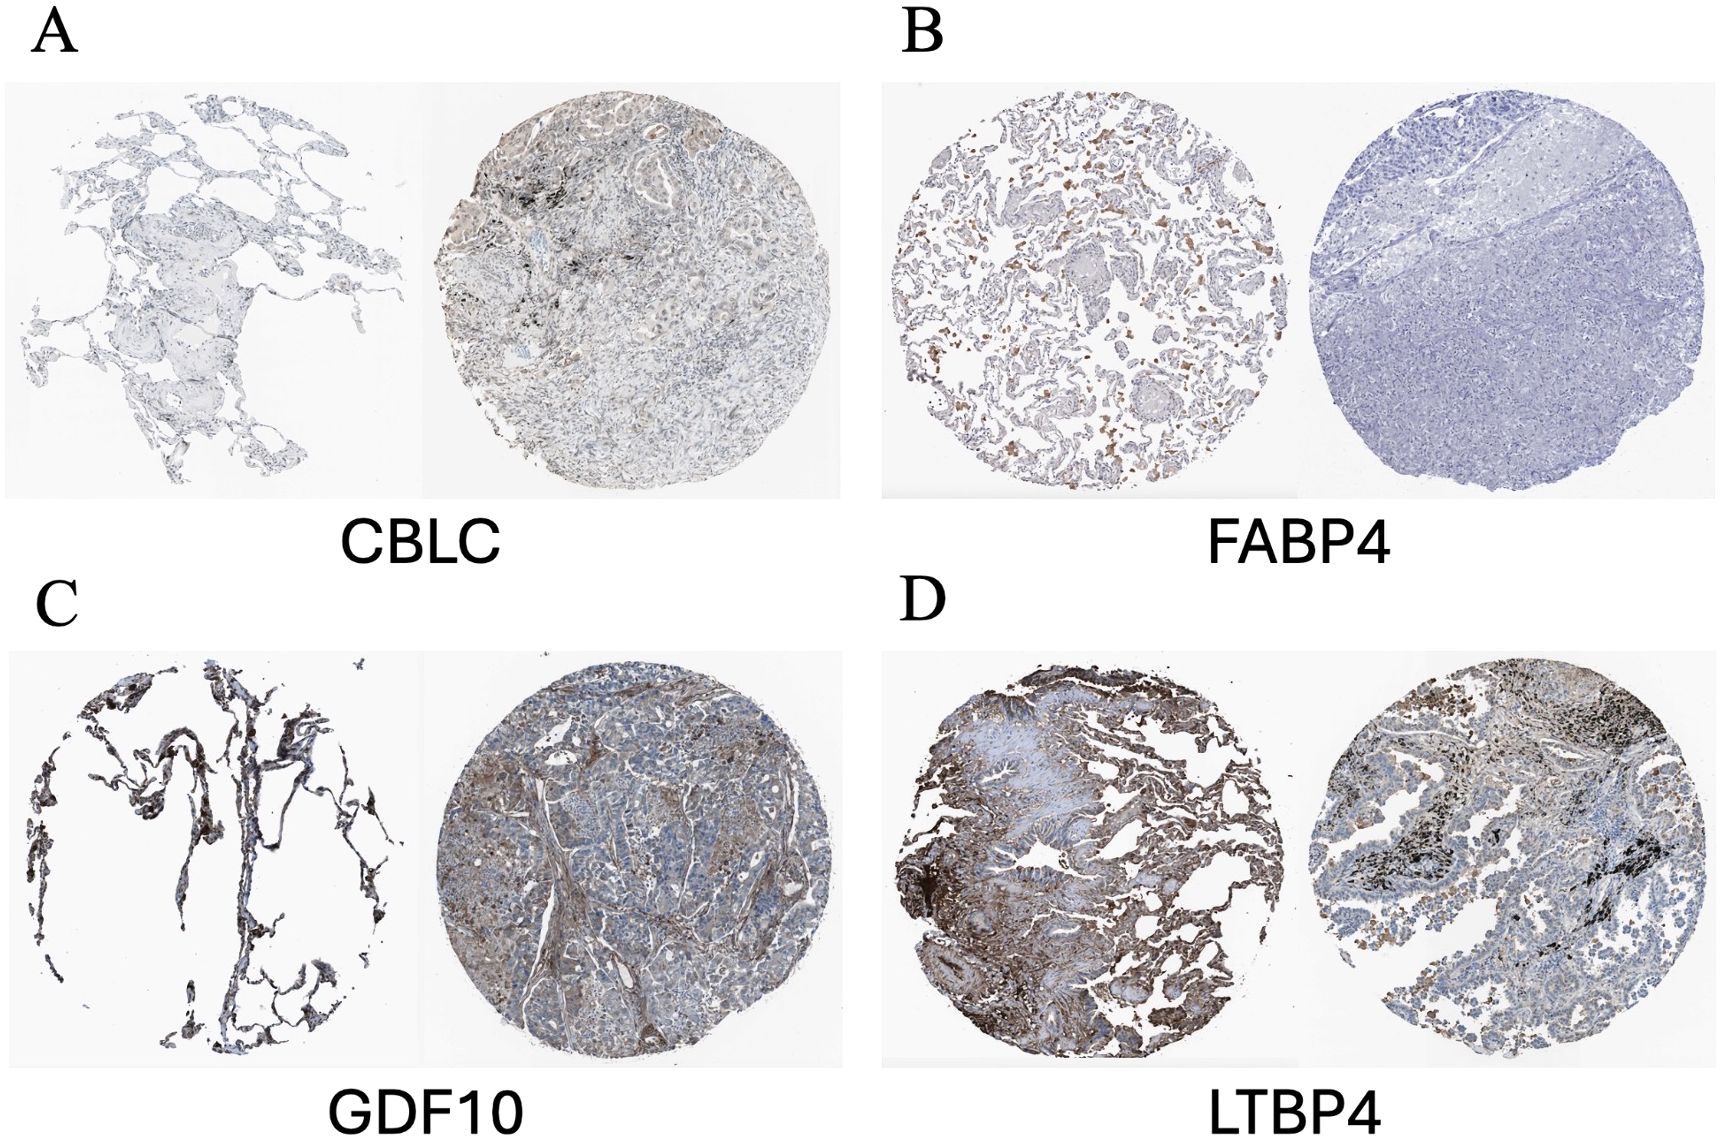
Figure 14. Representative immunohistochemical images of HUB genes in lung adenocarcinoma and normal lung tissues from the HPA database. (A) Comparison of CBLC; (B) Comparison of FABP4; (C) Comparison of GDF10; (D) Comparison of LTBP4. HPA, Human Protein Atlas. In each pair of images, the staining on the left side shows the gene expression in normal lung tissue, while the staining on the right side shows the gene expression in lung cancer samples.
3.15 GESA
The GSEA analysis of four HUB genes in the progression of lung adenocarcinoma (LUAD) indicates that these genes are mainly enriched in the following biological processes and pathways (Figure 15): 1. Allogeneic rejection response 2. Asthma 3. Amino acid biosynthesis 4. DNA replication.
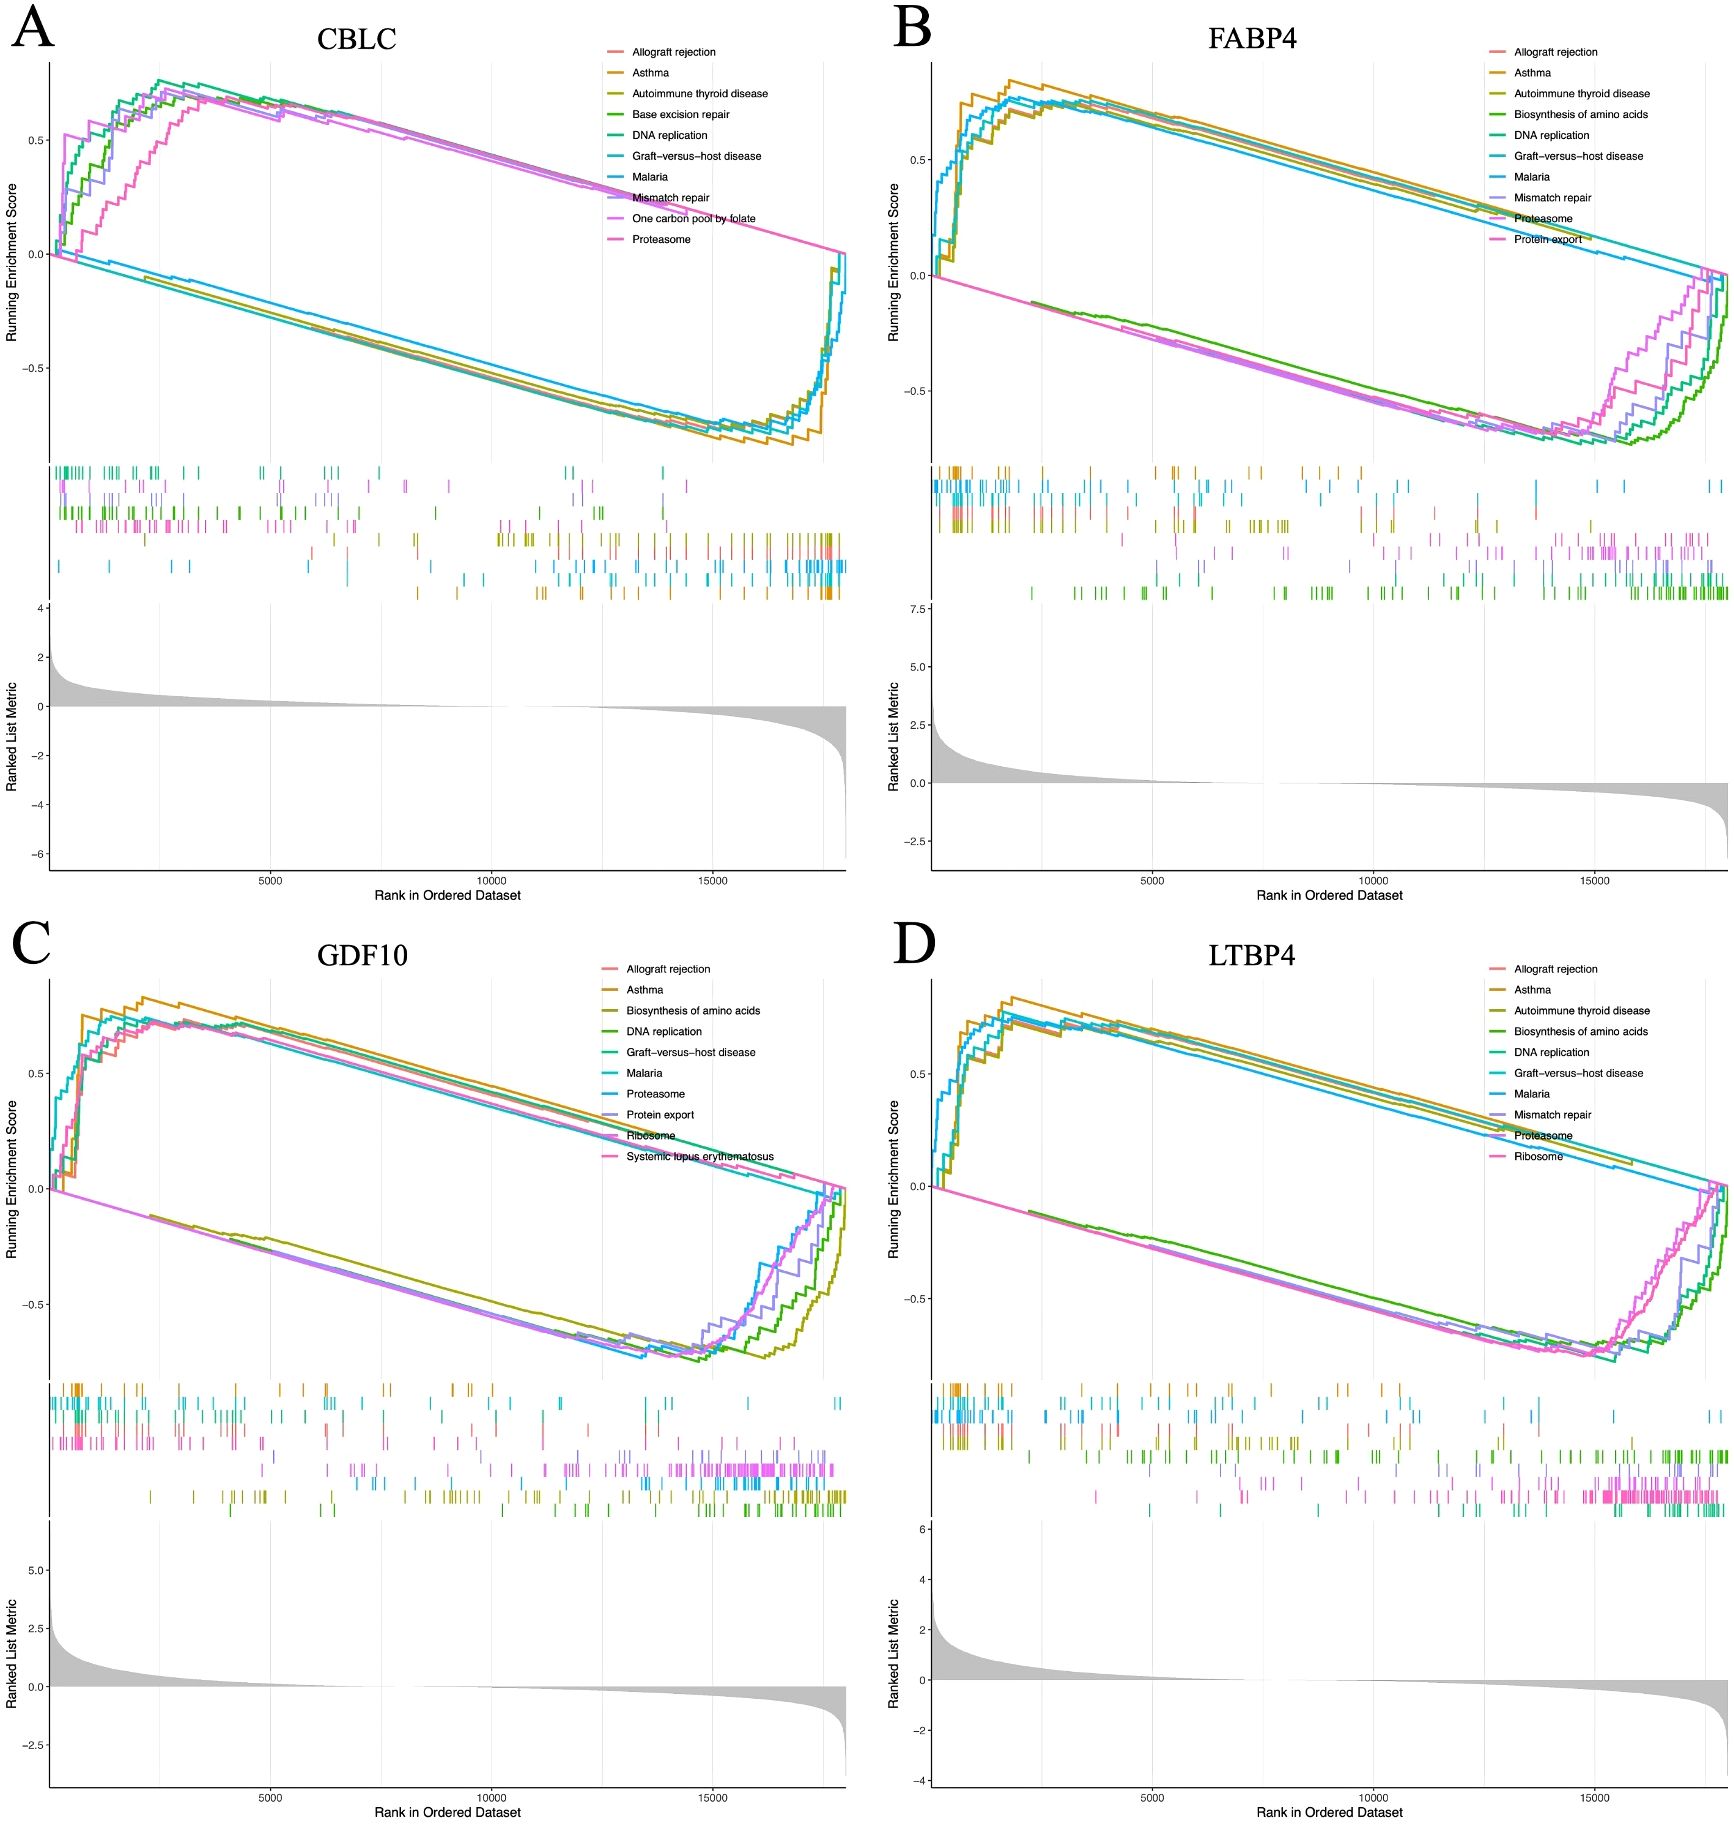
Figure 15. (A–D) represent the GSEA enrichment plots for CBLC, FABP4, GDF10, and LTBP4, respectively.
4 Discussion
LUAD, a major subtype of NSCLC, remains a global health challenge due to its high incidence, mortality, and poor five-year survival rates despite advances in targeted therapies (16). Traditional prognostic assessments based on clinical and pathological features are limited by interindividual heterogeneity, highlighting the need for molecular biomarkers to guide diagnosis and treatment (17). With the rise of sequencing technologies, precision medicine has become central in LUAD management, promoting individualized therapeutic strategies. Increasing evidence suggests that tumor progression is influenced not only by genetic changes but also by immune system involvement (18). Immune cells play crucial roles in all stages of cancer development (19, 20).
In LUAD, transcriptomic analysis of DEGs highlights enrichment in key biological processes such as signal transduction, cell proliferation, metabolism, immune responses, and inflammation. KEGG analysis further implicates immune-related pathways, notably PI3K/Akt and Jak-STAT, in LUAD progression. The PI3K/Akt axis promotes tumor survival and proliferation (21), while Jak-STAT facilitates immune evasion (22), with their interplay potentially enhancing tumor resilience. These findings underscore the functional relevance of DEGs and reveal therapeutic opportunities to simultaneously inhibit tumor growth and immune escape, improving LUAD outcomes.
WGCNA is a robust bioinformatics tool designed to identify functionally related gene modules associated with specific biological states or disease prognosis from large-scale gene expression datasets (23, 24). In LUAD studies, WGCNA combined with immune-related genes identified four key hub genes: CBLC, FABP4, GDF10, and LTBP4, showing significant differential expression between tumor and normal samples. CBLC is significantly upregulated in LUAD, especially in patients with poor prognosis, suggesting that it may promote tumor invasion (25, 26). Conversely, FABP4, GDF10, and LTBP4 are expressed at higher levels in normal tissue and patients with good prognosis, possibly having antitumor or immune protective effects. CBLC belongs to the CBL family and is an E3 ubiquitin ligase involved in EGFR ubiquitination and degradation, widely upregulated in various cancers, including NSCLC, hinting at its oncogenic potential (27–29). FABP4 regulates lipid signaling and metabolism, and its high expression in lung cancer is associated with poor prognosis (30–34). LTBP4 is a member of the TGF-β pathway, which can both inhibit tumor growth and promote progression in tumors, and its downregulation is common in advanced LUAD (35–39). GDF10 is involved in antitumor and Epithelial-mesenchymal transition (EMT) (40, 41), and is often associated with methylation dysregulation in lung cancer, having potential as a therapeutic target (42, 43). In summary, these four genes play an important role in the occurrence and development of LUAD and are expected to become potential therapeutic targets and prognostic biomarkers.
Nomograms are valuable tools for integrating clinical features to predict patient outcomes. Here, we constructed a nomogram combining clinical parameters and immune-related signatures to estimate Overall survival (OS) in LUAD patients. Calibration plots showed strong agreement between predicted and actual survival, confirming the model’s reliability.
ROC analysis assessed predictive accuracy, with AUCs of 0.83 (training set) and 0.76 (TCGA validation set), indicating strong discrimination. An ANN model further improved prognostic precision, showing consistent performance across TCGA and external datasets, confirming the robustness of our immune-based LUAD prognostic framework.
Our findings further demonstrated a strong association between the identified hub genes and key biological processes, including immune response, inflammation, cell proliferation, and the regulation of cytokines and chemokines. Using ssGSEA, we characterized the immune cell infiltration landscape in the LUAD microenvironment, revealing significantly elevated levels of CD4+ T cells, CD8+ T cells, macrophages, and dendritic cells in LUAD tissues compared to normal controls. Notably, CD4+ and CD8+ T cells are well-established for their potent antitumor activity (44, 45), while dendritic cells and macrophages play critical immunomodulatory roles across multiple cancer types (46–48). Correlation analyses indicated that most hub genes exhibited positive associations with these immune cell populations—particularly CD4+ T cells, CD8+ T cells, macrophages, and dendritic cells—with the notable exception of CBLC, which showed negative correlations. This observation aligns with the poor prognostic implications of elevated CBLC expression in LUAD, collectively underscoring the pivotal role of the immune microenvironment in LUAD pathogenesis and clinical outcomes (49–51). Our results further suggest that the four hub genes (CBLC, FABP4, GDF10, and LTBP4) may serve as key regulators of LUAD progression.
Despite providing valuable insights, this study has limitations. Large, multicenter clinical validations are needed, and reliance on TCGA RNA-seq data may limit generalizability. Moreover, the lack of functional validation calls for cautious interpretation of the bioinformatic results.
Although this study provides valuable insights, it has some limitations. First, to verify the accuracy of the predictive model, more large-scale evidence-based medical studies from different centers are needed. Second, our prognosis assessment model mainly relies on RNA sequencing data from the TCGA database, which may limit the model’s general applicability. Finally, due to the lack of functional validation from clinical, cellular, and animal model aspects, the reliability of our data analysis results needs further confirmation.
This study demonstrates that the selected features are strongly associated with overall survival in LUAD patients, showing consistent prognostic value across training, test sets, and subgroups. Their correlation with clinicopathological parameters further supports their potential as reliable tools for risk stratification and personalized treatment.
Data availability statement
The original contributions presented in the study are included in the article/Supplementary Material, further inquiries can be directed to the corresponding author.
Ethics statement
The studies involving humans were approved by Institutional Review Board of the First Affiliated Hospital of Wenzhou Medical University. The studies were conducted in accordance with the local legislation and institutional requirements. The participants provided their written informed consent to participate in this study.
Author contributions
JZ: Project administration, Writing – original draft, Formal analysis, Writing – review & editing, Data curation, Supervision, Conceptualization, Software, Methodology, Validation. XX: Supervision, Software, Writing – original draft, Writing – review & editing, Formal analysis, Data curation. MF: Methodology, Writing – review & editing, Conceptualization. JY: Funding acquisition, Project administration, Formal analysis, Writing – review & editing, Writing – original draft, Data curation, Conceptualization, Methodology. XC: Methodology, Writing – review & editing. XL: Validation, Data curation, Writing – review & editing. YZ: Formal analysis, Visualization, Writing – review & editing.
Funding
The author(s) declare that financial support was received for the research and/or publication of this article. This study was funded by the Jinhua Science and Technology Program (2023-4-072); Jinhua Science and Technology Program (2021-3-085); Jinhua Science and Technology Program (2022-4-088).
Acknowledgments
Thank you to the First Affiliated Hospital of Wenzhou Medical University for their assistance in this study.
Conflict of interest
The authors declare that the research was conducted in the absence of any commercial or financial relationships that could be construed as a potential conflict of interest.
Generative AI statement
The author(s) declare that no Generative AI was used in the creation of this manuscript.
Publisher’s note
All claims expressed in this article are solely those of the authors and do not necessarily represent those of their affiliated organizations, or those of the publisher, the editors and the reviewers. Any product that may be evaluated in this article, or claim that may be made by its manufacturer, is not guaranteed or endorsed by the publisher.
Supplementary material
The Supplementary Material for this article can be found online at: https://www.frontiersin.org/articles/10.3389/fonc.2025.1630663/full#supplementary-material
References
1. Cao M, Li H, Sun D, and Chen W. Cancer burden of major cancers in China: A need for sustainable actions. Cancer Commun (Lond). (2020) 40:205–10. doi: 10.1002/cac2.12025
2. Bray F, Ferlay J, Soerjomataram I, Siegel RL, Torre LA, and Jemal A. Global cancer statistics 2018: globocan estimates of incidence and mortality worldwide for 36 cancers in 185 countries. CA Cancer J Clin. (2018) 68:394–424. doi: 10.3322/caac.21492
3. Byun J, Schwartz AG, Lusk C, Wenzlaff AS, de Andrade M, Mandal D, et al. Genome-wide association study of familial lung cancer. Carcinogenesis. (2018) 39:1135–40. doi: 10.1093/carcin/bgy080
4. Frese KK, Simpson KL, and Dive C. Small cell lung cancer enters the era of precision medicine. Cancer Cell. (2021) 39:297–9. doi: 10.1016/j.ccell.2021.02.002
5. Langfelder P and Horvath S. Wgcna: an R package for weighted correlation network analysis. BMC Bioinf. (2008) 9:559. doi: 10.1186/1471-2105-9-559
6. Wu J, Zhao Y, Zhang J, Wu Q, and Wang W. Development and validation of an immune-related gene pairs signature in colorectal cancer. Oncoimmunology. (2019) 8:1596715. doi: 10.1080/2162402X.2019.1596715
7. Shen S, Wang G, Zhang R, Zhao Y, Yu H, Wei Y, et al. Development and validation of an immune gene-set based prognostic signature in ovarian cancer. EBioMedicine. (2019) 40:318–26. doi: 10.1016/j.ebiom.2018.12.054
8. Long J, Wang A, Bai Y, Lin J, Yang X, Wang D, et al. Development and validation of a tp53-associated immune prognostic model for hepatocellular carcinoma. EBioMedicine. (2019) 42:363–74. doi: 10.1016/j.ebiom.2019.03.022
9. Swanson K, Wu E, Zhang A, Alizadeh AA, and Zou J. From patterns to patients: advances in clinical machine learning for cancer diagnosis, prognosis, and treatment. Cell. (2023) 186:1772–91. doi: 10.1016/j.cell.2023.01.035
10. Bhattacharya S, Dunn P, Thomas CG, Smith B, Schaefer H, Chen J, et al. Immport, toward repurposing of open access immunological assay data for translational and clinical research. Sci Data. (2018) 5:180015. doi: 10.1038/sdata.2018.15
11. Wu T, Hu E, Xu S, Chen M, Guo P, Dai Z, et al. Clusterprofiler 4.0: A universal enrichment tool for interpreting omics data. Innovation (Camb). (2021) 2:100141. doi: 10.1016/j.xinn.2021.100141
12. Wilkerson MD and Hayes DN. Consensusclusterplus: A class discovery tool with confidence assessments and item tracking. Bioinformatics. (2010) 26:1572–3. doi: 10.1093/bioinformatics/btq170
13. Li T, Fan J, Wang B, Traugh N, Chen Q, Liu JS, et al. Timer: A web server for comprehensive analysis of tumor-infiltrating immune cells. Cancer Res. (2017) 77:e108–e10. doi: 10.1158/0008-5472.CAN-17-0307
14. Chen B, Khodadoust MS, Liu CL, Newman AM, and Alizadeh AA. Profiling tumor infiltrating immune cells with cibersort. Methods Mol Biol. (2018) 1711:243–59. doi: 10.1007/978-1-4939-7493-1_12
15. Bhattacharya S, Andorf S, Gomes L, Dunn P, Schaefer H, Pontius J, et al. Immport: disseminating data to the public for the future of immunology. Immunol Res. (2014) 58:234–9. doi: 10.1007/s12026-014-8516-1
16. Al-Dherasi A, Huang Q-T, Liao Y, Al-Mosaib S, Hua R, Wang Y, et al. A seven-gene prognostic signature predicts overall survival of patients with lung adenocarcinoma (Luad). Cancer Cell Int. (2021) 21:294. doi: 10.1186/s12935-021-01975-z
17. Soria J-C, Ohe Y, Vansteenkiste J, Reungwetwattana T, Chewaskulyong B, Lee KH, et al. Osimertinib in untreated egfr-mutated advanced non-small-cell lung cancer. N Engl J Med. (2018) 378:113–25. doi: 10.1056/NEJMoa1713137
18. Ladbury CJ, Rusthoven CG, Camidge DR, Kavanagh BD, and Nath SK. Impact of radiation dose to the host immune system on tumor control and survival for stage iii non-small cell lung cancer treated with definitive radiation therapy. Int J Radiat Oncol Biol Phys. (2019) 105:346–55. doi: 10.1016/j.ijrobp.2019.05.064
19. Giatromanolaki A, Koukourakis IM, Balaska K, Mitrakas AG, Harris AL, and Koukourakis MI. Programmed death-1 receptor (Pd-1) and pd-ligand-1 (Pd-L1) expression in non-small cell lung cancer and the immune-suppressive effect of anaerobic glycolysis. Med Oncol. (2019) 36:76. doi: 10.1007/s12032-019-1299-4
20. Tian H, Chen Y, Zhao J, Liu D, Liang G, Gong W, et al. Effects of sirnas targeting cd97 immune epitopes on biological behavior in breast cancer cell line mda-mb231. Zhejiang Da Xue Xue Bao Yi Xue Ban. (2017) 46:341–8. doi: 10.3785/j.issn.1008-9292.2017.08.01
21. Zhu B and Zhou X. the study of pi3k/akt pathway in lung cancer metastasis and drug resistance. Zhongguo Fei Ai Za Zhi = Chin J Lung Cancer. (2011) 14:689–94. doi: 10.3779/j.issn.1009-3419.2011.08.10
22. Wu Q, Wu W, Fu B, Shi L, Wang X, and Kuca K. Jnk signaling in cancer cell survival. Medicinal Res Rev. (2019) 39:2082–104. doi: 10.1002/med.21574
23. Mason MJ, Fan G, Plath K, Zhou Q, and Horvath S. Signed weighted gene co-expression network analysis of transcriptional regulation in murine embryonic stem cells. BMC Genomics. (2009) 10:327. doi: 10.1186/1471-2164-10-327
24. Botía JA, Vandrovcova J, Forabosco P, Guelfi S, D’Sa K, Hardy J, et al. An additional K-means clustering step improves the biological features of wgcna gene co-expression networks. BMC Syst Biol. (2017) 11:47. doi: 10.1186/s12918-017-0420-6
25. Hong S-Y, Kao Y-R, Lee T-C, and Wu C-W. Upregulation of E3 ubiquitin ligase cblc enhances egfr dysregulation and signaling in lung adenocarcinoma. Cancer Res. (2018) 78:4984–96. doi: 10.1158/0008-5472.CAN-17-3858
26. Hong S-Y, Lu Y-C, Hsiao S-H, Kao Y-R, Lee M-H, Lin Y-P, et al. Stabilization of aurka by the E3 ubiquitin ligase cblc in lung adenocarcinoma. Oncogene. (2022) 41:1907–17. doi: 10.1038/s41388-022-02180-6
27. Keane MM, Ettenberg SA, Nau MM, Banerjee P, Cuello M, Penninger J, et al. Cbl-3: A new mammalian cbl family protein. Oncogene. (1999) 18:3365–75. doi: 10.1038/sj.onc.1202753
28. Kim B, Lee HJ, Choi HY, Shin Y, Nam S, Seo G, et al. Clinical validity of the lung cancer biomarkers identified by bioinformatics analysis of public expression data. Cancer Res. (2007) 67:7431–8. doi: 10.1158/0008-5472.CAN-07-0003
29. Kim M, Tezuka T, Suziki Y, Sugano S, Hirai M, and Yamamoto T. Molecular cloning and characterization of a novel cbl-family gene, cbl-C. Gene. (1999) 239:145–54. doi: 10.1016/S0378-1119(99)00356-X
30. Storch J and Corsico B. The emerging functions and mechanisms of mammalian fatty acid-binding proteins. Annu Rev Nutr. (2008) 28:73–95. doi: 10.1146/annurev.nutr.27.061406.093710
31. Sun N and Zhao X. Therapeutic implications of fabp4 in cancer: an emerging target to tackle cancer. Front Pharmacol. (2022) 13:948610. doi: 10.3389/fphar.2022.948610
32. Yang J, Liu X, Shao Y, Zhou H, Pang L, and Zhu W. Diagnostic, prognostic, and immunological roles of fabp4 in pancancer: A bioinformatics analysis. Comput Math Methods Med. (2022) 2022:3764914. doi: 10.1155/2022/3764914
33. Li G, Wu Q, Gong L, Xu X, Cai J, Xu L, et al. Fabp4 is an independent risk factor for lymph node metastasis and poor prognosis in patients with cervical cancer. Cancer Cell Int. (2021) 21:568. doi: 10.1186/s12935-021-02273-4
34. Tang Z, Shen Q, Xie H, Zhou X, Li J, Feng J, et al. Elevated expression of fabp3 and fabp4 cooperatively correlates with poor prognosis in non-small cell lung cancer (Nsclc). Oncotarget. (2016) 7:46253–62. doi: 10.18632/oncotarget.10086
35. Su C-T and Urban Z. Ltbp4 in health and disease. Genes (Basel). (2021) 12(6):795. doi: 10.3390/genes12060795
36. Scollen S, Luccarini C, Baynes C, Driver K, Humphreys MK, Garcia-Closas M, et al. Tgf-β Signaling pathway and breast cancer susceptibility. Cancer Epidemiol Biomarkers Prev. (2011) 20:1112–9. doi: 10.1158/1055-9965.EPI-11-0062
37. Peng D, Fu M, Wang M, Wei Y, and Wei X. Targeting tgf-β Signal transduction for fibrosis and cancer therapy. Mol Cancer. (2022) 21:104. doi: 10.1186/s12943-022-01569-x
38. Yang X, Ye X, Zhang L, Zhang X, and Shu P. Disruption of ltbp4 induced activated tgfβ1, immunosuppression signal and promoted pulmonary metastasis in hepatocellular carcinoma. Onco Targets Ther. (2020) 13:7007–17. doi: 10.2147/OTT.S246766
39. Wang L, Tang D, Wu T, and Sun F. Disruption of ltbp4 inhibition-induced tgfβ1 activation promoted cell proliferation and metastasis in skin melanoma by inhibiting the activation of the hippo-yap1 signaling pathway. Front Cell Dev Biol. (2021) 9:673904. doi: 10.3389/fcell.2021.673904
40. Zhang D, Song Y, Li D, Liu X, Pan Y, Ding L, et al. Cancer-associated fibroblasts promote tumor progression by lncrna-mediated runx2/gdf10 signaling in oral squamous cell carcinoma. Mol Oncol. (2022) 16:780–94. doi: 10.1002/1878-0261.12935
41. Zhou T, Yu L, Huang J, Zhao X, Li Y, Hu Y, et al. Gdf10 inhibits proliferation and epithelial-mesenchymal transition in triple-negative breast cancer via upregulation of smad7. Aging (Albany NY). (2019) 11:3298–314. doi: 10.18632/aging.101983
42. He F, Feng G, Ma N, Midorikawa K, Oikawa S, Kobayashi H, et al. Gdf10 inhibits cell proliferation and epithelial-mesenchymal transition in nasopharyngeal carcinoma by the transforming growth factor-β/smad and nf-κb pathways. Carcinogenesis. (2022) 43(2):94–103. doi: 10.1093/carcin/bgab122
43. Fan J and Zhou H. Comprehensive analysis of gdf10 methylation site-associated genes as prognostic markers for endometrial cancer. J Oncol. (2022) 2022:7117083. doi: 10.1155/2022/7117083
44. Kruse B, Buzzai AC, Shridhar N, Braun AD, Gellert S, Knauth K, et al. Cd4+ T cell-induced inflammatory cell death controls immune-evasive tumours. Nature. (2023) 618:1033–40. doi: 10.1038/s41586-023-06199-x
45. van der Leun AM, Thommen DS, and Schumacher TN. Cd8+ T cell states in human cancer: insights from single-cell analysis. Nat Rev Cancer. (2020) 20:218–32. doi: 10.1038/s41568-019-0235-4
46. Wculek SK, Cueto FJ, Mujal AM, Melero I, Krummel MF, and Sancho D. Dendritic cells in cancer immunology and immunotherapy. Nat Rev Immunol. (2020) 20(1):7–24. doi: 10.1038/s41577-019-0210-z
47. Choi J, Gyamfi J, Jang H, and Koo JS. The role of tumor-associated macrophage in breast cancer biology. Histol Histopathology. (2018) 33:133–45. doi: 10.14670/HH-11-916
48. Cheng K, Cai N, Zhu J, Yang X, Liang H, and Zhang W. Tumor-associated macrophages in liver cancer: from mechanisms to therapy. Cancer Commun (London England). (2022) 42:1112–40. doi: 10.1002/cac2.12345
49. Roy-Chowdhuri S. Molecular pathology of lung cancer. Surg Pathol Clinics. (2021) 14:369–77. doi: 10.1016/j.path.2021.05.002
50. Paver E, O’Toole S, Cheng XM, Mahar A, and Cooper WA. Updates in the molecular pathology of non-small cell lung cancer. Semin In Diagn Pathol. (2021) 38:54–61. doi: 10.1053/j.semdp.2021.04.001
Keywords: lung adenocarcinoma, immune-related markers, weighted gene co-expression network analysis, machine learning, prognostic model
Citation: Zheng J, Xu X, Chen X, Li X, Fu M, Zheng Y and Yang J (2025) Construction and validation of immune prognosis model for lung adenocarcinoma based on machine learning. Front. Oncol. 15:1630663. doi: 10.3389/fonc.2025.1630663
Received: 18 May 2025; Accepted: 30 June 2025;
Published: 22 July 2025.
Edited by:
Oraianthi Fiste, National and Kapodistrian University of Athens, GreeceReviewed by:
Jing Wang, Mass General Brigham, United StatesXianglong Kong, Third Affiliated Hospital of Harbin Medical University, China
Copyright © 2025 Zheng, Xu, Chen, Li, Fu, Zheng and Yang. This is an open-access article distributed under the terms of the Creative Commons Attribution License (CC BY). The use, distribution or reproduction in other forums is permitted, provided the original author(s) and the copyright owner(s) are credited and that the original publication in this journal is cited, in accordance with accepted academic practice. No use, distribution or reproduction is permitted which does not comply with these terms.
*Correspondence: Jie Yang, eWFuZ2ppZTk2NzlAMTYzLmNvbQ==
†These authors have contributed equally to this work and share first authorship