 Zhenguang Chen1*†
 Minhua Peng2†
 Pengnan Fan2Sai Chen3Xinxin Cheng4Bo Xu1
 Ruiping Chen1Xiao Hu5Wei Wei5
 Tingting Zhao5Jun Kong2Weiliang Liang2Xiangcheng Qiu2Sitong Chen2Junqi Wang2,6*
- 1Department of Thoracic Surgery, The First Affiliated Hospital, Sun Yat-sen University, Guangzhou, Guangdong, China
- 2ChromX Health Co., Ltd., Guangzhou, Guangdong, China
- 3Center for Private Medical Service & Healthcare, The First Affiliated Hospital, Sun Yat-sen University, Guangzhou, Guangdong, China
- 4State Key Laboratory of Oncology in South China, Sun Yat-sen University Cancer Center, Guangzhou, Guangdong, China
- 5Department of Thoracic Surgery, Guizhou Hospital of the First Affiliated Hospital of Sun Yat-sen University, Guiyang, Guizhou, China
- 6Jingjinji National Center of Technology Innovation, Beijing, China
Objective: This study explores the feasibility of using breathomic biomarkers analyzed by machine learning as a non-invasive diagnostic tool to differentiate between benign and malignant thoracic lesions, aiming to enhance early detection of thoracic cancers and inform clinical decision-making.
Methods: This study enrolled 132 participants with confirmed diagnosis of lung cancer, esophageal cancer, thymoma, and benign diseases. Exhaled breath samples were analyzed by thermal desorption-gas chromatography-mass spectrometry. A logistic regression algorithm was employed to construct a classification model for benign and malignant thoracic lesions. This model was trained on a subset of 80 cases and subsequently validated in a separate set comprising 52 samples.
Results: A logistic regression model based on thirteen exhaled volatile organic compounds (VOCs) was developed to differentiate benign and malignant thoracic lesions. The 13-VOC model achieved an AUC of 0.85 (0.72, 0.96), accuracy of 0.79 (0.66, 0.88), sensitivity of 0.82 (0.67, 0.91), and a specificity of 0.71 (0.45, 0.88). It correctly classified 80% of lung cancer, 80% of thymoma, and 100% of esophageal cancer cases, distinguishing 71.4% of benign lesions. For lung cancer, the model achieved an AUC of 0.79 (0.57, 0.98), sensitivity of 0.80 (0.63, 0.91), and specificity of 0.63 (0.31, 0.86), with 81.8% accuracy in detecting early-stage (Stage 0 + I + II) disease. The model outperformed a 4-serum tumor marker panel in sensitivity (0.90 vs. 0.39, p < 0.001). Additionally, in a cohort of 58 cancer patients, model-predicted risk significantly decreased post-surgery (p < 0.01), indicating a strong correlation with disease burden reduction.
Conclusion: This study demonstrates the feasibility of utilizing breathomics biomarkers for developing a non-invasive machine learning model for the early diagnosis of thoracic malignancies. These findings provide a foundation for breath analysis as a promising tool for early cancer detection, potentially facilitating improved clinical decision-making and enhancing patient outcomes.

Graphical Abstract. This ML-based breathomics study employs TD-GC-MS to analyze 13 exhaled VOCs, achieving superior sensitivity to 4 serum markers in distinguishing lung/thymoma/esophageal cancers from benign conditions. Post-surgical risk reduction confirmed VOC biomarkers' correlation with disease burden.
Introduction
Thoracic malignancies, particularly lung and esophageal cancers, represent a significant global health burden. Lung cancer is the leading cause of cancer-related deaths worldwide, with nearly 2.5 million new cases and over 1.8 million fatalities in 2022 (1). Despite treatment advancements, the five-year survival rate remains below 20%, primarily due to diagnoses at advanced stages (2). Similarly, the prognosis for esophageal cancer is also bleak, with a five-year survival rate below 20% (3), mirroring the situation for lung cancer, as evidenced by 511,000 new cases and 445,000 deaths attributed to the disease worldwide in 2022 (1). Thymomas, though rare, can lead to serious complications like myasthenia gravis. While their global incidence is between 0.13 and 0.26 per 100,000 individuals (4), their impact on patients’ quality of life is significant. These factors underscore the urgent need for improved diagnostic modalities for thoracic malignancies. Current diagnostic approaches, including imaging and invasive procedures like biopsy, the gold standard for thoracic tumor diagnosis, face limitations such as the imprecision to reliably differentiate benign from malignant lesions and the risk of complications associated with invasive procedures (5, 6). Particularly, the limited sensitivity of conventional blood-based tumor marker assays is underscored by the fact that 60-70% of cases are diagnosed at late stages, primarily due to these methods’ inability to detect early biological changes and distinguish between overlapping clinical features, thereby delaying timely intervention (4, 7, 8). Therefore, there is an urgent need to develop more precise, non-invasive, and highly sensitive tools to improve the early detection and diagnostic accuracy of thoracic tumors.
Exhaled breath volatile organic compounds (VOCs) are carbon-based molecules, primarily derived from endogenous metabolic processes and systemic circulation. Over 3,000 VOCs have been identified, reflecting the complex metabolic activity within the human body (9–12). Disease processes (e.g., oxidative stress, inflammation) or pathogens (e.g., bacteria and viruses), can perturb normal metabolic pathways, including lipid peroxidation, amino acid metabolism, and carbohydrate metabolism, leading to unique alterations in the VOC profile, creating disease-specific signatures (13). These VOCs, diffusing from blood into breath, serve as dynamic biomarkers, enabling the detection of subtle changes associated with disease onset and progression. Breath analysis of these VOC profiles thus offers a non-invasive, real-time method for early disease detection (14). Previous studies have demonstrated the potential of breath VOCs as biomarkers in identification of a variety of cancers, including lung cancer (15–18), breast cancer (19), and gastrointestinal malignancies (20–22). Gordon et al. were pioneers in using gas chromatography-mass spectrometry (GC-MS) to identify alkenes in the breath of lung cancer patients (23). Kumar et al. reported that a panel of 12 VOCs detected using a profile-3 selected ion flow tube mass spectrometry instrument could distinguish esophageal cancer from normal controls, achieving an AUC of 0.97 in the initial analysis and 0.92 ± 0.01 in the validation set (24). However, research efforts have predominantly focused on distinguishing cancer patients from healthy controls, with limited emphasis on differentiating between benign diseases and cancer patients. Furthermore, to the best of our knowledge, no studies have investigated the use of VOCs as biomarkers for identifying thymomas so far. This distinction is particularly important in thoracic tumors, where benign diseases such as granulomas or hamartomas may mimic malignancies on medical imaging, leading to diagnostic uncertainty and potentially unnecessary invasive procedures.
This study introduces a novel machine learning model that employs a comprehensive panel of breath-derived VOC biomarkers analyzed using GC-MS to achieve simultaneous early detection of lung cancer, esophageal cancer, and thymoma—the first breathomics-based strategy for multi-thoracic cancer diagnosis. By evaluating pre/postoperative predictions, we will assess its potential for real-time postoperative monitoring. Notably, we will also compare the sensitivity of this breath-based approach with conventional blood-based tumor markers, with the goal of providing a non-invasive solution for early detection and postoperative monitoring of thoracic cancers.
Methods
Study design and participants
This cross-sectional study, conducted from November 2021 to January 2022 at the East Division of the First Affiliated Hospital of Sun Yat-sen University in Guangzhou, China, received approval from the Ethics Committee of the First Affiliated Hospital of Sun Yat-sen University (No. 2022-016). All subjects provided signed informed consent. Inclusion criteria were adult participants aged 18–80 years with clinical suspicion of malignant thoracic tumors, supported by imaging evidence (CT/PET-CT) and a multidisciplinary team (MDT) assessment prior to histological confirmation. Eligible participants encompassed treatment-naïve, newly diagnosed thoracic cancer patients scheduled for surgical resection for diagnostic evaluation, and patients with a history of treated or recurrent thoracic malignancy, provided comprehensive treatment records were available. Exclusion criteria encompassed individuals who were unwilling or unable to provide in-person informed consent, those with unqualified breath samples, patients with relapsed diseases and incomplete treatment histories, individuals suffering from other malignant tumors, those with severe bronchial asthma or confirmed tuberculosis, and those with severe liver damage or kidney diseases. Each participant had undergone resection surgery and was pathologically confirmed to be categorized into one of the following groups: lung cancer, thymoma, esophageal cancer, and benign disease controls. Demographic and clinical information were meticulously recorded and collected. This study was registered in the Chinese Clinical Trial Registry (Registration No.: ChiCTR2200061264).
Exhale breath collection
All samples were collected following the same standardized procedure. Prior to collection, subjects were asked to rinse their mouths with purified water and rest for 15 minutes to stabilize their respiratory patterns. All subjects were required to abstain from food and beverages except water and smoking for at least 12 hours before the collection. To minimize the influence of diurnal metabolic variations, all collections were scheduled between 7:00 AM and 9:00 AM.
Subjects were instructed to remain seated and breathe normally through a mask for 3 minutes. During exhalation, breath samples were concurrently drawn through a breath sampler (CXBC-Alpha, ChromX Health Co., Ltd) containing an internal sampling pump and a flow control module (Figure 1). 900 mL of breath samples were collected at a rate of 300 mL/min and directed into thermal desorption tubes. These tubes, pre-conditioned with 99.9% nitrogen gas to ensure a clean and inert environment, contained Carbopack X and Carbopack B for sample enrichment, concentrating the target compounds for later analysis. All collected samples were sealed with inert end caps immediately and stored at -20°C to maintain their integrity and analyzed by thermal desorption-gas chromatography-mass spectrometry (TD-GC-MS) within 7 days to ensure timely and accurate results.
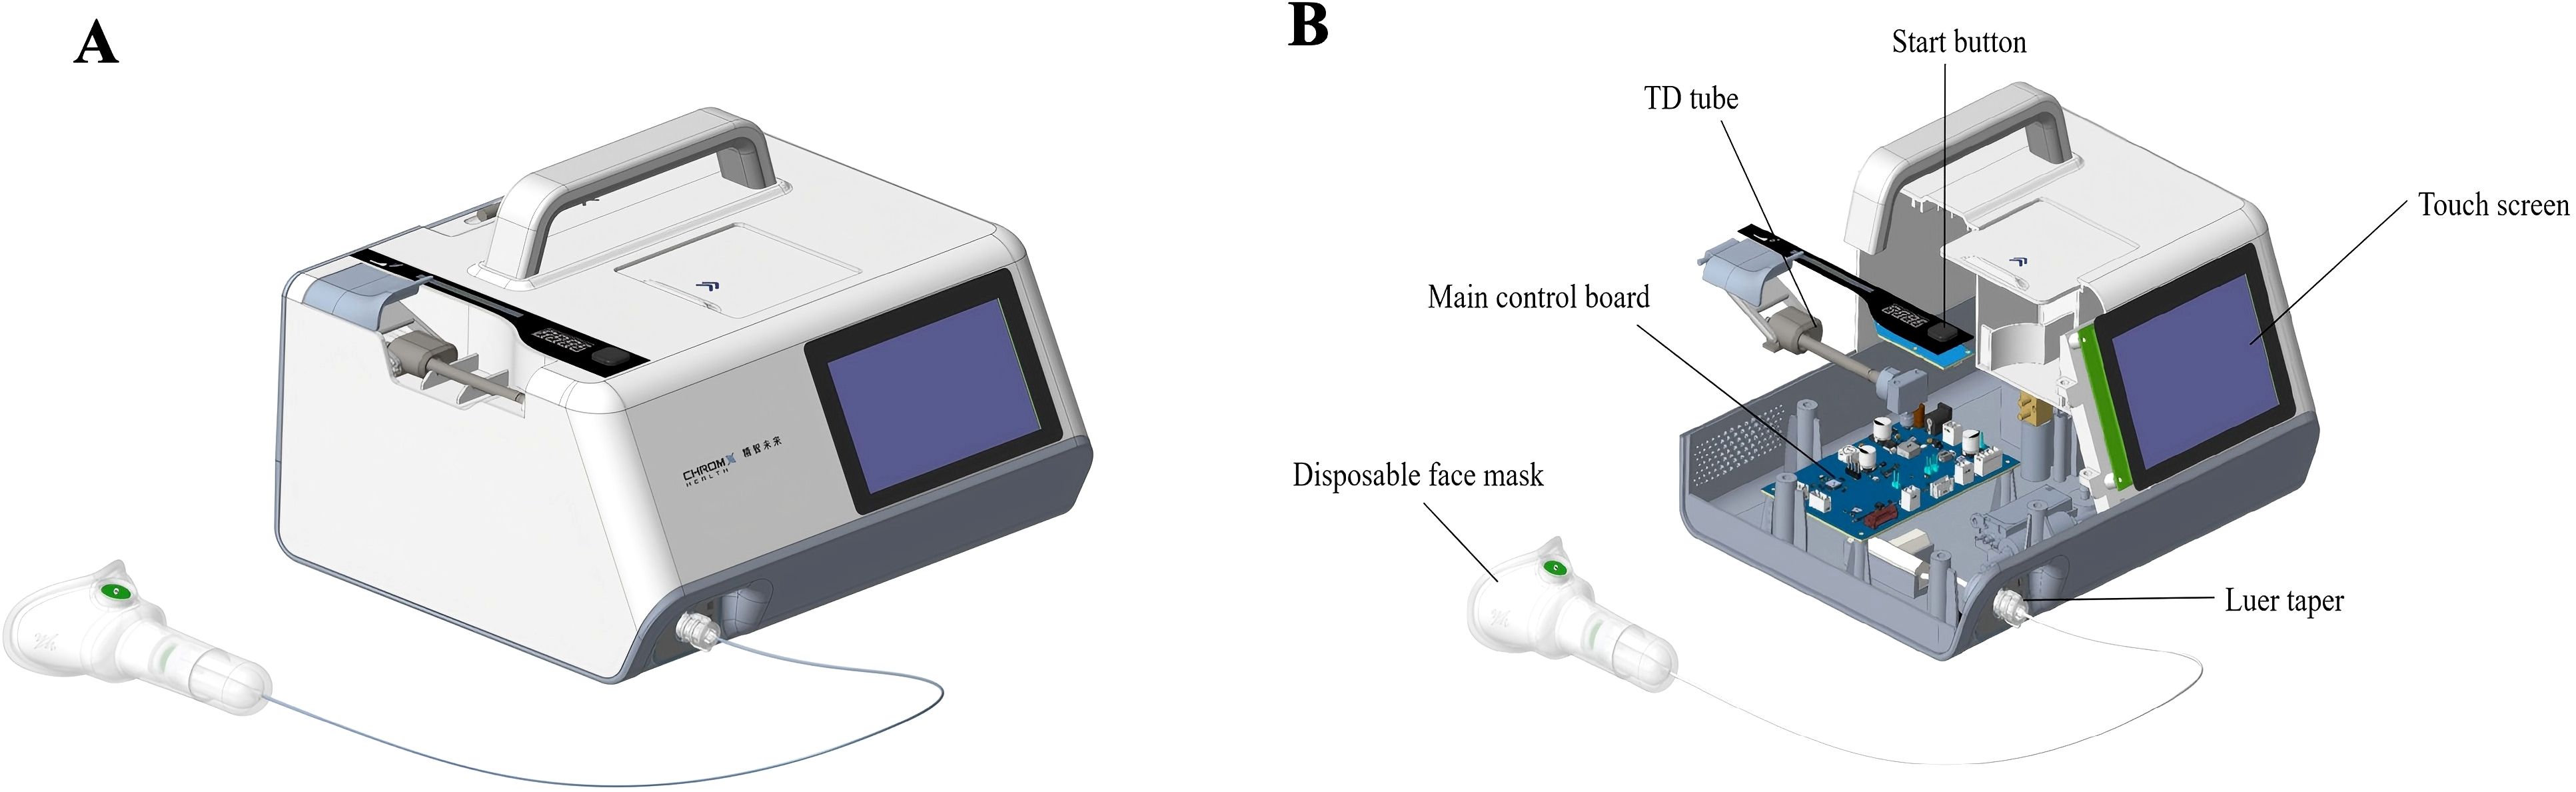
Figure 1. Exhaled breath collection device. The images depicted the schematic diagram (A) and sectional view (B) of the exhaled breath collection device.
TD-GC-MS analysis
Breath samples were analyzed by TD-GC-MS using a system incorporating a high-throughput autosampler, a thermal desorber (TD100-xr, MARKES), and an 7890B-5977A GC/MSD (Agilent Technologies). Separation was performed on an HP-5MS capillary column with nitrogen carrier gas. The mass spectrometer operated in electron ionization (EI) mode at 70 eV, acquiring data in full scan mode (m/z 33-450). Detailed instrument parameters are provided in Supplementary Materials.
GC-MS quantification and pre-analysis quality control
Raw GC-MS data were processed using MSDial v5.4 for peak detection, quantification, and alignment. The software generated matrices of peak area (VOC area matrix) and signal-to-noise ratio (SNR matrix). Prior to statistical analysis, a data preprocessing and filtering protocol was implemented in Python 3.9.18 to ensure data robustness. Firstly, the signal-to-noise ratio (SNR) matrix was used to assess response reliability. A VOC measurement was classified as valid if its SNR value exceeded 10; measurements below this threshold were excluded due to significant noise interference. For individual samples, the response rate was calculated as the percentage of valid VOC measurements relative to the total measurements in the sample. Samples with a response rate ≥80% were retained for further analysis. Similarly, compound-specific response rates were determined for each VOC by calculating the proportion of valid measurements across all samples. To ensure analytical robustness, only VOCs with a response rate ≥50% were included in the validated dataset, which was designated as the “valid VOC area matrix”. Secondly, the valid VOC area matrix was then log10-transformed to address heteroscedasticity, followed by normalization to account for variations in instrument response and sample loading. These steps enabled meaningful comparison of VOC abundances across samples.
Dataset partition
A dataset of 132 participants with malignant or benign thoracic lesions was used in this study, comprising 97 malignant and 35 benign samples. For biomarker discovery and model development, the dataset was randomly split into a discovery set (60%, n = 79; 59 malignant, 20 benign) and a testing set (40%, n = 53; 38 malignant, 15 benign). The discovery set (training set) was used for feature selection and model training, while the testing set served for independent model evaluation.
Biomarker screening
To identify VOCs differentially expressed between malignant and benign thoracic lesions, two complementary approaches were employed. First, the Wilcoxon rank-sum test was used to assess the distribution of individual VOCs across the two groups, generating corresponding p-values. Second, orthogonal partial least squares-discriminant analysis (OPLS-DA) was performed to evaluate the collective contribution of VOCs to group classification and to calculate variable importance in projection (VIP) scores (25). VOCs meeting both criteria of a p - value < 0.05 and a VIP score > 1 were selected as candidate biomarkers.
Putative biomarker identification was subsequently conducted using Agilent MassHunter Qualitative Analysis 10.0 software and the NIST 17 mass spectral library. Finally, metabolic pathway-associated VOCs reported in the literature were selected as candidate biomarkers for inclusion in diagnostic model development.
Machine learning algorithms selection and evaluation
Given the complexity inherent in omics data, it is essential to identify the most suitable model for the dataset at hand. To this end, five commonly used machine learning algorithms were systematically evaluated: logistic regression (LR) (26), random forest (RF) (27), k-nearest neighbors (KNN) (28), eXtreme Gradient Boosting (XGBoost) (29), and support vector machine (SVM) (30). Among these, logistic regression algorithm demonstrated the highest robustness and effectiveness, based on its superior performance across both the discovery and testing datasets. Consequently, logistic regression model was deployed for diagnostic prediction.
Feature selection
To minimize overfitting, a progressive feature selection approach was employed. Biomarkers were ranked by their area under the receiver operating characteristic curve (ROC-AUC) scores. A logistic regression model was trained using 5-fold cross-validation with stratified sampling, iteratively adding one feature at a time, starting with the highest-ranked biomarker. This process continued until no further significant improvement in model performance was observed.
Hyperparameter optimization
With the optimal feature subset identified, logistic regression hyperparameters were tuned using grid search with stratified sampling. The following hyperparameters were considered: regularization method, regularization strength, early stopping criteria, and class weights. The parameter combination that yielded the highest AUC score was selected for final model training.
Final model evaluation
The final logistic regression model, incorporating the optimized feature subset and hyperparameters, was trained on the training dataset. The model was then finalized, and a classification threshold was determined using the Youden index. Subsequently, the model’s performance was evaluated independently on the validation dataset. Performance was assessed using five metrics: F1-score, accuracy, sensitivity, specificity, and AUC, along with their respective confidence intervals. Further analyses were performed using this finalized model.
Statistical analysis
Statistical analyses were performed using Python (version 3.9.18). Continuous variables are presented as mean ± standard deviation or median [min, max], as appropriate. Categorical variables are presented as counts and percentages. The Wilcoxon rank-sum test was used to compare continuous variables between independent groups (e.g., malignant vs. benign). The Chi-square test was used to compare categorical variables. ROC analysis was performed using scikit-learn python (v1.5.1). 95% confidence intervals (95% CI) for AUC, F1-score, sensitivity, specificity, and accuracy were calculated using a binomial distribution. All statistical tests were two-sided, with a significant level of α = 0.05, unless otherwise stated.
Results
Study population
145 participants were enrolled in this study. Exclusion criteria were applied to exclude individuals outside the age range of 18 to 80 years, those who declined participation, and those who provided invalid breath samples, resulting in a final cohort of 132 eligible participants for analysis. Among these, 77 were diagnosed with lung cancer, 13 with thymoma, 7 with esophageal cancer, and 35 had benign diseases, as confirmed by pathological results (Figure 2). The demographic and clinical data of these participants are presented in Table 1. Statistical comparisons between the case and control groups were conducted on basic demographic characteristics, including age, gender, body mass index (BMI), smoking and alcohol consumption status, and family cancer history. As detailed in Table 1, no significant difference was observed in these factors.
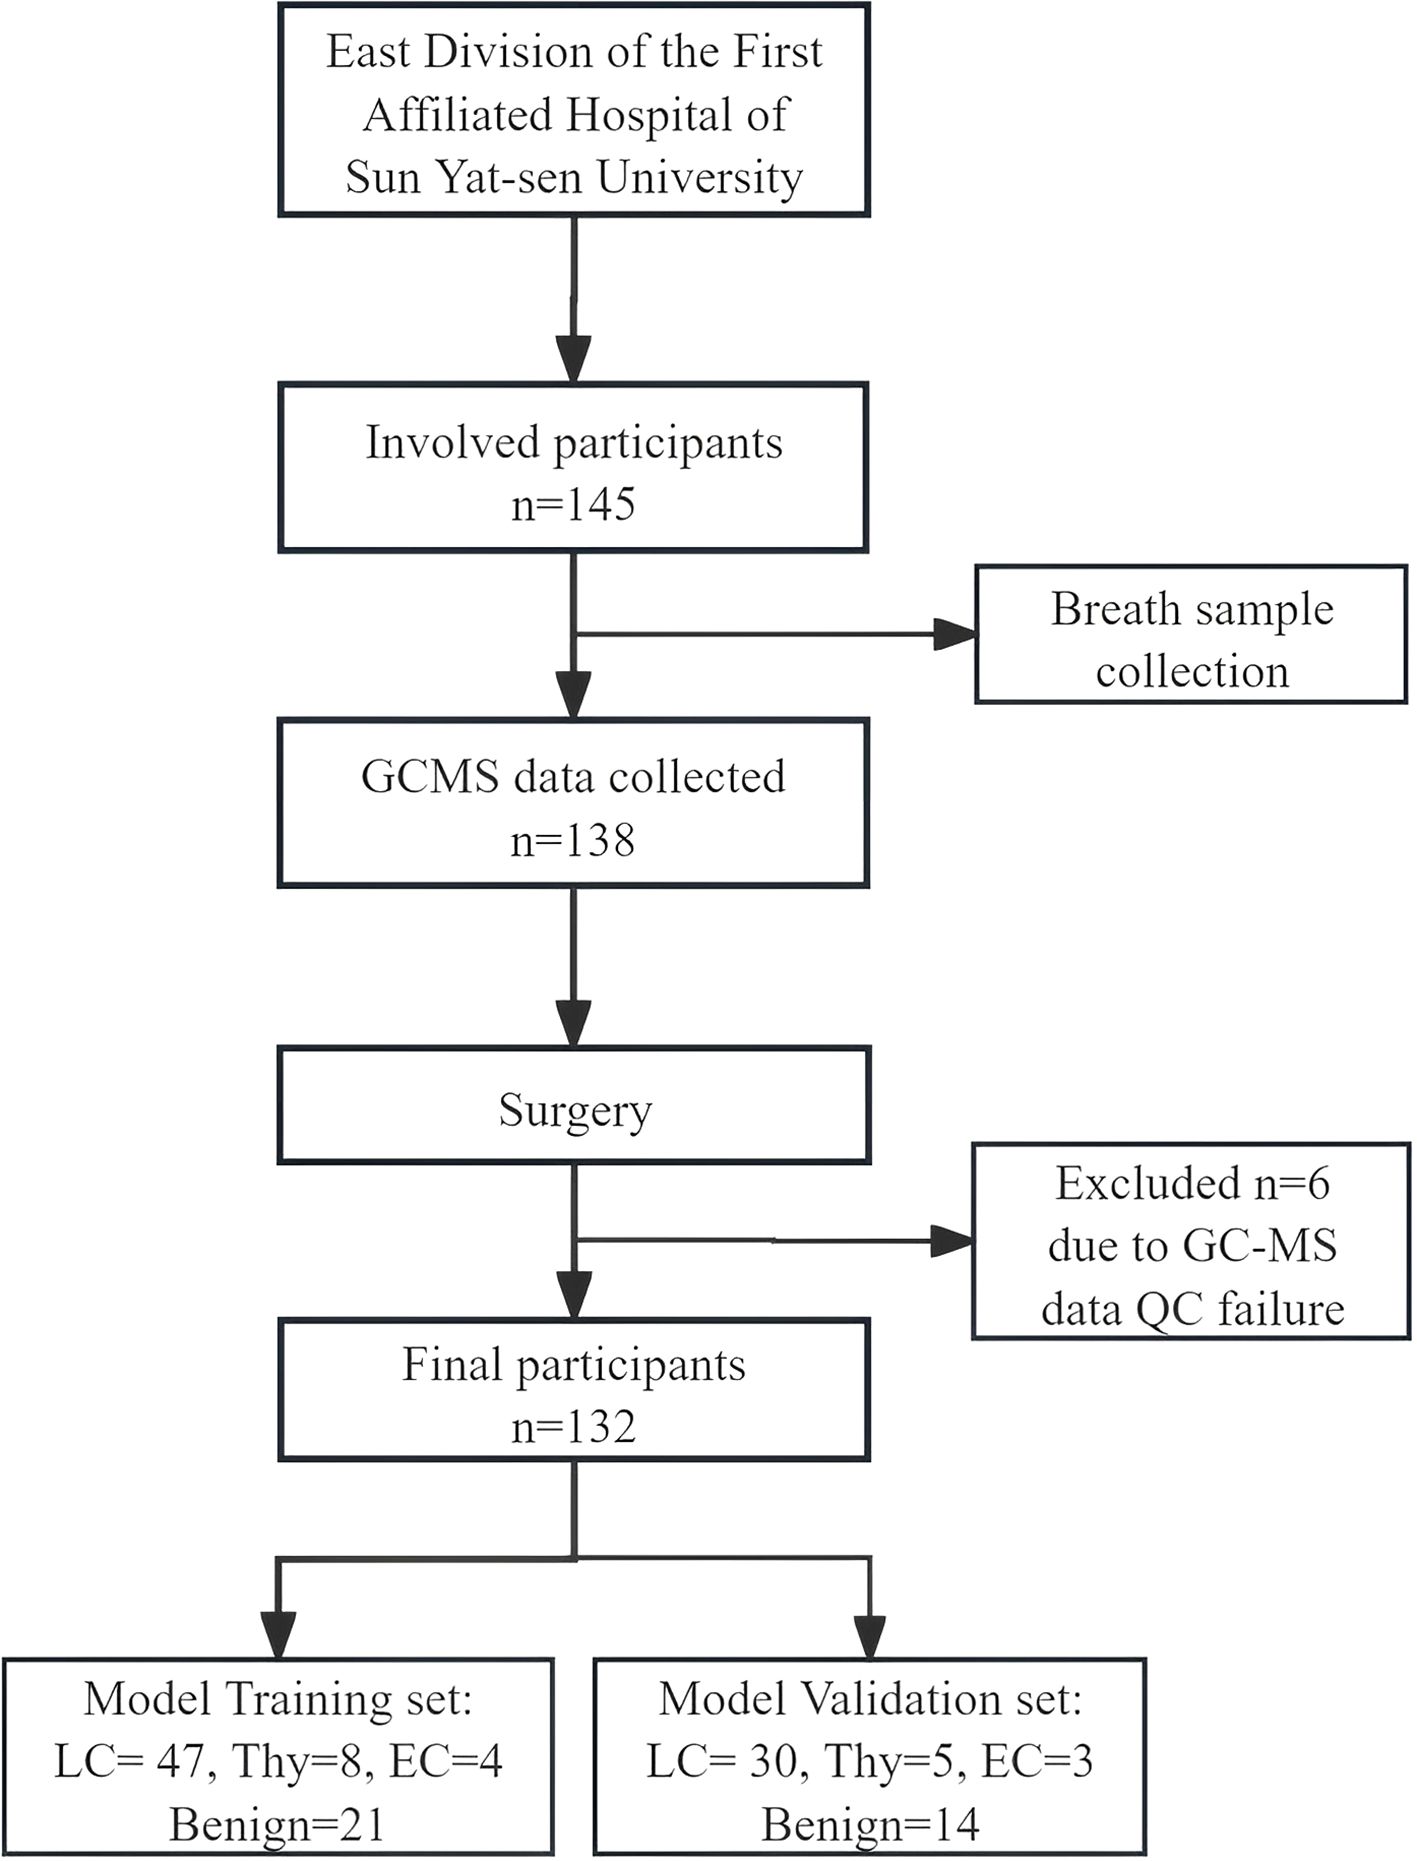
Figure 2. Schematic representations of the research framework.
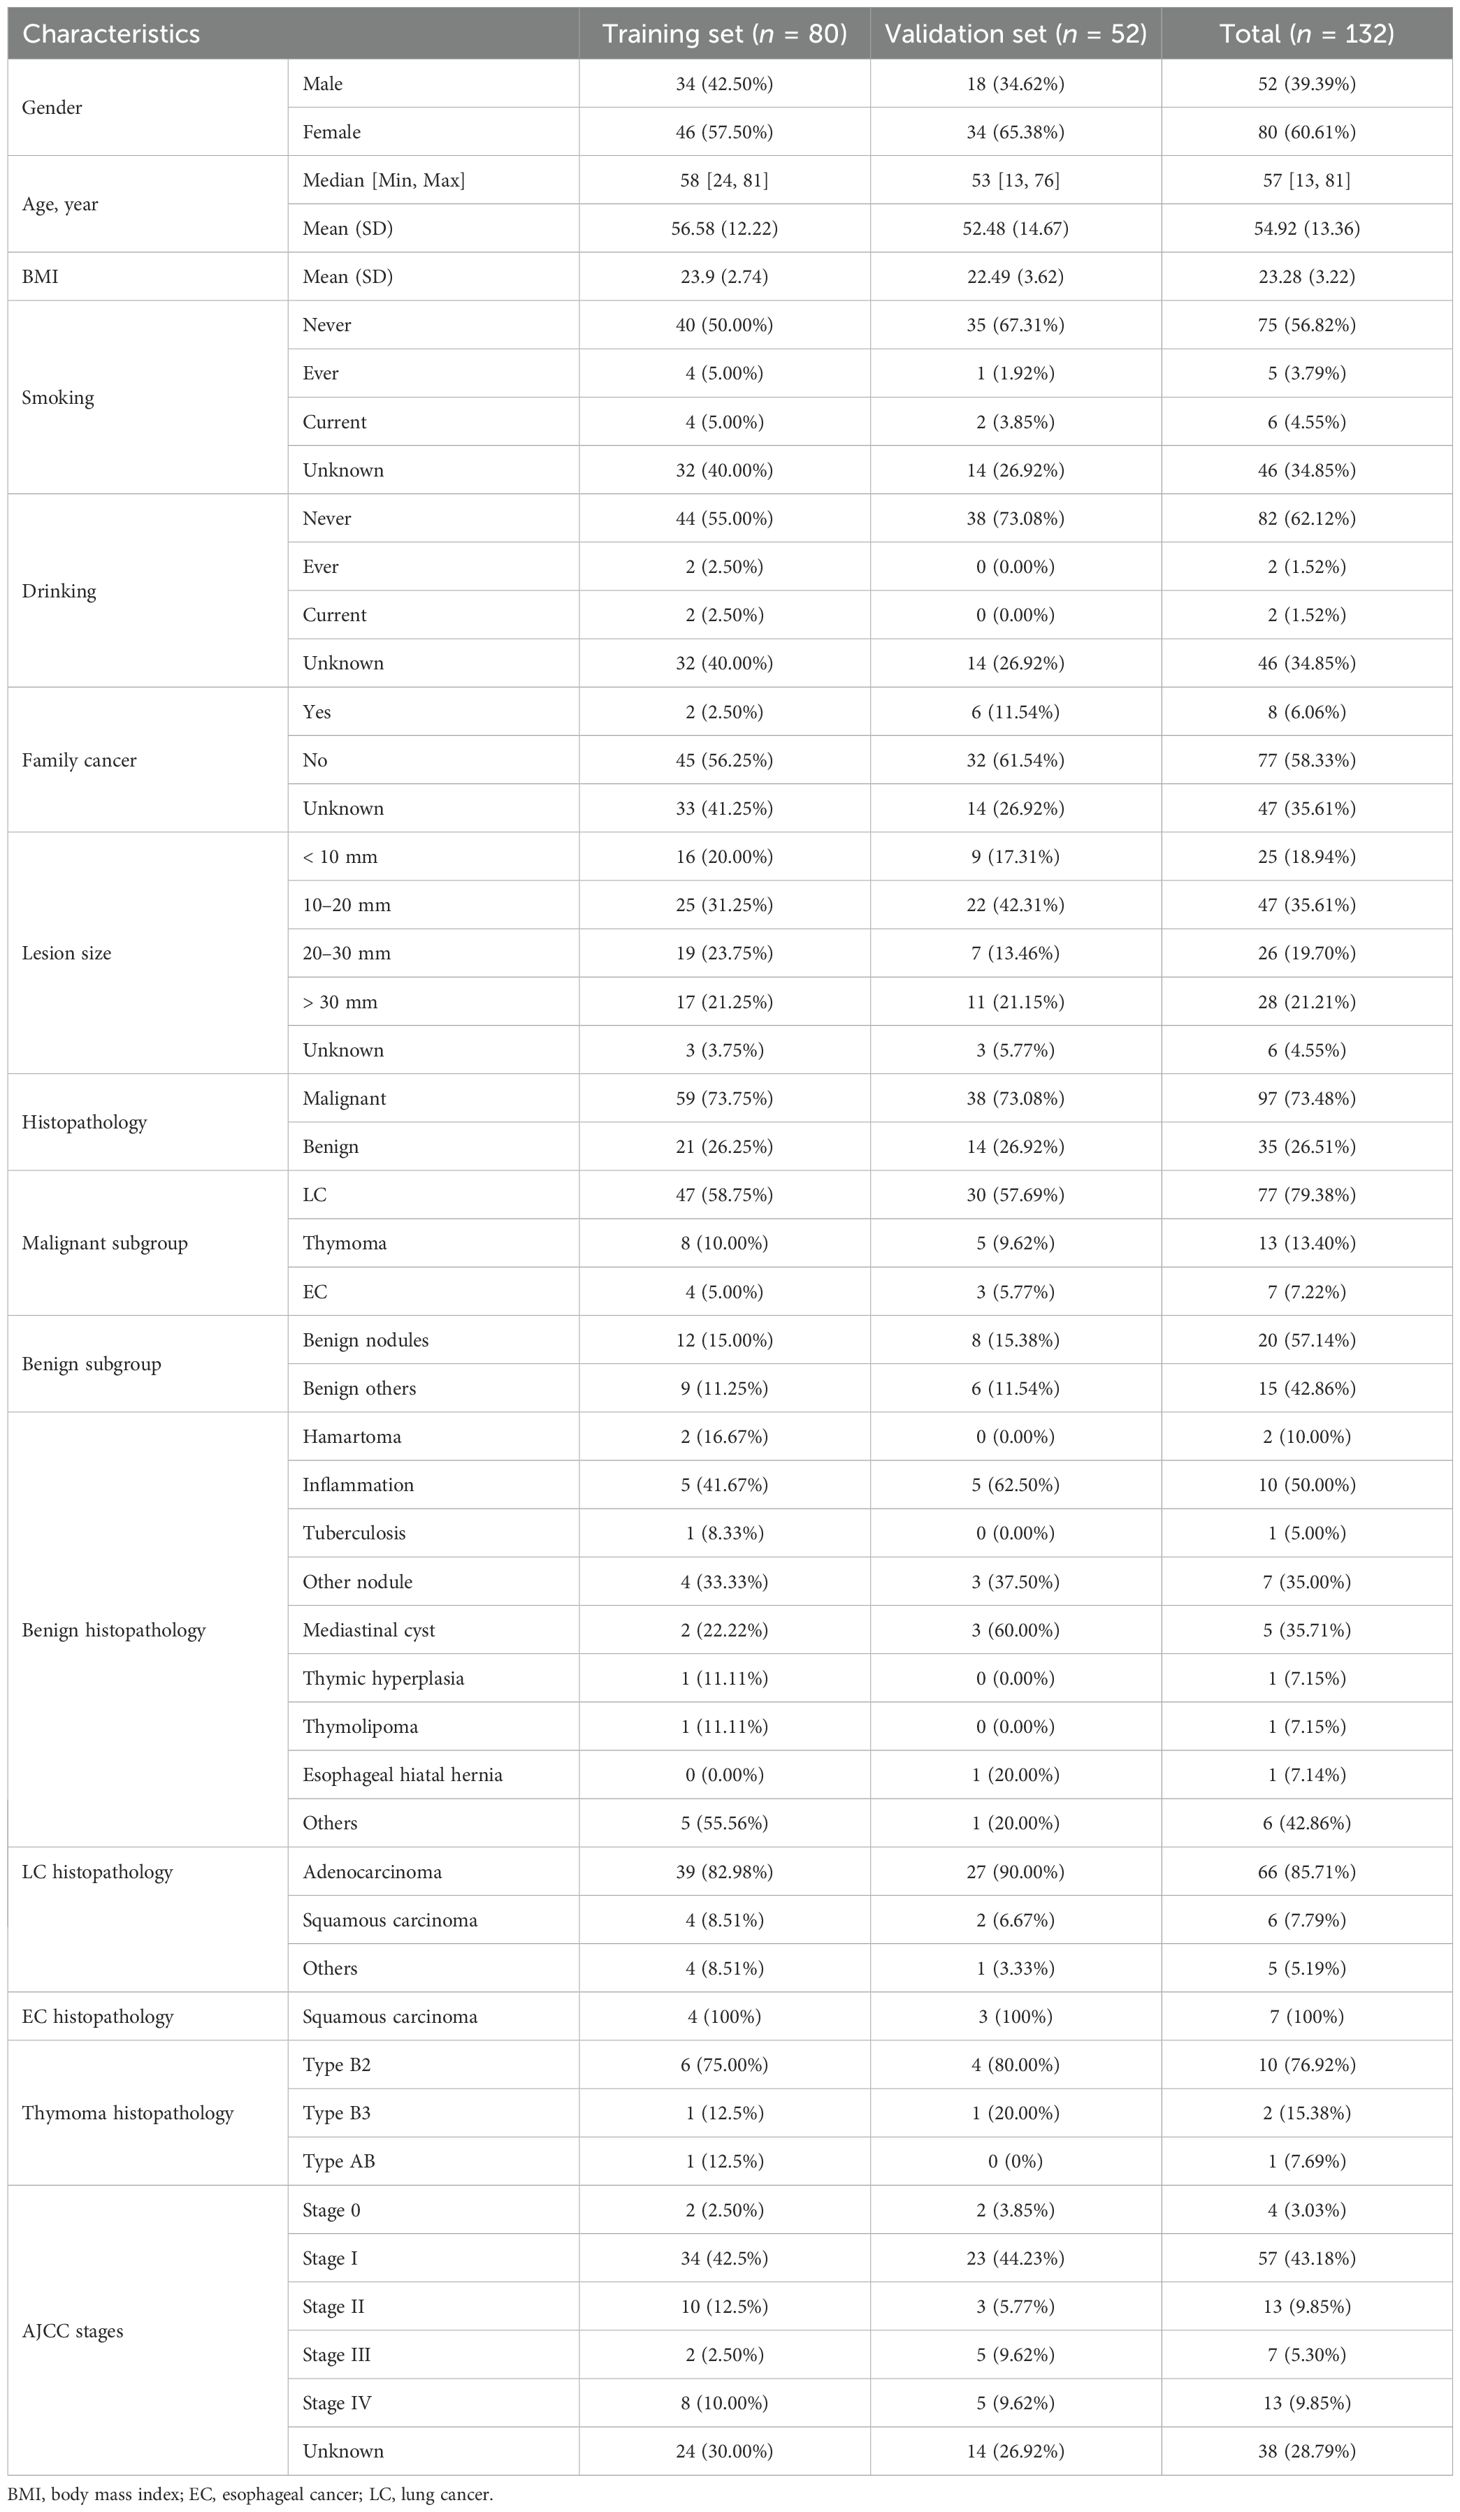
Table 1. Patient demographic and clinical characteristics.
VOC identification and feature selection
Initial statistical screening using the Wilcoxon rank-sum test and OPLS-DA revealed twenty-seven VOCs that exhibited differential abundance (p < 0.05) and high VIP scores (VIP > 1) when comparing exhaled breath samples from malignant and benign groups. These candidate VOCs then underwent compound identification and further refinement to exclude those associated with drug metabolism, environmental contaminants, or unrelated to the disease pathology. This rigorous filtering process ultimately yielded a final set of 18 potentially disease-relevant VOCs (Supplementary Table S1).
Diagnostic model selection and feature optimization
To identify the optimal diagnostic model for differentiating benign from malignant thoracic lesions, five machine learning algorithms including logistic regression, SVM, random forest, KNN, and XGBoost were trained using the pre-selected panel of 18 VOCs. Comparison of the models revealed that logistic regression demonstrated robust performance in both the training and validation sets, achieving AUCs of 0.85 (95% CI: 0.82, 0.89) and 0.83 (0.80, 0.89), respectively (Figure 3A; Supplementary Table S2). The DeLong test indicated that logistic regression significantly outperformed the KNN, XGBoost, and SVM models in both datasets (p < 0.05). Furthermore, when compared to the random forest model, logistic regression demonstrated superior performance in the validation set (p < 0.01). Consequently, the logistic regression model was selected for further analysis and performance evaluation.
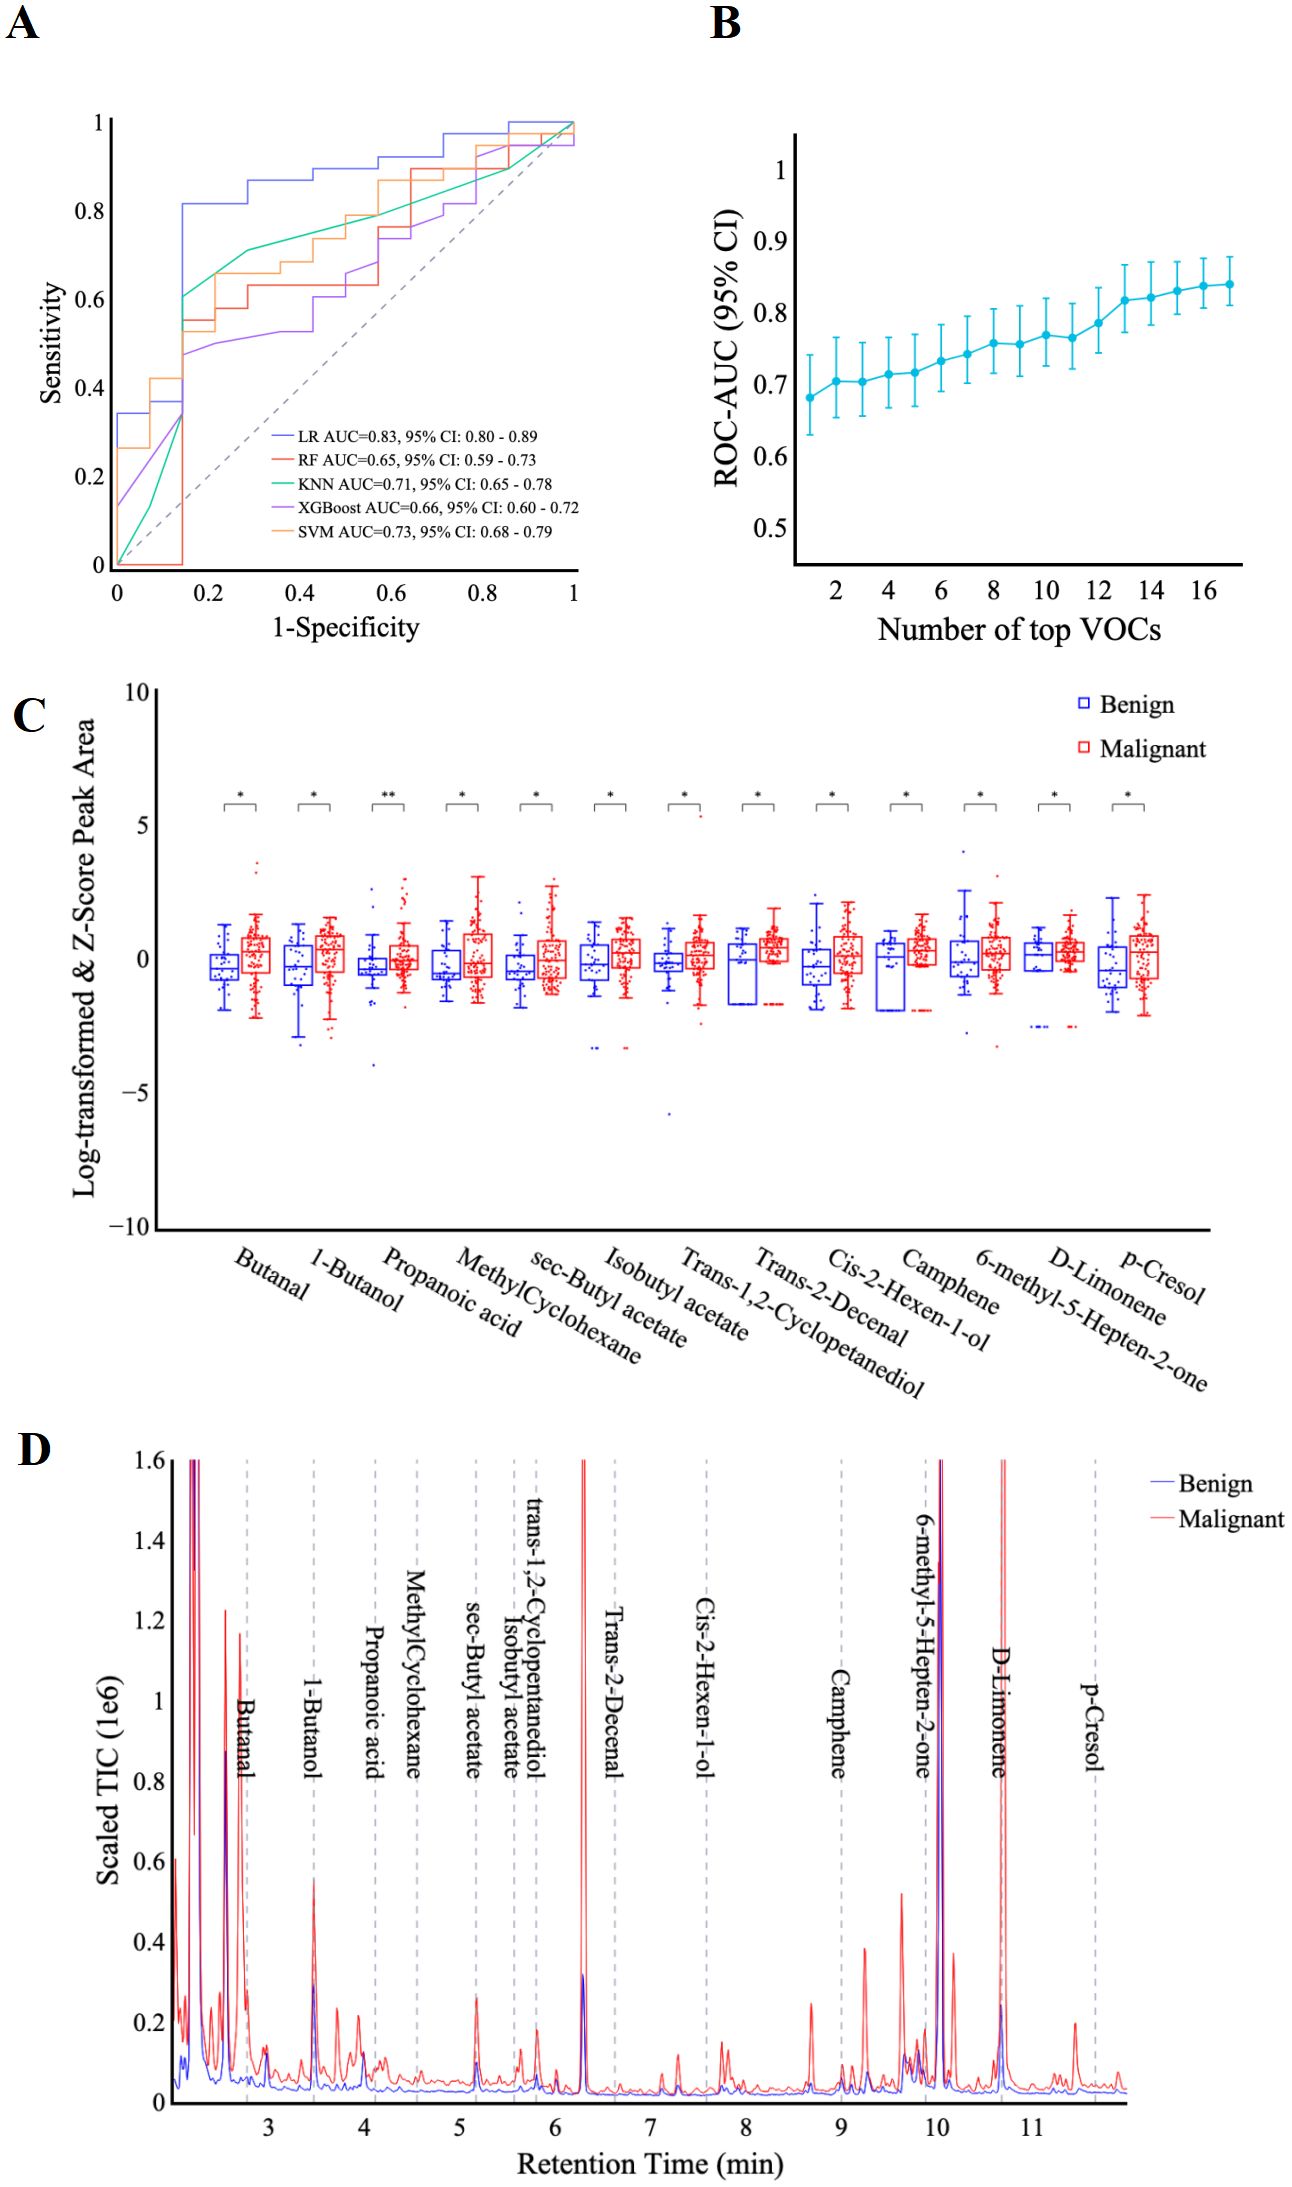
Figure 3. VOC identification and feature selection. (A) ROC curves display the classification performance of the VOC-models using five machine learning algorithms including LR, RF, KNN, XGBoost, and SVM. (B) the graph shows AUC values (y-axis) against the number of features (x-axis) in the VOC-model training set. (C) box plots comparing the scaled peak area of 13 VOCs in benign and malignant patients. y-axis: scaled VOC peak area by log-transformation and z-score normalization. Significance levels are denoted as follows: * p < 0.05, ** p < 0.01 (Rank-sum test). (D) representative chromatograph of 13 selected VOCs in malignant vs. benign patients. Scaled Total Ion Chromatogram TIC (Real TIC/1M).
Final feature selection was conducted using the logistic regression algorithm to optimize model performance. Analysis of the AUC as a function of the number of top features revealed diminishing returns beyond 13 features. As incorporating additional features did not substantially improve the AUC, the top 13 features were selected for model development (Figure 3B). These identified compounds represent a diverse range of hydrocarbons, including methyl-cyclohexane, camphene, and d-limonene, as well as oxygenated species such as butanal, 1-butanol, propanoic acid, and p-cresol. Table 2 provides a comprehensive list of these compounds and their corresponding discriminant values. Analysis of the scaled VOC peak area (Figure 3C) demonstrated that all 13 VOCs were present at elevated levels in the malignant group (p < 0.05). A representative chromatogram of the 13 VOCs in malignant and benign samples was shown in Figure 3D.
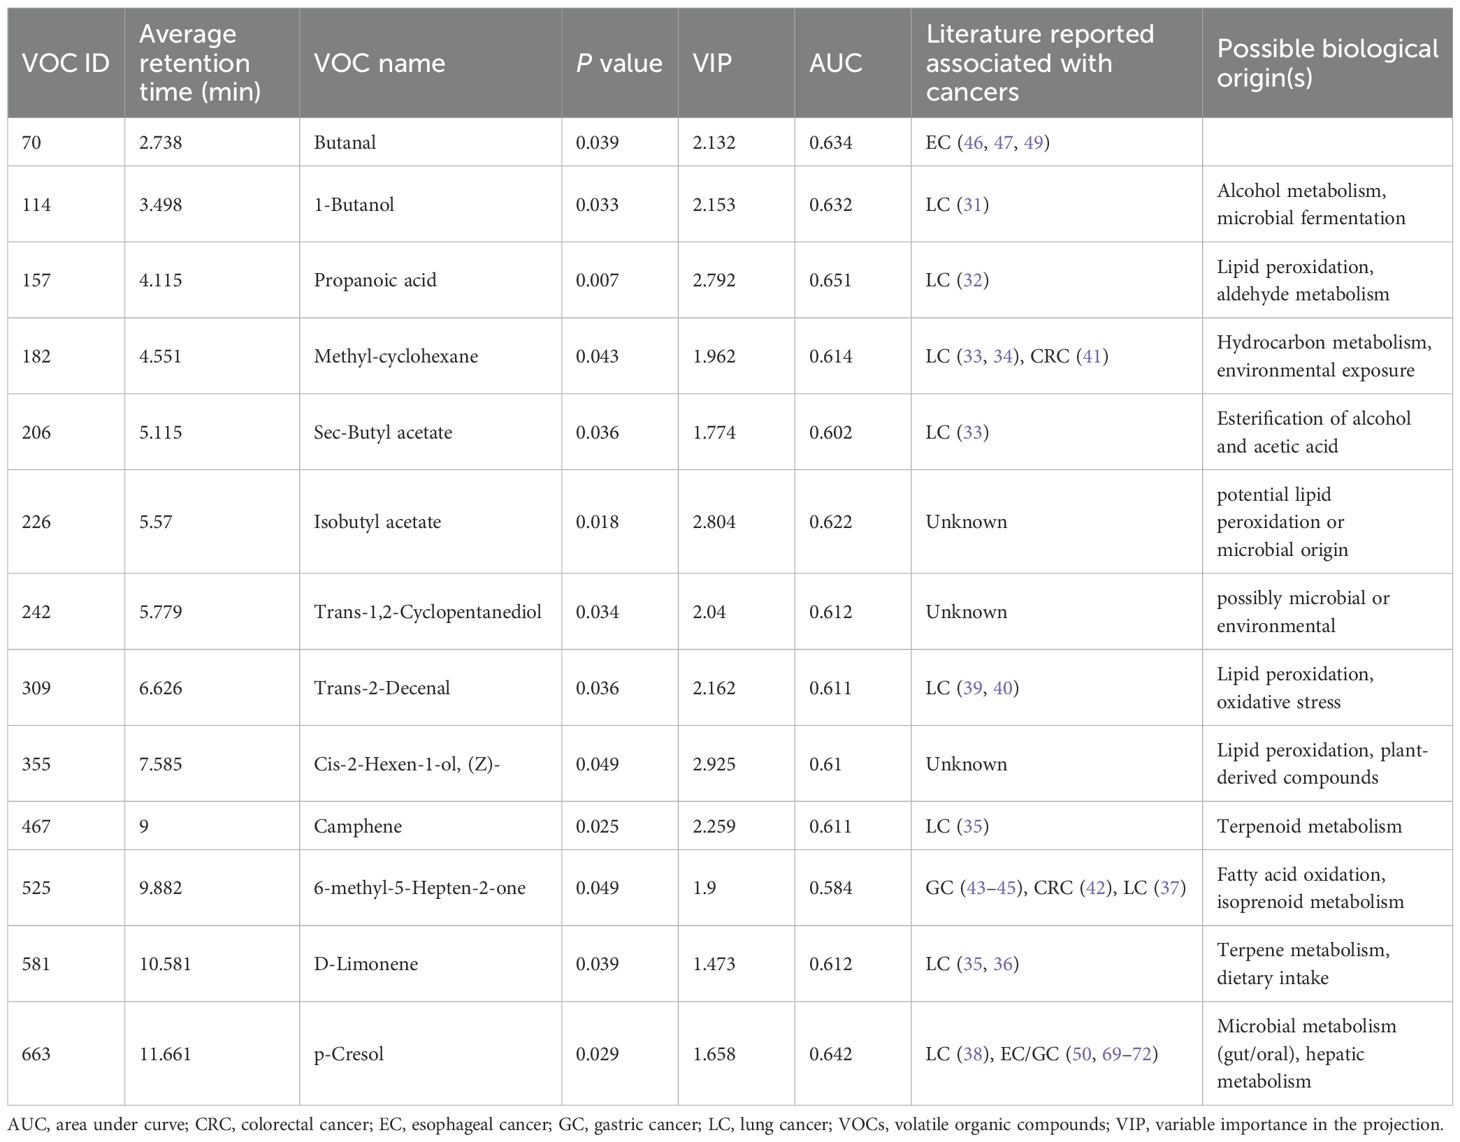
Table 2. 13 VOCs identified for model development.
Model performance in distinguishing benign from malignant thoracic lesions
In the training set (n = 80), the 13-VOC model demonstrated excellent performance with an AUC of 0.86 (0.83, 0.90), an accuracy of 0.83 (0.73, 0.89), a sensitivity of 0.86 (0.76, 0.93), and a specificity of 0.71 (0.50, 0.86). In the validation set (n = 52), the 13-VOC model achieved an AUC of 0.85 (0.81, 0.90), an accuracy of 0.79 (0.66, 0.88), a sensitivity of 0.82 (0.67, 0.91), and a specificity of 0.71 (0.45, 0.88), confirming its generalizability and clinical applicability (Figure 4A; Supplementary Table S3).

Figure 4. Model performance in distinguishing benign from malignant thoracic lesions. (A–D, G), ROC curves for the 13-VOCs model in distinguishing malignant (A) vs. benign, lung cancer (B) vs. benign all, thymoma (C) vs. benign all, esophageal cancer (D) vs. benign all, and lung cancer (G) vs. benign nodules. (E, F), Scatter plot depicting the relationship between VOC model prediction scores and the first principal component (PC1) in the training (E) and validation (F) sets, respectively. Each point represents an individual sample. The vertical red dashed line indicates the VOC model cutoff score of 0.64 used to discriminate between malignant and benign groups. (H, I), VOC model prediction scores for individual samples (SampleID) across lung cancer and benign nodule groups in the training (H) and validation (I) sets, respectively. Samples are color-coded by category. The red dashed horizontal line represents the VOC model cutoff score of 0.64 used to distinguish between groups. Thymoma (n=13) and esophageal cancer (n=7) analyses are exploratory (limited sample size) and serve as hypothesis-generating observations.
To further evaluate the performance of the detection model for individual cancer types, a subgroup analysis was conducted across various malignant thoracic lesions. Thymoma (n=13) and esophageal cancer (n=7) analyses are exploratory due to limited sample size and serve as hypothesis-generating observations. In the training set, the AUCs for lung cancer, thymoma, and esophageal cancer were 0.88 (0.85, 0.90), 0.81 (0.75, 0.88), and 0.80 (0.70, 0.96), respectively. In the validation set, corresponding AUCs were 0.84 (0.80, 0.90) for lung cancer, 0.86 (0.79, 1.00) for thymoma, and 0.91 (0.83, 0.95) for esophageal cancer (Figures 4B–D). To further visualize the model’s performance, prediction values for each participant were plotted against their actual disease status (lung cancer/thymoma/esophageal cancer vs. benign). Using a classification threshold of 0.64, the model achieved a high accuracy in the training set, correctly identifying 87.2% (75-94%) of lung cancer, 87.5% (53-98%) of thymoma, and 75% (30-95%) of esophageal cancer cases (Figure 4E). In the validation set, the model maintained high accuracy, correctly classifying 80% (63-91%) of lung cancer, 80% (38-96%) of thymoma, and 100% (44-100%) of esophageal cancer cases (Figure 4F). Additionally, the model demonstrated good specificity for benign lesions, correctly identifying 71.4% (50-86%, 45-88%) of such cases in both the training and validation sets (Figures 4E–F). These findings emphasize the model’s robust performance and generalized applicability in detecting various malignant thoracic lesions. Importantly, its ability to differentiate benign lesions underscores its potential to minimize unnecessary interventions and overtreatment, supporting its use in clinical practice.
Model performance in differentiating pulmonary lesions and across different lung cancer AJCC stages
Building upon previous findings, we further investigated the model’s ability to differentiate malignant and benign pulmonary lesions. In the training set (n = 59), the 13-VOC model achieved an AUC of 0.82 (0.68, 0.95), sensitivity of 0.89 (0.77, 0.95), and specificity of 0.58 (0.32, 0.81). In the validation set (n = 38), the model exhibited an AUC of 0.79 (0.57, 0.98), sensitivity of 0.80 (0.63, 0.91), and specificity of 0.63 (0.31, 0.86) (Figure 4G; Supplementary Table S3).
Early detection of lung cancer is critical in clinical practice, allowing for timely interventions and curative resections that substantially increase patient survival rates. To assess our model’s efficacy in diagnosing early lung cancer, we used the model to differentiate between various lung cancer stages and benign nodules. The predictive performance of the model was graphically demonstrated by plotting individual participant predictions against their corresponding ground truth classifications (lung cancer stages or benign nodule). With a predetermined classification cut-off at 0.64, the 13-VOC model demonstrated strong performance in identifying early-stage lung cancer, achieving high accuracy for stage 0 + I + II lung cancer (85.7% [70.6-93.7%]) and stage III + IV lung cancer (88.9% [56.5-98%]) in the training set, though the accuracy for benign nodules was comparatively lower at 58.3% (32-80.7%) (Figure 4H). In the validation set, the model maintained robust performance for stage 0 + I + II lung cancer (81.8% [61.5-92.7%]) and improved accuracy for benign nodules (66.7% [35.4-87.9%]), though there was a slight decrease in accuracy for stage III+IV lung cancer (71.4% [35.9-91.8%]) (Figure 4I). These findings highlight the model’s potential for early detection and timely treatment of lung cancer, as well as its capacity to reduce unnecessary interventions and overtreatment—an essential consideration in clinical decision-making. However, further optimization is necessary to enhance its ability to accurately differentiate benign nodules and address variability in diagnosing advanced-stage lung cancer.
Comparison of the diagnostic performance of the VOC model with traditional methods using serum tumor biomarkers
To determine whether the model represents an advancement in tumor diagnosis, we compared its predictive accuracy against that of four established clinical tumor biomarkers: CA125, ProGRP, CEA, and CFRA21-1. Among the 36 lung cancers patients, the discriminative sensitivities of CA125, ProGRP, CEA, and CFRA21–1 were 0.061, 0.121, 0.152 and 0.242 respectively, while the 13-VOCs model showed a paired discriminative sensitivity of 0.895 (p < 0.001) (Figures 5A–D, F). Given the common clinical practice of combining these four biomarkers to enhance specificity, we hypothesized that classifying individuals as positive for lung cancer if any of the serum tumor biomarkers fell outside the normal range (i.e., CA125: 0–35 KU/L, ProGRP: 0–46 ng/L, CEA: 0-5μg/L, CFRA21-1: 0–3 ng/L) could yield improved sensitivity. Of particular note, our 13-VOCs model significantly outperformed the 4-serum tumor marker panel, achieving a sensitivity of 0.895 compared to 0.394 (p < 0.001) (Figures 5E, F). Importantly, this superior performance was not attributable to an elevated false positive rate (Figure 4). These findings suggested that the 13-VOCs model represents a more robust diagnostic tool, potentially offering particular advantages for early detection, an area where traditional serum biomarkers have limited utility.
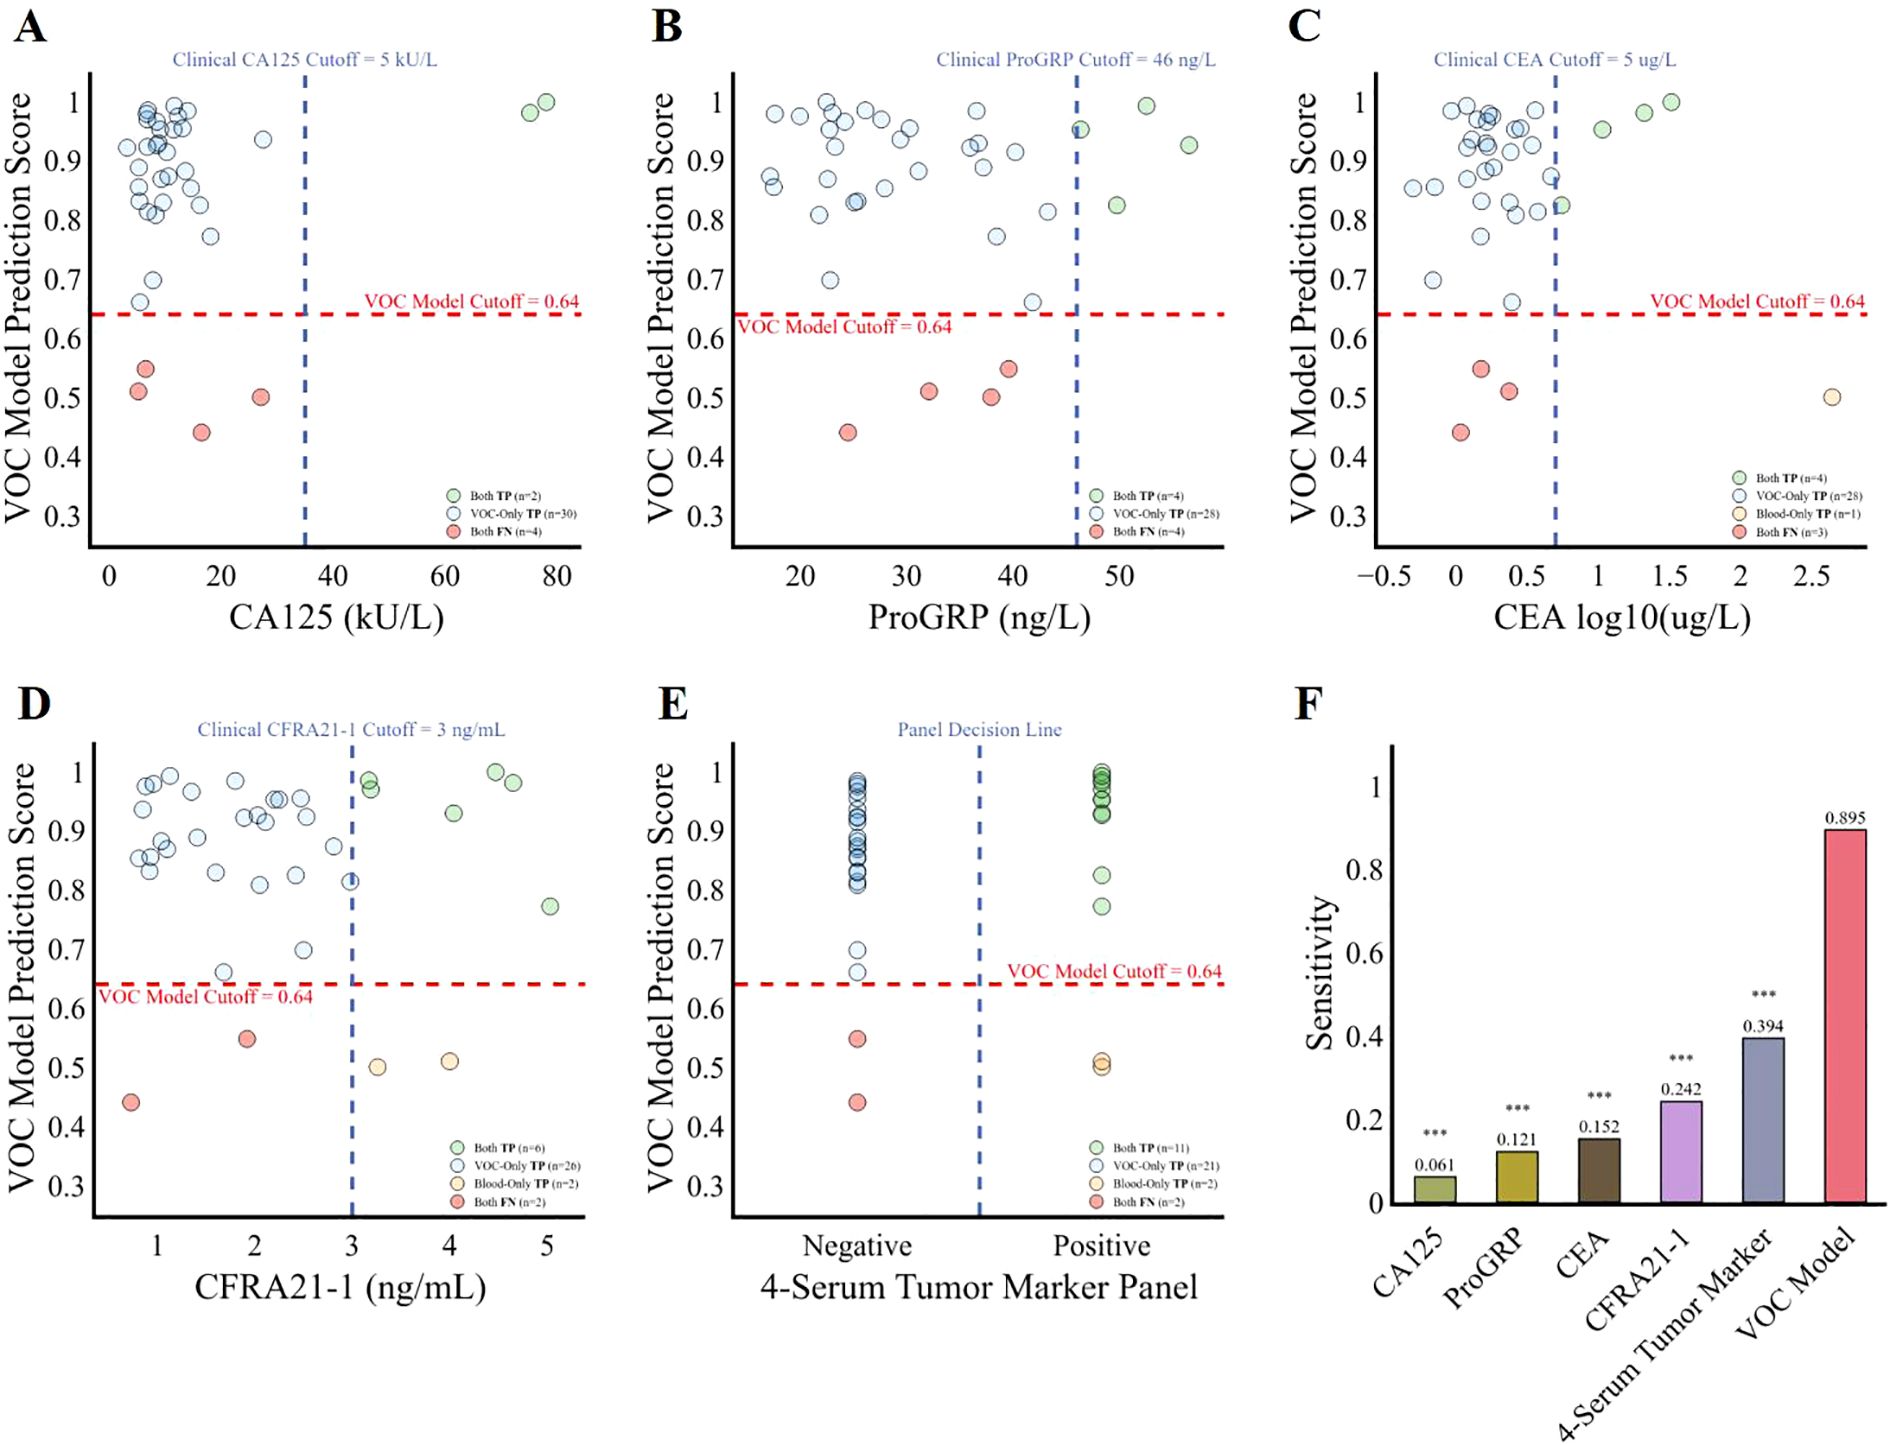
Figure 5. Comparison of the diagnostic performance of the 13-VOCs model with clinical serum tumor biomarkers among lung cancer patients. (A–E), diagnostic prediction of the lung cancer patients using the 13-VOCs model and clinical markers CA125, ProGRP, CEA, CFRA21-1, and the 4-serum tumor marker panel respectively. The blue vertical dashed line represents the clinical serum tumor biomarkers at various cutoffs, while the red horizontal dashed line indicates the VOC model cutoff score at 0.64. Each point corresponds to an individual lung cancer sample (n=36). (F), comparison of the four individual serum tumor marker, 4-serum tumor marker panel and 13-VOCs models’ detection sensitivity in predicting lung cancer patients. Sensitivity differences between the 13-VOC model, each individual serum tumor marker, and the 4-serum tumor marker panel were evaluated using McNemar’s test. Significance is denoted as follows: ***, p < 0.001.
Model performance for postoperative monitoring and follow-up
To assess whether the model accurately reflects dynamic changes in disease status and further validate that the features it captures are closely associated with disease activity or burden, we analyzed and compared the model’s score changes between preoperative assessments and postoperative timepoints, 7 days to 1 month after surgery. Among the cancer patients (n = 54), postoperative predicted probabilities were significantly lower than preoperative probabilities (p < 0.01), indicating a measurable decrease in predicted disease burden following surgical intervention (Figure 6A). Subgroup analysis confirmed this trend in both lung cancer (p < 0.05) (Figure 6C) and thymoma (p < 0.05) (Figure 6D), with postoperative scores remaining consistently lower across these malignancies. The postoperative reduction in esophageal cancer was not statistically significant (p > 0.05) (Figure 6E), possibly due to the limited sample size. Notably, there was no significant difference in predicted probabilities between the postoperative and preoperative groups in cases of benign disease (p > 0.05) (Figure 6B). Collectively, these findings demonstrate that the model effectively reflects the reduction in disease burden following lung cancer surgery, highlighting its potential utility for assessing the completeness of resection and detecting early signs of postoperative recurrence.
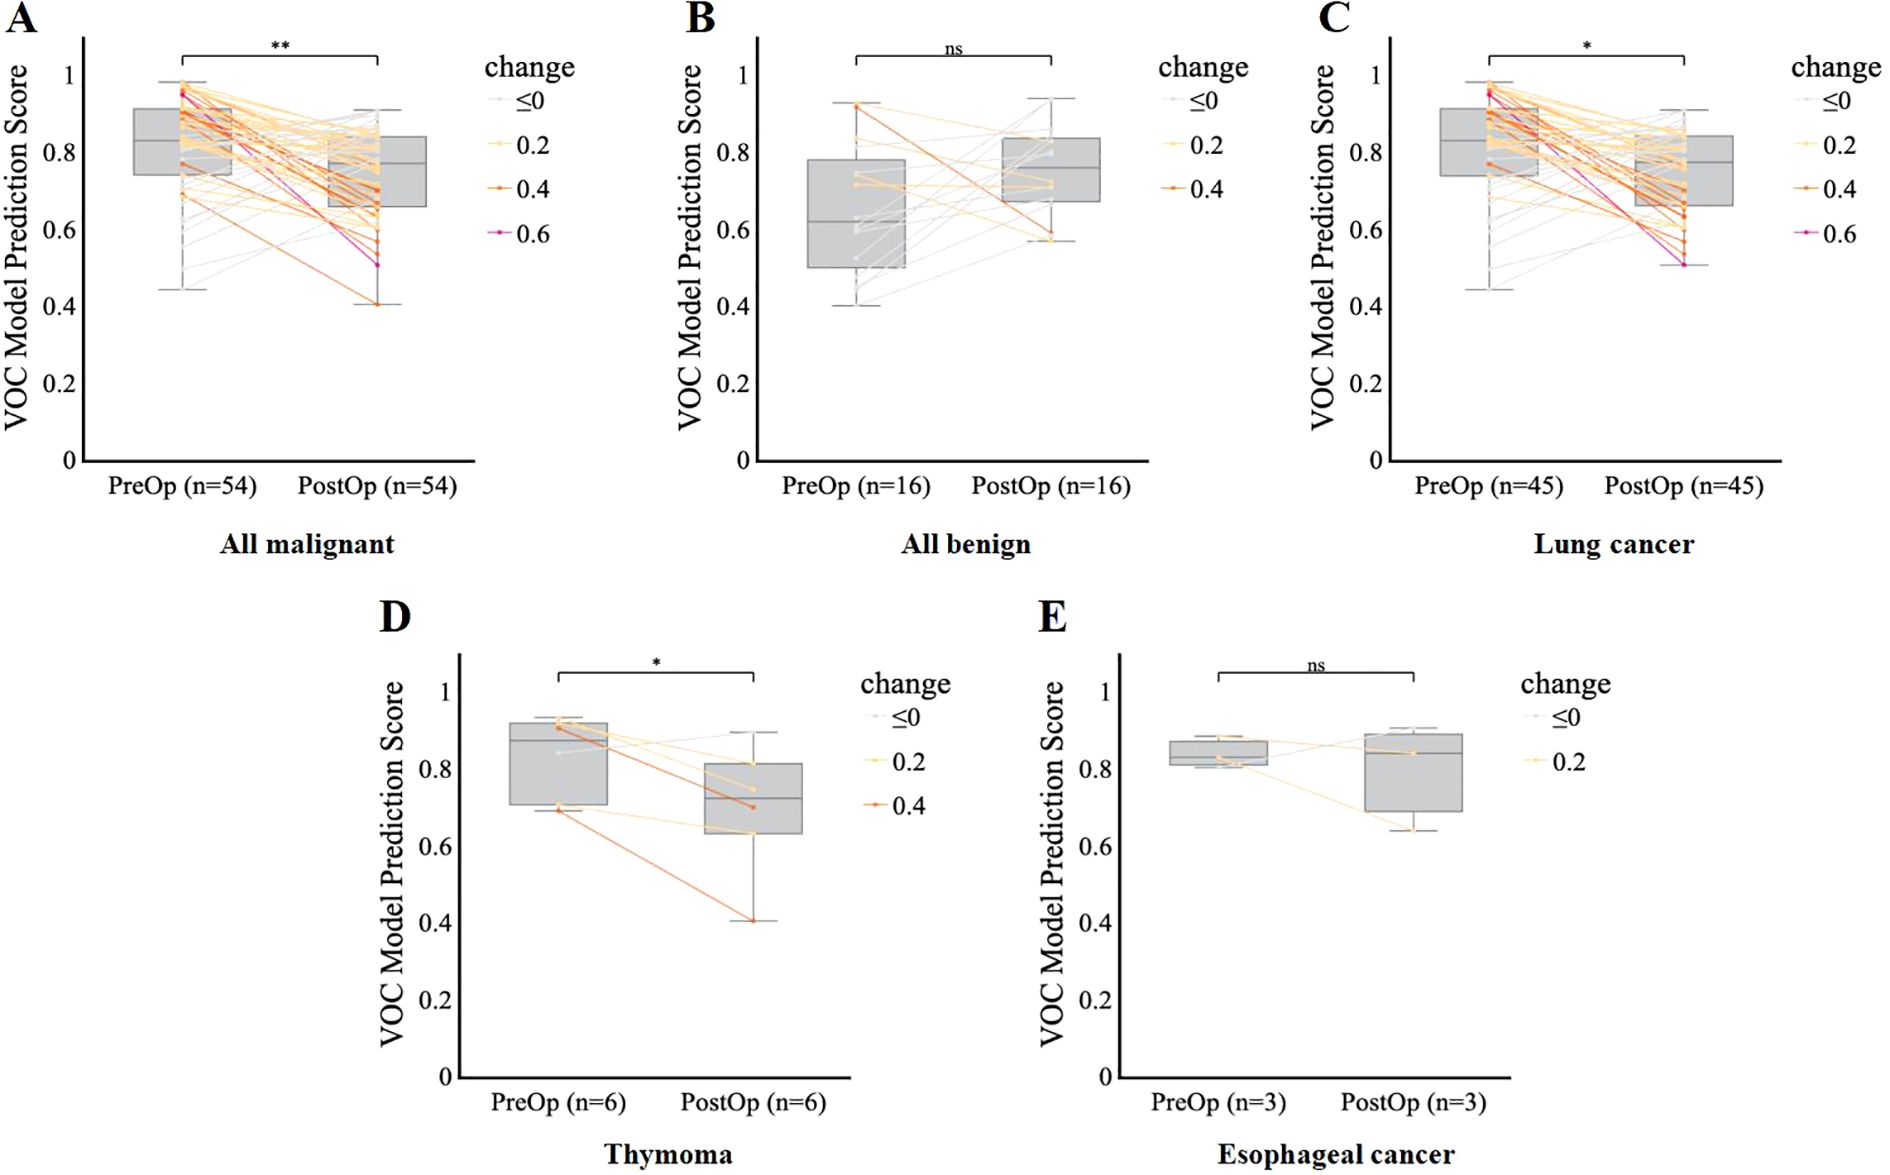
Figure 6. Model performance for postoperative monitoring and follow-up. (A–E), Comparison of VOC model prediction scores before (PreOp) and after (PostOp) surgery in the overall malignant group (A), benign group (B), lung cancer group (C), thymoma group (D), and esophageal cancer group (E), respectively. Each line represents an individual patient’s change in score, color-coded by the magnitude of change. Boxplots show the median and interquartile range. Comparisons in VOC prediction by scores postoperatively were performed using a paired t-test. Significance is denoted as follows: *p < 0.05, **p < 0.01, ns = not significant (p ≥ 0.05).
Discussion
This study aimed to develop and validate a novel machine learning model for the early diagnosis of thoracic malignancies using exhaled VOCs as biomarkers. To our knowledge, our findings demonstrate for the first time the feasibility of employing a single panel of VOC profiles to differentiate between benign and malignant thoracic lesions, particularly lung, esophageal, and thymic tumors.
To determine the optimal classifier for metabolomics data analysis, we evaluated five machine learning algorithms: logistic regression, random forest, k-nearest neighbor, XGBoost, and support vector machine, on training and validation datasets. Logistic regression demonstrated robust performance on both sets, making it the ideal choice for the baseline model. While algorithms like Random Forest and XGBoost showed some promise, they were not pursued due to their increased complexity and computational demands, without significant improvement in testing set performance. Given its simplicity, interpretability, efficiency, and strong generalization, logistic regression emerged as the optimal model for metabolomics data analysis. The 13-VOC model constructed by logistic regression algorithm achieved high accuracy in classifying thoracic tumors, with an AUC of 0.85, sensitivity of 82%, and specificity of 71%, representing a clinically significant advancement over existing clinical markers, which only achieved a sensitivity of 39.4%. Notably, the model exhibited robust performance in distinguishing early-stage lung cancer, suggesting its potential as a non-invasive screening tool.
Thirteen VOCs were identified as potential biomarkers for distinguishing malignant from benign thoracic lesions, many of which have established or emerging links to various cancer metabolism and pathogenesis. Several VOCs, including 1-butanol (31), propanoic acid (32), methyl-Cyclohexane (33, 34), sec-Butyl acetate (33), camphene (35), D-Limonene (35, 36), 6-methyl-5-Hepten-2-one (37), and p-cresol (38), have been previously reported as elevated in lung cancer and other malignancies.
Emerging evidence suggests that these VOCs may reflect key metabolic alterations characteristic of cancer pathogenesis. Trans-2-Decenal (39, 40), an alkenal mutagen found in cooking oil fumes, has been shown to promote oxidative DNA damage through reactive oxygen species formation, a well-established mechanism implicated in lung carcinogenesis, suggesting increased risk for individuals with frequent exposure (39). Methyl-cyclohexane, which has also been implicated in distinguishing colorectal cancer from healthy controls, may indicate broader metabolic reprogramming in malignancy (41). 6-methyl-5-Hepten-2-one, potentially linked to increased fatty acid oxidation (42), a hallmark of cancer cell metabolism, was reported to be elevated in various gastrointestinal cancers, including colorectal (42) and gastric cancer (43–45).
Butanal, elevated in esophagogastric cancer (46), may accumulate due to genetic dysregulation of its metabolic pathways or as a byproduct of lipid peroxidation—a process often amplified by chronic inflammation in the tumor microenvironment. This aligns with the recognized role of oxidative stress in cancer progression (47, 48). Furthermore, alterations in the gut microbiome, frequently observed in esophageal cancer, can modulate butanal production and metabolism (49), highlighting the interplay between host metabolism and microbial communities in cancer.
p-Cresol, with its complex metabolism influenced by gut and oral microbiota, hepatic processes, and disease state, has been identified as a potential breath biomarker in various cancers, including esophageal, gastric, thyroid, breast, oral, and lung cancers, and even in some non-malignant conditions (50, 51). This broad association suggests p-cresol and other VOCs may serve as general indicators of metabolic dysregulation or malignancy.
In contrast, isobutyl acetate, trans-1,2-Cyclopentanediol, and cis-2-Hexen-1-ol currently lack well-established links to cancer pathogenesis. Isobutyl acetate has been primarily reported as a marker for microbial (specifically Candida albicans) activity, particularly in respiratory infections (52). It may also indirectly contribute to metabolic disorders like obesity and diabetes through oxidative stress and neuroinflammation (53), and potentially to cardiovascular disease via ROS-mediated metabolic dysregulation (54). Further studies should include metabolomic and pathway enrichment analyses, such as KEGG, to elucidate their metabolic origins and explore potential sources like lipid peroxidation or microbial dysbiosis.
The observation that several VOCs are associated with multiple cancer types suggests they may serve as general indicators of malignancy or reflect shared metabolic pathways. Combining these VOCs into a diagnostic model is justified by their diverse origins and links to various cancer-related pathways, including genetic dysregulation, oxidative stress, lipid peroxidation, and microbiome alterations, enabling the capture of a more comprehensive metabolic fingerprint of thoracic malignancies, potentially improving diagnostic accuracy. Nevertheless, further mechanistic studies are needed to elucidate how these VOCs specifically relate to cancer pathogenesis and to validate their clinical utility as biomarkers.
Furthermore, the model’s ability to track changes in VOC profiles over time, as demonstrated by the significant decrease in predicted risk following surgery, highlights its potential for monitoring disease progression and treatment response. Wang et al. demonstrated the feasibility of using perioperative dynamic breathomics to identify a panel of VOCs as potential biomarkers for lung cancer (55). By comparing VOC profiles before and after surgery, they identified 16 VOCs that were significantly altered in lung cancer patients, and a machine learning model based on these VOCs achieved high accuracy of 86.9% in differentiating between lung cancer patients and healthy controls. Nardi-Agmon et al. explored the potential of breath analysis for monitoring the response to anticancer treatment in patients with advanced lung cancer (56). By utilizing a panel of three VOCs identified as significant indicators of treatment outcomes, this approach may provide a rapid and non-invasive method for assessing treatment response, potentially enabling earlier detection of treatment failure compared to conventional imaging techniques. These findings highlight the growing evidences supporting breath analysis as a valuable tool for lung cancer management, with the ability to detect dynamic changes in VOC profiles pre- and post-treatment suggesting its potential as a complementary approach to existing diagnostic and monitoring strategies.
However, several limitations of this study should be acknowledged. Firstly, although our cohort was prospectively enrolled, the sample size (n=132) and subtype distribution (lung cancer 79.4%, thymoma 13.4%, esophageal cancer 7.2%) reflect the underlying epidemiology of thoracic malignancies (1, 3, 4). This distribution enabled robust differentiation between malignant and benign lesions, but the small numbers for rarer subtypes limit the strength of conclusions for thymoma and esophageal cancer. These analyses are exploratory and serve as preliminary, hypothesis-generating observations. External validation in larger, multi-center cohorts, particularly through collaboration with international consortia for rare thoracic tumors, is essential to confirm these findings and support broader clinical application. Secondly, the reliance on GC-MS for VOC analysis presents challenges for clinical implementation. GC-MS is a complex, time-consuming, and expensive technique that requires specialized equipment and expertise, making it less feasible for routine clinical use (57). To address this, future research should focus on validating these findings using point-of-care testing (POCT) devices, such as micro-GC systems (58–65), electronic noses (66), or wearable VOC sensors (67), which offer real-time, bedside breath analysis for rapid clinical decision-making. However, challenges remain, including achieving sufficient sensor sensitivity and selectivity, minimizing sensor drift and environmental interference, and standardizing protocols. Progress in materials science and AI-driven data analysis, along with interdisciplinary collaboration, will be crucial to address these issues. Pilot studies in clinical settings are also needed to assess practicality, cost-effectiveness, and user acceptance, ultimately supporting the adoption of breath analysis in routine healthcare. Large-scale validation studies using such technologies could pave the way for the widespread adoption of breath analysis in clinical practice (58–63). Thirdly, this study focused only on lung cancer, thymoma, and esophageal cancer, limiting its applicability to other thoracic malignancies. Future research should include mesothelioma, mediastinal tumors, and other rare thoracic cancers to develop a more comprehensive model, which could improve breath analysis for diagnosis and monitoring across the entire spectrum of thoracic oncology. Fourthly, while the study demonstrates the potential of VOC analysis, further research is needed to elucidate the underlying biological mechanisms and to address the technical challenges associated with breath sample collection and analysis. Finally, although LDCT is widely used for lung cancer screening, it carries high costs and a notable false-positive rate, which can lead to unnecessary follow-up tests and increased patient anxiety (68). In contrast, breath-based VOC analysis offers a non-invasive, radiation-free, and potentially more cost-effective screening approach. However, our current methodology relies on GC-MS, which is not yet feasible for large-scale screening due to its expense and complexity. The development of portable, point-of-care VOC detection platforms may help overcome these limitations, enabling broader clinical implementation and possibly reducing the economic and logistical burden associated with current screening methods. Future studies should directly compare the clinical and economic outcomes of VOC-based POCT and existing modalities such as LDCT to determine the most effective and sustainable strategies for early cancer detection. Despite these limitations, this study provides a strong foundation for the development of breath analysis as a valuable tool for the early detection, diagnosis, and monitoring of thoracic cancers.
Conclusion
This study establishes the effectiveness of a breath-derived VOC model in distinguishing malignant and benign thoracic lesions, demonstrating its capability for multi-cancer detection and early-stage diagnosis. By pioneering breathomics for simultaneous identification of multiple thoracic malignancies and exploring its potential for postoperative monitoring, this work introduces a novel integration of non-invasive diagnostics with therapeutic surveillance. Compared to traditional serum biomarkers, the approach demonstrates superior sensitivity while eliminating invasive sampling, offering a patient-friendly alternative with clinical scalability. The methodology holds promise for improving early cancer detection and real-time postoperative evaluation, potentially enhancing clinical decision-making and personalized patient management. Future efforts should prioritize validation in broader populations, refinement of the predictive model, and development of point-of-care devices to facilitate clinical translation and improve patient outcomes.
Data availability statement
The raw data supporting the conclusions of this article will be made available by the authors, without undue reservation.
Ethics statement
The studies involving humans were approved by Ethics Committee of the First Affiliated Hospital of Sun Yat-sen University. The studies were conducted in accordance with the local legislation and institutional requirements. The participants provided their written informed consent to participate in this study.
Author contributions
ZC: Writing – review & editing, Conceptualization, Supervision. MP: Writing – original draft, Writing – review & editing, Conceptualization. PF: Writing – review & editing, Formal Analysis, Data curation, Methodology. SC: Investigation, Writing – review & editing, Methodology. XC: Methodology, Formal Analysis, Writing – review & editing, Data curation. BX: Writing – review & editing, Formal Analysis, Validation. RC: Formal Analysis, Data curation, Resources, Writing – review & editing. XH: Methodology, Writing – review & editing, Visualization. WW: Validation, Writing – review & editing, Data curation, Investigation. TZ: Methodology, Data curation, Investigation, Writing – review & editing. JK: Writing – review & editing, Methodology, Data curation. WL: Software, Methodology, Writing – review & editing, Investigation. XQ: Writing – review & editing, Data curation, Project administration. STC: Methodology, Data curation, Supervision, Writing – review & editing. JW: Writing – review & editing, Project administration, Funding acquisition.
Funding
The author(s) declare financial support was received for the research and/or publication of this article. This study was supported by the Disruptive Technology Innovation Project of the National Key Research and Development Program of China (2024YFF1501500).
Conflict of interest
Authors MP, PF, JK, WL, XQ, STC, JW were employed by the company ChromX Health Co., Ltd.
The remaining authors declare that the research was conducted in the absence of any commercial or financial relationships that could be construed as a potential conflict of interest.
Generative AI statement
The author(s) declare that no Generative AI was used in the creation of this manuscript.
Any alternative text (alt text) provided alongside figures in this article has been generated by Frontiers with the support of artificial intelligence and reasonable efforts have been made to ensure accuracy, including review by the authors wherever possible. If you identify any issues, please contact us.
Publisher’s note
All claims expressed in this article are solely those of the authors and do not necessarily represent those of their affiliated organizations, or those of the publisher, the editors and the reviewers. Any product that may be evaluated in this article, or claim that may be made by its manufacturer, is not guaranteed or endorsed by the publisher.
Supplementary material
The Supplementary Material for this article can be found online at: https://www.frontiersin.org/articles/10.3389/fonc.2025.1635280/full#supplementary-material
References
1. Bray F, Laversanne M, Sung H, Ferlay J, Siegel RL, Soerjomataram I, et al. Global cancer statistics 2022: GLOBOCAN estimates of incidence and mortality worldwide for 36 cancers in 185 countries. CA Cancer J Clin. (2024) 74:229–63. doi: 10.3322/caac.21834
2. Allemani C, Matsuda T, Di Carlo V, Harewood R, Matz M, Niksic M, et al. Global surveillance of trends in cancer survival 2000-14 (CONCORD-3): analysis of individual records for 37 513–025 patients diagnosed with one of 18 cancers from 322 population-based registries in 71 countries. Lancet. (2018) 391:1023–75. doi: 10.1016/S0140-6736(17)33326-3
3. Sheikh M, Roshandel G, McCormack V, and Malekzadeh R. Current status and future prospects for esophageal cancer. Cancers (Basel). (2023) 15:765. doi: 10.3390/cancers15030765
4. Alqaidy D. Thymoma: an overview. Diagnostics (Basel). (2023) 13:2982. doi: 10.3390/diagnostics13182982
5. Lopes R and Betrouni N. Fractal and multifractal analysis: a review. Med Image Anal. (2009) 13:634–49. doi: 10.1016/j.media.2009.05.003
6. Sun Y, Ge X, Niu R, Gao J, Shi Y, Shao X, et al. PET/CT radiomics and deep learning in the diagnosis of benign and Malignant pulmonary nodules: progress and challenges. Front Oncol. (2024) 14:1491762. doi: 10.3389/fonc.2024.1491762
7. Nasim F, Sabath BF, and Eapen GA. Lung cancer. Med Clin North Am. (2019) 103:463–73. doi: 10.1016/j.mcna.2018.12.006
8. Huang FL and Yu SJ. Esophageal cancer: Risk factors, genetic association, and treatment. Asian J Surg. (2018) 41:210–5. doi: 10.1016/j.asjsur.2016.10.005
9. Phillips M, Herrera J, Krishnan S, Zain M, Greenberg J, and Cataneo RN. Variation in volatile organic compounds in the breath of normal humans. J Chromatogr B BioMed Sci Appl. (1999) 729:75–88. doi: 10.1016/s0378-4347(99)00127-9
10. Minh Tdo C and Blake DR and Galassetti PR. The clinical potential of exhaled breath analysis for diabetes mellitus. Diabetes Res Clin Pract. (2012) 97:195–205. doi: 10.1016/j.diabres.2012.02.006
11. Bake B, Larsson P, Ljungkvist G, Ljungstrom E, and Olin AC. Exhaled particles and small airways. Respir Res. (2019) 20:8. doi: 10.1186/s12931-019-0970-9
12. Brusselmans L, Arnouts L, Millevert C, Vandersnickt J, van Meerbeeck JP, and Lamote K. Breath analysis as a diagnostic and screening tool for Malignant pleural mesothelioma: a systematic review. Transl Lung Cancer Res. (2018) 7:520–36. doi: 10.21037/tlcr.2018.04.09
13. Phillips M, Greenberg J, and Awad J. Metabolic and environmental origins of volatile organic compounds in breath. J Clin Pathol. (1994) 47:1052–3. doi: 10.1136/jcp.47.11.1052
14. Haworth JJ, Pitcher CK, Ferrandino G, Hobson AR, Pappan KL, and Lawson JLD. Breathing new life into clinical testing and diagnostics: perspectives on volatile biomarkers from breath. Crit Rev Clin Lab Sci. (2022) 59:353–72. doi: 10.1080/10408363.2022.2038075
15. Fan X, Zhong R, Liang H, Zhong Q, Huang H, He J, et al. Exhaled VOC detection in lung cancer screening: a comprehensive meta-analysis. BMC Cancer. (2024) 24:775. doi: 10.1186/s12885-024-12537-7
16. Saalberg Y and Wolff M. VOC breath biomarkers in lung cancer. Clin Chim Acta. (2016) 459:5–9. doi: 10.1016/j.cca.2016.05.013
17. Peled N, Fuchs V, Kestenbaum EH, Oscar E, and Bitran R. An update on the use of exhaled breath analysis for the early detection of lung cancer. Lung Cancer (Auckl). (2021) 12:81–92. doi: 10.2147/LCTT.S320493
18. Su Z, Yu X, He Y, Sha T, Guo H, Tao Y, et al. Inconsistencies in predictive models based on exhaled volatile organic compounds for distinguishing between benign pulmonary nodules and lung cancer: a systematic review. BMC Pulm Med. (2024) 24:551. doi: 10.1186/s12890-024-03374-2
19. Leemans M, Bauer P, Cuzuel V, Audureau E, and Fromantin I. Volatile organic compounds analysis as a potential novel screening tool for breast cancer: A systematic review. biomark Insights. (2022) 17:11772719221100709. doi: 10.1177/11772719221100709
20. Chung J, Akter S, Han S, Shin Y, Choi TG, Kang I, et al. Diagnosis by volatile organic compounds in exhaled breath in exhaled breath from patients with gastric and colorectal cancers. Int J Mol Sci. (2022) 24:129. doi: 10.3390/ijms24010129
21. Van Liere E, van Dijk LJ, Bosch S, Vermeulen L, Heymans MW, Burchell GL, et al. Urinary volatile organic compounds for colorectal cancer screening: A systematic review and meta-analysis. Eur J Cancer. (2023) 186:69–82. doi: 10.1016/j.ejca.2023.03.002
22. Hintzen KFH, Grote J, Wintjens A, Lubbers T, Eussen MMM, van Schooten FJ, et al. Breath analysis for the detection of digestive tract Malignancies: systematic review. BJS Open. (2021) 5:zrab013. doi: 10.1093/bjsopen/zrab013
23. Gordon SM, Szidon JP, Krotoszynski BK, Gibbons RD, and O'Neill HJ. Volatile organic compounds in exhaled air from patients with lung cancer. Clin Chem. (1985) 31:1278–82. doi: 10.1093/clinchem/31.8.1278
24. Kumar S, Huang J, Abbassi-Ghadi N, Mackenzie HA, Veselkov KA, Hoare JM, et al. Mass spectrometric analysis of exhaled breath for the identification of volatile organic compound biomarkers in esophageal and gastric adenocarcinoma. Ann Surg. (2015) 262:981–90. doi: 10.1097/SLA.0000000000001101
25. Boccard J and Rutledge DN. A consensus orthogonal partial least squares discriminant analysis (OPLS-DA) strategy for multiblock Omics data fusion. Anal Chim Acta. (2013) 769:30–9. doi: 10.1016/j.aca.2013.01.022
26. Zhu H, Wang Y, Wei X, Shi W, Yin H, and Gao C. Logistic regression analysis of risk factors for Respiratory Distress Syndrome in Late Preterm Infants. Pak J Med Sci. (2025) 41:461–5. doi: 10.12669/pjms.41.2.9796
27. Jin Y, Lan A, Dai Y, Jiang L, and Liu S. Development and testing of a random forest-based machine learning model for predicting events among breast cancer patients with a poor response to neoadjuvant chemotherapy. Eur J Med Res. (2023) 28:394. doi: 10.1186/s40001-023-01361-7
28. Florimbi G, Fabelo H, Torti E, Lazcano R, Madronal D, Ortega S, et al. Accelerating the K-Nearest Neighbors Filtering Algorithm to Optimize the Real-Time Classification of Human Brain Tumor in Hyperspectral Images. Sensors (Basel). (2018) 18:2314. doi: 10.3390/s18072314
29. Ogunleye A and Wang QG. XGBoost model for chronic kidney disease diagnosis. IEEE/ACM Trans Comput Biol Bioinform. (2020) 17:2131–40. doi: 10.1109/TCBB.2019.2911071
30. Polat H, Danaei Mehr H, and Cetin A. Diagnosis of chronic kidney disease based on support vector machine by feature selection methods. J Med Syst. (2017) 41:55. doi: 10.1007/s10916-017-0703-x
31. Koureas M, Kirgou P, Amoutzias G, Hadjichristodoulou C, Gourgoulianis K, and Tsakalof A. Target analysis of volatile organic compounds in exhaled breath for lung cancer discrimination from other pulmonary diseases and healthy persons. Metabolites. (2020) 10:317. doi: 10.3390/metabo10080317
32. Callol-Sanchez L, Munoz-Lucas MA, Gomez-Martin O, Maldonado-Sanz JA, Civera-Tejuca C, Gutierrez-Ortega C, et al. Observation of nonanoic acid and aldehydes in exhaled breath of patients with lung cancer. J Breath Res. (2017) 11:026004. doi: 10.1088/1752-7163/aa6485
33. Chen X, Muhammad KG, Madeeha C, Fu W, Xu L, Hu Y, et al. Calculated indices of volatile organic compounds (VOCs) in exhalation for lung cancer screening and early detection. Lung Cancer. (2021) 154:197–205. doi: 10.1016/j.lungcan.2021.02.006
34. Wang M, Sheng J, Wu Q, Zou Y, Hu Y, Ying K, et al. Confounding effect of benign pulmonary diseases in selecting volatile organic compounds as markers of lung cancer. J Breath Res. (2018) 12:046013. doi: 10.1088/1752-7163/aad9cc
35. Zou Y, Hu Y, Jiang Z, Chen Y, Zhou Y, Wang Z, et al. Exhaled metabolic markers and relevant dysregulated pathways of lung cancer: a pilot study. Ann Med. (2022) 54:790–802. doi: 10.1080/07853890.2022.2048064
36. Fernandez Del Rio R, O'Hara ME, Holt A, Pemberton P, Shah T, Whitehouse T, et al. Volatile biomarkers in breath associated with liver cirrhosis - comparisons of pre- and post-liver transplant breath samples. EBioMedicine. (2015) 2:1243–50. doi: 10.1016/j.ebiom.2015.07.027
37. O'Neill HJ, Gordon SM, Krotoszynski B, Kavin H, and Szidon JP. Identification of isoprenoid-type components in human expired air: a possible shunt pathway in sterol metabolism. BioMed Chromatogr. (1987) 2:66–70. doi: 10.1002/bmc.1130020206
38. Peralbo-Molina A, Calderon-Santiago M, Priego-Capote F, Jurado-Gamez B, and Luque de Castro MD. Identification of metabolomics panels for potential lung cancer screening by analysis of exhaled breath condensate. J Breath Res. (2016) 10:26002. doi: 10.1088/1752-7155/10/2/026002
39. Dung CH and Wu SC and Yen GC. Genotoxicity and oxidative stress of the mutagenic compounds formed in fumes of heated soybean oil, sunflower oil and lard. Toxicol In Vitro. (2006) 20:439–47. doi: 10.1016/j.tiv.2005.08.019
40. Wu SC and Yen GC and Sheu F. Mutagenicity and identification of mutagenic compounds of fumes obtained from heating peanut oil. J Food Prot. (2001) 64:240–5. doi: 10.4315/0362-028x-64.2.240
41. Zbar AP. Exhaled volatile organic compounds identify patients with colorectal cancer (Br J Surg 2013; 100: 144-150). Br J Surg. (2013) 100:151. doi: 10.1002/bjs.8970
42. Kononova E, Mezmale L, Polaka I, Veliks V, Anarkulova L, Vilkoite I, et al. Breath fingerprint of colorectal cancer patients based on the gas chromatography-mass spectrometry analysis. Int J Mol Sci. (2024) 25:1632. doi: 10.3390/ijms25031632
43. Amal H, Leja M, Broza YY, Tisch U, Funka K, Liepniece-Karele I, et al. Geographical variation in the exhaled volatile organic compounds. J Breath Res. (2013) 7:47102. doi: 10.1088/1752-7155/7/4/047102
44. Xu ZQ, Broza YY, Ionsecu R, Tisch U, Ding L, Liu H, et al. A nanomaterial-based breath test for distinguishing gastric cancer from benign gastric conditions. Br J Cancer. (2013) 108:941–50. doi: 10.1038/bjc.2013.44
45. Shehada N, Bronstrup G, Funka K, Christiansen S, Leja M, and Haick H. Ultrasensitive silicon nanowire for real-world gas sensing: noninvasive diagnosis of cancer from breath volatolome. Nano Lett. (2015) 15:1288–95. doi: 10.1021/nl504482t
46. Markar SR, Wiggins T, Antonowicz S, Chin ST, Romano A, Nikolic K, et al. Assessment of a noninvasive exhaled breath test for the diagnosis of oesophagogastric cancer. JAMA Oncol. (2018) 4:970–6. doi: 10.1001/jamaoncol.2018.0991
47. Abbassi-Ghadi N, Kumar S, Huang J, Goldin R, Takats Z, and Hanna GB. Metabolomic profiling of oesophago-gastric cancer: a systematic review. Eur J Cancer. (2013) 49:3625–37. doi: 10.1016/j.ejca.2013.07.004
48. Altomare DF, Di Lena M, Porcelli F, Trizio L, Travaglio E, Tutino M, et al. Exhaled volatile organic compounds identify patients with colorectal cancer. Br J Surg. (2013) 100:144–50. doi: 10.1002/bjs.8942
49. Wroblewski LE, Peek RM Jr., and Coburn LA. The role of the microbiome in gastrointestinal cancer. Gastroenterol Clin North Am. (2016) 45:543–56. doi: 10.1016/j.gtc.2016.04.010
50. Ge D, Zhou J, Chu Y, Lu Y, Zou X, Xia L, et al. Distinguish oral-source VOCs and control their potential impact on breath biomarkers. Anal Bioanal Chem. (2022) 414:2275–84. doi: 10.1007/s00216-021-03866-8
51. Shi Y, Zhang J, He J, Liu D, Meng X, Huang T, et al. A method of detecting two tumor markers (p-hydroxybenzoic acid and p-cresol) in human urine using a porous magnetic -cyclodextrine polymer as solid phase extractant, an alternative for early gastric cancer diagnosis. Talanta. (2019) 191:133–40. doi: 10.1016/j.talanta.2018.08.036
52. Filipiak W, Wenzel M, Ager C, Mayhew CA, Bogiel T, Wlodarski R, et al. Molecular Analysis of Volatile Metabolites Synthesized by Candida albicans and Staphylococcus aureus in In Vitro Cultures and Bronchoalveolar Lavage Specimens Reflecting Single- or Duo-Factor Pneumonia. Biomolecules. (2024) 14:788. doi: 10.3390/biom14070788
53. Debarba LK, Jayarathne HSM, Stilgenbauer L, Terra Dos Santos AL, Koshko L, Scofield S, et al. Microglial NF-kappaB signaling deficiency protects against metabolic disruptions caused by volatile organic compound via modulating the hypothalamic transcriptome. bioRxiv. (2023). doi: 10.1101/2023.11.08.566279
54. Snieckute G, Ryder L, Vind AC, Wu Z, Arendrup FS, Stoneley M, et al. ROS-induced ribosome impairment underlies ZAKalpha-mediated metabolic decline in obesity and aging. Science. (2023) 382:eadf3208. doi: 10.1126/science.adf3208
55. Wang P, Huang Q, Meng S, Mu T, Liu Z, He M, et al. Identification of lung cancer breath biomarkers based on perioperative breathomics testing: A prospective observational study. EClinicalMedicine. (2022) 47:101384. doi: 10.1016/j.eclinm.2022.101384
56. Nardi-Agmon I, Abud-Hawa M, Liran O, Gai-Mor N, Ilouze M, Onn A, et al. Exhaled breath analysis for monitoring response to treatment in advanced lung cancer. J Thorac Oncol. (2016) 11:827–37. doi: 10.1016/j.jtho.2016.02.017
57. Hanna GB, Boshier PR, Markar SR, and Romano A. Accuracy and methodologic challenges of volatile organic compound-based exhaled breath tests for cancer diagnosis: A systematic review and meta-analysis. JAMA Oncol. (2019) 5:e182815. doi: 10.1001/jamaoncol.2018.2815
58. Wang J, Nunovero N, Nidetz R, Peterson SJ, Brookover BM, Steinecker WH, et al. Belt-mounted micro-gas-chromatograph prototype for determining personal exposures to volatile-organic-compound mixture components. Anal Chem. (2019) 91:4747–54. doi: 10.1021/acs.analchem.9b00263
59. Zang W, Liu Z, Kulkarni GS, Zhu H, Wu Y, Lee K, et al. A microcolumn DC graphene sensor for rapid, sensitive, and universal chemical vapor detection. Nano Lett. (2021) 21:10301–8. doi: 10.1021/acs.nanolett.1c03416
60. Huang X, Sharma R, Sivakumar AD, Yang S, and Fan X. Ultrathin silica integration for enhancing reliability of microfluidic photoionization detectors. Anal Chem. (2023) 95:8496–504. doi: 10.1021/acs.analchem.3c00354
61. Wei-Hao Li M, Ghosh A, Venkatasubramanian A, Sharma R, Huang X, and Fan X. High-sensitivity micro-gas chromatograph-photoionization detector for trace vapor detection. ACS Sens. (2021) 6:2348–55. doi: 10.1021/acssensors.1c00482
62. Sharma R, Zang W, Zhou M, Schafer N, Begley LA, Huang YJ, et al. Real time breath analysis using portable gas chromatography for adult asthma phenotypes. Metabolites. (2021) 11:265. doi: 10.3390/metabo11050265
63. Sharma R, Zang W, Tabartehfarahani A, Lam A, Huang X, Sivakumar AD, et al. Portable breath-based volatile organic compound monitoring for the detection of COVID-19 during the circulation of the SARS-coV-2 delta variant and the transition to the SARS-coV-2 omicron variant. JAMA Netw Open. (2023) 6:e230982. doi: 10.1001/jamanetworkopen.2023.0982
64. Tian J, Zhang Q, Peng M, Guo L, Zhao Q, Lin W, et al. Exhaled volatile organic compounds as novel biomarkers for early detection of COPD, asthma, and PRISm: a cross-sectional study. Respir Res. (2025) 26:173. doi: 10.1186/s12931-025-03242-5
65. Lai W, Li D, Wang J, Geng Q, Xia Y, Fu Y, et al. Exhaled breath is feasible for mild cognitive impairment detection: A diagnostic study with portable micro-gas chromatography. J Alzheimers Dis. (2025) 104:751–62. doi: 10.1177/13872877251319553
66. Buma AIG, Muntinghe-Wagenaar MB, van der Noort V, de Vries R, Schuurbiers MMF, Sterk PJ, et al. Lung cancer detection by electronic nose analysis of exhaled breath: a multicentre prospective external validation study. Ann Oncol. (2025) 36:786–95. doi: 10.1016/j.annonc.2025.03.013
67. Vishinkin R, Busool R, Mansour E, Fish F, Esmail A, Kumar P, et al. Profiles of volatile biomarkers detect tuberculosis from skin. Adv Sci (Weinh). (2021) 8:e2100235. doi: 10.1002/advs.202100235
68. National Lung Screening Trial Research T, Aberle DR, Adams AM, Berg CD, Black WC, Clapp JD, et al. Reduced lung-cancer mortality with low-dose computed tomographic screening. N Engl J Med. (2011) 365:395–409. doi: 10.1056/NEJMoa1102873
69. Tan J, Taitz J, Nanan R, Grau G, and Macia L. Dysbiotic Gut Microbiota-Derived Metabolites and Their Role in Non-Communicable Diseases. Int J Mol Sci. (2023) 24:15256. doi: 10.3390/ijms242015256
70. Fryc J and Naumnik B. Thrombolome and its emerging role in chronic kidney diseases. Toxins (Basel). (2021) 13:223. doi: 10.3390/toxins13030223
71. Gryp T, Vanholder R, Vaneechoutte M, and Glorieux G. p-cresyl sulfate. Toxins (Basel). (2017) 9:52. doi: 10.3390/toxins9020052
Keywords: breathomics, volatile organic compounds, exhaled breath, thoracic cancer, machine learning, early diagnosis, thermal desorption-gas chromatography-mass spectrometry, postoperative monitoring
Citation: Chen Z, Peng M, Fan P, Chen S, Cheng X, Xu B, Chen R, Hu X, Wei W, Zhao T, Kong J, Liang W, Qiu X, Chen S and Wang J (2025) Machine learning assisted breathomic approach for early-stage thoracic cancer detection. Front. Oncol. 15:1635280. doi: 10.3389/fonc.2025.1635280
Received: 26 May 2025; Accepted: 25 August 2025;
Published: 17 September 2025.
Edited by:
Michael N. Kammer, Université Toulouse 1 Capitole, FranceReviewed by:
Yuanpin Zhou, Zhejiang University, ChinaQing-Qing Yu, Jining First People’s Hospital, China
Copyright © 2025 Chen, Peng, Fan, Chen, Cheng, Xu, Chen, Hu, Wei, Zhao, Kong, Liang, Qiu, Chen and Wang. This is an open-access article distributed under the terms of the Creative Commons Attribution License (CC BY). The use, distribution or reproduction in other forums is permitted, provided the original author(s) and the copyright owner(s) are credited and that the original publication in this journal is cited, in accordance with accepted academic practice. No use, distribution or reproduction is permitted which does not comply with these terms.
*Correspondence: Zhenguang Chen, Y2h6aGVuZ0BtYWlsLnN5c3UuZWR1LmNu; Junqi Wang, anVucWkud2FuZ0BjaHJvbXhoZWFsdGguY29t
†These authors have contributed equally to this work and share first authorship