Abstract
Purpose:
This study investigates the impact of the m1A regulator TRMT6 on prognosis and the tumor microenvironment in ovarian cancer.
Methods:
An analysis of the TCGA database was conducted, supplemented by validation from clinical specimens (13 paired samples), to systematically evaluate the expression characteristics of 10 m1A regulators. The prognostic value was assessed using the Kaplan-Meier Plotter database and Cox regression analysis. Additionally, immunohistochemistry and the Log-rank test were employed to validate the impact of TRMT6 on the prognosis and clinicopathological characteristics of ovarian cancer patients. The ssGSEA algorithm and CIBERSORT were utilized to analyze the influence of TRMT6 on the tumor immune microenvironment. We performed single-gene differential analysis of TRMT6 in the TCGA ovarian cancer database using the DESeq2 package and constructed a ceRNA network.
Results:
Three m1A regulators (TRMT10C, TRMT6, YTHDF1) were significantly overexpressed in cancer tissues (p < 0.01). Specifically, among these, TRMT6 and YTHDF1 were significantly associated with lower progression-free survival and overall survival (OS) (p < 0.01). Notably, TRMT6 emerged as an independent prognostic factor for predicting poor overall survival (HR = 2.74; 95% CI, 1.13 - 6.65; P = 0.026). TRMT6 expression had a significant correlation with the pathological stage. Furthermore, TRMT6 expression exhibited a significant negative correlation with eleven tumor-infiltrating immune cell types, including cytotoxic cells (p < 0.01). We also found that in ovarian cancer tissues with high expression of TRMT6, the enrichment scores of T cells gamma delta (p < 0.01) and Mast cells activated (p < 0.05) were significantly lower than those in tissues with low expression. HPSE2 has the most interaction nodes among mRNAs, hsa-miR-17-5p among miRNAs, and Lnc SNHG14 among lncRNAs in the ceRNA network.
Conclusion:
The findings suggest that the m1A regulator TRMT6 may drive ovarian cancer progression by promoting immune escape.
1 Introduction
Ovarian cancer (OC) is one of the three major gynecological malignancies and the leading cause of death from gynecological tumors (1, 2). It is estimated that in 2025, there will be approximately 20,890 new cases of OC and about 12,730 deaths in the United States (3). In addition to the challenges posed by drug resistance and the absence of individualized targeted therapies, moreover, the heterogeneity of ovarian tumors complicates treatment outcomes. Despite incremental advances in understanding the molecular mechanisms underlying OC, significant gaps remain in our knowledge of post-transcriptional regulation, particularly regarding RNA methylation and its role in tumor progression. RNA methylation encompasses N6-methyladenosine (m6A), N1-methyladenosine (m1A), 5-methylcytosine (m5C), 5-hydroxymethylcytosine (5hmC), and N7-methylguanosine (m7G) (4–6). m1A is linked to various cellular functions, and studies have demonstrated that dysregulation of m1A may be closely associated with tumor proliferation (7), invasion (8), cellular metabolism (9), and the tumor microenvironment (TME) (10). An increasing number of reports suggest that levels of m1A methylation, m1A-related regulators, and m1A-associated RNAs may serve as novel biomarkers for cancer prognosis (11–13). Furthermore, m1A-related regulators and/or m1A modifications on transcripts could represent breakthroughs in cancer treatment (14). In summary, a thorough exploration of the role of m1A regulators in OC is crucial for the development of new prognostic markers and the enhancement of treatment strategies for this disease. Given this, we investigated the role of TRMT6, an m1A regulator, in OC prognosis and the tumor immune microenvironment. The study’s design and findings are shown in Figure 1.
Figure 1
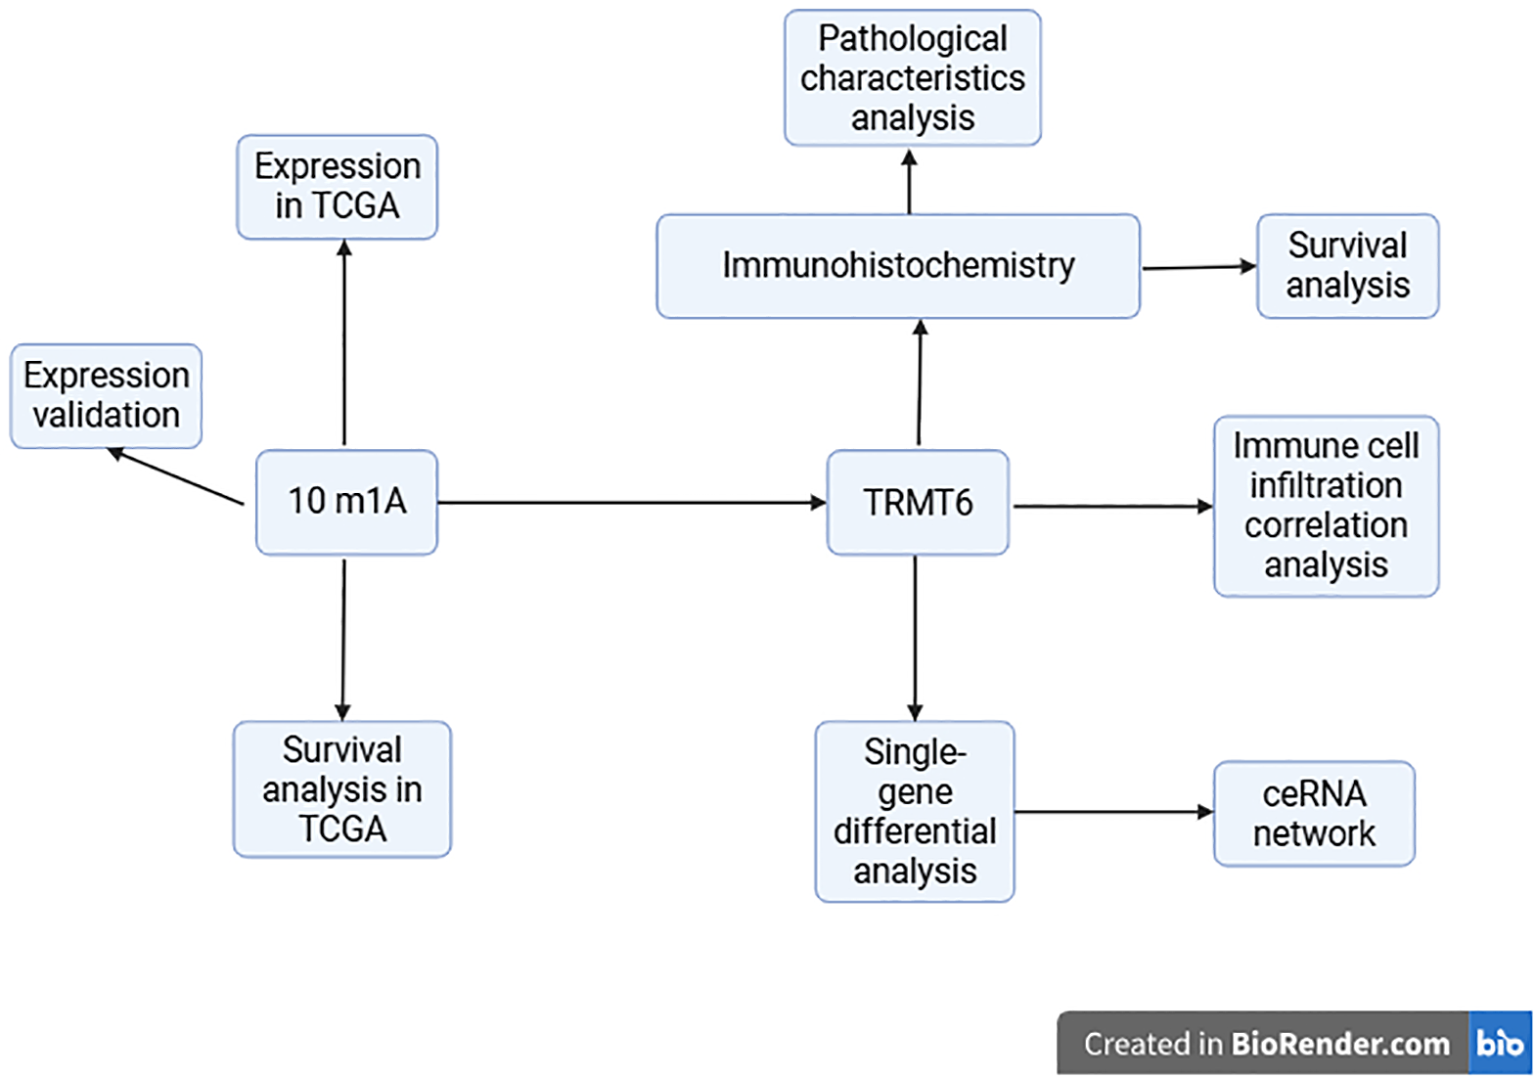
A schematic diagram of the experiment.
2 Materials and methods
2.1 Data collection
2.1.1 Screening of m1A regulators
Through a review of the published literature, we identified 10 m1A regulators, which include the writers TRMT6, TRMT10C, TRMT61A, and TRMT61B; the readers YTHDC1, YTHDF1, YTHDF2, and YTHDF3; and the erasers ALKBH1 and ALKBH3 (15–17).
2.1.2 UCSC XENA
To analyze the expression of m1A regulators in OC tissues, RNA sequencing data in TPM format was obtained from The Cancer Genome Atlas (TCGA) and the Genotype-Tissue Expression (GTEx) project. This data has been uniformly processed through the Toil pipeline and is accessible via the UCSC XENA database (https://xenabrowser.net/datapages/). The dataset includes 88 normal tissues from GTEx and 427 OC tissues from TCGA (18). For data processing, a log2(value + 1) transformation was applied, and no filtering strategy was implemented.
2.1.3 Kaplan–Meier plotter
We utilized the Kaplan-Meier plotter online database (https://kmplot.com/analysis/index.php?p=service&cancer=ovar) to investigate the prognostic value of m1A regulators in OC patients. The hazard ratio (HR), 95% confidence interval (CI), and log-rank p-value were clearly presented.
2.1.4 TCGA
We downloaded and organized the RNA sequencing (RNAseq) data from the TCGA-OV project, which was processed through the STAR pipeline, from the TCGA database (https://portal.gdc.cancer.gov). We extracted the data in Transcripts Per Million (TPM) format along with clinical data. The data filtering strategy involved the removal of normal samples. The data processing method applied was log2(value + 1). The analysis was conducted using R (version 4.2.1), with the circlize package (version 0.4.1) employed for visualization. The processing steps included analyzing the correlation between pairwise variables in the dataset and visualizing the correlation results using the circlize package. The statistical method utilized for this analysis was Spearman correlation. We employed the Wilcoxon rank sum test (Mann-Whitney U test) as our statistical method for comparing two independent groups. R packages: ggplot2[3.4.4], stats[4.2.1], car[3.1-0].
2.1.5 Tissue collection
Between January 2023 and May 2023, a total of 13 cases of OC tissues were collected from Hebei General Hospital. This cohort comprised 3 cases of high-grade serous OC, 3 cases of ovarian endometrioid adenocarcinoma, 3 cases of ovarian mucinous adenocarcinoma, and 4 cases of ovarian granulosa cell tumour, alongside 13 cases of normal ovarian tissues obtained through surgical resection. The study received approval from the Ethics Committee of Hebei Provincial People’s Hospital (approval number: 2023047), and informed consent was secured from all participating patients. The collected tissue samples were promptly placed in liquid nitrogen and subsequently transported to a -80°C freezer for storage in preparation for RNA extraction. Additionally, from January 2015 to May 2025, 92 cases of OC tissues, which had been embedded in paraffin post-surgical resection, were utilized for immunohistochemical experiments. This group included 40 cases of high-grade serous OC, 1 case of ovarian granulosa cell tumour, 5 cases of ovarian endometrioid adenocarcinoma, 6 cases of ovarian mucinous adenocarcinoma, 4 cases of ovarian clear cell carcinoma, and 1 case of low-grade serous OC, along with 35 cases of normal ovarian tissues. The study was also approved by the Ethics Committee of Hebei Provincial People’s Hospital (approval number: 2022124), with informed consent obtained from all patients involved.
2.2 Real-time quantitative PCR
Total RNA was extracted using TRIzol reagent (Tiangen, Beijing, China). cDNA was obtained using the FastQuant First-Strand cDNA Synthesis Kit (Tiangen, Beijing, China), and qPCR was performed on a thermal cycler (ABI, USA, 7500) using the SYBR Green PCR Kit (Tiangen, Beijing, China) to detect gene expression. The reaction conditions were as follows: 95°C for 15 minutes, 95°C for 10 seconds, 60°C for 20 seconds, and 72°C for 32 seconds, for a total of 40 cycles. β-actin was used as the internal reference. All data were analyzed using the 2-ΔΔCt method. Primer sequences are listed in Table 1.
Table 1
| Primer sequence for qRT-PCR |
|---|
| TRMT10C |
| F: 5’-TCAAGCTGCTAGAAACCACTG-3’ |
| R: 5’-TCTGTGCAAAGCACCATCTATT-3’ |
| TRMT61B |
| F: 5’- TTCGACCTCGGTAGCGGACT-3’ R: 5’- AGTCCCGTTCGGCAAGATCG-3’ |
| TRMT6 |
| F: 5’-GGTGCTGAAACGTGAAGATGT-3’ |
| R: 5’-CTTGGGCTGTAGACTTCCTCC-3’ |
| TRMT61A |
| F: 5’-GCCTTCGTCCACTCATGTCCAAG-3’ |
| R: 5’-CCACTCTGCCGCTCCTCTCC-3’ |
| ALKBH3 |
| F: 5’-TACCACTGCTAAGAGCCATCTCC-3’ |
| R: 5’-GACAGGCTGATTTCATACACACC-3’ |
| ALKBH1 |
| F: 5’-GCTGAAGCAGGGATCCTGAA-3’ |
| R: 5’-CGGACTGTCCAAAGCTGAATG-3’ |
| YTHDC1 |
| F: 5’-ATCTTCCGTTCGTGCTGTCC-3’ |
| R: 5’-GGACCATACACCCTTCGCTT-3’ |
| YTHDF1 |
| F: 5’-ACCTGTCCAGCTATTACCCG-3’ |
| R: 5’-TGGTGAGGTATGGAATCGGAG-3’ |
| YTHDF2 |
| F: 5’-TAGCCAACTGCGACACATTC-3’ |
| R: 5’-CACGACCTTGACGTTCCTTT-3’ |
| YTHDF3 |
| F: 5’-TGTTGTGGACTATAATGCGTATGC-3’ |
| R: 5’-AAGCGAATATGCCGTAATTGGTTA-3’ |
| β-actin |
| F: 5’-GGCACCACACCTTCTACAATGAC-3’ |
| R: 5’-GGATAGCACAGCCTGGATAGCA-3’ |
Primer sequence for qRT-PCR.
2.3 Immunohistochemistry
Paraffin sections were prepared for immunohistochemical staining. Following routine dewaxing and hydration, the sections were treated with fresh 0.3% methanol-hydrogen peroxide for blocking. Antigen retrieval was conducted using citrate buffer, and the sections were incubated overnight at 4°C with TRMT6-specific antibodies. After washing with PBS, the sections were incubated with the corresponding secondary antibodies at 37°C for 15 minutes. Following DAB development, the sections were counterstained, dehydrated, cleared, and mounted. Five random fields of view were selected from each section and observed under an OLYMPUS BX41TF (Japan) optical microscope at ×400 magnification. Three researchers, blinded to the clinical features and outcomes, independently examined and scored the sections. The expression of TRMT6 was quantified by multiplying the average staining intensity (ranging from 0 to 3: 0 indicates no staining; 1 indicates mild staining; 2 indicates moderate staining; 3 indicates intense staining) by the percentage of positive staining (ranging from 0 to 4: 0 indicates 0%; 1 indicates 0%-25%; 2 indicates 26%-50%; 3 indicates 51%-75%; 4 indicates 76%-100%). The final score was derived from the average of the scores calculated by the three researchers, with a score greater than 6 considered positive.
2.4 Survival curve analysis
We employed the COX regression analysis and Log-rank test to examine the correlation between TRMT6 expression and the prognosis in OC. When the variables do not satisfy the proportional hazards assumption, the Log-rank test is selected; otherwise, the COX regression analysis is used.
2.5 Pathological characteristics analysis
We examined the correlation between TRMT6 expression and pathological characteristics such as pathological staging, grading, lymph node metastasis, Omental metastasis, the levels of CA125 and HE4 in the blood by Fisher test or T-test.
2.6 Correlation analysis between TRMT6 expression and tumor-infiltrating immune cells
Download and organize RNAseq data from the STAR pipeline of the TCGA-OV (Ovarian Serous Cystadenocarcinoma) project from the TCGA database, and extract data in TPM format as well as clinical data. Based on the ssGSEA algorithm provided in the R package GSVA [1.46.0] (19), the immune infiltration of the corresponding cloud data was calculated using the markers of 24 immune cells provided in Bindea G’s article (20). Based on the core algorithm of CIBERSORT (analyzed by the CIBERSORT.R script), the markers of 22 immune cells provided by the CIBERSORTx website (https://cibersortx.stanford.edu/) were utilized to calculate the immune infiltration of the uploaded data (21, 22).
2.7 Differential gene expression analysis
We used the DESeq2 package to find differentially expressed genes linked to high versus low TRMT6 expression in the TCGA ovarian cancer database, with these cutoffs: FDR < 0.05 and |logFC| ≥ 2.5.
2.8 Construction of the ceRNA network
To better explore the regulatory mechanism of TRMT6 in ovarian cancer, we focused on TRMT6 as a key gene and performed single-gene differential analysis using the TCGA ovarian cancer database, which identified eight DEGs (PRLHR, NKX2-1, ZIC3, DPYSL5, HPSE2, ST8SIA3, VSTM2B, and BTBD17). Using the miRDB and Starbase online databases, we found 76 miRNAs and 243 lncRNAs. The ceRNA network was visualized by using Cytoscape software.
2.9 Statistical methods
Quantitative data processing and analysis were conducted using Opticon Monitor software (version 3.1). The ΔCT value was calculated as the difference between the CT value of the target gene and the CT value of β-actin. Subsequently, the relative corrected value, ΔΔCT, was computed for all samples, allowing for the determination of the relative expression level of the target gene using the formula: Relative quantity of the target gene = 2^-ΔΔCT. The statistical methods employed in this study are as follows: For numeric variables, if the data adhere to a normal distribution and pass the homogeneity of variance test, the T-test is utilized for comparing two groups. In cases where the data meet the normal distribution criteria but fail the homogeneity of variance test, the Welch t-test is applied. Conversely, if the data do not conform to a normal distribution, the Wilcoxon test is employed for group comparisons. For categorical variables, when all expected frequencies exceed 5 and the total sample size is greater than or equal to 40, the Chi-square test is used for intergroup comparisons. If the expected frequencies range between 1 and 5, and the total sample size is at least 40, the continuity corrected Chi-square test (Yates’ correction) is applied. In instances where expected frequencies are less than 1 or the total sample size is below 40, Fisher’s exact test is utilized for intergroup comparison. Additionally, correlation analysis of immune infiltration was conducted using Spearman’s rank correlation coefficient. The analysis was performed using R software (version 4.2.1), involving the R packages ggplot2 [3.4.4], stats [4.2.1], car [3.1-0], survival [3.3.1], and survminer [0.4.9]. Additionally, SPSS version 19.0 was utilized for statistical analysis. All statistical tests were two-tailed, with a significance level set at P < 0.05.
3 Results
3.1 Expression of 10 m1A regulators in OC and normal ovarian tissues
Through a comprehensive review of the published literature, we identified ten m1A genes, namely TRMT10C, TRMT61B, TRMT6, TRMT61A, ALKBH3, ALKBH1, YTHDC1, YTHDF1, YTHDF2, and YTHDF3. In the TCGA-GTEx-OV RNAseq TOIL TPM dataset, we observed that, except for YTHDF3, the remaining nine m1A regulators exhibited statistically significant differences in expression between OC tissues and normal tissues. Specifically, the expression levels of TRMT10C, TRMT61B, TRMT6, YTHDF1, and YTHDF2 were significantly higher in OC tissues compared to normal tissues, whereas the other four regulators showed elevated expression in normal tissues relative to OC tissues (Figure 2). Furthermore, quantitative reverse transcription polymerase chain reaction (qRT-PCR) analysis conducted on 13 OC tissues and 13 normal ovarian tissues confirmed that, apart from YTHDF3, the other nine m1A regulators displayed statistically significant differences in expression levels between OC and normal tissues. Among these, TRMT10C, TRMT61B, TRMT6, YTHDF1, and YTHDF2 exhibited higher expression in OC tissues than in normal tissues, while the remaining four regulators had higher expression in normal tissues compared to OC tissues (Figure 3), corroborating the expression differences observed in the database.
Figure 2
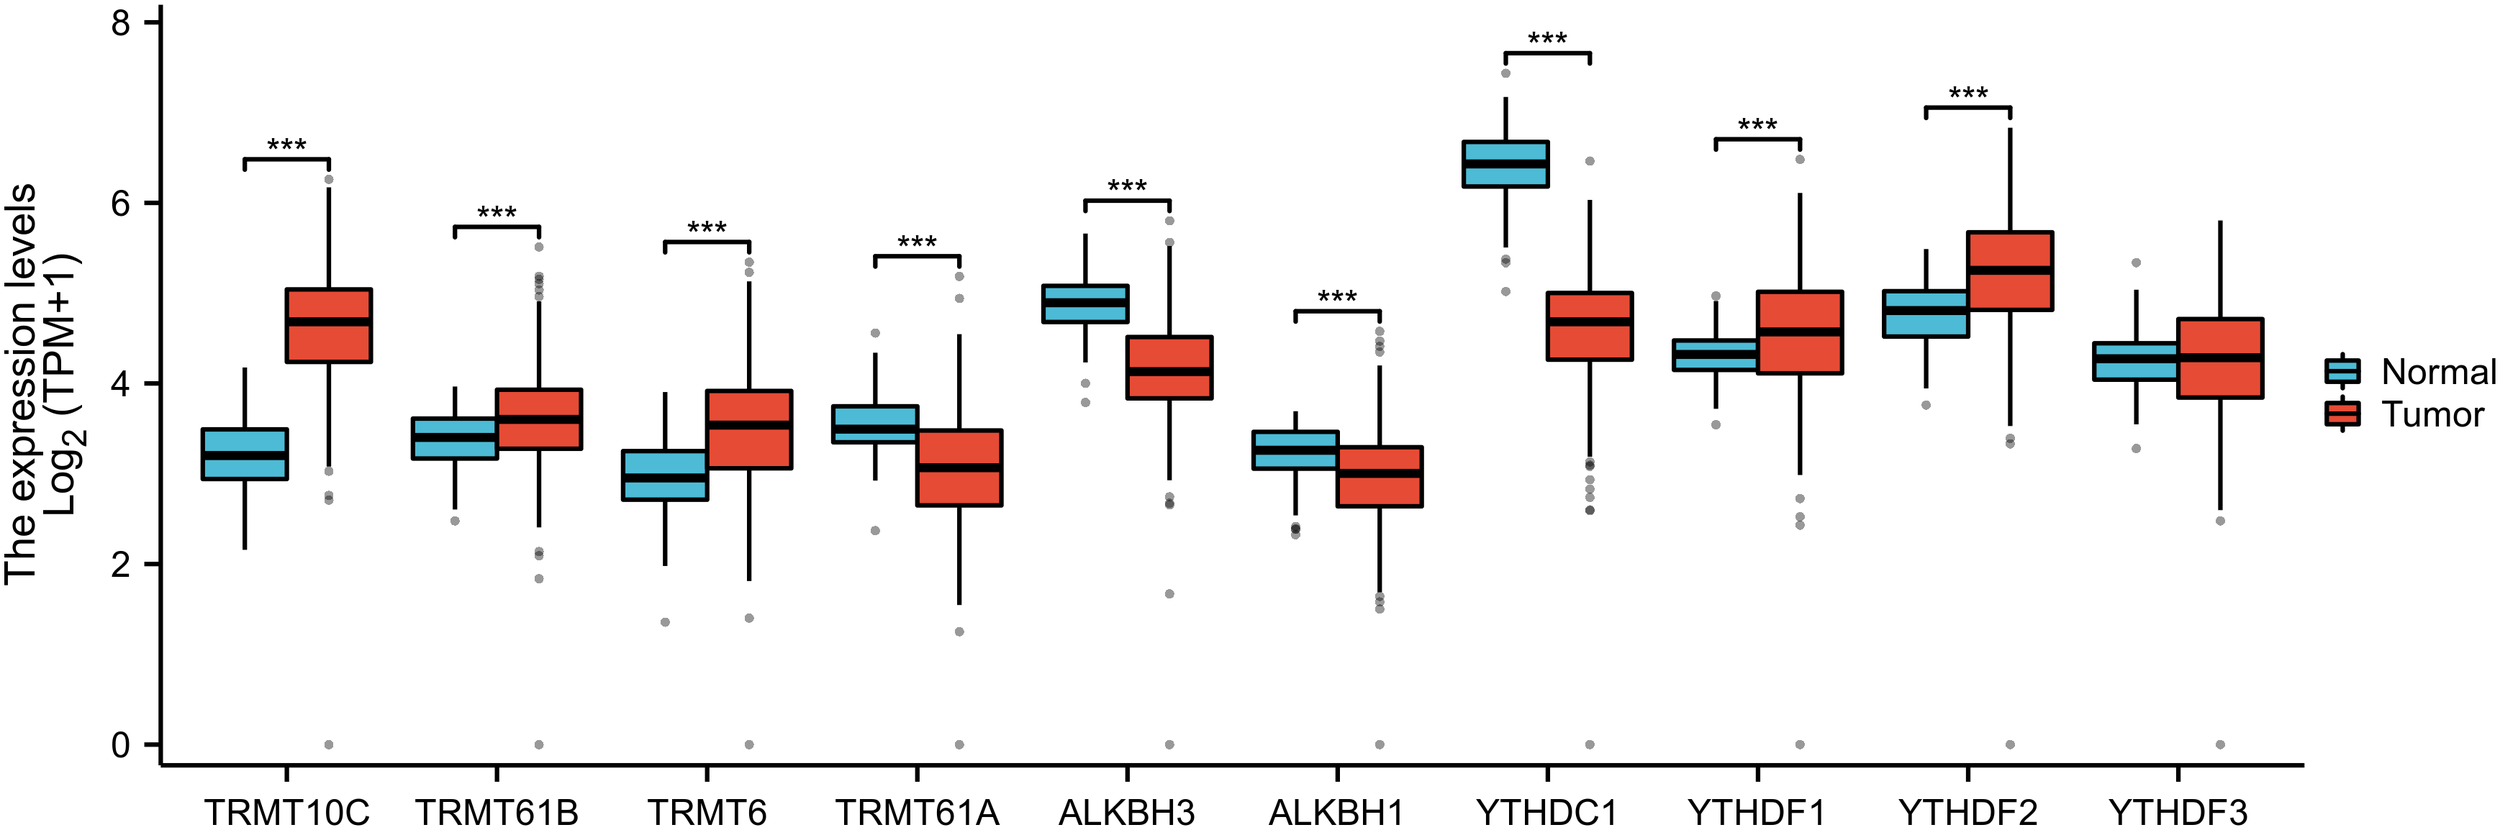
The differential expressions of 10 m1A regulators between ovarian cancer and normal tissues from the TCGA-GTEX database. “***” means <0.001.
Figure 3
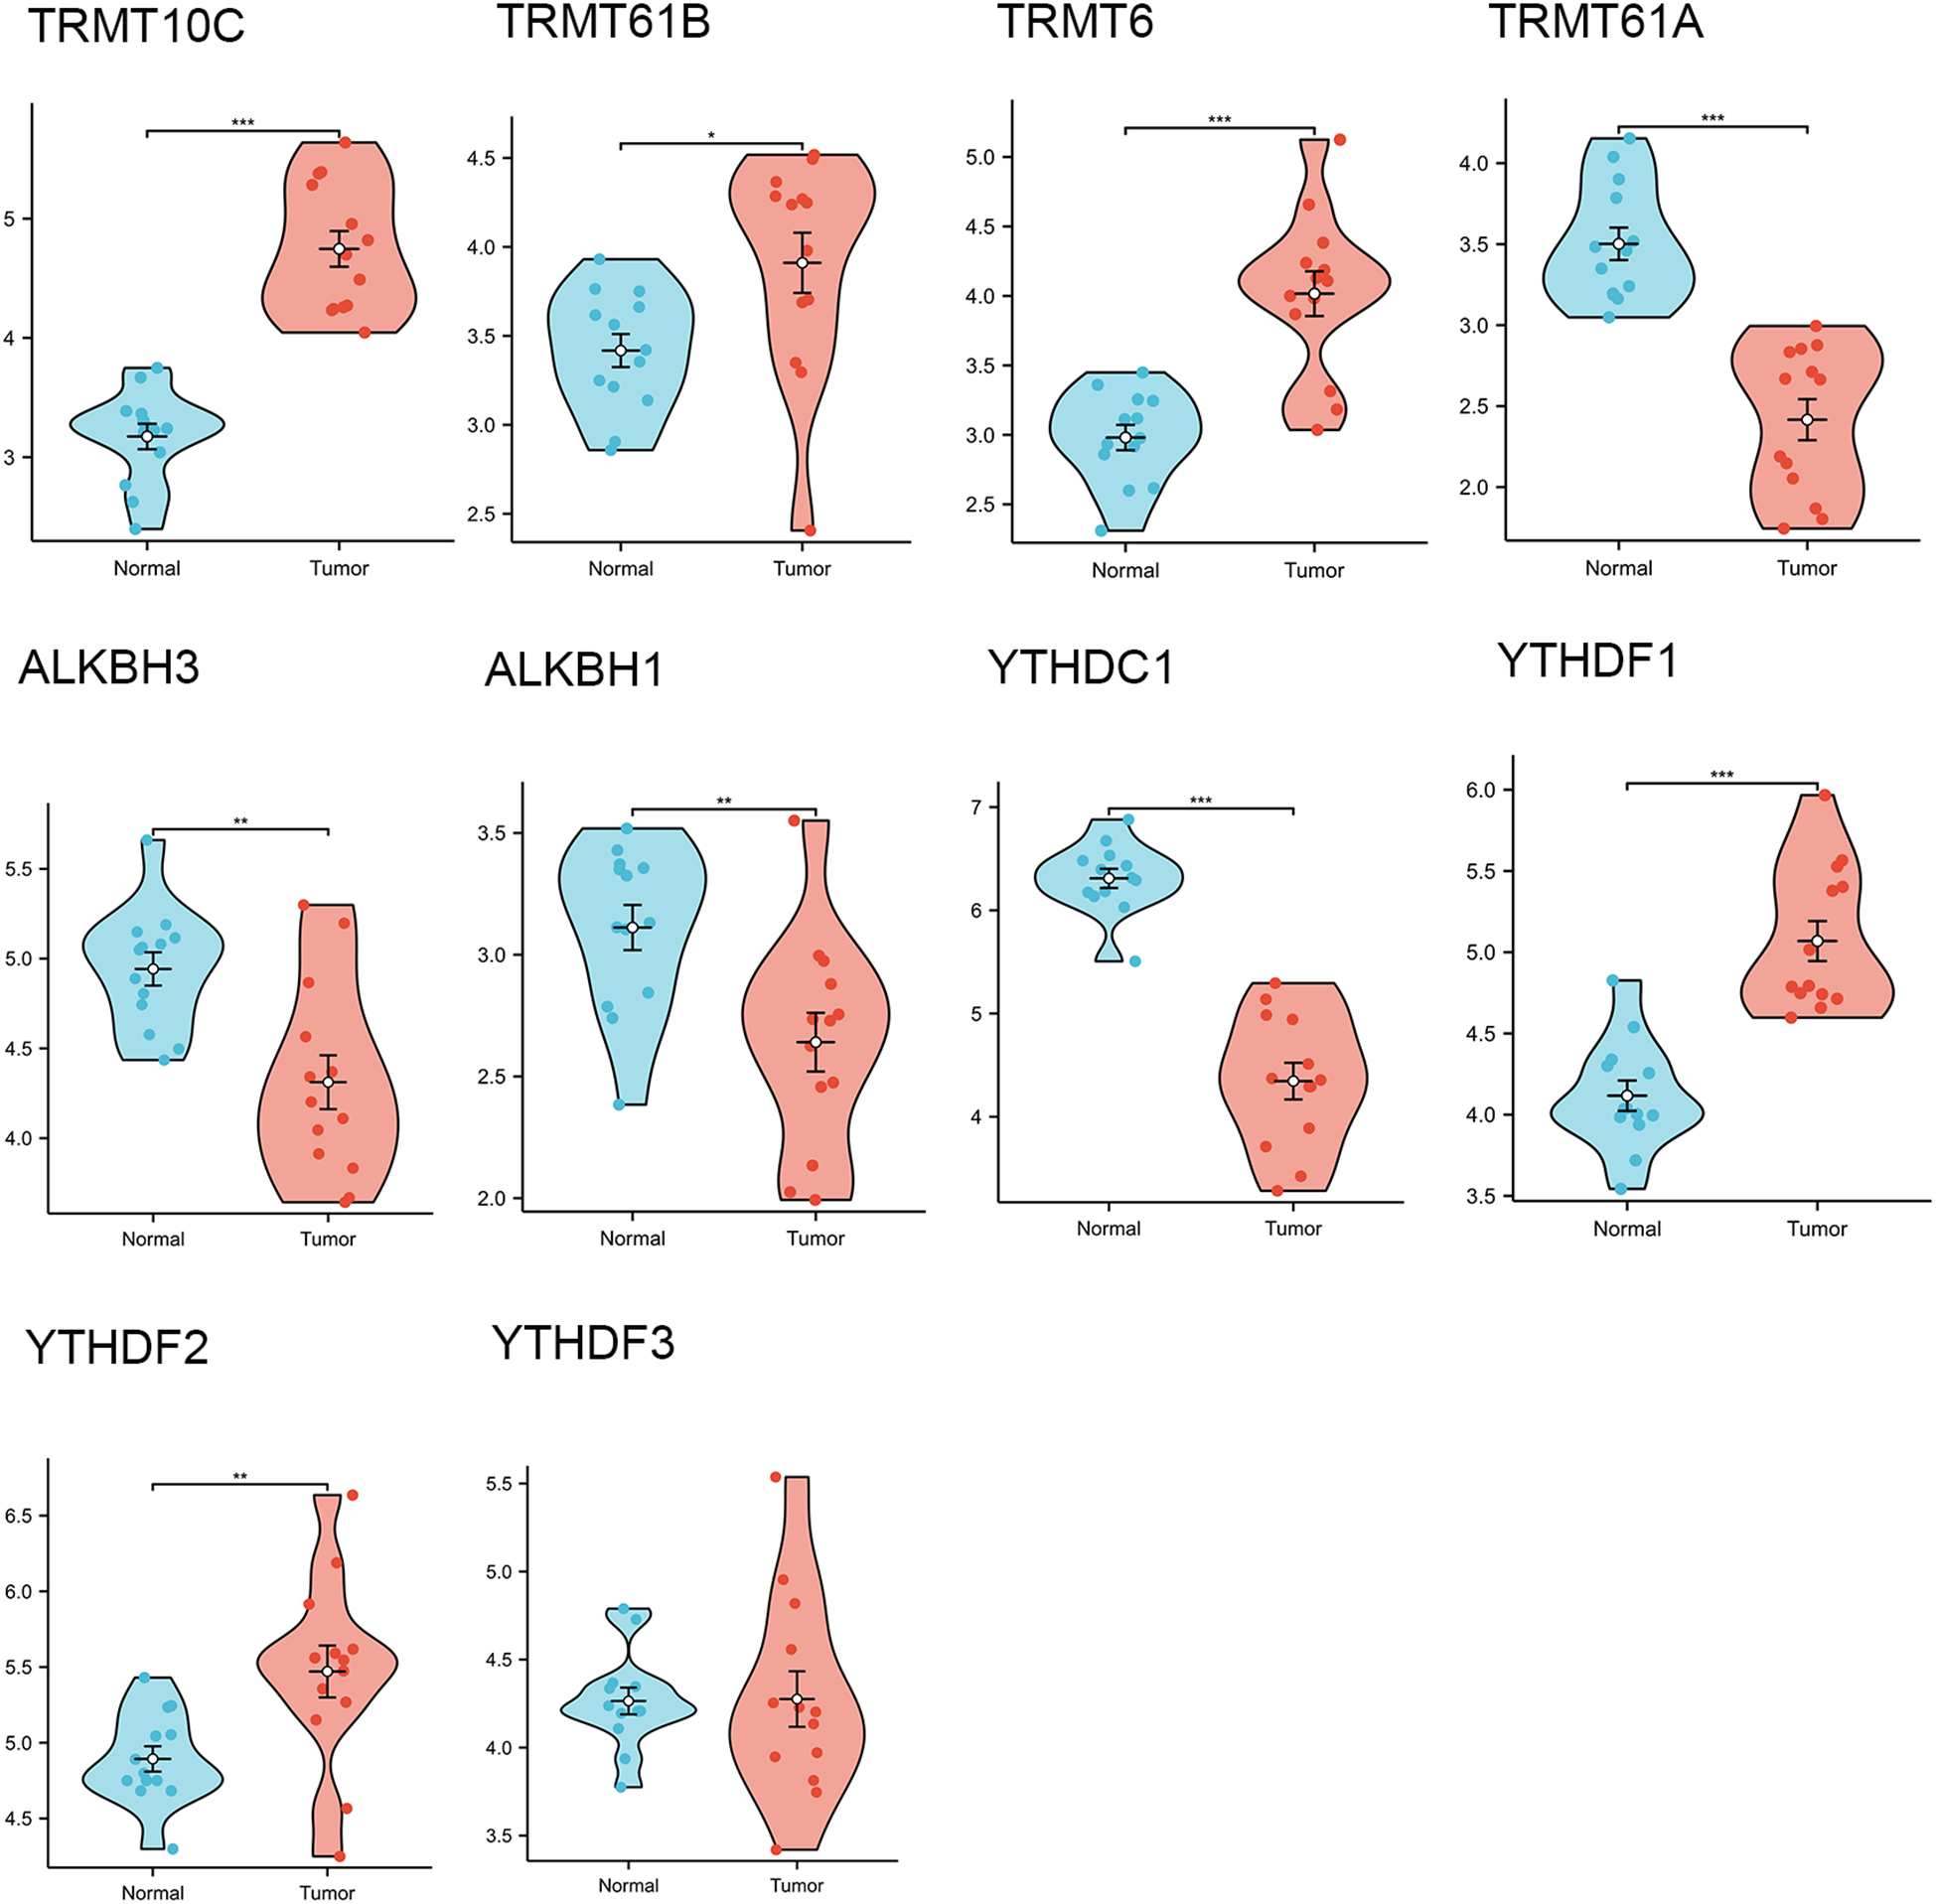
The differential expressions of 10 m1A regulators in ovarian cancer tissues (n=13) and normal tissues (n=13) collected in our hospital. “*” means <0.05, “**” means <0.01, “***” means <0.001.
3.2 The impact of m1A regulators’ expression on the prognosis of OC patients
The progression-free survival (PFS) curves derived from the Kaplan-Meier Plotter database (Figure 4) indicate that high expression levels of eight m1A regulators are associated with reduced PFS. These regulators include TRMT10C (HR = 1.25; 95% CI, 1.03-1.51; P = 0.023), TRMT61B (HR = 1.17; 95% CI, 1.02-1.35; P = 0.027), TRMT6 (HR = 1.43; 95% CI, 1.19-1.73; P = 0.00018), TRMT61A (HR = 1.54; 95% CI, 1.27-1.87; P = 1.3e-05), ALKBH1 (HR = 1.51; 95% CI, 1.25-1.82; P = 2e-05), YTHDC1 (HR = 1.28; 95% CI, 1.13-1.46; P = 0.00014), YTHDF1/FLJ20391 (HR = 1.34; 95% CI, 1.18-1.53; P = 6.2e-06), and YTHDF2 (HR = 1.35; 95% CI, 1.19-1.54; P = 4.5e-06). In contrast, high expression of YTHDF3 (HR = 0.76; 95% CI, 0.61-0.95; P = 0.015) correlates with improved progression-free survival, with all differences being statistically significant. Furthermore, the overall survival (OS) curve obtained from the Kaplan-Meier Plotter database (Figure 5) reveals that high expression of seven m1A regulators is associated with decreased OS. These regulators include TRMT10C (HR = 1.47; 95% CI, 1.2-1.8; P = 0.00018), TRMT61B (HR = 1.2; 95% CI, 1.04-1.38; P = 0.01), TRMT6 (HR = 1.39; 95% CI, 1.14-1.7; P = 0.0014), TRMT61A (HR = 1.31; 95% CI, 1.07-1.61; P = 0.0083), ALKBH1 (HR = 1.25; 95% CI, 1.02-1.53; P = 0.035), YTHDF1/FLJ20391 (HR = 1.23; 95% CI, 1.08-1.41; P = 0.0024), and YTHDF2 (HR = 1.26; 95% CI, 1.1-1.43; P = 0.00062).
Figure 4
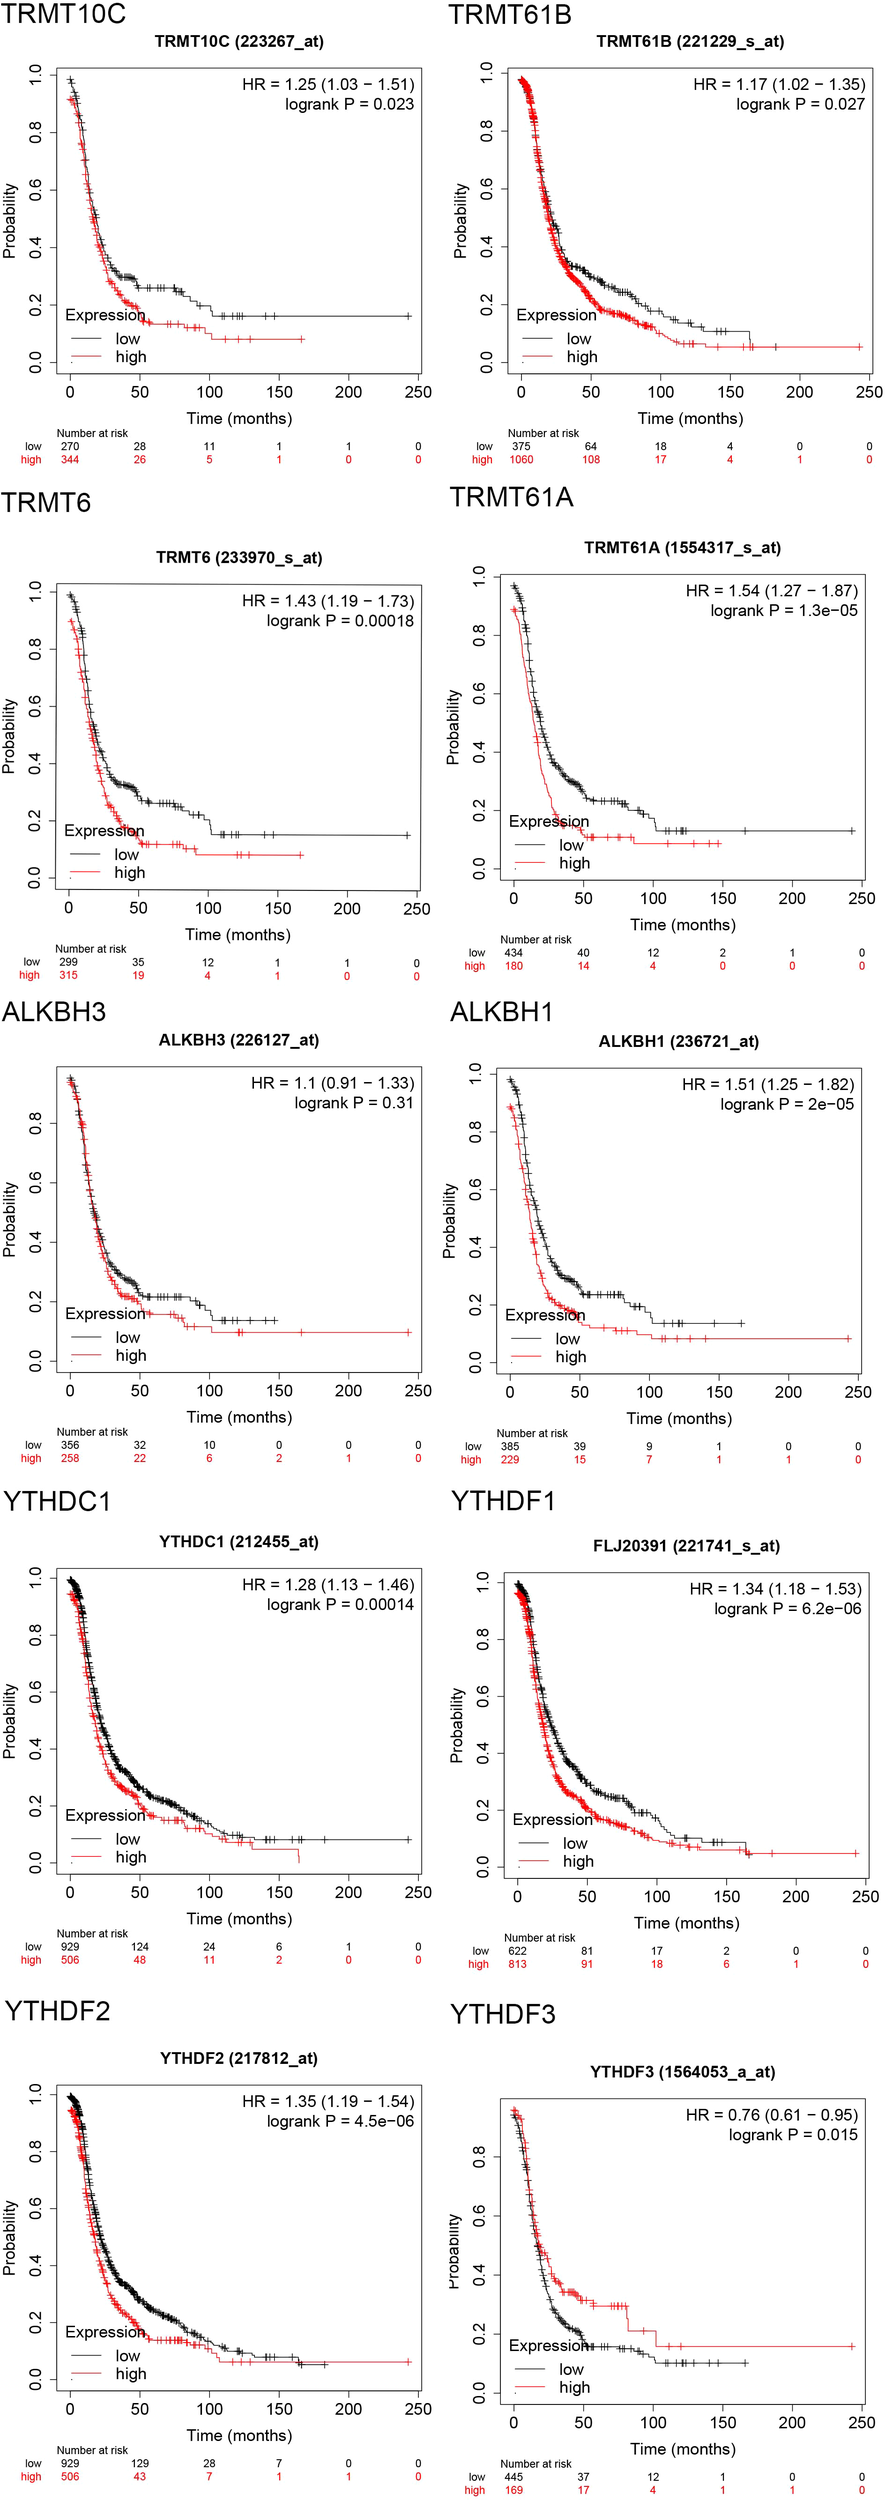
Progression free survival (PFS) curves of 10 m1A regulators in the Kaplan-Meier Plotter database.
Figure 5
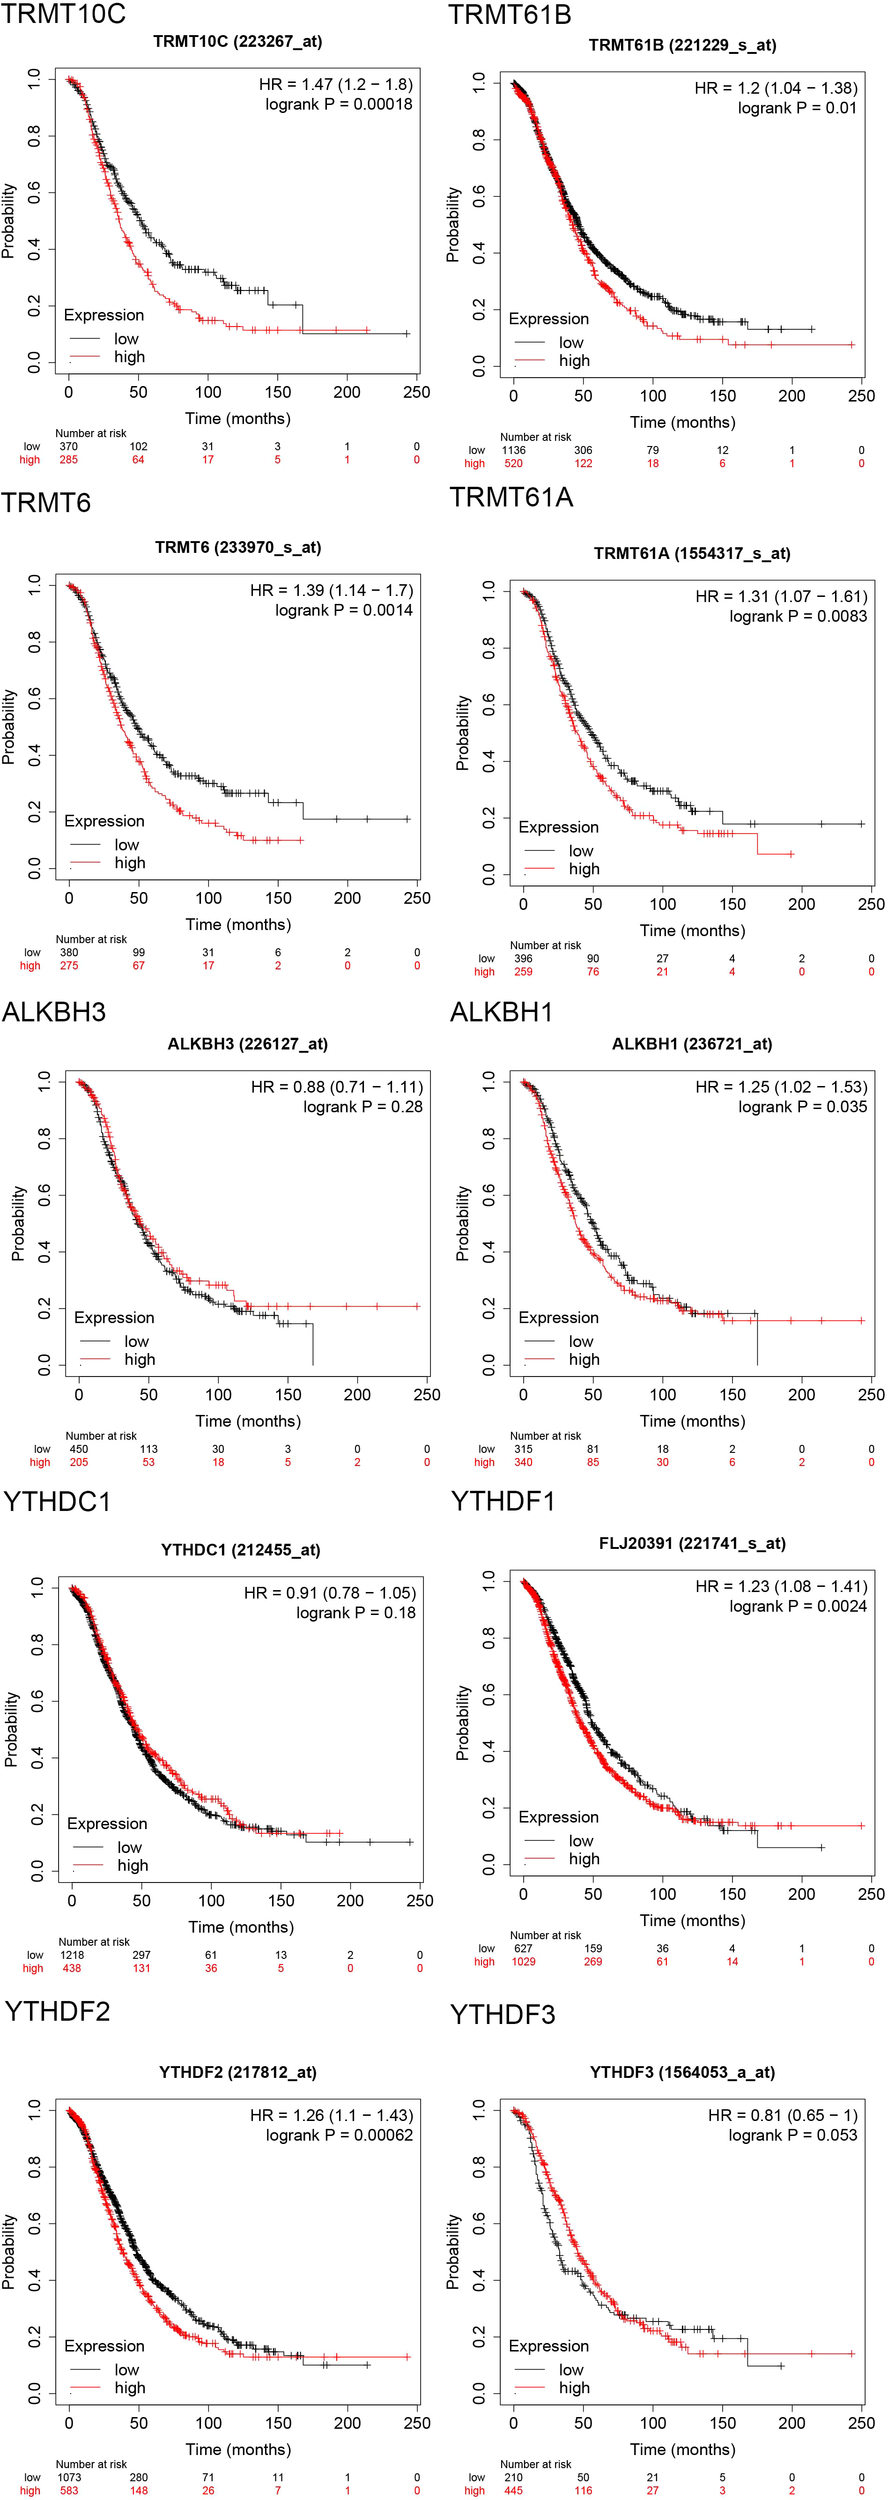
Overall survival (OS) curves of 10 m1A regulators in the Kaplan-Meier Plotter database.
3.3 Immunohistochemical validation of TRMT6 expression in OC tissues and normal tissues
The immunohistochemical results, as illustrated in Figure 6, indicated that TRMT6 was positively expressed in 38 of the 57 OC tissues, whereas only 6 of the 35 normal ovarian tissues exhibited positive expression, with the remainder being negative. This difference was statistically significant (P < 0.001).
Figure 6
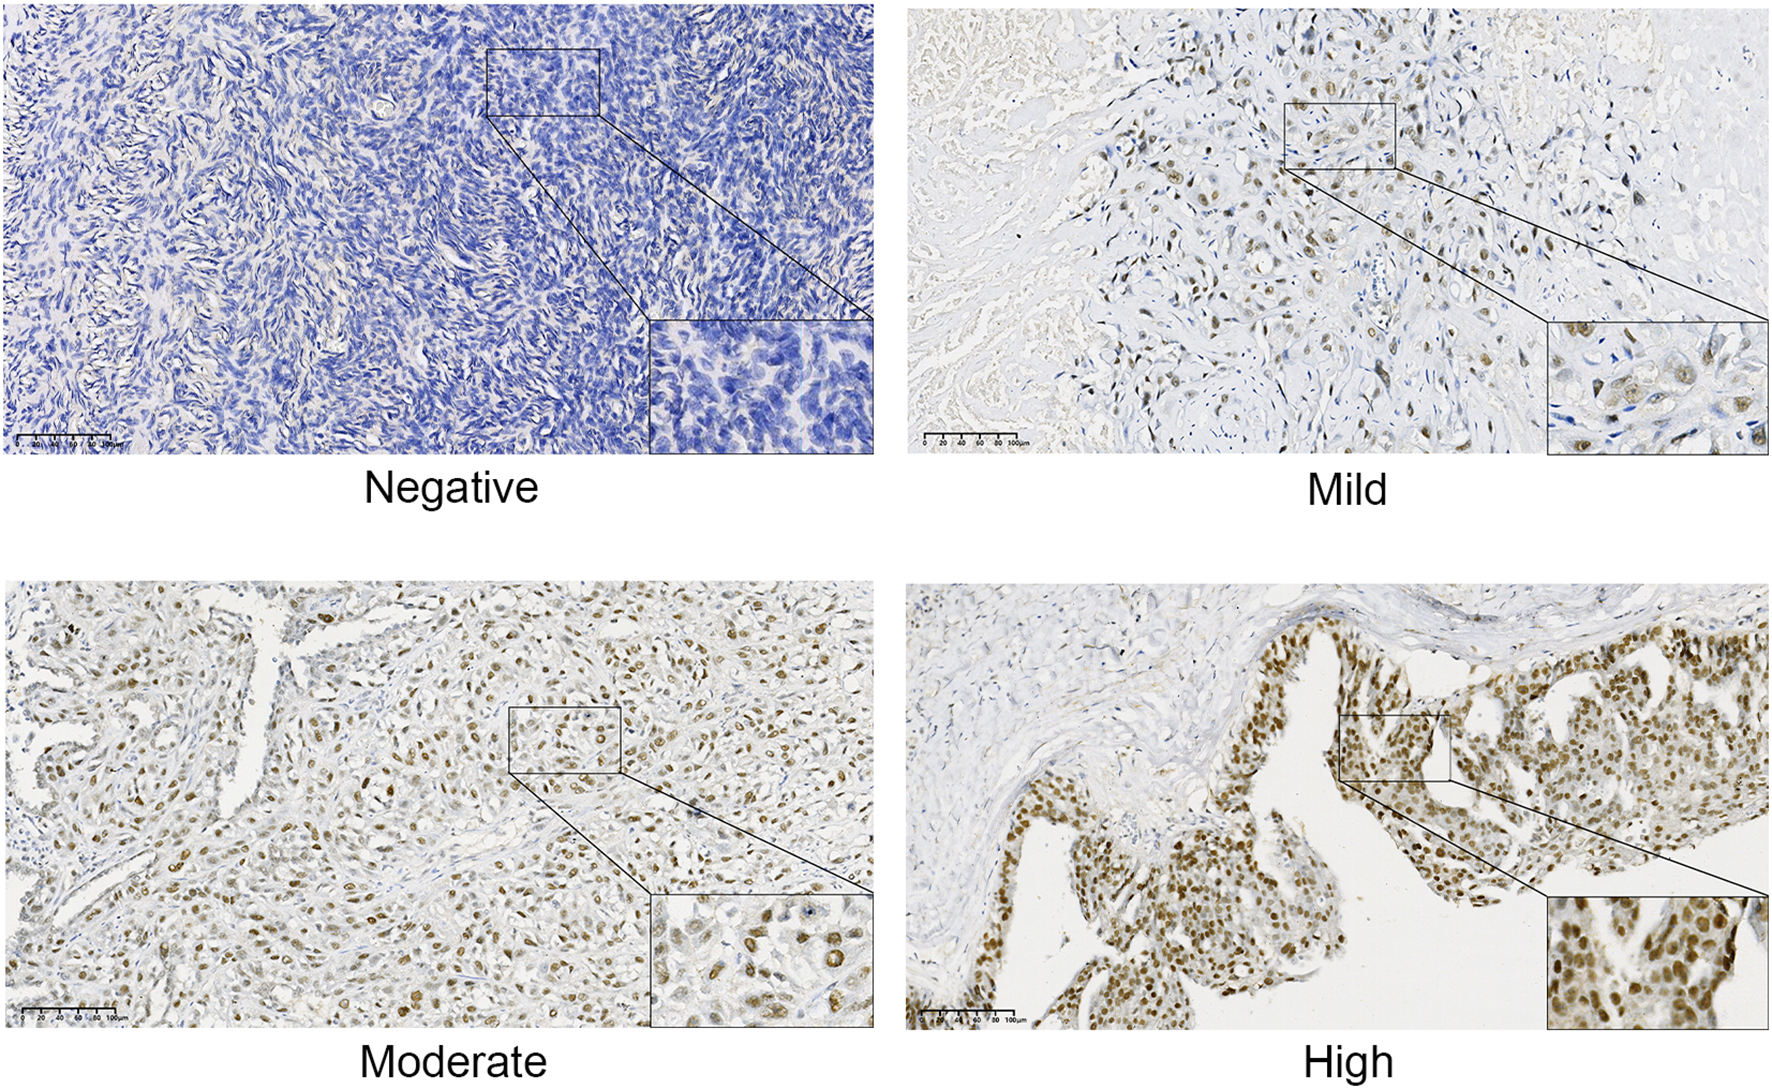
Immunohistochemical staining results of TRMT6 expression in ovarian cancer and normal tissues.
3.4 The relationship between TRMT6 expression and overall survival in OC patients
Cox regression analysis indicated that patients exhibiting high TRMT6 expression in OC tissues had a significantly lower overall survival rate compared to those with low TRMT6 expression (HR = 2.74; 95% CI, 1.13-6.65; P = 0.026). The difference was statistically significant, as illustrated in Figure 7.
Figure 7
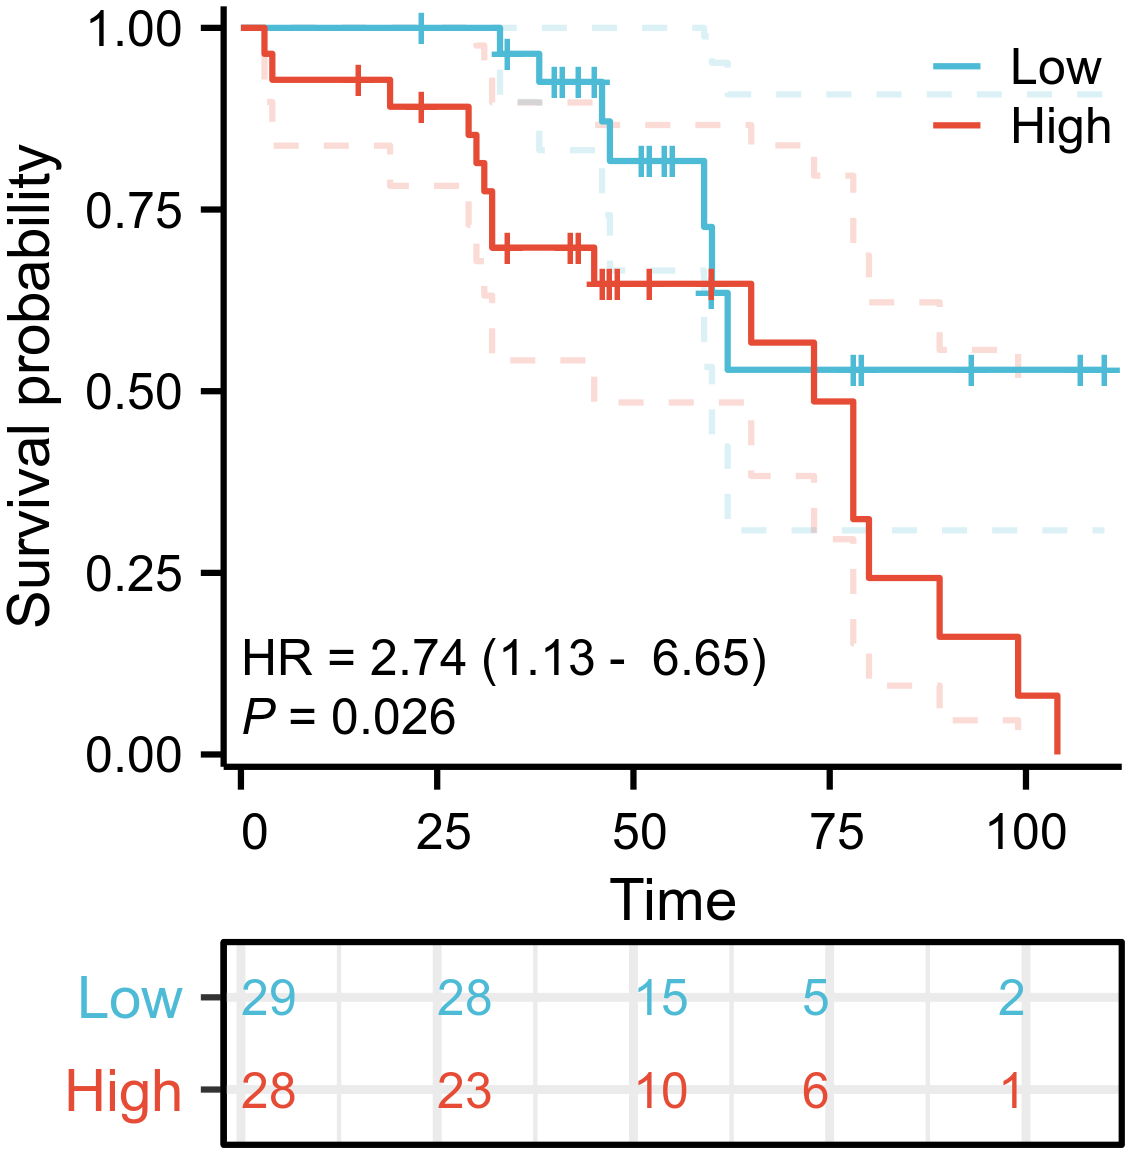
Overall survival (OS) curves of TRMT6 in ovarian cancer patients.
3.5 Correlation analysis of TRMT6 expression with clinicopathological characteristics of OC patients
There was no statistically significant correlation between TRMT6 expression and various clinicopathological characteristics in OC patients. These characteristics included pathological stage (p=0.022), age (p=0.492), lymphatic invasion (p=0.483), Omental invasion (p=0.516), primary therapy outcome (p=0.313), pathological type (p=0.338), and whether the cancer was unilateral or bilateral (p=0.196), as illustrated in Table 2.
Table 2
| Characteristics | Score in IHC <6.5 | Score in IHC >6.5 | P value |
|---|---|---|---|
| n | 28 | 29 | |
| Pathological.Stage, n (%) | 0.022 | ||
| Stage III | 9 (32.1%) | 17 (58.6%) | |
| Stage IV | 2 (7.1%) | 4 (13.8%) | |
| Stage I | 8 (28.6%) | 7 (24.1%) | |
| Stage II | 9 (32.1%) | 1 (3.4%) | |
| Age, mean ± sd | 54.571 ± 10.119 | 56.621 ± 12.123 | 0.492 |
| Lymphatic invasion, n (%) | 0.483 | ||
| Yes | 10 (35.7%) | 13 (44.8%) | |
| No | 18 (64.3%) | 16 (55.2%) | |
| Omental invasion, n (%) | 0.516 | ||
| Yes | 12 (42.9%) | 10 (34.5%) | |
| No | 16 (57.1%) | 19 (65.5%) | |
| Primary therapy outcome, n (%) | 0.313 | ||
| PD | 2 (7.1%) | 3 (10.3%) | |
| PR | 5 (17.9%) | 11 (37.9%) | |
| SD | 2 (7.1%) | 2 (6.9%) | |
| CR | 19 (67.9%) | 13 (44.8%) | |
| Pathologic.Type, n (%) | 0.338 | ||
| high-grade serous ovarian cancer | 17 (60.7%) | 23 (79.3%) | |
| granulosa cell tumor | 1 (3.6%) | 0 (0%) | |
| ovarian endometrioid carcinoma | 4 (14.3%) | 1 (3.4%) | |
| mucinous ovarian cancer | 3 (10.7%) | 3 (10.3%) | |
| ovarian clear cell carcinoma | 3 (10.7%) | 1 (3.4%) | |
| low-grade serous ovarian cancer | 0 (0%) | 1 (3.4%) | |
| Unilateral or bilateral, n (%) | 0.196 | ||
| Bilateral | 7 (25%) | 12 (41.4%) | |
| Right | 12 (42.9%) | 13 (44.8%) | |
| Left | 9 (32.1%) | 4 (13.8%) | |
| CA125, n (%) | 0.851 | ||
| Yes | 19 (67.9%) | 19 (65.5%) | |
| No | 9 (32.1%) | 10 (34.5%) | |
| HE4, n (%) | 0.514 | ||
| Yes | 14 (50%) | 17 (58.6%) | |
| No | 14 (50%) | 12 (41.4%) |
Correlation of the expression levels of TRMT6 with the clinicopathological characteristics of ovarian cancer patients.
3.6 Correlation analysis between TRMT6 expression and immune cell infiltration in OC
The expression of TRMT6 exhibits a weak negative correlation with the infiltration of various immune cell types in TCGA-OV/RNAseq/STAR/TPM dataset (Figure 8A), including cytotoxic cells (R=-0.274, p=5.3e-08), Th1 cells (R=-0.273, p=6.3e-08), pDC cells (R=-0.261, p=2.4e-07), CD8T cells (R=-0.237, p=2.8e-06), NK CD56 bright cells (R=-0.237, p=3e-06), iDC cells (R=-0.223, p=1.1e-05), NK CD56 dim cells (R=-0.219, p=1.7e-05), Neutrophils (R=-0.205, p=5.7e-05), T cells (R=-0.204, p=5.8e-05), Macrophages (R=-0.171, p=0.00083) and DC cells (R=-0.170, p=0.00084). Furthermore, we also found that in ovarian cancer tissues with high expression of TRMT6, the enrichment scores of T cells gamma delta(p<0.01)and Mast cells activated (p<0.05) were significantly lower than those in tissues with low expression (Figure 8B).
Figure 8
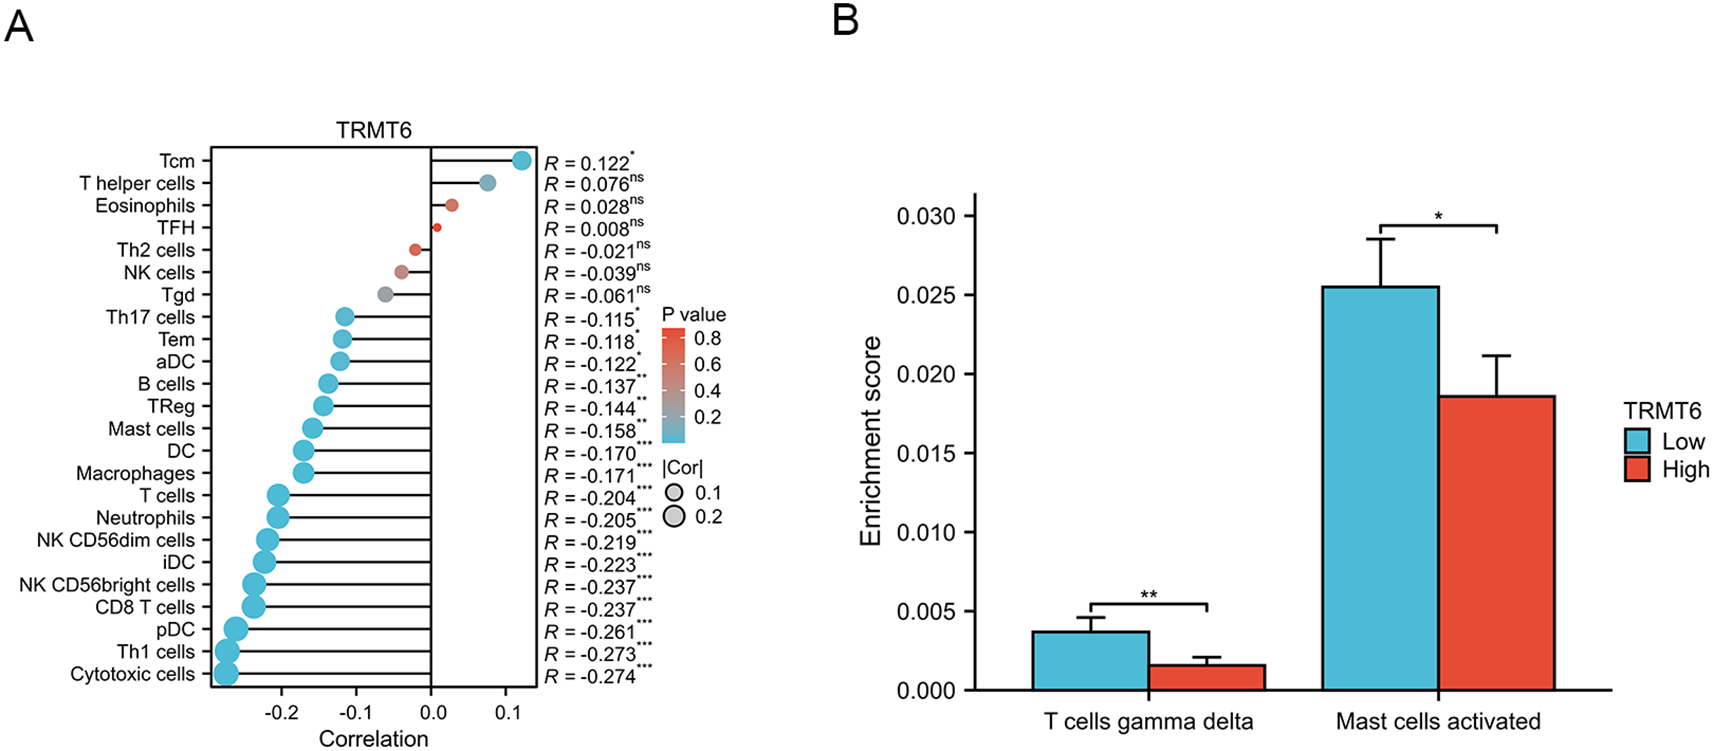
Correlation analysis between TRMT6 expression and tumor immune infiltration (A) The lollipop charts (B) The differential results of immune cell enrichment scores between high and low TRMT6 expression groups in ovarian cancer tissues from the TCGA database. “*” means <0.05, “**” means <0.01, “***” means <0.001.
3.7 Construction of a competing endogenous RNA network
In the ceRNA network built from TRMT6-based differential analysis, HPSE2 has the most nodes among mRNAs, hsa-miR-17-5p among miRNAs, and Lnc SNHG14 among lncRNAs (Figure 9).
Figure 9
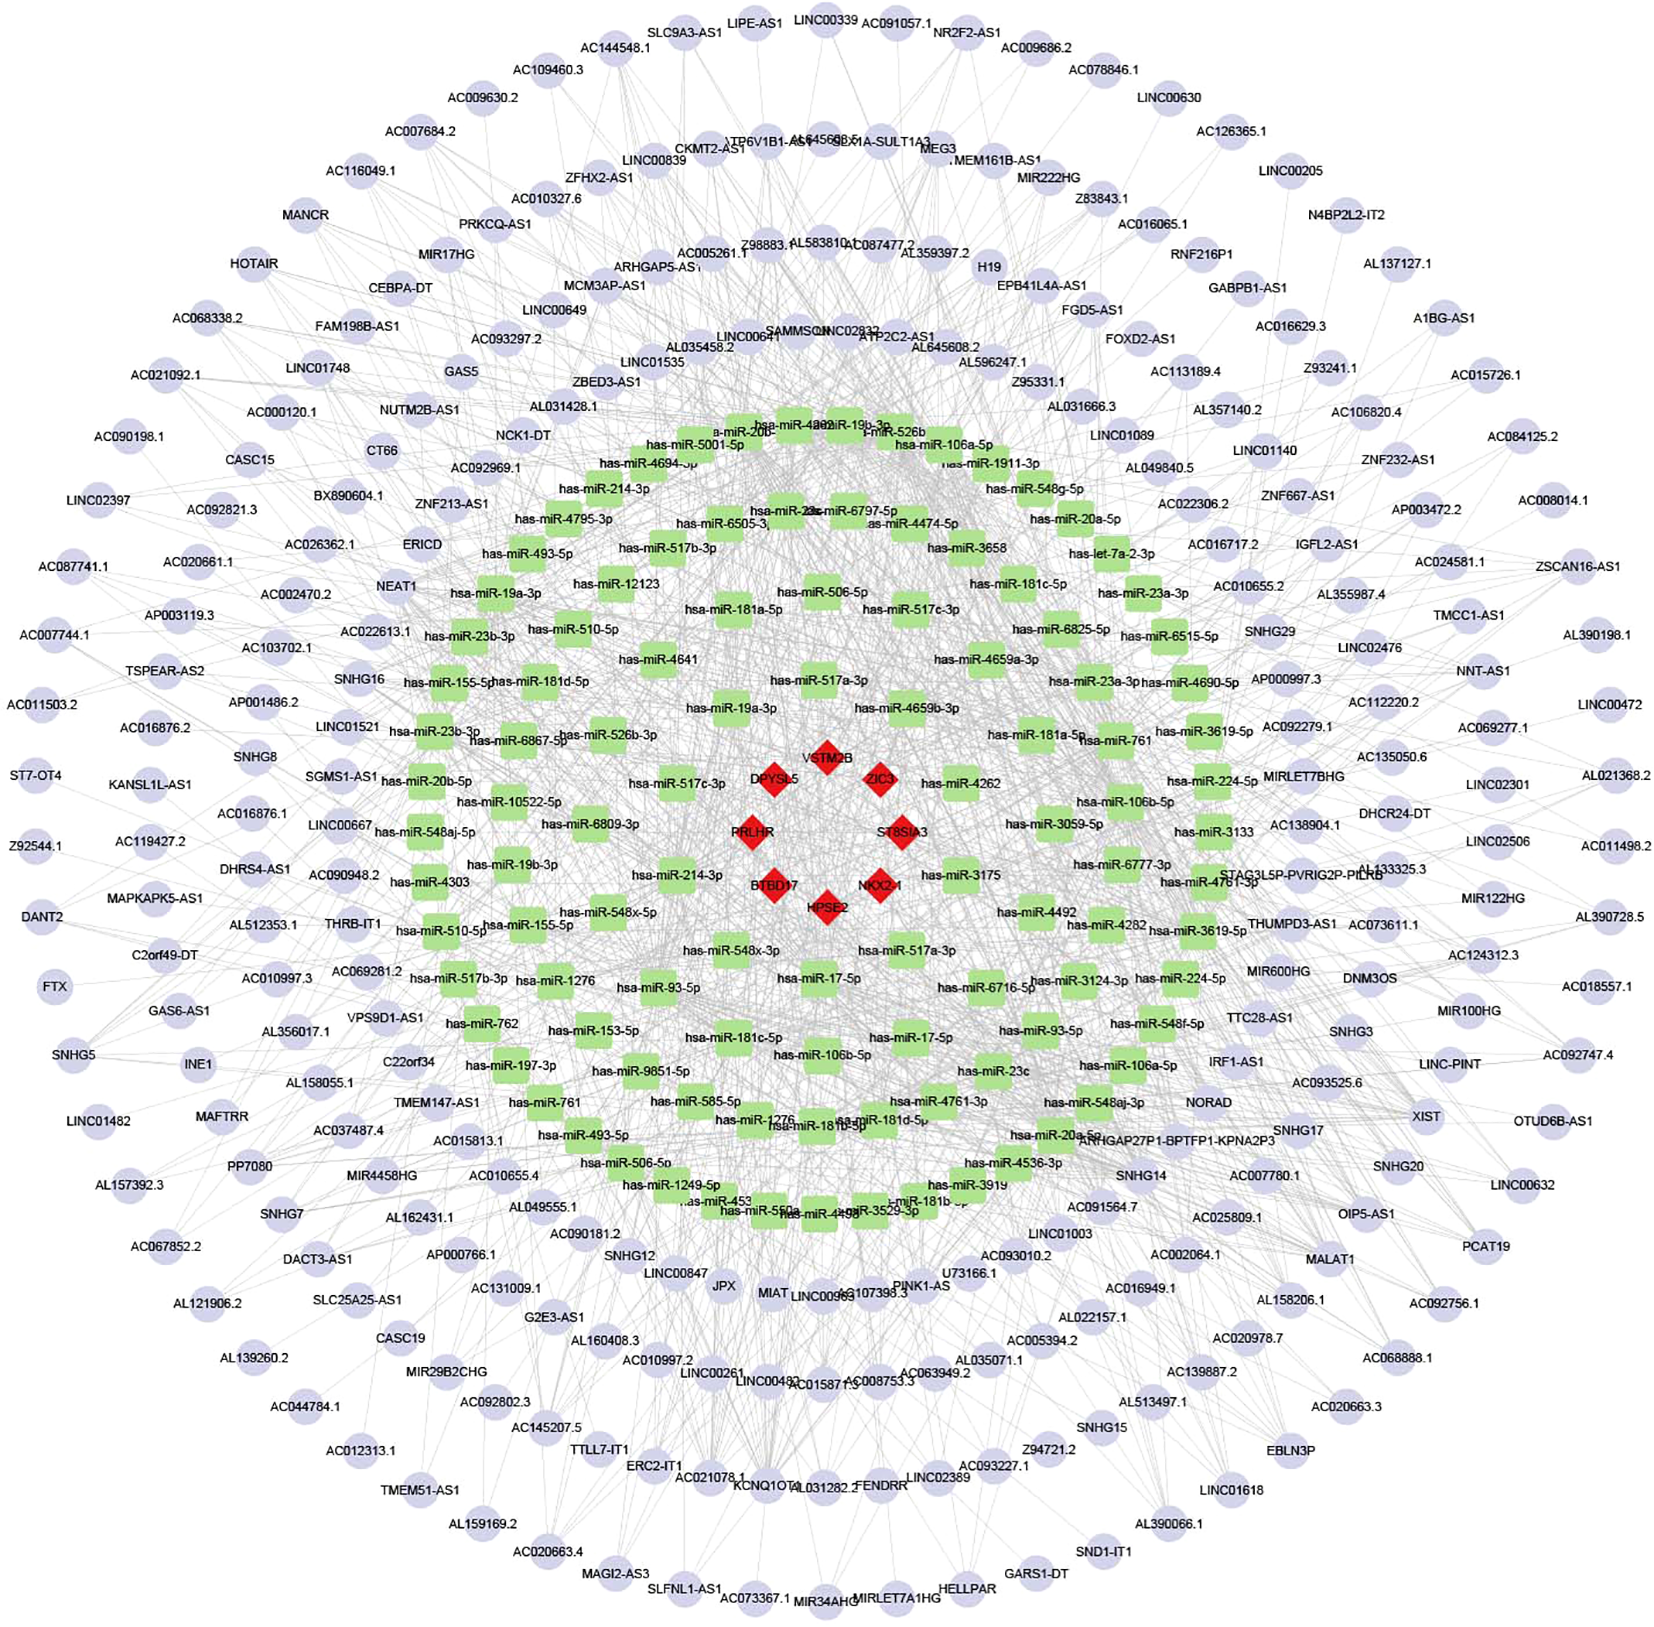
The ceRNA network. Red diamonds represent mRNA, green rectangles represent miRNA, and purple circles represent LncRNA.
4 Discussion
OC ranks as the eighth most common and the fifth most lethal malignant tumor globally. The incidence rate of OC is approximately 3.4%, with a mortality rate of about 4.7%. Each year, over 3 million women are diagnosed with the disease, and around 152,000 patients succumb to OC, posing a serious threat to women’s health and survival (23). In clinical practice, ovarian tumors are typically first detected via transvaginal ultrasound (TVS). However, TVS has certain limitations in terms of diagnostic accuracy, and the accuracy of diagnosis urgently requires improvement and optimization (24). Detecting serum biomarkers is a convenient, economical, and non-invasive method for predicting malignant tumors. Investigating the pathogenesis of OC and identifying more reliable biomarkers for the development of clinical predictive models can aid in the early detection of the disease and improve patient prognosis. In recent years, epigenetic research has garnered widespread attention, with approximately 170 types of RNA chemical modifications discovered across various RNAs, including both coding RNAs and non-coding RNAs (ncRNAs) (25–27). Among these RNA modifications, methylation modifications are the most common and extensively studied, accounting for over 60% of all RNA chemical modifications, including N6-methyladenosine (m6A), N1-methyladenosine (m1A), 5-methylcytosine (m5C), and N7-methylguanosine (m7G) (28, 29). Although research on the functions of RNA methylation modifications is still in its early stages, an increasing body of data indicates that dysregulation of RNA methylation plays a significant role in the development of various human diseases (30–32). Cancer cells often undergo genetic and/or epigenetic changes, which may accompany dysfunction of oncogenes or tumor suppressor genes (33, 34). As a prevalent form of post-transcriptional modification in epigenetics, RNA methylation plays a crucial role in the spatiotemporal regulation of gene expression (35, 36). Among these modifications, N6-methyladenosine (m6A) is the most extensively studied in the context of cancer (37, 38). Another significant post-transcriptional modification is N1-methyladenosine (m1A), which is primarily regulated by three types of enzymes: writers (TRMT6, TRMT10C, TRMT61A, TRMT61B), readers (YTHDC1, YTHDF1 - 3), and erasers (ALKBH1, ALKBH3). The investigation of m1A regulators in tumorigenesis remains in its early stages. Research indicates that TRMT6 is upregulated in hepatocellular carcinoma (HCC) tissues, and it correlates with poorer overall survival and recurrence-free survival rates (39). Additionally, the eraser ALKBH3 is overexpressed in lung cancer (LC) (40) and promotes cancer cell proliferation, migration, and invasion by inducing tRNA-derived small RNAs (41). Recent studies have revealed the correlation between m1A regulators and the mTOR and ErbB signaling pathways in gastrointestinal cancer (42). Research indicates that m1A regulators and methylation modification patterns significantly influence the evolving immune microenvironment during the development of OC (10, 43). The m1A-related phenotypes are associated with immune cell infiltration in the tumor microenvironment (TME), with distinct m1A patterns identified in immune desert, immune inflammation, and immune exclusion phenotypes (43). Furthermore, eight m1A regulators exhibit a positive correlation with activated mast cells, plasma cells, and M1 macrophages in abdominal aortic aneurysms. Notably, YTHDF3 has been demonstrated to promote M1 polarization of macrophages while inhibiting M2 polarization (44). However, the clinical significance of m1A regulators in OC remains poorly understood.
To address this issue, we utilized bioinformatics analysis to identify ten m1A regulators that exhibited differential expression between OC tissues and normal tissues, and were closely associated with prognosis. Subsequently, we validated the differential expression of the m1A regulator TRMT6 using qRT-PCR in collected OC tissues and normal tissues, which aligned with the results of our bioinformatics analysis. Given the association between TRMT6 overexpression and poor prognosis in OC, we further confirmed its statistically significant differential expression between OC and normal tissues through immunohistochemistry experiments. These experiments revealed that TRMT6 expression has a negative correlation with prognosis. Our research showed that the expression levels of TRMT6 correlate with ovarian cancer staging, but the expression levels of TRMT6 demonstrated no significant correlation with other clinicopathological features, such as lymph node metastasis or omental metastasis. This raises the question: through what mechanism does TRMT6 influence the prognosis of OC patients? Considering the current research indicating that m1A methylation modification significantly impacts the prognosis of OC and shapes the immune microenvironment, it is reasonable to explore whether this might be the key to understanding how TRMT6 affects the prognosis. It is essential to consider that TRMT6 may affect the prognosis of OC patients by participating in the regulation of tumor cell immune infiltration. Notably, our research findings suggest a negative correlation between TRMT6 expression and the infiltration of various tumor immune cells. Despite the weak correlation, statistical significance supports a potential association between TRMT6 and immune-infiltrating cells. The negative correlation (r < 0, p < 0.001) implies that TRMT6 may exert broad yet subtle regulatory effects on immune-infiltrating cells within the tumor microenvironment. This weak correlation may be attributed to several factors. 1. Large sample size. While a large sample size enhances statistical significance, the effect size may be diluted. 2. Multi-factorial regulation. The abundance of immune-infiltrating cells is co-regulated by multiple genes and pathways, limiting the contribution of a single gene, such as TRMT6. 3. Indirect effects. TRMT6 may indirectly influence immune cell infiltration by regulating other molecules, including RNA-modifying enzymes or immune-related factors. Moreover, the differences in enrichment scores of T cells gamma delta and Mast cells activated between the high and low expression groups also suggested that TRMT6 contributes to poor prognosis in OC patients by promoting tumor immune escape, rather than through conventional pathways like facilitating lymph node metastasis.
To delve into the mechanism by which TRMT6 influences the immune response in ovarian cancer, we conducted differential gene expression analysis based on the varying expression levels of TRMT6 and constructed a ceRNA network. As the most interconnected mRNA in the ceRNA network, the latest research showed that HPSE2 influenced tumor progression in multiple ways by facilitating interactions between tumors and host tissues. It created an ideal tumor microenvironment, promoting tumor growth, metastasis, and chemotherapy resistance (45). Given its multifaceted role in the tumor microenvironment, HPSE2 regulated these key traits, underscoring the need for HPSE2-targeted therapies (46). Besides the research on ovarian cancer, in the comprehensive analysis of the latest gastric cancer (GC) immune microenvironment-related ceRNA regulatory axis, researchers discovered that the LINC01133/miR-17-5p/PBLD axis played a crucial role in the development of GC (47). Researchers have discovered that the lncRNA SNHG14/hsa-miR-101-3p/KL/PLK1 regulatory axis plays a modulatory role in the immune microenvironment of lung adenocarcinoma (48). It is worth considering that TRMT6 may regulate the tumor immune microenvironment in ovarian cancer by interacting with HPSE, hsa-miR-17-5p, and lncRNA SNHG14. However, more in-depth fundamental experiments are needed to validate this conclusion.
The abnormal expression of the m1A regulator TRMT6 may influence patient prognosis by exerting indirect or synergistic effects within the tumor immune microenvironment (49). Pan-cancer analysis revealed that RNA methylation genes ALYREF, NSUN4, TRMT6, and YTHDF1 were associated with immune infiltration in the tumor microenvironment (49). GSEA and immune correlation analysis between different clusters suggested that m6A/m5C/m1A modification patterns played a significant role in the tumor microenvironment of gliomas, providing valuable information for anti-glioma immunotherapy (50). The study by Li et al. showed that the cluster subgroups and risk models of m6A/m5C/m1A regulatory genes were associated with poor prognosis and the immune microenvironment in hepatocellular carcinoma, potentially serving as a new tool for assessing the prognosis of hepatocellular carcinoma patients (51). Our study is the first to discover that the m1A regulator TRMT6 in OC may impact patient prognosis by promoting immune escape, which also provided a significant reference value for the immunotherapy of OC. In clinical practice, these study results may support developing TRMT6 blood-based testing to predict OC prognosis, and or assess immunotherapy response when combined with PD-1 testing. The TRMT6 gene worsens ovarian cancer prognosis by disrupting immune response pathways. Its major clinical implications are as follows: as a biomarker for prognosis, its expression levels can identify high-risk patients and guide personalized treatment; as a therapeutic target, inhibitors could reverse immune suppression, enhance immunotherapy efficacy, offering new ways to improve survival. However, the specific mechanisms underlying this influence require further experimental validation. Additionally, a more in-depth exploration of TRMT6’s role in OC treatment could contribute to the enhancement of targeted therapeutic strategies for OC.
Statements
Data availability statement
The datasets presented in this study can be found in online repositories. The names of the repository/repositories and accession number(s) can be found in the article/supplementary material.
Ethics statement
The studies involving humans were approved by The Ethics Committee of Hebei General Hospital. The studies were conducted in accordance with the local legislation and institutional requirements. The participants provided their written informed consent to participate in this study.
Author contributions
JZ: Data curation, Software, Writing – review & editing, Investigation, Visualization, Writing – original draft. XW: Software, Investigation, Writing – review & editing. YW: Writing – original draft. NL: Writing – original draft.
Funding
The author(s) declare financial support was received for the research and/or publication of this article. The study was funded by the Scientific Research Foundation of the Hebei Health Commission (NO. 20220862 and NO.20240719).
Conflict of interest
The authors declare that the research was conducted in the absence of any commercial or financial relationships that could be construed as a potential conflict of interest.
Generative AI statement
The author(s) declare that no Generative AI was used in the creation of this manuscript.
Any alternative text (alt text) provided alongside figures in this article has been generated by Frontiers with the support of artificial intelligence and reasonable efforts have been made to ensure accuracy, including review by the authors wherever possible. If you identify any issues, please contact us.
Publisher’s note
All claims expressed in this article are solely those of the authors and do not necessarily represent those of their affiliated organizations, or those of the publisher, the editors and the reviewers. Any product that may be evaluated in this article, or claim that may be made by its manufacturer, is not guaranteed or endorsed by the publisher.
References
1
Siegel RL Miller KD Jemal A . Cancer statistics, 2019. CA Cancer J Clin. (2019) 69:7–34. doi: 10.3322/caac.21551
2
Zhang C Liu J Guo H Hong D Ji J Zhang Q et al . m6A RNA methylation regulators were associated with the Malignancy and prognosis of ovarian cancer. Bioengineered. (2021) 12:3159–76. doi: 10.1080/21655979.2021.1946305
3
Siegel RL Kratzer TB Giaquinto AN Sung H Jemal A . Cancer statistics, 2025. CA Cancer J Clin. (2025) 75:10–45. doi: 10.3322/caac.21871
4
Nombela P Miguel-López B Blanco S . The role of m(6)A, m(5)C and Ψ RNA modifications in cancer: Novel therapeutic opportunities. Mol Cancer. (2021) 20:18. doi: 10.1186/s12943-020-01263-w
5
Han X Guo J Fan Z . Interactions between m6A modification and miRNAs in Malignant tumors. Cell Death Dis. (2021) 12:598. doi: 10.1038/s41419-021-03868-5
6
Zhao W Qi X Liu L Ma S Liu J Wu J . Epigenetic regulation of m(6)A modifications in human cancer. Mol Ther Nucleic Acids. (2020) 19:405–12. doi: 10.1016/j.omtn.2019.11.022
7
Li J Zuo Z Lai S Zheng Z Liu B Wei Y et al . Differential analysis of RNA methylation regulators in gastric cancer based on TCGA data set and construction of a prognostic model. J Gastrointest Oncol. (2021) 12:1384–97. doi: 10.21037/jgo-21-325
8
Woo HH Chambers SK . Human ALKBH3-induced m(1)A demethylation increases the CSF-1 mRNA stability in breast and ovarian cancer cells. Biochim Biophys Acta Gene Regul Mech. (2019) 1862:35–46. doi: 10.1016/j.bbagrm.2018.10.008
9
Wu Y Chen Z Xie G Zhang H Wang Z Zhou J et al . RNA m(1)A methylation regulates glycolysis of cancer cells through modulating ATP5D. Proc Natl Acad Sci U S A. (2022) 119:e2119038119. doi: 10.1073/pnas.2119038119
10
Gao Y Wang H Li H Ye X Xia Y Yuan S et al . Integrated analyses of m(1)A regulator-mediated modification patterns in tumor microenvironment-infiltrating immune cells in colon cancer. Oncoimmunology. (2021) 10:1936758. doi: 10.1080/2162402x.2021.1936758
11
Chen K Shen D Tan L Lai D Han Y Gu Y et al . A pan-cancer analysis reveals the prognostic and immunotherapeutic value of ALKBH7. Front Genet. (2022) 13:822261. doi: 10.3389/fgene.2022.822261
12
Lyu C Niu Y Lai W Wang Y Wang Y Dai P et al . Rare and misincorporated DNA N(6)-methyladenine is a hallmark of cytotoxic stresses for selectively stimulating the stemness and proliferation of glioblastoma cells. Cell Discov. (2022) 8:39. doi: 10.1038/s41421-022-00399-x
13
Li J Zhu L Shi Y Liu J Lin L Chen X . m6A demethylase FTO promotes hepatocellular carcinoma tumorigenesis via mediating PKM2 demethylation. Am J Transl Res. (2019) 11(9):6084–92.
14
Li J Zhang H Wang H . N(1)-methyladenosine modification in cancer biology: Current status and future perspectives. Comput Struct Biotechnol J. (2022) 20:6578–85. doi: 10.1016/j.csbj.2022.11.045
15
Zhang C Jia G . Reversible RNA Modification N(1)-methyladenosine (m(1)A) in mRNA and tRNA. Genomics Proteomics Bioinf. (2018) 16:155–61. doi: 10.1016/j.gpb.2018.03.003
16
Safra M Sas-Chen A Nir R Winkler R Nachshon A Bar-Yaacov D et al . The m1A landscape on cytosolic and mitochondrial mRNA at single-base resolution. Nature. (2017) 551:251–5. doi: 10.1038/nature24456
17
Anreiter I Mir Q Simpson JT Janga SC Soller M . New twists in detecting mRNA modification dynamics. Trends Biotechnol. (2021) 39:72–89. doi: 10.1016/j.tibtech.2020.06.002
18
Vivian J Rao AA Nothaft FA Ketchum C Armstrong J Novak A et al . Toil enables reproducible, open source, big biomedical data analyses. Nat Biotechnol. (2017) 35:314–6. doi: 10.1038/nbt.3772
19
Hänzelmann S Castelo R Guinney J . GSVA: gene set variation analysis for microarray and RNA-seq data. BMC Bioinf. (2013) 14:7. doi: 10.1186/1471-2105-14-7
20
Bindea G Mlecnik B Tosolini M Kirilovsky A Waldner M Obenauf AC et al . Spatiotemporal dynamics of intratumoral immune cells reveal the immune landscape in human cancer. Immunity. (2013) 39:782–95. doi: 10.1016/j.immuni.2013.10.003
21
Chen B Khodadoust MS Liu CL Newman AM Alizadeh AA . Profiling tumor infiltrating immune cells with CIBERSORT. Methods Mol Biol. (2018) 1711:243–59. doi: 10.1007/978-1-4939-7493-1_12
22
Newman AM Liu CL Green MR Gentles AJ Feng W Xu Y et al . Robust enumeration of cell subsets from tissue expression profiles. Nat Methods. (2015) 12:453–7. doi: 10.1038/nmeth.3337
23
Sung H Ferlay J Siegel RL Laversanne M Soerjomataram I Jemal A et al . Global cancer statistics 2020: GLOBOCAN estimates of incidence and mortality worldwide for 36 cancers in 185 countries. CA Cancer J Clin. (2021) 71:209–49. doi: 10.3322/caac.21660
24
Campbell S Gentry-Maharaj A . The role of transvaginal ultrasound in screening for ovarian cancer. Climacteric. (2018) 21:221–6. doi: 10.1080/13697137.2018.1433656
25
Nachtergaele S He C . Chemical modifications in the life of an mRNA transcript. Annu Rev Genet. (2018) 52:349–72. doi: 10.1146/annurev-genet-120417-031522
26
Boccaletto P Machnicka MA Purta E Piatkowski P Baginski B Wirecki TK et al . MODOMICS: a database of RNA modification pathways. 2017 update. Nucleic Acids Res. (2018) 46:D303–d7. doi: 10.1093/nar/gkx1030
27
Mathlin J Le Pera L Colombo T . A census and categorization method of epitranscriptomic marks. Int J Mol Sci. (2020) 21(13):4684. doi: 10.3390/ijms21134684
28
Chen Y Wang J Xu D Xiang Z Ding J Yang X et al . m(6)A mRNA methylation regulates testosterone synthesis through modulating autophagy in Leydig cells. Autophagy. (2021) 17:457–75. doi: 10.1080/15548627.2020.1720431
29
Courtney DG Tsai K Bogerd HP Kennedy EM Law BA Emery A et al . Epitranscriptomic addition of m(5)C to HIV-1 transcripts regulates viral gene expression. Cell Host Microbe. (2019) 26:217–27.e6. doi: 10.1016/j.chom.2019.07.005
30
Wang Q Chen C Ding Q Zhao Y Wang Z Chen J et al . METTL3-mediated m(6)A modification of HDGF mRNA promotes gastric cancer progression and has prognostic significance. Gut. (2020) 69:1193–205. doi: 10.1136/gutjnl-2019-319639
31
Dorn LE Lasman L Chen J Xu X Hund TJ Medvedovic M et al . The N(6)-methyladenosine mRNA methylase METTL3 controls cardiac homeostasis and hypertrophy. Circulation. (2019) 139:533–45. doi: 10.1161/circulationaha.118.036146
32
Berulava T Buchholz E Elerdashvili V Pena T Islam MR Lbik D et al . Changes in m6A RNA methylation contribute to heart failure progression by modulating translation. Eur J Heart Fail. (2020) 22:54–66. doi: 10.1002/ejhf.1672
33
Yan J Liu J Huang Z Huang W Lv J . FOXC2-AS1 stabilizes FOXC2 mRNA via association with NSUN2 in gastric cancer cells. Hum Cell. (2021) 34:1755–64. doi: 10.1007/s13577-021-00583-3
34
Zhang LY Li PL Wang TZ Zhang XC . Prognostic values of 5-hmC, 5-mC and TET2 in epithelial ovarian cancer. Arch Gynecol Obstet. (2015) 292:891–7. doi: 10.1007/s00404-015-3704-3
35
Wang L Gao S . Identification of 5-methylcytosine-related signature for predicting prognosis in ovarian cancer. Biol Res. (2021) 54:18. doi: 10.1186/s40659-021-00340-8
36
Gao W Chen L Lin L Yang M Li T Wei H et al . SIAH1 reverses chemoresistance in epithelial ovarian cancer via ubiquitination of YBX-1. Oncogenesis. (2022) 11:13. doi: 10.1038/s41389-022-00387-6
37
Kang Y Hu W Ivan C Dalton HJ Miyake T Pecot CV et al . Role of focal adhesion kinase in regulating YB-1-mediated paclitaxel resistance in ovarian cancer. J Natl Cancer Inst. (2013) 105:1485–95. doi: 10.1093/jnci/djt210
38
Xu J Liu X Chen Y Wang Y Liu T Yi P . RNA 5-methylcytosine regulators contribute to metabolism heterogeneity and predict prognosis in ovarian cancer. Front Cell Dev Biol. (2022) 10:807786. doi: 10.3389/fcell.2022.807786
39
Han X Liu D Zhou Y Wang L Hou H Chen H et al . The negative feedback between miR-143 and DNMT3A regulates cisplatin resistance in ovarian cancer. Cell Biol Int. (2021) 45:227–37. doi: 10.1002/cbin.11486
40
Furuichi Y . Discovery of m(7)G-cap in eukaryotic mRNAs. Proc Jpn Acad Ser B Phys Biol Sci. (2015) 91:394–409. doi: 10.2183/pjab.91.394
41
Murthy KG Park P Manley JL . A nuclear micrococcal-sensitive, ATP-dependent exoribonuclease degrades uncapped but not capped RNA substrates. Nucleic Acids Res. (1991) 19:2685–92. doi: 10.1093/nar/19.10.2685
42
Zhao Y Zhao Q Kaboli PJ Shen J Li M Wu X et al . m1A regulated genes modulate PI3K/AKT/mTOR and erbB pathways in gastrointestinal cancer. Transl Oncol. (2019) 12:1323–33. doi: 10.1016/j.tranon.2019.06.007
43
Liu J Chen C Wang Y Qian C Wei J Xing Y et al . Comprehensive of N1-methyladenosine modifications patterns and immunological characteristics in ovarian cancer. Front Immunol. (2021) 12:746647. doi: 10.3389/fimmu.2021.746647
44
Wu Y Jiang D Zhang H Yin F Guo P Zhang X et al . N1-methyladenosine (m1A) regulation associated with the pathogenesis of abdominal aortic aneurysm through YTHDF3 modulating macrophage polarization. Front Cardiovasc Med. (2022) 9:883155. doi: 10.3389/fcvm.2022.883155
45
Jayatilleke KM Hulett MD . Heparanase and the hallmarks of cancer. J Transl Med. (2020) 18:453. doi: 10.1186/s12967-020-02624-1
46
Vlodavsky I Kayal Y Hilwi M Soboh S Sanderson RD Ilan N . Heparanase-A single protein with multiple enzymatic and nonenzymatic functions. Proteoglycan Res. (2023) 1:e6. doi: 10.1002/pgr2.6
47
Chen J Chen JG Sun B Wu JH Du CY . Integrative analysis of immune microenvironment-related CeRNA regulatory axis in gastric cancer. Math Biosci Eng. (2020) 17:3953–71. doi: 10.3934/mbe
48
Liu X Li X Shen X Ma R Wang Z Hu Y . Construction of a prognostic model for lung adenocarcinoma based on necroptosis genes and its exploration of the potential for tumor immunotherapy. Transl Cancer Res. (2025) 14:2563–79. doi: 10.21037/tcr-24-2165
49
Li XY Yang XT . Correlation between the RNA methylation genes and immune infiltration and prognosis of patients with hepatocellular carcinoma: A pan-cancer analysis. J Inflammation Res. (2022) 15:3941–56. doi: 10.2147/JIR.S373776
50
Zhao K Li W Yang Y Hu X Dai Y Huang M et al . Comprehensive analysis of m6A/m5C/m1A-related gene expression, immune infiltration, and sensitivity of antineoplastic drugs in glioma. Front Immunol. (2022) 13: 955848. doi: 10.3389/fimmu.2022.955848
51
Li D Li K Zhang W Yang KW Mu DA Jiang GJ et al . The m6A/m5C/m1A regulated gene signature predicts the prognosis and correlates with the immune status of hepatocellular carcinoma. Front Immunol. (2022) 13:918140. doi: 10.3389/fimmu.2022.918140
Summary
Keywords
m1A regulator, TRMT6, ovarian cancer, poor prognosis, tumor cells immune escape
Citation
Zhao J, Wang X, Wang Y and Li N (2025) Impact of TRMT6 on prognosis and immune microenvironment in ovarian cancer. Front. Oncol. 15:1636191. doi: 10.3389/fonc.2025.1636191
Received
27 May 2025
Accepted
16 October 2025
Published
30 October 2025
Volume
15 - 2025
Edited by
Anand Rotte, Arcellx Inc, United States
Reviewed by
Kinjal Bhadresha, National Institutes of Health (NIH), United States
Chao Yang, St. Jude Children’s Research Hospital, United States
Updates
Copyright
© 2025 Zhao, Wang, Wang and Li.
This is an open-access article distributed under the terms of the Creative Commons Attribution License (CC BY). The use, distribution or reproduction in other forums is permitted, provided the original author(s) and the copyright owner(s) are credited and that the original publication in this journal is cited, in accordance with accepted academic practice. No use, distribution or reproduction is permitted which does not comply with these terms.
*Correspondence: Jing Zhao, 1029423895@qq.com; hbgh_zhj1987@163.com
Disclaimer
All claims expressed in this article are solely those of the authors and do not necessarily represent those of their affiliated organizations, or those of the publisher, the editors and the reviewers. Any product that may be evaluated in this article or claim that may be made by its manufacturer is not guaranteed or endorsed by the publisher.