 Hejing Bao1,2,3*†
 Jiani Zhang2†Zhuoyan Chen2†Yuhuan Wang2Zhe Wang2Zhiting Chen2Ting Jiang2Baishen Zhang4Wen Zeng5Hehong Bao6*Shudong Ma2*
- 1Department of Oncology, The Affiliated Panyu Center Hospital, Guangzhou Medical University, Guangzhou, Guangdong, China
- 2Department of Oncology, Nanfang Hospital, Southern Medical University, Guangzhou, Guangdong, China
- 3Cancer Institute of Panyu District, The Affiliated Panyu Center Hospital, Guangzhou Medical University, Guangzhou, Guangdong, China
- 4Department of Oncology, Sun Yat-sen University Cancer Centre, State Key Laboratory of Oncology in South China, Guangzhou, Guangdong, China
- 5Oncology Research Institute, Ganzhou Cancer Hospital, Gannan Medical University, Ganzhou, Jiangxi, China
- 6Department of Psychosomatic Medicine, Chongqing University Three Gorges Hospital/Chongqing Three Gorges Central Hospital, Chongqing, China
Background: Primary pulmonary lymphoepithelioma-like carcinoma (pLELC) is a rare subtype of non-small cell lung cancer(NSCLC) with unclear etiological mechanisms. This study aimed to investigate the underlying molecular mechanisms and therapeutic targets for pLELC.
Methods: Retrospectively collected samples from advanced pLELC patients underwent proteomic and metabolomic analyses, and patient-derived xenograft (PDX) models were established for validation. Data-independent acquisition (DIA) quantitative proteomics revealed upregulated tissue factor (TF) protein expression in pLELC, while untargeted metabolomics identified key metabolites such as linoleic acid (LA).
Results: Results demonstrated that LA promotes tumor progression by facilitating M2-type tumor-associated macrophage infiltration and suppressing natural killer (NK) cell activity, effects reversible by the TF inhibitor Tisotumab. Mechanistic studies indicated that LA enhances TF expression via peroxisome proliferator-activated receptor α (PPAR-α), and TF inhibitors effectively counteract LA-induced malignant phenotypes.
Conclusion: This study reveals that LA remodels the pLELC tumor microenvironment through the PPAR-α/TF axis, suggesting TF as a potential therapeutic target for pLELC.
Introduction
Lymphoepithelial carcinoma is a rare epithelial-origin tumor most commonly occurring in the nasopharynx, but it can also arise in diverse anatomical sites including the lung, thymus, stomach, liver, cervix, and bladder (1–11). Primary pulmonary lymphoepithelioma-like carcinoma accounts for only 0.4% of all primary lung cancers and 0.9% of NSCLC (12, 13). Bégin et al. first reported a case of pLELC in 1987 (14). In the 2021 World Health Organization (WHO) classification of lung tumors, this disease was reclassified from the “other unclassified carcinomas” category (4th edition) to lymphoepithelial carcinoma, specifically designated as a subtype of squamous cell carcinoma. Its characteristic pathological features include diffuse strong positivity for CK5/6, p40, and p63, a prominent syncytial growth pattern, variable degrees of lymphoplasmacytic infiltration, and a strong association with Epstein-Barr virus (EBV) (1, 2).
Studies indicate that pLELC shares genetic similarities with nasopharyngeal carcinoma but exhibits significant differences from other lung cancer types, NK/T-cell lymphoma, or EBV-associated gastric carcinoma. This tumor displays a low somatic mutation frequency but exhibits widespread copy number variations. A core aspect of the host-virus interplay involves mutations and frequent deletions in type I interferon genes (15). Reported genetic alterations in pLELC include various somatic mutations and genomic abnormalities. EBV predominantly integrates into intergenic and intronic regions, with two specific miR-BamH1-A rightward transcripts (Barts), Bart5-3p and BART20-3P, showing significant upregulation (6).
Current research on pLELC has primarily focused on genomic and transcriptomic analyses, as well as EBV integration studies. However, the pathogenesis of pLELC at the proteomic and metabolomic levels remains unclear. Furthermore, research on the pLELC immune microenvironment is still limited, largely due to the frequent diagnosis at advanced stages and the difficulty in obtaining adequate tissue specimens.
Methods
Proteomic analysis
Serum samples from 10 subjects (5 pLELC patients and 5 healthy controls) were collected for proteomic profiling. For each subject, 7 mL of peripheral blood was drawn into coagulation tubes one day prior to treatment initiation, centrifuged at 1,000×g for 10 min at 4°C, aliquoted, and stored at −80°C. Subsequent analyses were performed by HuiJun Biotechnology Co.,Ltd. using DIA technology. MS1 and MS2 data were randomly acquired, with iRT kit peptides (Ki3002, Biognosys AG, Switzerland) spiked into all samples for retention time calibration. Spectronaut 16 software (Biognosys AG, Switzerland) was employed for data normalization and relative quantification, as previously described (16). Differential protein screening criteria included: ≥2 unique peptides; coefficient of variation (CV) < 0.5; P < 0.05; and average fold-change thresholds (AVG ≥ 1.2 for upregulation; AVG ≤ 0.83 for downregulation).
Metabolomic profiling
Twenty-five serum samples (15 pLELC patients, 10 controls) were analyzed. Frozen samples (−80°C) were thawed on ice, vortexed for 10 sec, and 50 μL aliquots were mixed with 300 μL of ice-cold extraction solvent (acetonitrile:methanol = 1:4, v/v) containing internal standards. After vortexing for 3 min, samples were centrifuged at 12,000 rpm for 10 min at 4°C. A 200 μL supernatant aliquot was held at −20°C for 30 min, recentrifuged, and 180 μL was subjected to LC-MS analysis. Chromatographic conditions: Waters ACQUITY UPLC HSS T3 C18 column (1.8 μm, 2.1 × 100 mm); column temperature 40°C; flow rate 0.4 mL/min; injection volume 2 μL; mobile phase: water (0.1% formic acid)-acetonitrile gradient (0 min: 95:5; 11.0 min: 10:90; 12.0 min: 10:90; 12.1 min: 95:5; 14.0 min: 95:5). Raw data were converted to mzML format using ProteoWizard, followed by peak extraction, alignment, and retention time correction via XCMS. Peak areas were normalized using support vector regression (SVR), and features with <50% detection rate in any group were excluded. Metabolites were identified by matching against in-house and public databases (e.g., metDNA). Differential metabolites were screened using: variable importance in projection (VIP) ≥ 1; P < 0.05; fold change ≥ 2 or ≤ 0.5. Unsupervised Principal Component Analysis(PCA) (unit variance-scaled data) was performed using the R prcomp function, and heatmaps with Pearson correlation coefficients were generated via the Complex Heatmap package. Kyoto Encyclopedia of Genes and Genomes (KEGG) annotation and enrichment analyses were conducted for differential metabolites (17, 18).
Immunofluorescence and immunohistochemistry
Formalin-fixed paraffin-embedded (FFPE) sections underwent antigen retrieval in citrate buffer (pH 6.0) by boiling for 15 min. Endogenous peroxidase was blocked with 3% H2O2, followed by 30 min blocking at 37°C with normal goat serum. Primary antibodies against TF (Bioss, #P13726, 1:50), CD68 (PTMBIO, #JMMR-2659, 1:100), and CD206 (PTMBIO, #PTM-5343, 1:100) were applied and incubated overnight at 4°C. Corresponding secondary antibodies—DyLight 488-conjugated goat anti-rabbit IgG (#A23220, 1:50), DyLight 488-conjugated goat anti-mouse IgG (#A23210, 1:50), and DyLight 649-conjugated goat anti-rabbit IgG (#A23630, 1:50)—were incubated in the dark at 37°C for 90 min. Nuclei were counterstained with DAPI. For IHC, after overnight incubation at 4°C with anti-Granzyme B antibody (Bioss, #P10144, 1:50), sections were treated with SP-0023 secondary antibody at room temperature, followed by DAB (#C-0010) chromogenic development.
Enzyme-linked immunosorbent assay
Serum samples from 24 pLELC patients and 30 healthy controls were analyzed according to manufacturer protocols (Table 1, Supplementary table 1). TF, mouse IL-10R, and mouse TNF-α levels were quantified using ELISA kits (Elabscience, China).
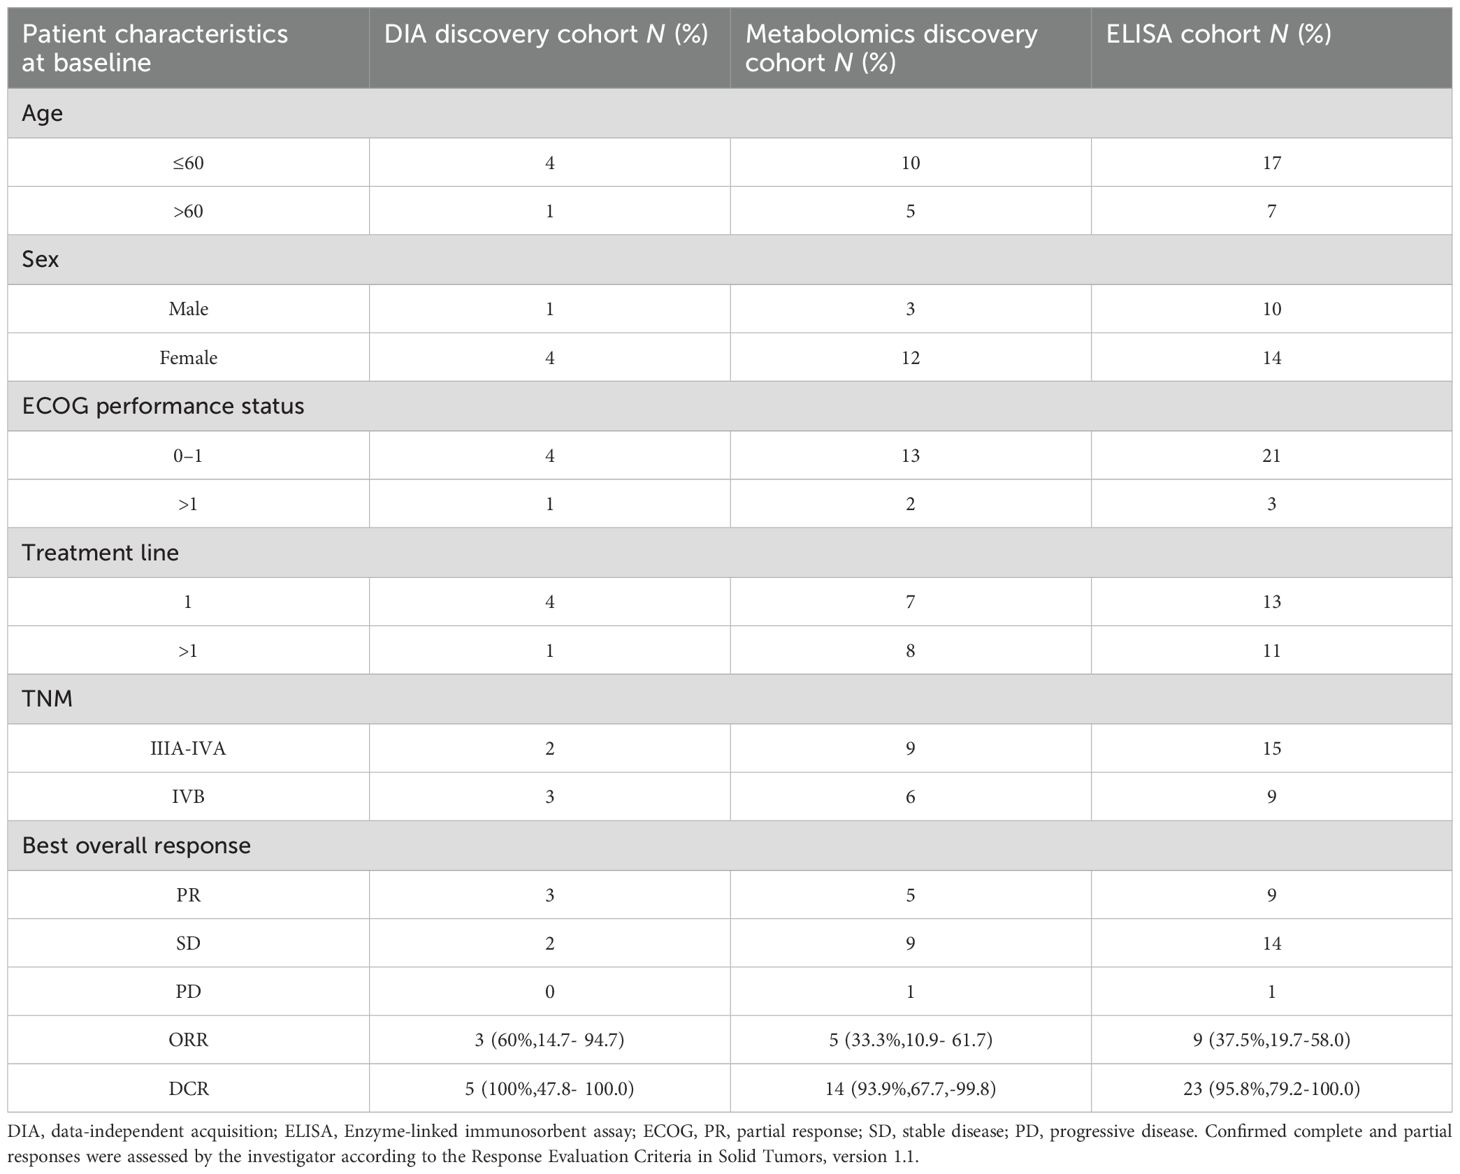
Table 1. Patient characteristics at baseline of pLELC.
Animal experiments
All procedures were approved by the Animal Ethics Committee of Panyu Central Hospital, Guangzhou Medical University and complied with ARRIVE 2.0 guidelines. Male BALB/c nude mice (3-6 weeks old) were obtained from Southern Medical University Laboratory Animal Center and housed under specific pathogen-free (SPF) conditions (5-6 mice/cage, 12-h light/dark cycle). Stratified randomization by body weight assigned mice to either:ω-6 diet group (Lieber-DeCarli liquid diet #710027), Control group (standard diet #710028). Both diets were isocaloric (1.0 kcal/mL) with identical macronutrient distribution: 35% fat, 47% carbohydrate, 18% protein (19, 20).
PDX model establishment and treatment
Fresh tumor tissues from consented pLELC patients (Nanfang Hospital) were subcutaneously implanted into the right dorsum of nude mice using a trocar (2×2×2 mm³ fragments) (21, 22). Stable passage 3 (P3) models were cryopreserved. Treatments began 24h post-implantation: Tisotumab (human anti-TF antibody; AntibodySystem, France): 4 mg/kg, i.p. weekly (vs. IgG control), WY-14643 (PPARα agonist; APExBIO, USA): 100 mg/kg/day in corn oil, i.p. (vs. corn oil control). Mice were euthanized by CO2 asphyxiation at endpoint for tumor measurement.
Quantitative real-time PCR
Total RNA was extracted with TRIzol (Takara, Japan) and reverse-transcribed using PrimeScript RT kits (Takara). SYBR Premix Ex Taq II (Roche, Switzerland) was used for amplification on a LightCycler 480 system. Primer sequences are listed in Supplementary table 2. Relative gene expression was calculated by the 2-ΔΔCT method with GAPDH normalization.
Western blotting
Equal protein amounts were separated by 10% SDS-PAGE, transferred to membranes, and incubated overnight at 4°C with primary antibodies against PPARα (AF7794; Beyotime, China; 1:1000) or NF-κB (AN365; Beyotime; 1:1000). After 1-h incubation with LI-COR fluorescent secondary antibodies (25°C), bands were visualized using an Odyssey infrared imaging system. Experiments were performed in triplicate.
Statistical analysis
Continuous variables were analyzed by Student’s t-test (normal distribution) or Mann-Whitney U test (non-normal distribution). Categorical data were assessed by Chi-square test. Overall survival (OS) and progression-free survival (PFS) were evaluated via Kaplan-Meier analysis. All analyses used SPSS 19.0 (IBM, USA), with P < 0.05 considered statistically significant.
Results
Proteomic identification and validation of TF
DIA-based proteomic analysis identified 259 proteins, with 16 exhibiting differential expression between groups (6 downregulated, 10 upregulated; Supplementary Figure 1, Table 2, Supplementary tables 3-7). KEGG pathway enrichment revealed 15 significantly altered pathways, implicating ferroptosis, HIF-1 signaling, metabolic pathways, leukocyte transendothelial migration, and cell adhesion. Ferroptosis demonstrated the highest significance (P = 0.0036), followed by HIF-1 signaling (P = 0.062). TF (P02787) participated in 5 pathways (ferroptosis, HIF-1, mineral absorption). Ceruloplasmin (CP; P00450) associated with ferroptosis and porphyrin metabolism. TF expression was significantly upregulated (1.55-fold, P < 0.05) in pLELC versus controls (Figures 1A) and localized to the most enriched pathways. Previous studies indicate TF-targeted therapy reduces M2 tumor-associated macrophage (TAM) infiltration (23), suggesting TF may regulate M2 TAMs in pLELC. IHC confirmed TF positivity (immunoreactive score IRS ≥1) in 87.5% (21/24) of pLELC samples (Figure 1). Serum TF levels were significantly elevated in pLELC patients versus healthy controls (Figure 1, Supplementary table 8). Patients stratified by ELISA-based TF expression revealed prolonged progression-free survival (PFS) in the high-TF group (Figure 1). Analysis of TCGA lung squamous cell carcinoma (LUSC) data showed no correlation between TF mRNA levels and overall survival (OS; P = 0.95, Figure 1; http://ualcan.path.uab.edu/cgi-bin/TCGA-survival1.pl?genenam=TF&ctype=LUSC).
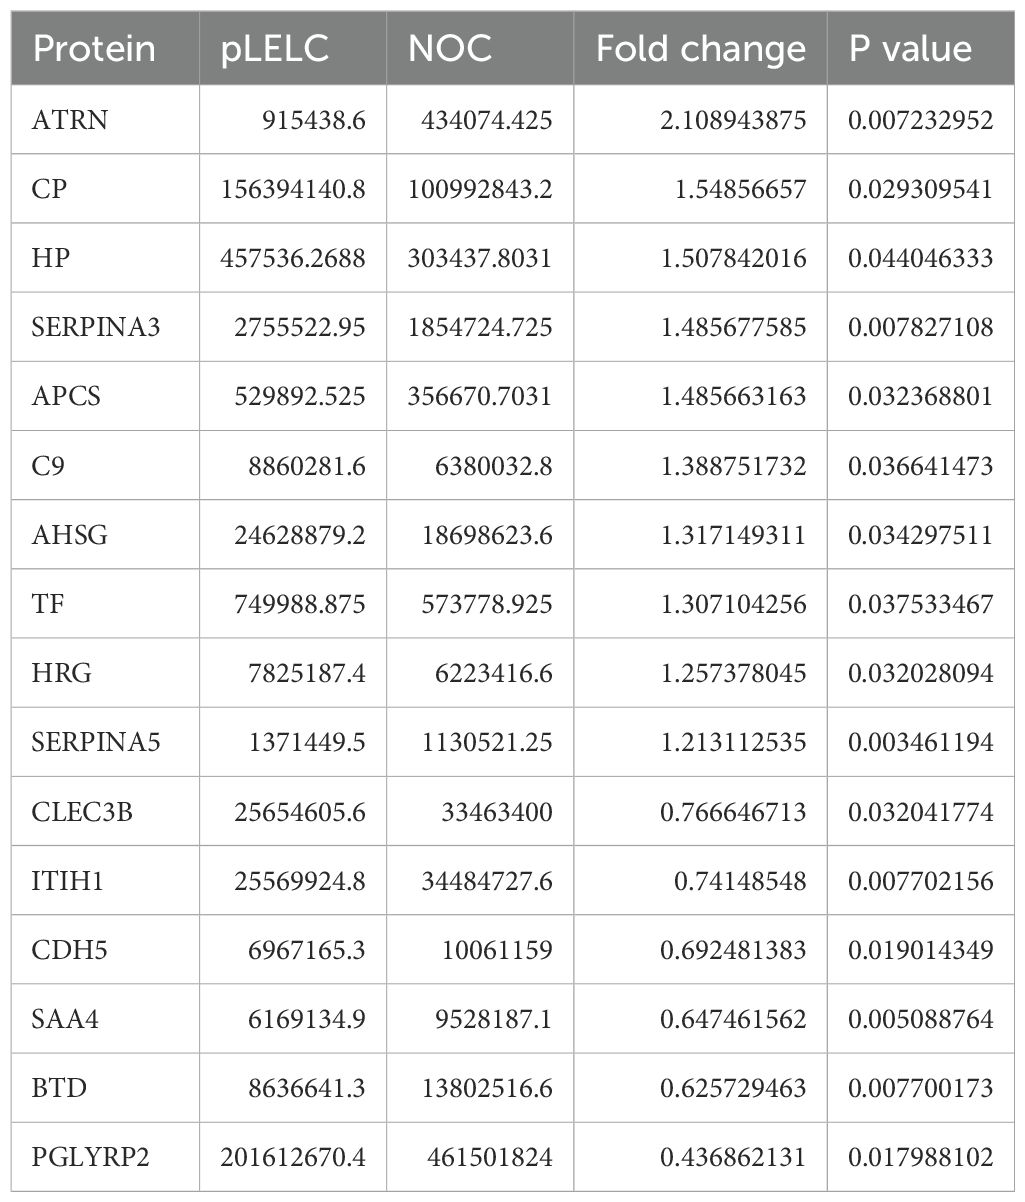
Table 2. Identification of plasma proteome profiles as potential efficacy biomarkers for pLELC.
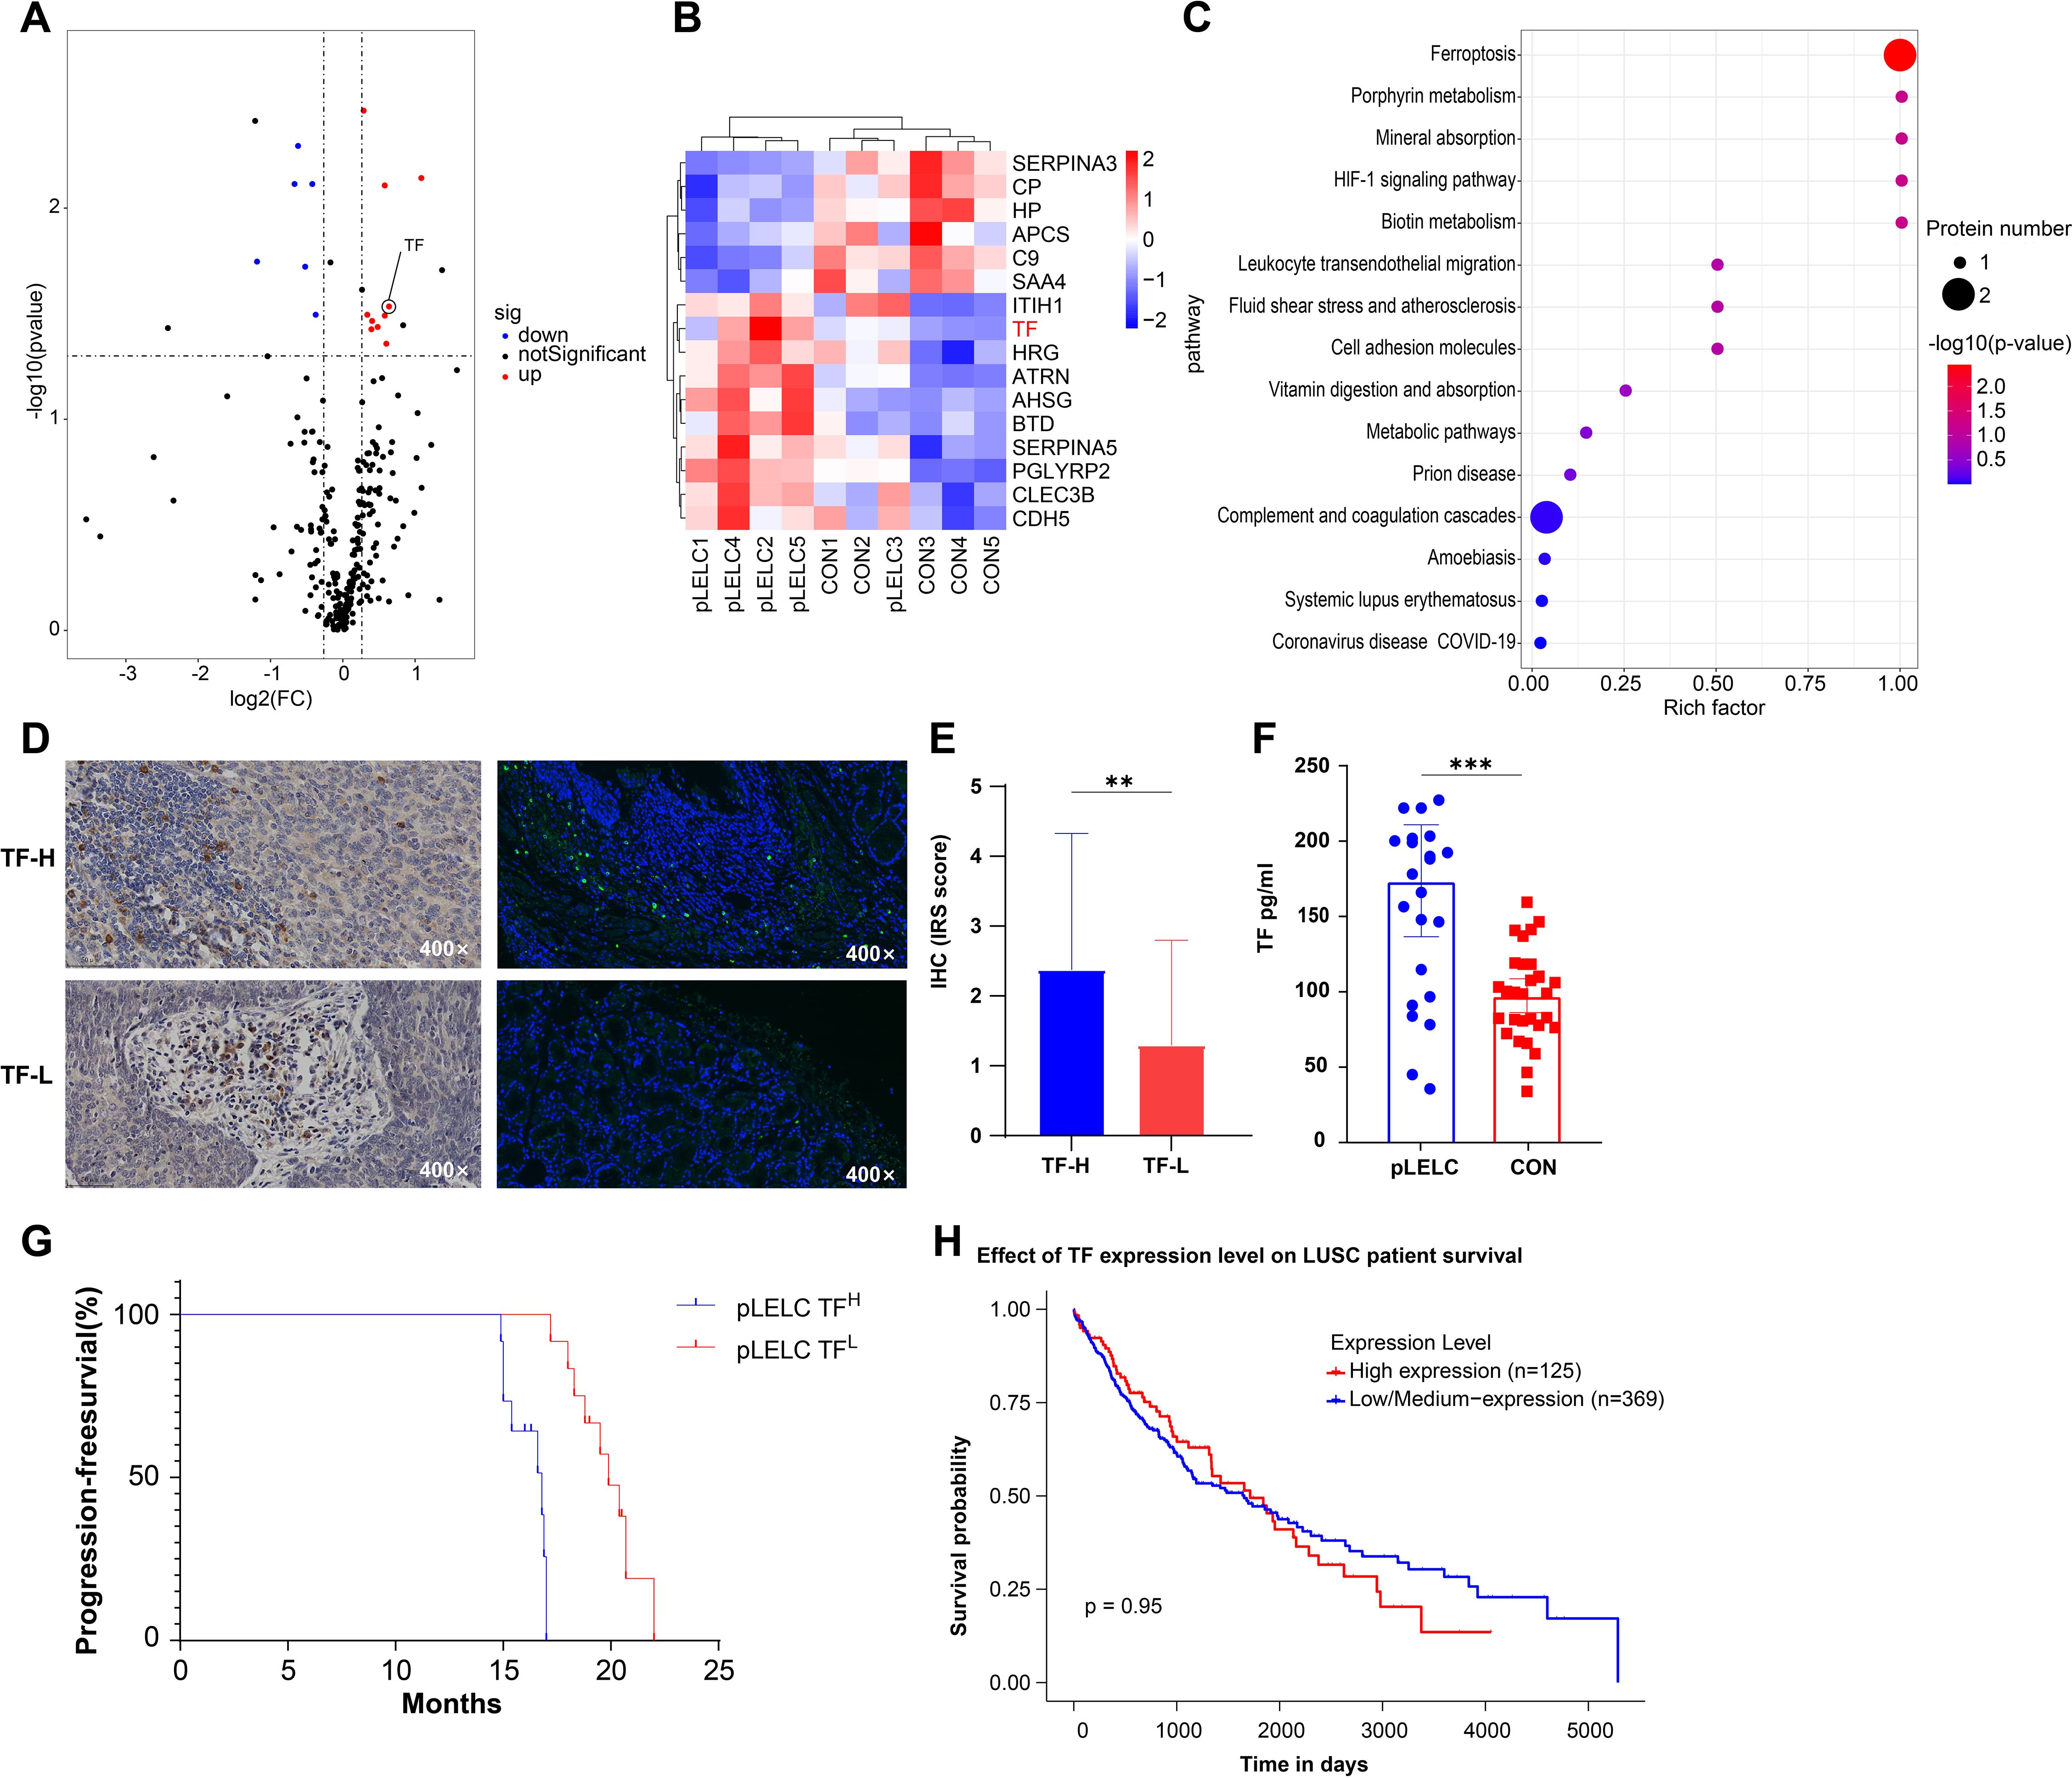
Figure 1. Proteomic identification and validation of TF. (A) Volcano plot of differentially expressed proteins (DEPs) in pLELC vs. control (CON) groups. X-axis: log2(fold change); Y-axis: -log10(P-value). Red dots: significantly upregulated proteins (CV < 0.5, P < 0.05, AVG ≥ 1.2); blue dots: downregulated proteins (CV < 0.5, P < 0.05, AVG ≤ 0.83); black dots: non-significant proteins (P > 0.05). (B) Hierarchical clustering heatmap of DEPs. Rows: 16 DEPs (6 downregulated, 10 upregulated); columns: samples (group labels below). Color scale: red (high expression) to blue (low expression), with intensity reflecting magnitude. Clustering used Euclidean distance and Ward’s linkage. (C) KEGG pathway enrichment bubble plot of DEPs (top 15 pathways, adjusted P < 0.05). X-axis: Rich factor; Y-axis: pathways (ranked by significance). Bubble color: -log10(adjusted P-value) (darker red = higher significance); size: number of DEPs per pathway. (D) IF and IHC staining of TF in pLELC tissues, showing strong vs. weak positivity. (E) IHC-based immunoreactive score (IRS) of TF in pLELC. High-TF group showed significantly elevated IRS vs. low-TF group (P < 0.05). (F) Serum TF levels in pLELC patients vs. healthy controls (ELISA; P < 0.001). (G) Progression-free survival (PFS) by TF expression. Kaplan-Meier curve: low-TF group had significantly prolonged PFS (P < 0.0001). (H) Overall survival (OS) by TF mRNA expression in TCGA-LUSC cohort (log-rank P = 0.95). ** P<0.01, *** P<0.001.
Metabolomic profiling
Untargeted metabolomics detected 3,175 metabolites (946 secondary metabolites), with 74 differentially expressed (34 downregulated, 40 upregulated; Supplementary tables 9-12). KEGG analysis enriched 23 pathways, most notably linoleic acid metabolism (ko00591) and unsaturated fatty acid biosynthesis (ko01040), involving key metabolites linoleic acid (LA; C01595) and palmitic acid (C00249) (Figures 2A, Supplementary tables 9-12). Given established links between ω-6 polyunsaturated fatty acids (PUFAs; particularly LA) and tumor immune microenvironments (24), we focused subsequent experiments on LA-TF interactions.
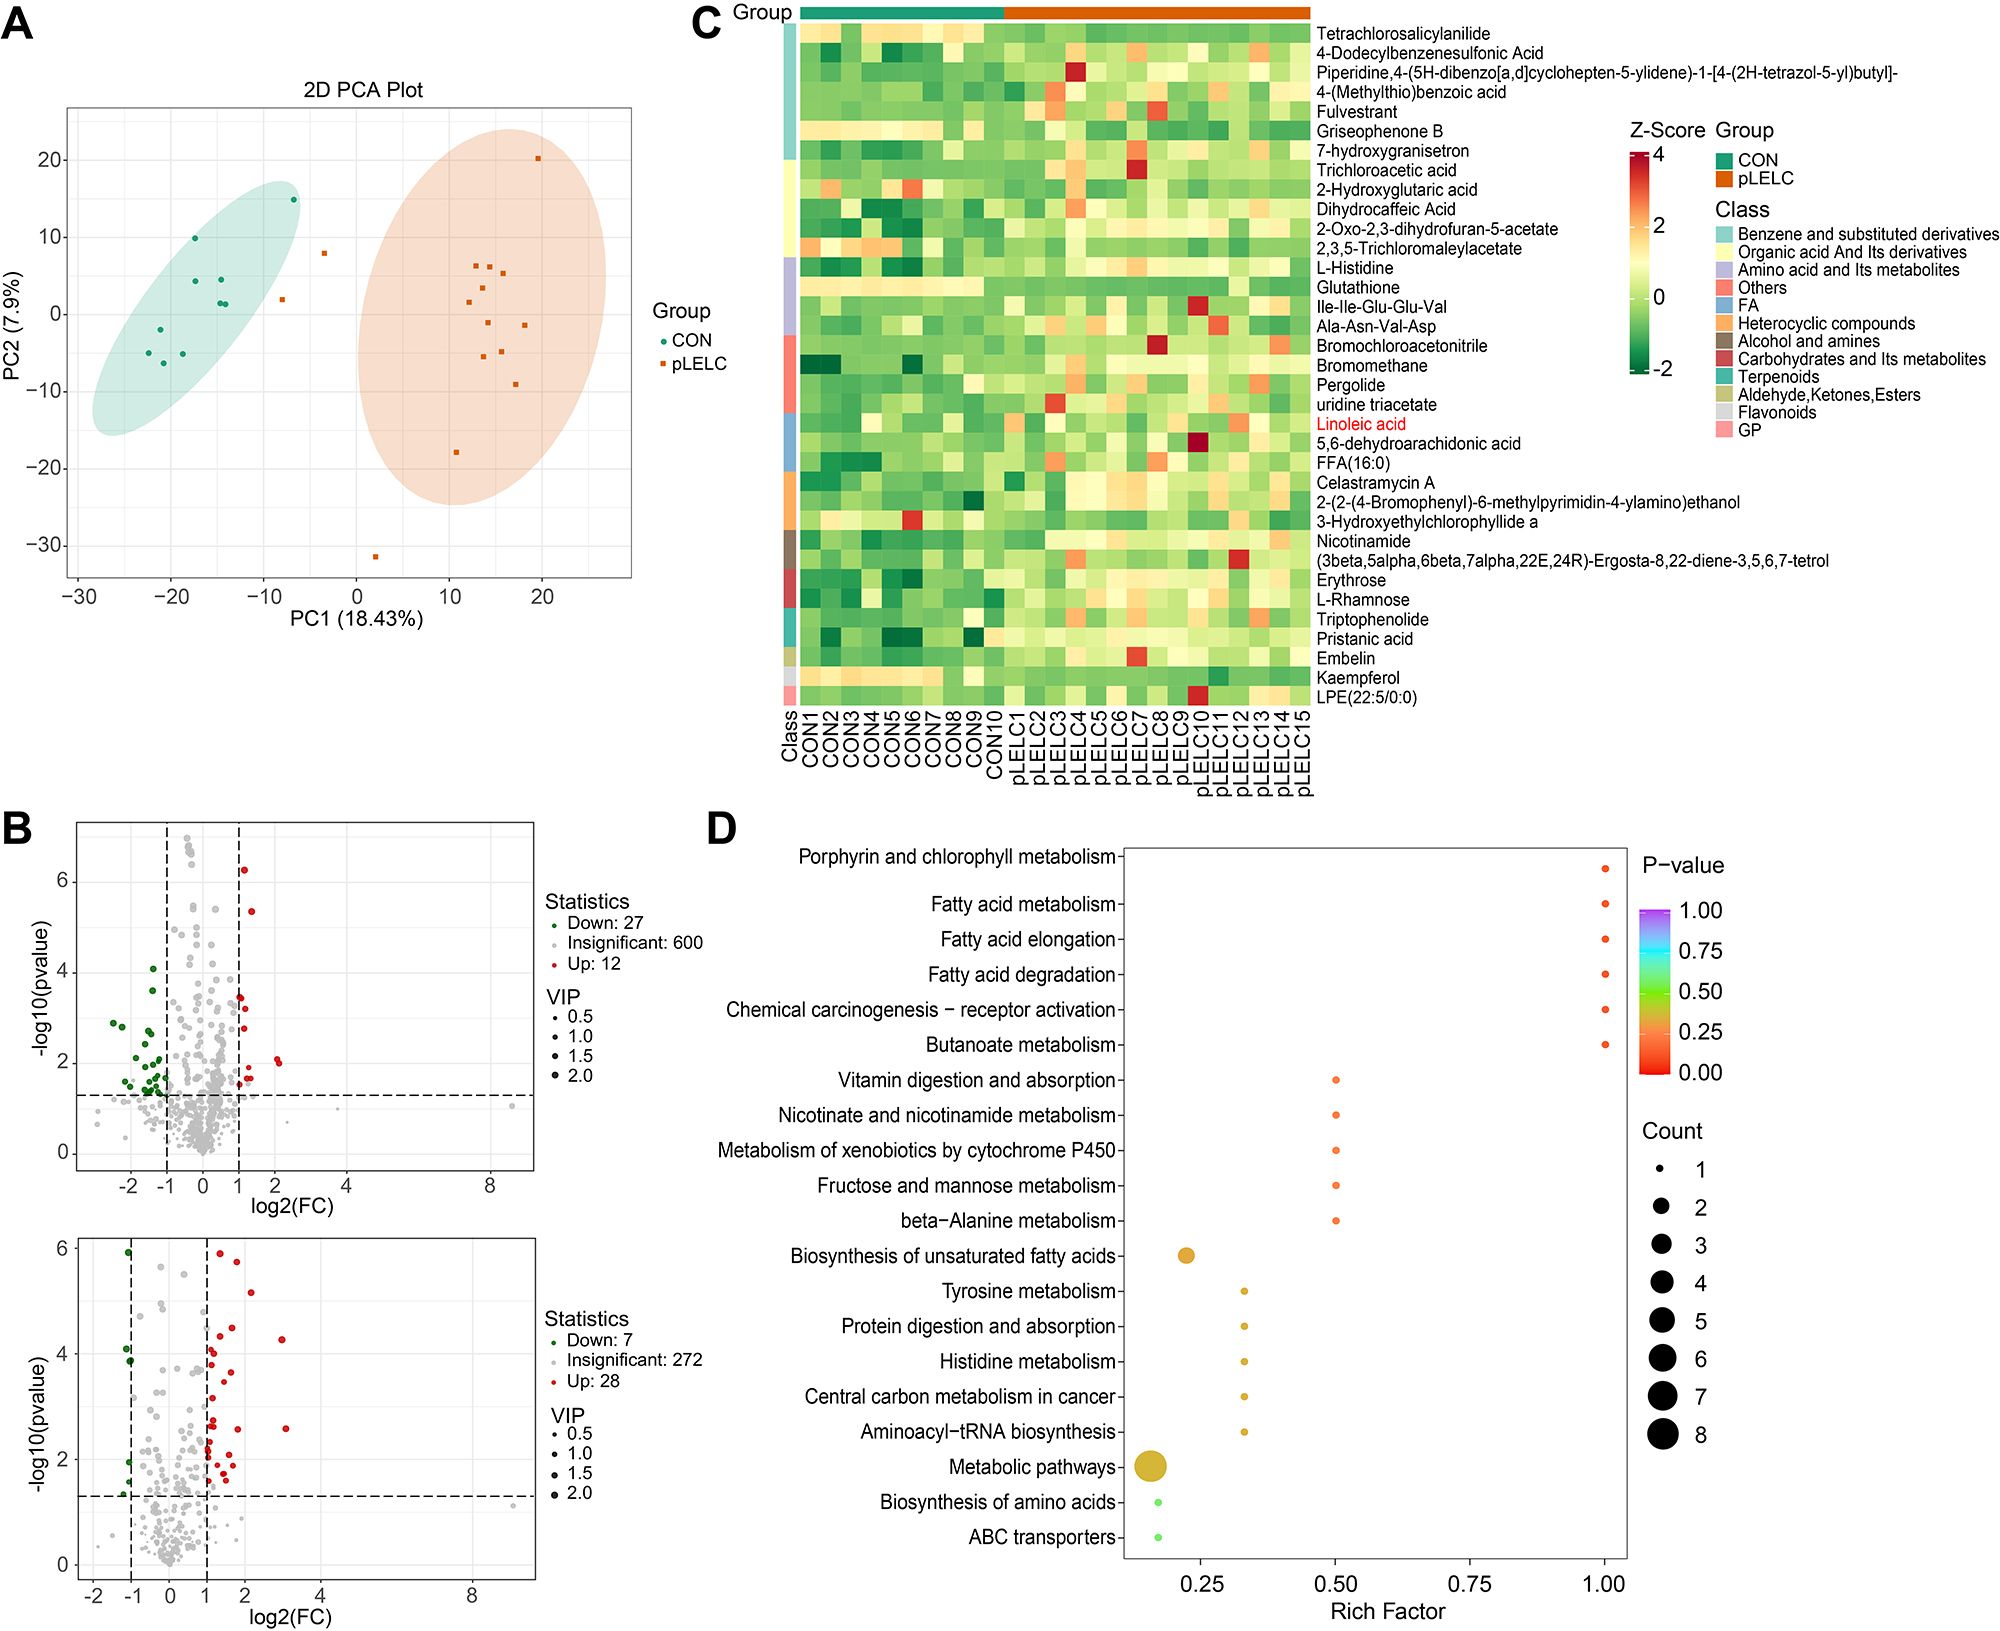
Figure 2. Metabolomic profiling results. (A) PCA plot (negative ion mode). PCA of metabolomic data shows separation between pLELC (orange) and control (CON, green) groups along PC1 (18.43% variance) and PC2 (7.9% variance). Ellipses denote 95% confidence intervals. Significant intergroup distinction (PERMANOVA, P = 0.008) indicates global metabolic profile differences. (B) Volcano plots of differential metabolites. Top: Positive ion mode; Bottom: Negative ion mode. X-axis: log2(fold change); Y-axis: -log10(P-value); dot size: VIP score. Red: Significantly upregulated metabolites (VIP ≥ 1, P < 0.05, FC ≥ 2); Green: Downregulated metabolites (VIP ≥ 1, P < 0.05, FC ≤ 0.5); Gray: Non-significant metabolites. (C) Hierarchical clustering heatmap of negative ion differential metabolites (n=35). Rows: Metabolites; Columns: Samples. Color scale: UV-scaled relative abundance (red: high; green: low). Key metabolites (e.g., linoleic acid) show significant upregulation in pLELC. (D) KEGG enrichment bubble plot of negative ion metabolites (top 20 pathways, adjusted P < 0.05). X-axis: Rich factor; Y-axis: Pathways (significance-ranked). Bubble color: -log10(adjusted P) (darker red = higher significance); Size: Number of enriched metabolites.
TF inhibitor Tisotumab reverses LA-driven pLELC progression
Due to the absence of established pLELC cell lines, PDX models were generated from surgical specimens. H&E staining confirmed histopathological fidelity between PDX tumors and primary tissues (Figures 3A). LA (a major ω-6 PUFA) is metabolized by cyclooxygenase (COX)/lipoxygenase (LOX) to arachidonic acid (AA) and derivatives (prostaglandins, leukotrienes) (25, 26). Mice (n= 5) were stratified into:Control (standard diet), ω-6 diet, ω-6 diet + Tisotumab (anti-TF antibody, 4 mg/kg i.p. weekly) group (Figure 3). Tumors in the ω-6 diet + IgG group exhibited significantly larger volumes versus control (P < 0.0001). Tisotumab treatment markedly suppressed ω-6 diet-induced tumor growth (P < 0.0001; Figures 3D). Immunoanalysis revealed reduced CD68+, CD206+ M2 TAMs and increased Granzyme B+ NK cells in control and Tisotumab groups versus ω-6 diet + IgG (Figures 4A). Cytokine profiling showed decreased IL-10 and elevated TNF-α in intervention groups (Figure 4).
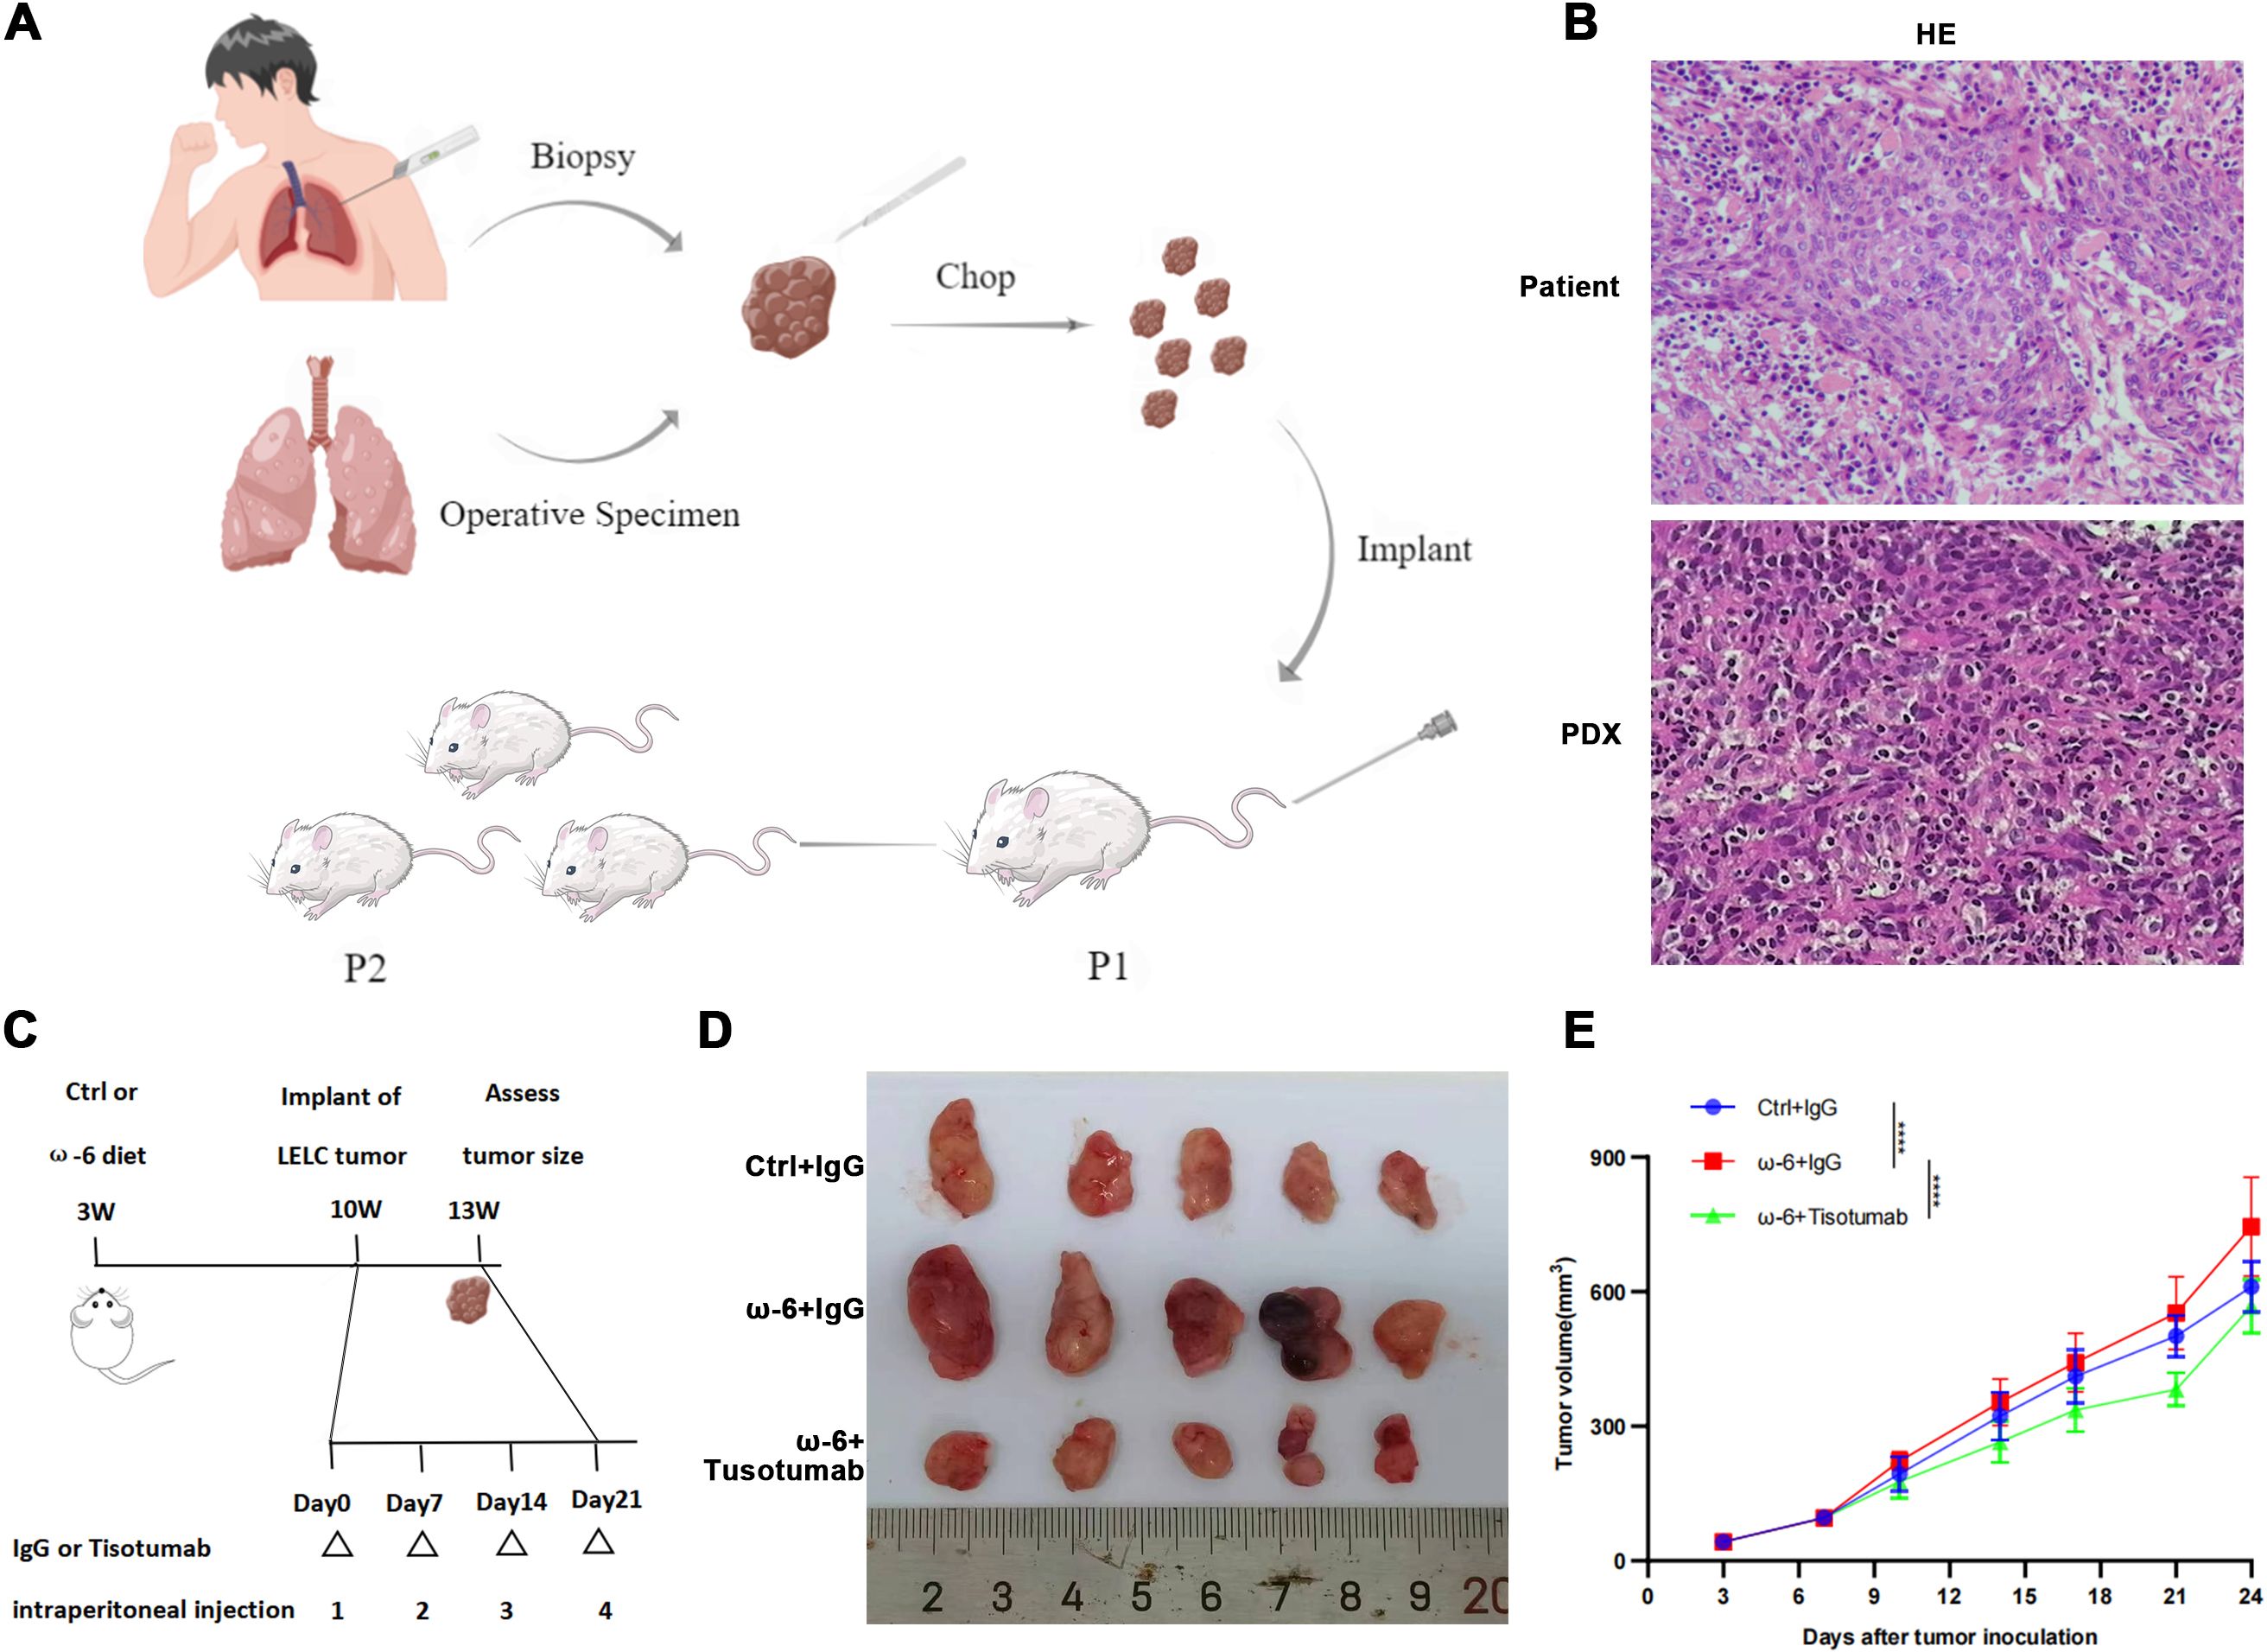
Figure 3. Tisotumab reverses LA-driven pLELC progression. (A) PDX model establishment. Tumor tissues from surgery/biopsy were dissected into 2-mm³ fragments and subcutaneously implanted into nude mice via trocar. Stable models were confirmed at passage 3 (P3). (B) H&E validation of PDX model. Primary patient tumors and PDX grafts show identical histopathological features. (C) Experimental timeline. Mice received ω-6 or control diets from 3 weeks of age. PDX tumors implanted at week 10; Tisotumab (4 mg/kg i.p.) or IgG administered weekly. Tissues harvested at Day 24. (D) Macroscopic tumor morphology at endpoint (Day 24). (E) Tumor growth curves. ω-6 diet + IgG group exhibited significantly larger volumes vs. control (P < 0.0001), while Tisotumab suppressed ω-6 diet-induced growth (P < 0.0001; two-way ANOVA).
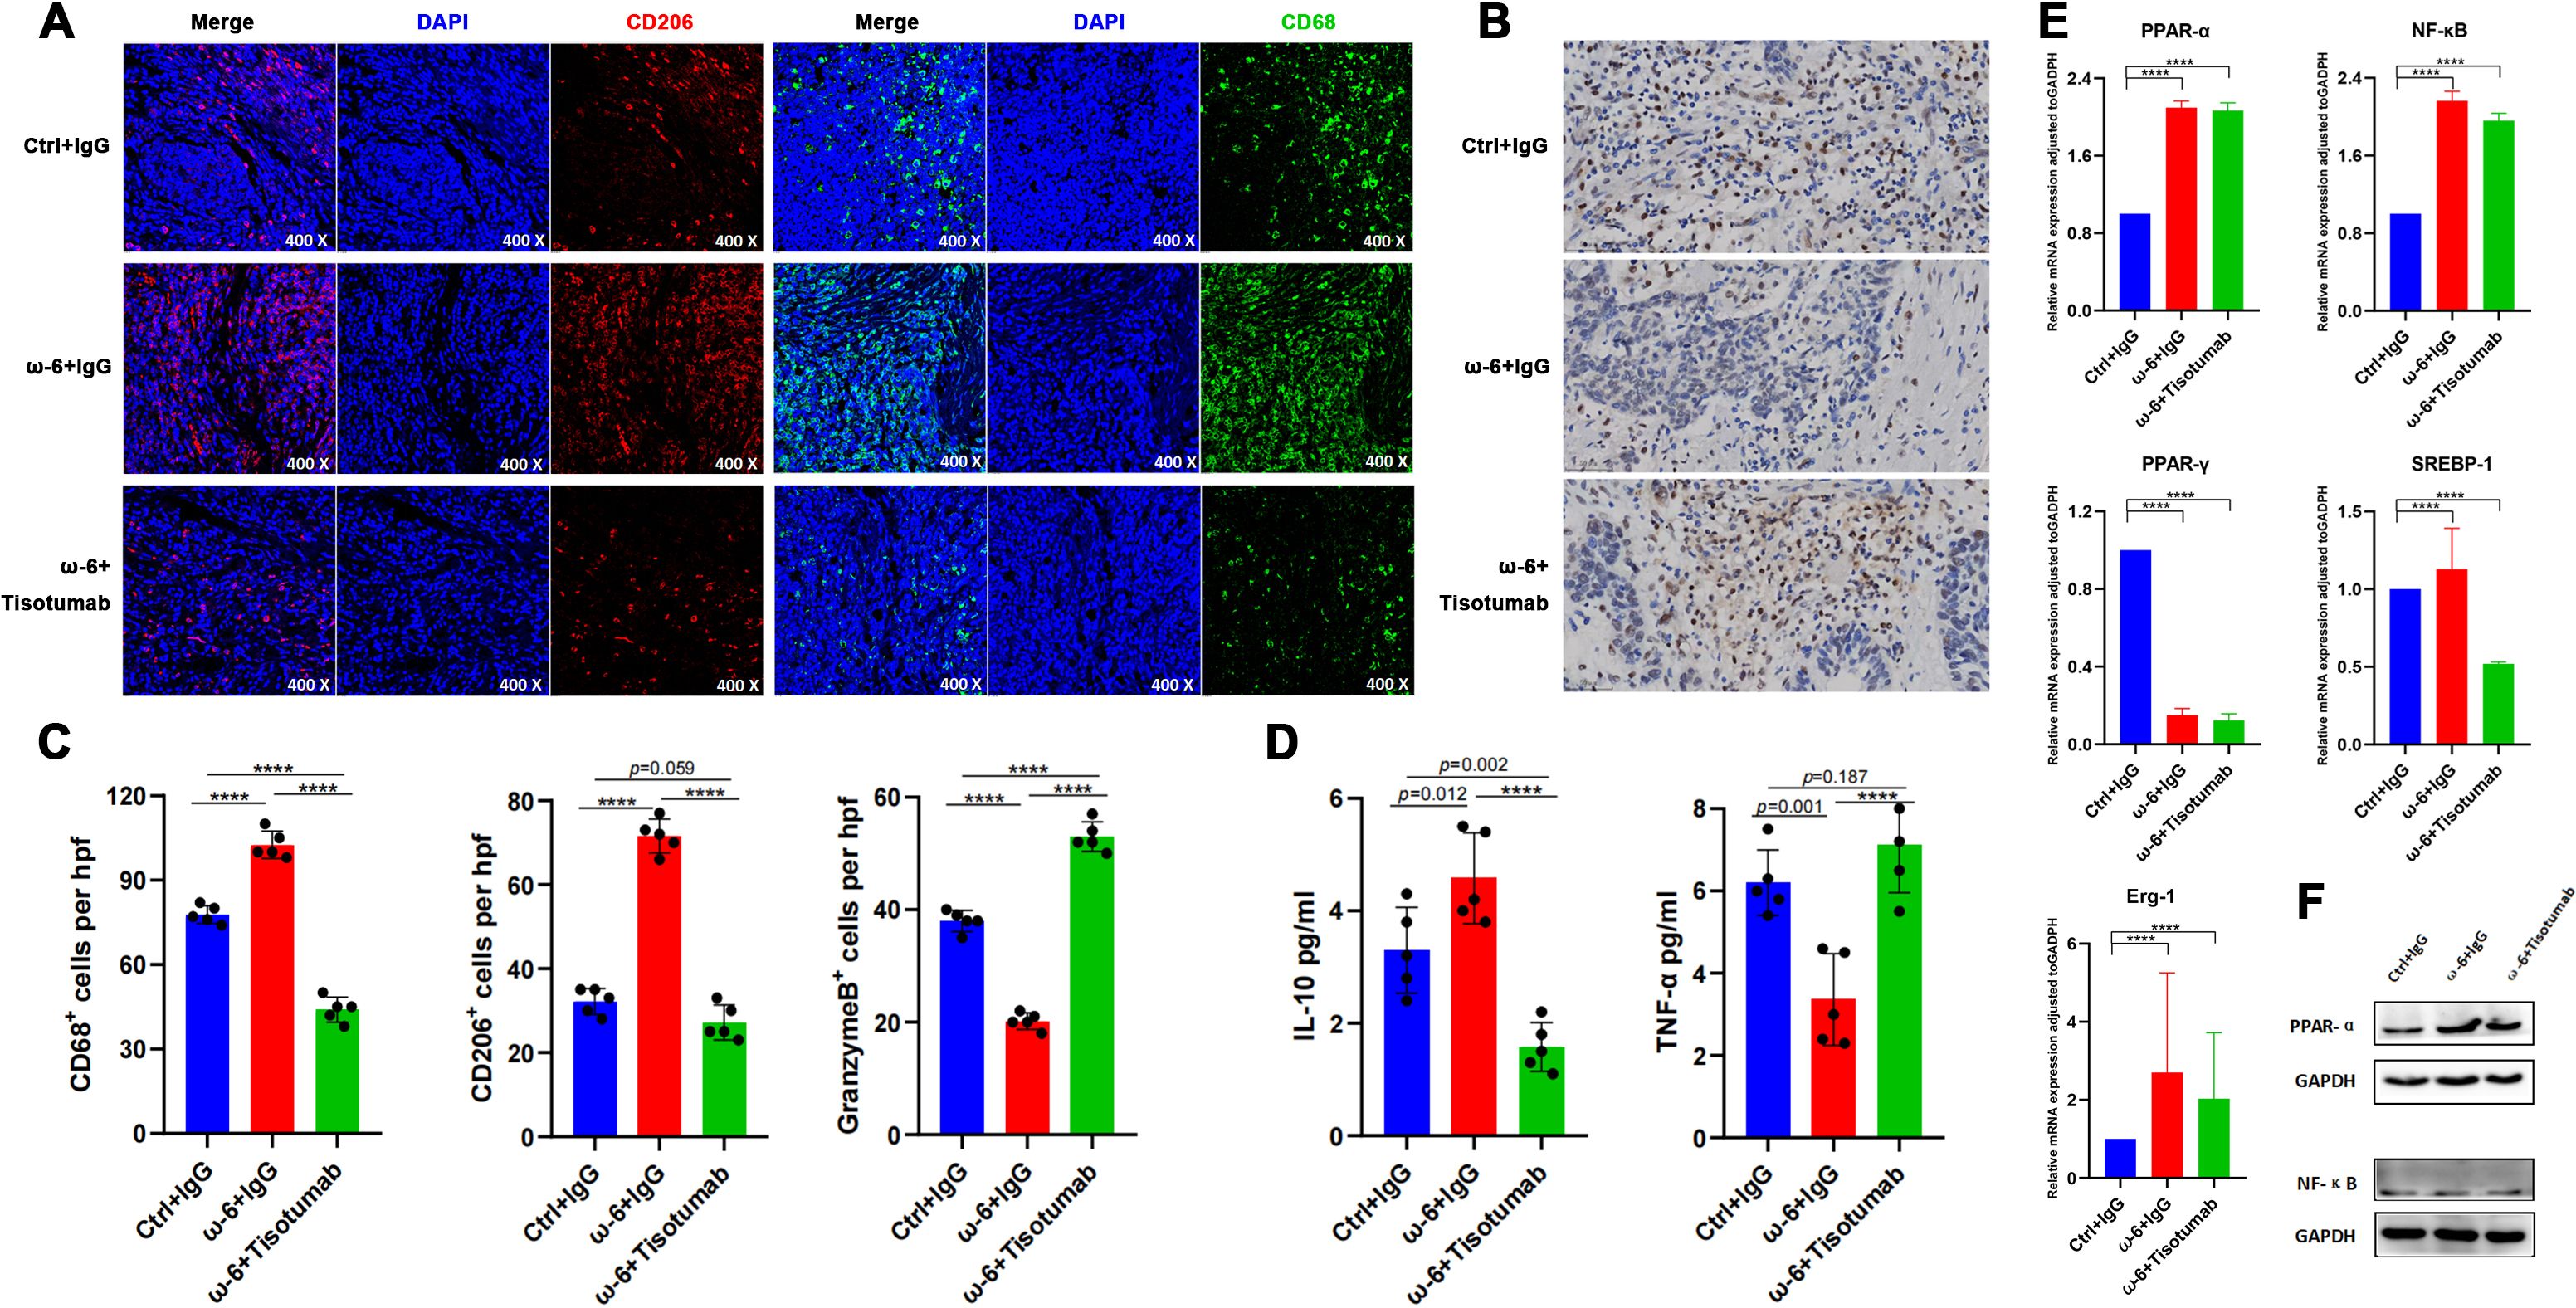
Figure 4. LA promotes M2 TAM infiltration and suppresses NK cells via PPAR-α. (A) Representative IF staining of CD68 and CD206 in PDX tumors across groups. (B) IHC for Granzyme B in PDX tumors. (C) Immune cell quantification. Versus ω-6 diet + IgG group, control and Tisotumab groups showed reduced CD68+, CD206+ cells and increased Granzyme B+ cells (all P < 0.0001). (D) Cytokine levels. IL-10 decreased (P = 0.012/P < 0.0001) while TNF-α increased (P = 0.001/P < 0.0001) in control and Tisotumab groups. (E) qRT-PCR analysis of transcription factors. ω-6 diet upregulated PPAR-α/NF-κB and downregulated PPAR-γ (all P < 0.0001). No changes in SREBP-1 or Erg-1 (P > 0.05). (F) Western blot validation: ω-6 diet significantly increased PPAR-α protein (P < 0.001) without altering NF-κB. **** P<0.0001.
LA promotes M2 TAM infiltration and suppresses NK cells via PPAR-α
Experimental data confirm that LA-enriched diets promote M2 TAM infiltration and suppress NK cell activity—effects reversed by TF inhibition. PPARs, sterol regulatory element-binding proteins (SREBPs), and nuclear factor-κB (NF-κB) are established transcriptional regulators of fatty acid metabolism (27–29). Among PPAR isoforms, only PPAR-α and PPAR-γ serve as natural receptors for LA. Quantitative analysis revealed significantly elevated PPAR-α and NF-κB expression in the ω-6 diet + IgG and Tisotumab intervention groups versus controls (P < 0.0001), alongside reduced PPAR-γ. No intergroup differences were observed in SREBP-1 or early growth response factor 1 (Erg-1) expression (Figure 4). Western blotting further validated ω-6 diet-induced PPAR-α upregulation without significant NF-κB modulation (Figure 4).
TF inhibitor antagonizes PPAR-α agonist-driven immune remodeling
Fifteen 6-week-old nude mice (n= 5/group) were allocated to: PPAR-α agonist WY-14643 (100 mg/kg/day i.p.), Corn oil vehicle control, WY-14643 + Tisotumab (Figure 5). Tumors in the WY-14643 + IgG group exhibited significantly larger volumes than controls (P<0.0001), while Tisotumab co-treatment suppressed WY-14643-induced tumor growth (P<0.0001; Figures 5B). Immunohistochemistry demonstrated reduced CD68+, CD206+ cells and increased Granzyme B+ cells in control and combination groups versus WY-14643 monotherapy (Figures 5E). ELISA confirmed decreased IL-10 and elevated TNF-α in the combination group (Figure 5).
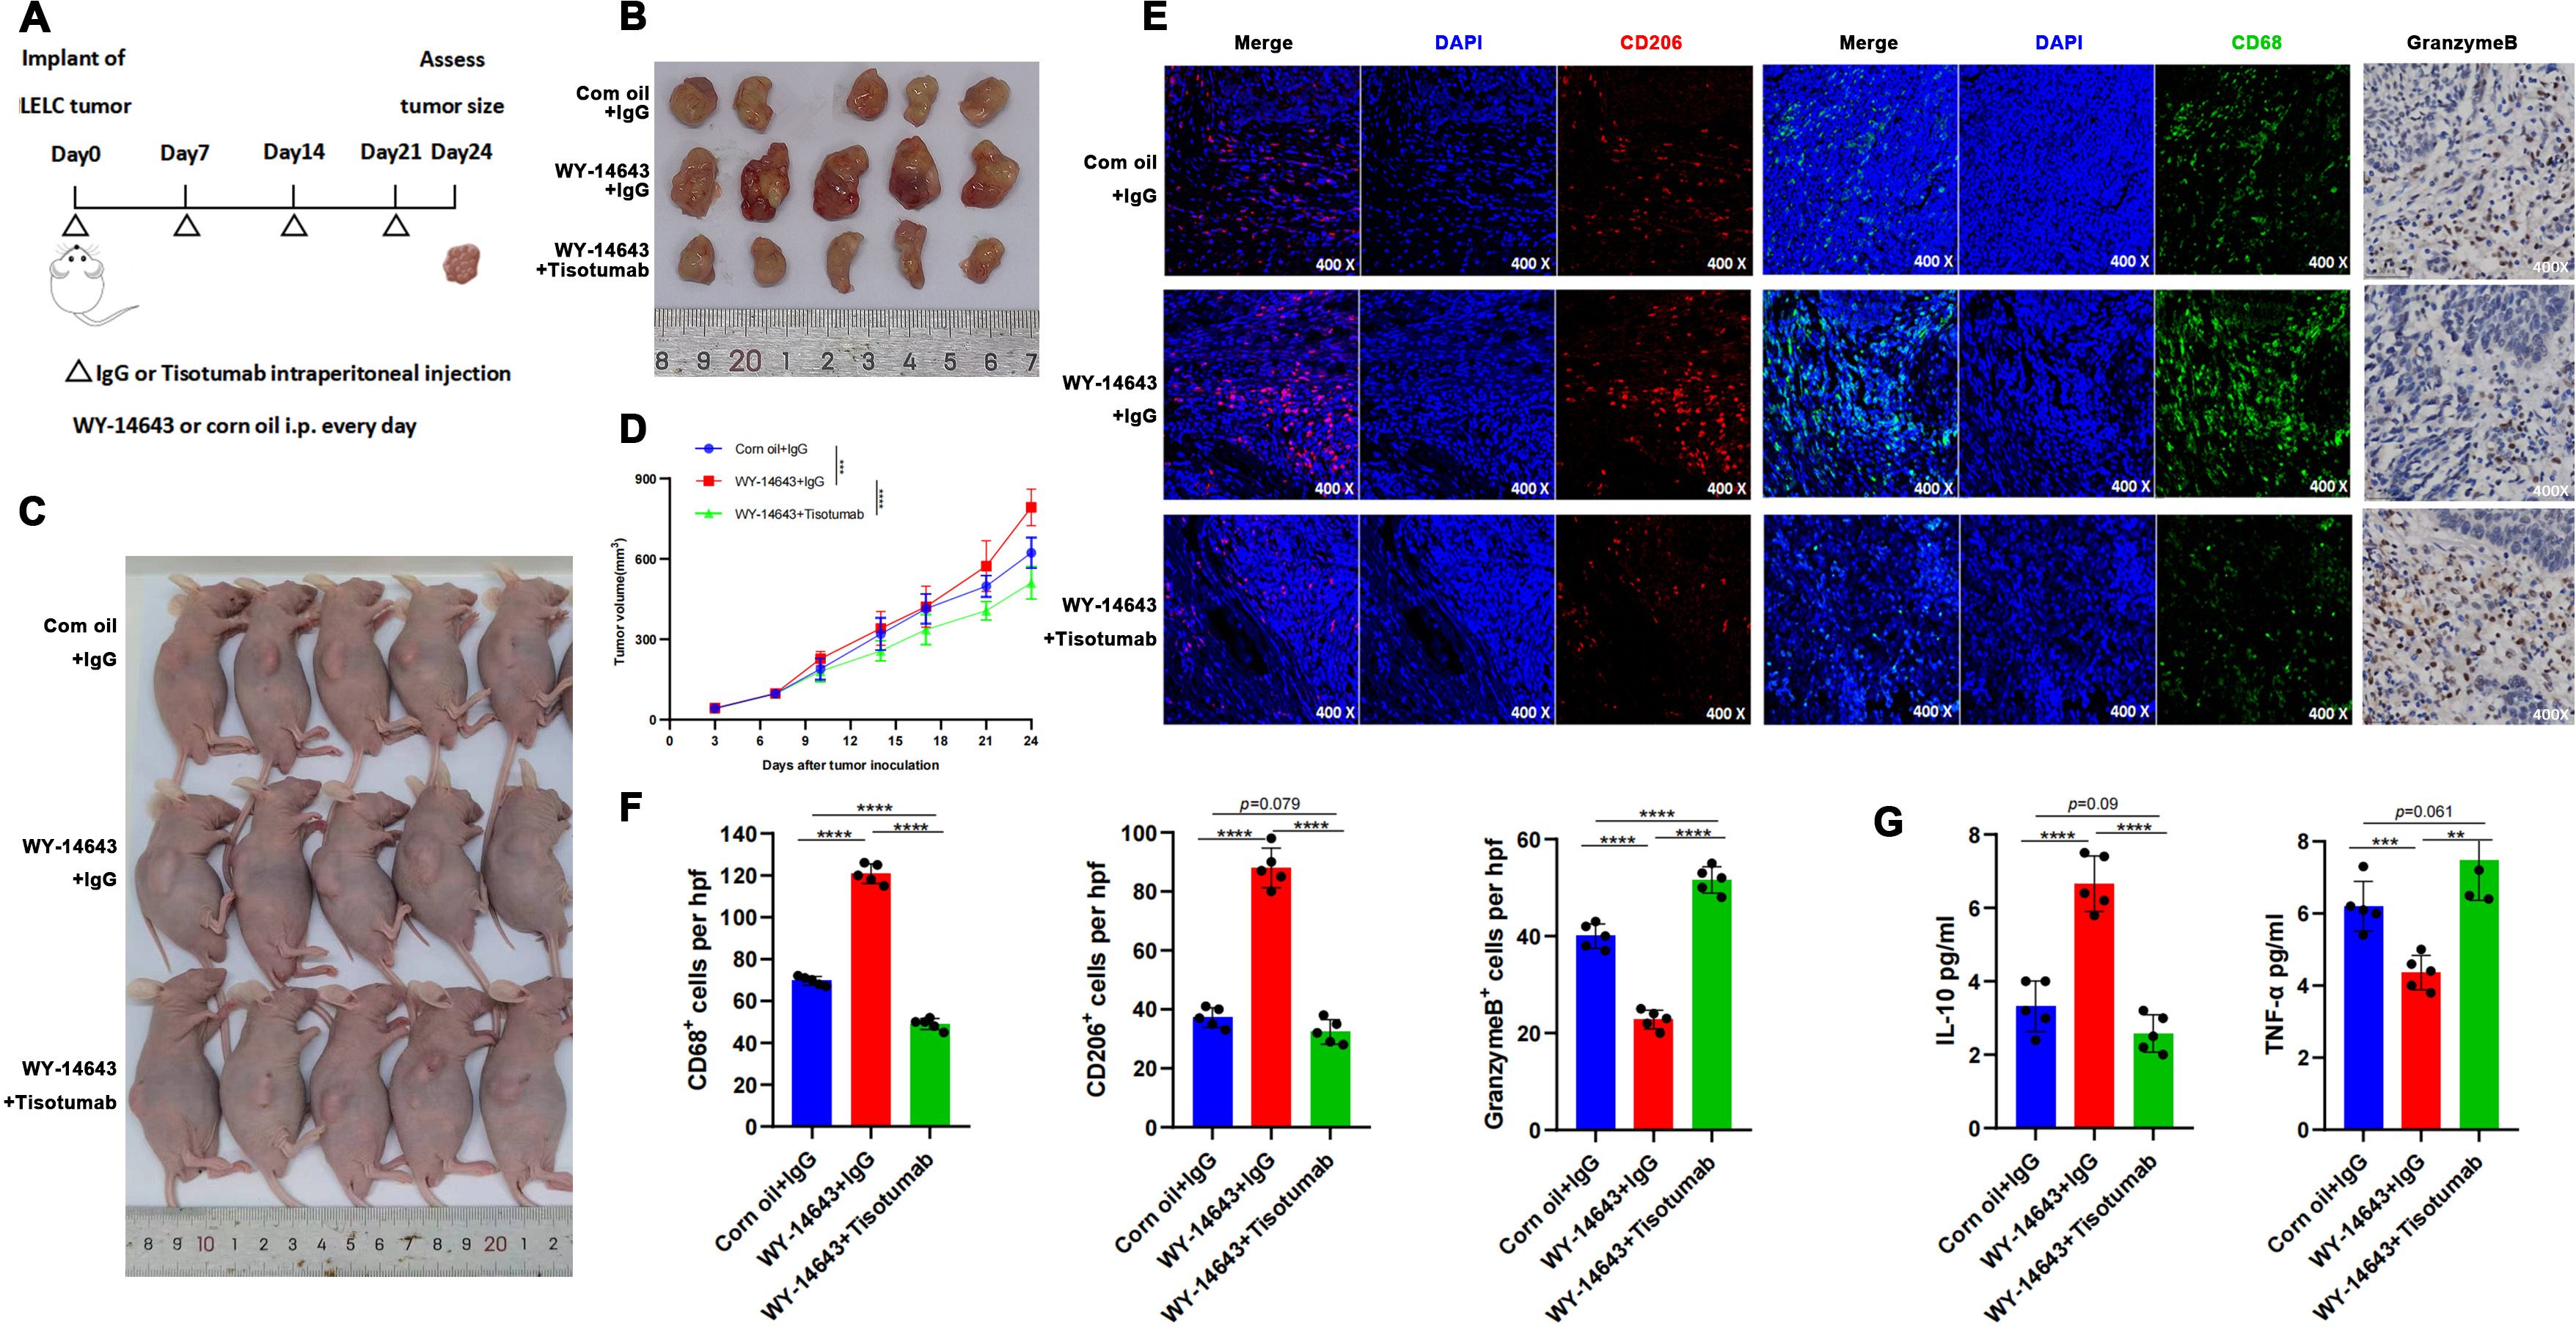
Figure 5. TF Inhibitor reverses PPAR-α agonist-induced immune remodeling. (A) Timeline and treatment schedule for umor implant and assessment. PDX inoculation at 6 weeks; daily i.p. WY-14643 (100 mg/kg in corn oil) or vehicle; weekly Tisotumab or IgG; harvest at Day 24. (B) Tumor samlpes shown with varying sizes. (Day 24). (C) Schematic of mouse endpoint procedures. (D) Tumor growth curves: WY-14643 + IgG > control (P < 0.0001); Tisotumab reversed tumor growth (P < 0.0001). (E) Microscopic images displaying stained tumor sections at 400x magnification, focusing on CD206, CD68, and GranzymeB markers. (F) Bar graphs illustrating the number of CD68+, CD206+, and GranzymeB+ cells per high power field. Control and Tisotumab groups showed reduced CD68+, CD206+ cells and increased Granzyme B+ cells vs. WY-14643 + IgG (all P < 0.0001). (G) Bar graphs showing IL-10 and TNF-a levels in various treatments: reduced IL-10 (P < 0.0001) and increased TNF-α (P = 0.004/P < 0.0001) in control and Tisotumab groups. ** P<0.01, *** P<0.001, **** P<0.0001.
Discussion
Tissue factor, a transmembrane receptor and cofactor for FVII/FVIIa, is expressed by pericytes (e.g., adventitial fibroblasts) and surface-lining cells (e.g., epithelial cells). Beyond its central role in hemostasis and thrombosis (30, 31), TF overexpression in tumors correlates with poor prognosis and promotes growth/metastasis (31). In EGFR-mutant NSCLC and glioblastoma, elevated TF predicts adverse outcomes (23). Targeting mTOR and TF remodels the tumor microenvironment by reducing fibrin deposition (ameliorating hypercoagulability), altering collagen distribution (attenuating stromal fibrosis), decreasing CD31+, α-SMA+ vessel density, and diminishing CD206+, F4/80+ immunosuppressive M2 TAM infiltration. Studies in C57BL/6-derived TF-overexpressing tumor cells reveal that TF suppresses NK cell-mediated micrometastasis clearance through fibrinogen- and platelet-dependent mechanisms (32). Additionally, TF promotes metastasis via thrombin-dependent pathways independent of NK cells (32), with recent evidence implicating the TF-thrombin axis in macrophage recruitment for metastatic progression (33). Collectively, TF drives disease progression by remodeling the tumor microenvironment.
Our KEGG analysis highlighted significant ferroptosis pathway enrichment. Key proteins TF and CP may trigger lipid peroxidation by inhibiting GPX4 and enhancing iron toxicity. Although HIF-1 signaling did not reach strict significance (P=0.062), its interplay with ferroptosis suggests hypoxia-mediated regulation of oxidative stress. Future studies should validate direct mechanisms of the TF-CP axis in ferroptosis.
Untargeted metabolomic analysis was performed to elucidate the role of metabolites in pLELC pathogenesis. Results revealed significant enrichment of LA and palmitic acid in unsaturated fatty acid biosynthesis and linoleic acid metabolism pathways. LA may generate pro-inflammatory lipids (e.g., PGE2) via ω-6 PUFA pathways, while palmitic acid supports tumor growth through CD36-mediated lipid uptake. Targeting these metabolic axes—such as combining COX-2 inhibitors with CD36 blockade—may represent novel therapeutic strategies for pLELC.
Accumulating evidence demonstrates distinct roles of polyunsaturated fatty acids (PUFAs) in tumorigenesis: ω-3 family members (α-linolenic acid, EPA, DHA) exert anti-tumor effects, whereas ω-6 PUFAs (LA, AA) exhibit pro-tumor properties (34). Notably, LA demonstrates context-dependent duality—promoting BT-474 and A549 cell proliferation in vitro (35). Epidemiologically, high LA intake paradoxically correlates with reduced cancer risk in certain malignancies (36).
Adipose tissue deposition in obesity promotes M2 macrophage polarization, contrasting with M1-dominant profiles in lean individuals (37, 38). Metabolized ω-6 PUFAs generate arachidonic acid (AA), which COX/LOX enzymes convert to pro-inflammatory mediators (prostaglandins, leukotrienes) (39). Crucially: COX-derived PGE-2 induces dendritic cell tolerance and Treg activation (39), AA metabolites (LTB4, LXA4) stimulate expansion of myeloid progenitors (MDSCs, M2 macrophages) (40). Activated M2 macrophages secrete IL-10 to promote Th2 differentiation and PD-L1 upregulation, accelerating T-cell apoptosis and establishing a pro-tumor immunosuppressive feedback loop (40).
TF and LA cooperatively regulate immune equilibrium, particularly M2 macrophage/NK cell/T-cell balance. HGF/c-Met and EGFR pathways upregulate TF expression by activating JNK/Src, PI3K/Akt/mTOR, and KRAS/Raf/MEK/ERK cascades, thereby inducing AP-1, NF-κB, and Egr-1 transcription factors (30). As PPARs and SREBPs constitute master transcriptional regulators of lipid metabolism, this study demonstrates that PPAR-α potentiates LA-induced TF expression. Critically, TF inhibitors effectively reverse PPAR-α agonist-driven tumor progression.
Current mechanistic studies of pLELC primarily focus on genomic and transcriptomic profiles, revealing similarities to nasopharyngeal carcinoma (NPC)—including driver mutations in NF-κB, CDKN2A, and JAK/STAT pathways, analogous regulation of p53 and PD-L1, and shared type II latency features evidenced by LMP1/LMP2 expression (15, 41). Molecular parallels between EBV-positive NPC and pLELC provide rationale for combined therapeutic strategies in advanced disease (42), though pLELC differs significantly from other lung cancers, NK/T-cell lymphoma, or EBV-associated gastric carcinoma (15). First-line treatment for advanced pLELC typically combines immunotherapy or anti-angiogenesis therapy with chemotherapy (43, 44), yet evidence remains limited to small retrospective studies, warranting further exploration of targeted/immunotherapeutic approaches. Our study pioneers multi-omics investigation (proteomics/metabolomics) to identify pLELC vulnerabilities, uncovering a novel LA/PPAR-α/TF axis that drives tumor progression—revealing actionable therapeutic targets.
Beyond our findings, emerging evidence suggests broader regulatory roles. Conjugated linoleic acid (CLA) activates PPAR-γ to alleviate neuroinflammation and promote remyelination (45). Low LA/α-linolenic acid ratios modulate lipid metabolism via PPAR-α/ACOX1 upregulation and SREBP-1c/FAS downregulation (46). CLA induces endogenous PPARα ligands (palmitoylethanolamide/oleoylethanolamide) to exert anti-neuroinflammatory effects (47). Maternal CLA supplementation regulates fetal hepatic lipid metabolism via AMPK signaling (48). Outstanding questions requiring further investigation: Precise mechanisms of LA-mediated TF regulation, TF-PPAR-α feedback dynamics, potential PPAR-α/NF-κB-independent pathways for Tisotumab’s antitumor effects.
Study Limitations:1.No integrated multi-immune-marker prognostic model established. 2.Insufficient fresh tissues for genomic/transcriptomic validation (pLELC rarity). 3.Absence of stable cell lines precluded in vitro pathway validation. 4.Modest animal cohort size (n=5) necessitates larger validation. 5.NSG/NSG-SGM3 humanized models unexplored for T/B-cell immunity. 6.Stromal components (e.g., angiogenesis) not analyzed. 7.EBV-LA/TF/PPAR-α axis crosstalk unexamined. Nonetheless, this work provides foundational insights into pLELC immunopathology.
Conclusion
This study demonstrates that LA promotes pLELC progression via PPAR-α-mediated TF upregulation, identifying TF as a promising therapeutic target. Future directions include: Validating synergistic targeting of the TF-PPARα axis (e.g., Tisotumab + PPARα inhibitor GW6471). Elucidating LA metabolic specificity through gene editing/epigenetic approaches. Clinical translation of TF inhibitor-based combination therapies. Investigating EBV latency protein regulation of TF using patient-derived organoid models.
Data availability statement
The datasets presented in this study can be found in online repositories. The names of the repository/repositories and accession number(s) can be found in the article/Supplementary Material.
Ethics statement
The studies involving humans were approved by Ethics Committee of the Affiliated Panyu Center Hospital, Guangzhou Medical University (PYRC-2025-134-01). The studies were conducted in accordance with the local legislation and institutional requirements. The participants provided their written informed consent to participate in this study. The animal study was approved by Ethics Committee of the Affiliated Panyu Center Hospital, Guangzhou Medical University. The study was conducted in accordance with the local legislation and institutional requirements. Written informed consent was obtained from the individual(s) for the publication of any potentially identifiable images or data included in this article.
Author contributions
HJB: Conceptualization, Data curation, Writing – original draft, Writing – review & editing. JZ: Methodology, Visualization, Writing – review & editing. ZC: Methodology, Visualization, Writing – review & editing. YW: Methodology, Visualization, Writing – review & editing. ZW: Resources, Validation, Visualization, Writing – review & editing. ZC: Resources, Validation, Visualization, Writing – review & editing. TJ: Resources, Validation, Visualization, Writing – review & editing. BZ: Resources, Validation, Visualization, Writing – review & editing. WZ: Formal Analysis, Methodology, Software, Writing – review & editing. HHB: Formal Analysis, Methodology, Software, Writing – review & editing. SM: Funding acquisition, Project administration, Supervision, Visualization, Writing – review & editing.
Funding
The author(s) declare financial support was received for the research and/or publication of this article. This work was supported by the Panyu Central Hospital project (PY-2023-024 , PY-2024-012), the Panyu District Science and Technology Plan Project (2023-Z04-014) and the Guangzhou Health Science and Technology Project (20241A011114).
Conflict of interest
The authors declare that the research was conducted in the absence of any commercial or financial relationships that could be construed as a potential conflict of interest.
Generative AI statement
The author(s) declare that no Generative AI was used in the creation of this manuscript.
Any alternative text (alt text) provided alongside figures in this article has been generated by Frontiers with the support of artificial intelligence and reasonable efforts have been made to ensure accuracy, including review by the authors wherever possible. If you identify any issues, please contact us.
Publisher’s note
All claims expressed in this article are solely those of the authors and do not necessarily represent those of their affiliated organizations, or those of the publisher, the editors and the reviewers. Any product that may be evaluated in this article, or claim that may be made by its manufacturer, is not guaranteed or endorsed by the publisher.
Supplementary material
The Supplementary Material for this article can be found online at: https://www.frontiersin.org/articles/10.3389/fonc.2025.1640201/full#supplementary-material
Supplementary Figure 1 | Protein electropherograms. (A) pLELC group. (B) Control (CON) group.
Supplementary Figure 2 | LA-TF association. (A) Positive correlation between serum LA (μM) and TF (pg/mL) (Spearman r= 0.8536, P = 0.001; n= 15 pLELC patients). (B) WB validation: ω-6 diet upregulated TF vs. control; Tisotumab reversed this effect (GAPDH loading control). (C) Pre-/post-treatment serum TF: No baseline differences; post-treatment TF in ω-6 + IgG group > control (P < 0.05) and ω-6 + Tisotumab (P < 0.01).
Supplementary Figure 3 | NK Cell (NKp46+) infiltration. (A, B) ω-6 diet: (A) IHC showing reduced NKp46+ cells with ω-6 diet; partial reversal by Tisotumab. (B) Quantification: increased NKp46+ cells in control/Tisotumab vs. ω-6 + IgG (all P < 0.001). (C, D) WY-14643 treatment: (C) IHC showing ↓NKp46+ cells with WY-14643; partial reversal by Tisotumab. (D) Quantification: increased NKp46+ cells in control/Tisotumab groups (all P < 0.001).
Abbreviations
pLELC, lymphoepithelioma-like carcinoma; PDX, patient-derived xenograft; DIA, data-independent acquisition; TF, tissue factor; LA, linoleic acid; NK, natural killer; PPAR, peroxisome proliferator-activated receptors; EBV, Epstein-Barr virus; HE, hematoxylin and eosin; GAPDH, glyceraldehyde 3-phosphate dehydrogenase; OS, overall survival; PFS, progression-free survival; TAMs, tumor-associated macrophages; LUSC, Lung Squamous Cell Carcinoma; TCGA, The Cancer Genome Atlas; PUFAs, polyunsaturated fatty acids; AA, arachidonic acid; COX, cyclooxygenase; LOX, lipoxygenase; SREBP, sterol regulatory element-binding proteins; PGs, prostaglandins; LTs, leukotrienes; WB, Western blot; HIF-1, hypoxia-inducible factor-1; ELISA, Enzyme-linked immunosorbent assay; DC, dendritic cells; MDSCs, myeloid-derived suppressor cells; LTB4, leukotriene B4; LXA4, lipoxin A4; PGE-2, prostaglandin E-2; IL-4, interleukin-4; JNK, c-Jun N-terminal kinase; mTOR, mammalian rapamycin target; HGF, Hepatocyte growth factor; AP-1, activator protein-1; TNF-α, Tumor Necrosis Factor Alpha; Erg-1, early growth response-1; KEGG, Kyoto Encyclopedia of Genes and Genomes; NF-κB, Nuclear Factor kappa B.
References
1. Travis WD, Brambilla E, Burke AP, Marx A, and Nicholson AG. Introduction to the 2015 world health organization classification of tumors of the lung, pleura, thymus, and heart. J Thorac Oncol. (2015) 10:1240–2. doi: 10.1097/JTO.0000000000000663
2. Nicholson AG, Tsao MS, Beasley MB, Borczuk AC, Brambilla E, Cooper WA, et al. The 2021 WHO classification of lung tumors: impact of advances since 2015. J Thorac Oncol. (2022) 17:362–87. doi: 10.1016/j.jtho.2021.11.003
3. Herath CH and Chetty R. Epstein-Barr virus-associated lymphoepithelioma-like gastric carcinoma. Arch Pathol Lab Med. (2008) 132:706–9. doi: 10.5858/2008-132-706-EVLGC
4. Wang ZH, Zhao JJ, and Yuan Z. Lymphoepithelioma-like gastric carcinoma: A case report and review of the literature. World J Gastroenterol. (2016) 22:3056–61. doi: 10.3748/wjg.v22.i10.3056
5. Cacciato Insilla A, Faviana P, Pollina LE, De Simone P, Coletti L, Filipponi F, et al. Lymphoepithelioma-like hepatocellular carcinoma: Case report and review of the literature. World J Gastroenterol. (2015) 21:10468–74. doi: 10.3748/wjg.v21.i36.10468
6. Chen B, Zhang Y, Dai S, Zhou P, Luo W, Wang Z, et al. Molecular characteristics of primary pulmonary lymphoepithelioma-like carcinoma based on integrated genomic analyses. Signal Transduct Target Ther. (2021) 6:6. doi: 10.1038/s41392-020-00382-6
7. Huang YH, Zhang CZ, Huang QS, Yeong J, Wang F, Yang X, et al. Clinicopathologic features, tumor immune microenvironment and genomic landscape of Epstein-Barr virus-associated intrahepatic cholangiocarcinoma. J Hepatol. (2021) 74:838–49. doi: 10.1016/j.jhep.2020.10.037
8. Suster D, Pihan G, Mackinnon AC, and Suster S. Expression of PD-L1/PD-1 in lymphoepithelioma-like carcinoma of the thymus. Mod Pathol. (2018) 31:1801–6. doi: 10.1038/s41379-018-0097-4
9. Pinto A, Huang M, and Nadji M. Lymphoepithelioma-like carcinoma of the uterine cervix: A pathologic study of eight cases with emphasis on the association with human papillomavirus. Am J Clin Pathol. (2019) 151:231–9. doi: 10.1093/ajcp/aqy130
10. Fan B, Huang Y, Zhang H, Chen T, Tao S, Wang X, et al. Analysis of genetic profiling, pathomics signature, and prognostic features of primary lymphoepithelioma-like carcinoma of the renal pelvis. Mol Oncol. (2022) 16:3666–88. doi: 10.1002/1878-0261.13307
11. Manocha U, Kardos J, Selitsky S, Zhou M, Johnson SM, Breslauer C, et al. RNA expression profiling of lymphoepithelioma-like carcinoma of the bladder reveals a basal-like molecular subtype. Am J Pathol. (2020) 190:134–44. doi: 10.1016/j.ajpath.2019.09.007
12. Anand A, Zayac A, Curtiss C, and Graziano S. Pulmonary lymphoepithelioma-like carcinoma disguised as squamous cell carcinoma. J Thorac Oncol. (2018) 13:e75–6. doi: 10.1016/j.jtho.2017.11.133
13. Xie Z, Liu L, Lin X, Xie X, Gu Y, Liu M, et al. A multicenter analysis of genomic profiles and PD-L1 expression of primary lymphoepithelioma-like carcinoma of the lung. Mod Pathol. (2020) 33:626–38. doi: 10.1038/s41379-019-0391-9
14. Bégin LR, Eskandari J, Joncas J, and Panasci L. Epstein-Barr virus related lymphoepithelioma-like carcinoma of lung. J Surg Oncol. (1987) 36:280–3. doi: 10.1002/jso.2930360413
15. Hong S, Liu D, Luo S, Fang W, Zhan J, Fu S, et al. The genomic landscape of Epstein-Barr virus-associated pulmonary lymphoepithelioma-like carcinoma. Nat Commun. (2019) 10:3108. doi: 10.1038/s41467-019-10902-w
16. Bi F, Qiu Y, Wu Z, Liu S, Zuo D, Huang Z, et al. METTL9-SLC7A11 axis promotes hepatocellular carcinoma progression through ferroptosis inhibition. Cell Death Discov. (2023) 9:428. doi: 10.1038/s41420-023-01723-4
17. Mino-Kenudson M, Schalper K, Cooper W, Dacic S, Hirsch FR, Jain D, et al. Predictive biomarkers for immunotherapy in lung cancer: perspective from the international association for the study of lung cancer pathology committee. J Thorac Oncol. (2022) 17:1335–54. doi: 10.1016/j.jtho.2022.09.109
18. Zou WQ, Luo WJ, Feng YF, Liu F, Liang SB, Fang XL, et al. Expression profiles and prognostic value of multiple inhibitory checkpoints in head and neck lymphoepithelioma-like carcinoma. Front Immunol. (2022) 13:818411. doi: 10.3389/fimmu.2022.818411
19. Jing L, Lin J, Yang Y, Tao L, Li Y, Liu Z, et al. Quercetin inhibiting the PD-1/PD-L1 interaction for immune-enhancing cancer chemopreventive agent. Phytother Res. (2021) 35:6441–51. doi: 10.1002/ptr.7297
20. Cong Y, Li Q, Zhang X, Chen Y, and Yu K. mTOR promotes tissue factor expression and activity in EGFR-mutant cancer. Front Oncol. (2020) 10:1615. doi: 10.3389/fonc.2020.01615
21. Yu W, Lei Q, Yang L, Qin G, Liu S, Wang D, et al. Contradictory roles of lipid metabolism in immune response within the tumor microenvironment. J Hematol Oncol. (2021) 14:187. doi: 10.1186/s13045-021-01200-4
22. Khadge S, Sharp JG, McGuire TR, Thiele GM, Black P, DiRusso C, et al. Immune regulation and anti-cancer activity by lipid inflammatory mediators. Int Immunopharmacol. (2018) 65:580–92. doi: 10.1016/j.intimp.2018.10.026
23. Kumar V, Dave V, Harris J, and Huang Y. Response of advanced stage recurrent lymphoepithelioma-like carcinoma to nivolumab. Immunotherapy. (2017) 9:955–61. doi: 10.2217/imt-2017-0067
24. Adkins DR and Haddad RI. Clinical trial data of Anti-PD-1/PD-L1 therapy for recurrent or metastatic nasopharyngeal Carcinoma: A review. Cancer Treat Rev. (2022) :109:102428. doi: 10.1016/j.ctrv.2022.102428
25. Marklund M, Wu JHY, Imamura F, Del Gobbo LC, Fretts A, de Goede J, et al. Biomarkers of dietary omega-6 fatty acids and incident cardiovascular disease and mortality. Circulation. (2019) 139:2422–36. doi: 10.1161/CIRCULATIONAHA.118.038908
26. Deol P, Ruegger P, Logan GD, Shawki A, Li J, Mitchell JD, et al. Diet high in linoleic acid dysregulates the intestinal endocannabinoid system and increases susceptibility to colitis in Mice. Gut Microbes. (2023) 15:2229945. doi: 10.1080/19490976.2023.2229945
27. Wang Z, Zhang X, Zhu L, Yang X, He F, Wang T, et al. Inulin alleviates inflammation of alcoholic liver disease via SCFAs-inducing suppression of M1 and facilitation of M2 macrophages in mice. Int Immunopharmacol. (2020) 78:106062. doi: 10.1016/j.intimp.2019.106062
28. Song X, Zhang H, Zhang Y, Goh B, Bao B, Mello SS, et al. Gut microbial fatty acid isomerization modulates intraepithelial T cells. Nature. (2023) 619:837–43. doi: 10.1038/s41586-023-06265-4
29. Ock CY, Keam B, Kim S, Lee JS, Kim M, Kim TM, et al. Pan-cancer immunogenomic perspective on the tumor microenvironment based on PD-L1 and CD8 T-cell infiltration. Clin Cancer Res. (2016) 22:2261–70. doi: 10.1158/1078-0432.CCR-15-2834
30. Hisada Y and Mackman N. Tissue factor and cancer: regulation, tumor growth, and metastasis. Semin Thromb Hemost. (2019) 45:385–95. doi: 10.1055/s-0039-1687894
31. Breij EC, de Goeij BE, Verploegen S, Schuurhuis DH, Amirkhosravi A, Francis J, et al. An antibody-drug conjugate that targets tissue factor exhibits potent therapeutic activity against a broad range of solid tumors. Cancer Res. (2014) 74:1214–26. doi: 10.1158/0008-5472.CAN-13-2440
32. Palumbo JS, Talmage KE, Massari JV, La Jeunesse CM, Flick MJ, Kombrinck KW, et al. Tumor cell-associated tissue factor and circulating hemostatic factors cooperate to increase metastatic potential through natural killer cell-dependent and-independent mechanisms. Blood. (2007) 110:133–41. doi: 10.1182/blood-2007-01-065995
33. Gil-Bernabé AM, Ferjancic S, Tlalka M, Zhao L, Allen PD, Im JH, et al. Recruitment of monocytes/macrophages by tissue factor-mediated coagulation is essential for metastatic cell survival and premetastatic niche establishment in mice. Blood. (2012) 119:3164–75. doi: 10.1182/blood-2011-08-376426
34. Liput KP, Lepczyński A, Ogłuszka M, Nawrocka A, Poławska E, Grzesiak A, et al. Effects of Dietary n-3 and n-6 Polyunsaturated Fatty Acids in Inflammation and Cancerogenesis. Int J Mol Sci. (2021) 22:6965. doi: 10.3390/ijms22136965
35. Mouradian M, Kikawa KD, Johnson ED, Beck KL, and Pardini RS. Key roles for GRB2-associated-binding protein 1, phosphatidylinositol-3-kinase, cyclooxygenase 2, prostaglandin E2 and transforming growth factor alpha in linoleic acid-induced upregulation of lung and breast cancer cell growth. Prostaglandins Leukot Essent Fatty Acids. (2014) 90:105–15. doi: 10.1016/j.plefa.2013.12.001
36. Li J, Guasch-Ferré M, Li Y, and Hu FB. Dietary intake and biomarkers of linoleic acid and mortality: systematic review and meta-analysis of prospective cohort studies. Am J Clin Nutr. (2020) 112(1):150–67. doi: 10.1093/ajcn/nqz349
37. Chakarov S, Blériot C, and Ginhoux F. Role of adipose tissue macrophages in obesity-related disorders. J Exp Med. (2022) 219:e20211948. doi: 10.1084/jem.20211948
38. Boutens L, Hooiveld GJ, Dhingra S, Cramer RA, Netea MG, and Stienstra R. Unique metabolic activation of adipose tissue macrophages in obesity promotes inflammatory responses. Diabetologia. (2018) 61:942–53. doi: 10.1007/s00125-017-4526-6
39. Martin-Perez M, Urdiroz-Urricelqui U, Bigas C, and Benitah SA. The role of lipids in cancer progression and metastasis. Cell Metab. (2022) 34:1675–99. doi: 10.1016/j.cmet.2022.09.023
40. Mukhopadhyay S, Mahapatra KK, Praharaj PP, Patil S, and Bhutia SK. Recent progress of autophagy signaling in tumor microenvironment and its targeting for possible cancer therapeutics. Semin Cancer Biol. (2022) 85:196–208. doi: 10.1016/j.semcancer.2021.09.003
41. Low YH, Loh CJL, Peh DYY, Chu AJM, Han S, and Toh HC. Pathogenesis and therapeutic implications of EBV-associated epithelial cancers. Front Oncol. (2023) 13:1202117. doi: 10.3389/fonc.2023.1202117
42. Xie M, Wu X, Wang F, Zhang J, Ben X, Zhang J, et al. Clinical significance of plasma epstein-barr virus DNA in pulmonary lymphoepithelioma-like carcinoma (LELC) patients. J Thorac Oncol. (2018) 13:218–27. doi: 10.1016/j.jtho.2017.10.031
43. Zhou N, Tang H, Yu S, Lin Y, Wang Y, and Wang Y. Anti-PD-1 antibodies, a novel treatment option for advanced chemoresistant pulmonary lymphoepithelioma carcinoma. Front Immunol. (2022) 13:1001414. doi: 10.3389/fimmu.2022.1001414
44. Bao H, Ma LZ, Zhao C, Yu M, Zhang B, Zhang J, et al. Anti-angiogenic therapy for advanced primary pulmonary lymphoepithelioma-like carcinoma: a retrospective multicenter study. J Cancer Res Clin Oncol. (2023) 149:1185–93. doi: 10.1007/s00432-022-03935-0
45. Zhou LQ, Dong MH, Hu ZW, Tang Y, Chu YH, Chen M, et al. Staged suppression of microglial autophagy facilitates regeneration in CNS demyelination by enhancing the production of linoleic acid. Proc Natl Acad Sci U S A. (2023) 120:e2209990120. doi: 10.1073/pnas.2209990120
46. Wang Q and Wang X. The effects of a low linoleic acid/α-linolenic acid ratio on lipid metabolism and endogenous fatty acid distribution in obese mice. Int J Mol Sci. (2023) 24:12117. doi: 10.3390/ijms241512117
47. Murru E, Carta G, Manca C, Sogos V, Pistis M, Melis M, et al. Conjugated linoleic acid and brain metabolism: A possible anti-neuroinflammatory role mediated by PPARα Activation. Front Pharmacol. (2021) 11:587140. doi: 10.3389/fphar.2020.587140
Keywords: primary pulmonary lymphoepithelioma-like carcinoma, multiomics, linoleic acid, tissue factor, PPAR-α
Citation: Bao H, Zhang J, Chen Z, Wang Y, Wang Z, Chen Z, Jiang T, Zhang B, Zeng W, Bao H and Ma S (2025) Linoleic acid drives pulmonary lymphoepithelioma-like carcinoma progression via PPAR-α/TF axis. Front. Oncol. 15:1640201. doi: 10.3389/fonc.2025.1640201
Received: 19 June 2025; Accepted: 28 July 2025;
Published: 15 August 2025.
Edited by:
Fabrizio Fontana, University of Milan, ItalyReviewed by:
Chongwu Li, Tongji University, ChinaZihan Wang, Peking University Third Hospital, China
Pengyu Yao, Jinan Maternity And Child Care Hospital, China
Copyright © 2025 Bao, Zhang, Chen, Wang, Wang, Chen, Jiang, Zhang, Zeng, Bao and Ma. This is an open-access article distributed under the terms of the Creative Commons Attribution License (CC BY). The use, distribution or reproduction in other forums is permitted, provided the original author(s) and the copyright owner(s) are credited and that the original publication in this journal is cited, in accordance with accepted academic practice. No use, distribution or reproduction is permitted which does not comply with these terms.
*Correspondence: Hejing Bao, Nzc1NDAyMjM0QHFxLmNvbQ==; Shudong Ma, c2h1ZG9uZ21hQGFsaXl1bi5jb20=; Hehong Bao, NDY3MjQyMDYwQHFxLmNvbQ==
†These authors have contributed equally to this work