 Ge Zhang1
 Huandi Zhou
 Xiaoying Xue
- 1Department of Radiotherapy, The Second Hospital of Hebei Medical University, Shijiazhuang, Hebei, China
- 2Hebei Key Laboratory of Etiology Tracing and Individualized Diagnosis and Treatment for Digestive System Carcinoma, The Second Hospital of Hebei Medical University, Shijiazhuang, Hebei, China
- 3Department of Central Laboratory, The Second Hospital of Hebei Medical University, Shijiazhuang, Hebei, China
- 4Department of Pathology, The Second Hospital of Hebei Medical University, Shijiazhuang, Hebei, China
Background: Diffuse midline glioma (DMG) is a rare and highly aggressive central nervous system tumor with limited treatment options and poor survival outcomes. Reliable prognostic models are urgently needed to guide risk-adapted therapy.
Methods: We retrospectively analyzed 409 DMG patients from the SEER database (2018–2021). Independent prognostic factors were identified using multivariate Cox regression analysis. A nomogram was developed to estimate overall survival, and its performance was evaluated using the concordance index (C-index), time-dependent ROC curves, calibration plots. Risk stratification was based on nomogram total scores. Subgroup survival comparisons were conducted using Kaplan–Meier and log-rank tests. External validation was performed using an independent institutional cohort of 22 patients.
Results: An age-dependent anatomical distribution was observed: brainstem tumors predominated in children, while non-brainstem tumors were more common in adults. Multivariate Cox regression identified older age, higher household income, and cerebellar location as independent prognostic factors. These variables were incorporated into a nomogram that demonstrated good discriminative ability and calibration. Based on total risk scores, patients were stratified into high- and low-risk groups with significantly different survival outcomes. Combined chemoradiotherapy significantly improved survival compared to radiotherapy or chemotherapy alone, while chemotherapy alone showed no added benefit. Surgical resection extent was not associated with prognosis. In an external validation cohort of 22 patients, survival was better in the low-risk group than in the high-risk group, although the difference was not statistically significant (P = 0.188).
Conclusion: This study presents the first large-scale, SEER-based nomogram for DMG, offering reliable prognostic stratification and reinforcing the survival benefit of combined chemoradiotherapy. The model’s clinical utility is further supported by real-world institutional validation, underscoring its potential to inform individualized treatment strategies in DMG.
1 Introduction
Diffuse midline glioma (DMG), characterized by H3 K27 alterations, is one of the most challenging pediatric malignancies. It predominantly arises in midline structures, including the brainstem, thalamus, and spinal cord (1, 2). Formerly classified as diffuse intrinsic pontine glioma (DIPG) based on anatomical location as a radiographic diagnosis (3, 4), DMG is now recognized by the 2021 WHO Classification as a distinct entity defined by both molecular features—particularly the loss of H3K27me3 trimethylation —and midline location (2, 3, 5). While DIPG and DMG share considerable overlap, they are not identical. Although relatively rare, with an annual incidence of approximately 0.1 per 100,000, DMG accounts for nearly 20% of all pediatric CNS malignancies (4).
Despite advances in molecular understanding, the prognosis remains dismal, with a median overall survival (OS) of 9–11 months (6). Current clinical guidelines diverge substantially. For instance, the National Comprehensive Cancer Network (NCCN 2025) recommends upfront radiotherapy without routine chemotherapy in children (7), whereas European Association for Neuro-Oncology (EANO) suggests radiotherapy with temozolomide (8), and American Society of Clinical Oncology-Society for Neuro-Oncology (ASCO–SNO) jointly released that no standard therapy confers a clear benefit outside clinical trials (9). Moreover, while agents like ONC201 show promise, their efficacy is limited by poor blood–brain barrier (BBB) penetration (10–13). These inconsistencies underscore the urgent need for robust prognostic frameworks to inform treatment decisions.
However, prior studies of DMG prognosis have been limited by small sample sizes, subtype heterogeneity, or lack of real-world validation (14–16). To overcome these limitations, we conducted a large-scale, population-based analysis using the Surveillance, Epidemiology, and End Results database (SEER), which covers ~28% of the U.S. population. A total of 409 DMG patients were identified, enabling the construction of the largest prognostic nomogram for this disease. Key contributions of this study include: (1) establishing the largest single-disease cohort of molecularly defined DMG patients; (2) revealing an age-dependent anatomical distribution of tumors; (3) developing and internally validating a nomogram incorporating clinical and socioeconomic factors; and (4) externally validating this model in an independent institutional cohort.
This integrated approach offers new population-level evidence to support individualized risk stratification and optimize therapeutic strategies for DMG patients.
2 Material and methods
2.1 Study design and data source
This population-based retrospective cohort study utilized data from SEER 22 Registries, which collectively cover approximately 28% of the U.S. population. Patients diagnosed with diffuse midline glioma (DMG) between 2018 and 2021 were identified using the ICD-O-3 morphology code 9385/3. Although the SEER database labels this code as “Diffuse intrinsic pontine glioma, H3 K27M-mutant,” it was introduced in 2018 following the WHO 2016 CNS classification to represent diffuse midline glioma, H3 K27M-mutant. This terminology lag is common in SEER, as legacy names are retained to ensure compatibility with earlier datasets (e.g., “glioblastoma multiforme, NOS [9440/3]” remains listed despite the removal of “multiforme” in recent WHO editions). Extracted variables included demographic characteristics (age, sex, race, household income), clinical information (primary tumor location, time from diagnosis to treatment), and treatment modalities (extent of surgery, radiotherapy, and chemotherapy).
In addition, an independent institutional cohort comprising 22 pathologically confirmed DMG patients treated with chemoradiotherapy was retrospectively collected for external validation. Clinical and treatment data were extracted following the same variable definitions as the SEER cohort.
2.2 Cohort definition and data preprocessing
Patients from the SEER dataset were randomly assigned to a training cohort (70%) and a validation cohort (30%) for nomogram construction and internal validation, respectively. Continuous variables were summarized as mean ± standard deviation (for normally distributed data) or median [interquartile range, IQR] (for non-normally distributed data), and compared using Student’s t-test or Mann–Whitney U test, as appropriate. Categorical variables were presented as frequencies and percentages, with group comparisons performed using Chi-square or Fisher’s exact test. We used the missRanger package in R, which performs multiple imputation based on random forest algorithms.
2.3 Model construction and internal validation
Univariate Cox proportional hazards regression was used to identify candidate prognostic factors associated with overall survival (OS), and variables with p < 0.20 were entered into a multivariable Cox model. A bidirectional stepwise selection procedure, guided by the Akaike Information Criterion (AIC), was employed to determine independent predictors (p < 0.05).
Based on the final model, a prognostic nomogram was developed using the rms package in R. Model performance was assessed by discrimination and calibration. Discrimination was evaluated using the concordance index (C-index) and time-dependent receiver operating characteristic (ROC) curves (via the riskRegression package). Calibration was evaluated by plotting the predicted versus observed OS at 6, 12, and 24 months.
2.4 Risk stratification and external validation
A total risk score was calculated for each patient in the SEER cohort based on the nomogram, and the optimal cutoff value was determined using the survival and survminer packages. Patients were classified into high- and low-risk groups accordingly. Kaplan–Meier survival analysis and log-rank tests were used to assess differences in survival between risk strata.
For external validation, the institutional cohort (n = 22) was stratified using the SEER-derived cutoff. Kaplan–Meier curves were generated, and log-rank tests were conducted to evaluate the prognostic separation between risk groups. All statistical tests were two-sided, and p < 0.05 was considered statistically significant.
3 Results
3.1 Patient characteristics
We identified 409 patients diagnosed with DMG from the SEER database. The median overall survival (OS) was 9 months (IQR: 4–16 months), and the median age was 12 years. Female patients accounted for 53.8% of the cohort. The brainstem was the most common tumor location (49.4%). Radiotherapy and chemotherapy were administered to 74.1% and 51.3% of patients, respectively. The training and validation cohort distributions are shown in Table 1.
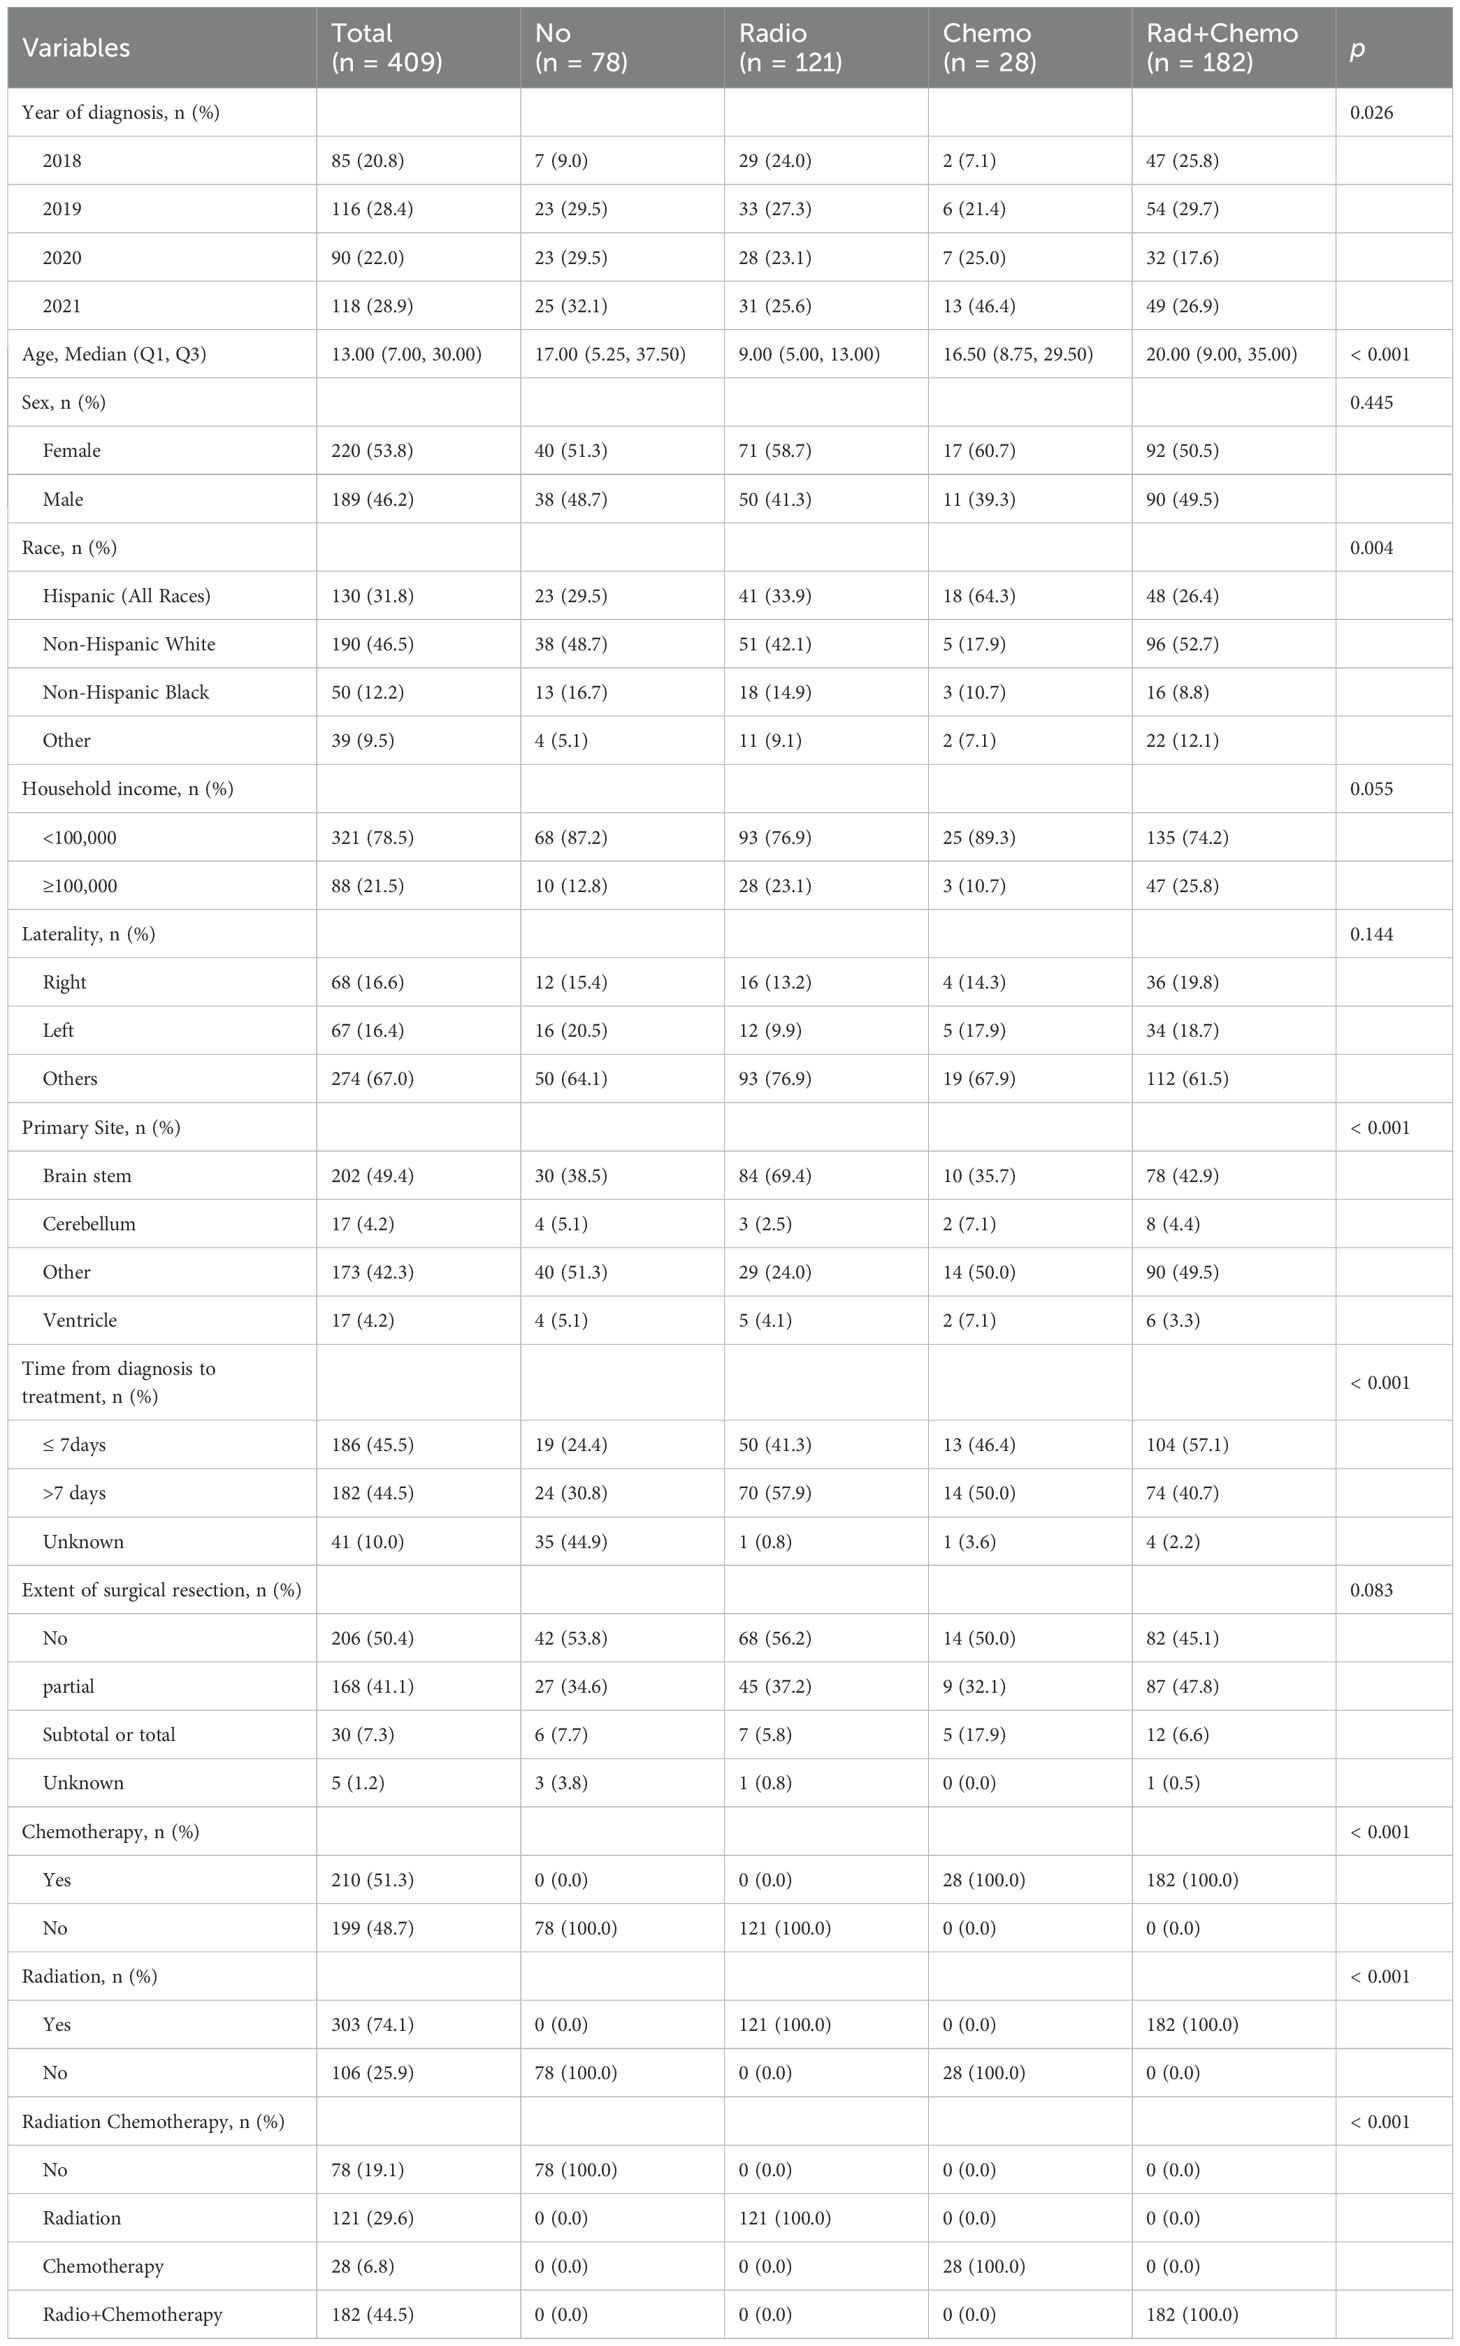
Table 1. Baseline characteristics of DMG patients in the training and validation cohorts.
3.2 Patterns of incidence by age and tumor location
The incidence of DMG reached its peak in children aged 5 to 9 years old and gradually decreased thereafter. There was a significant association between age and tumor location (χ²=24.6, p<0.001): brainstem tumors were predominant in patients under 14 years (70.8%), whereas non-brainstem tumors were more common in adults and the elderly (Figure 1).
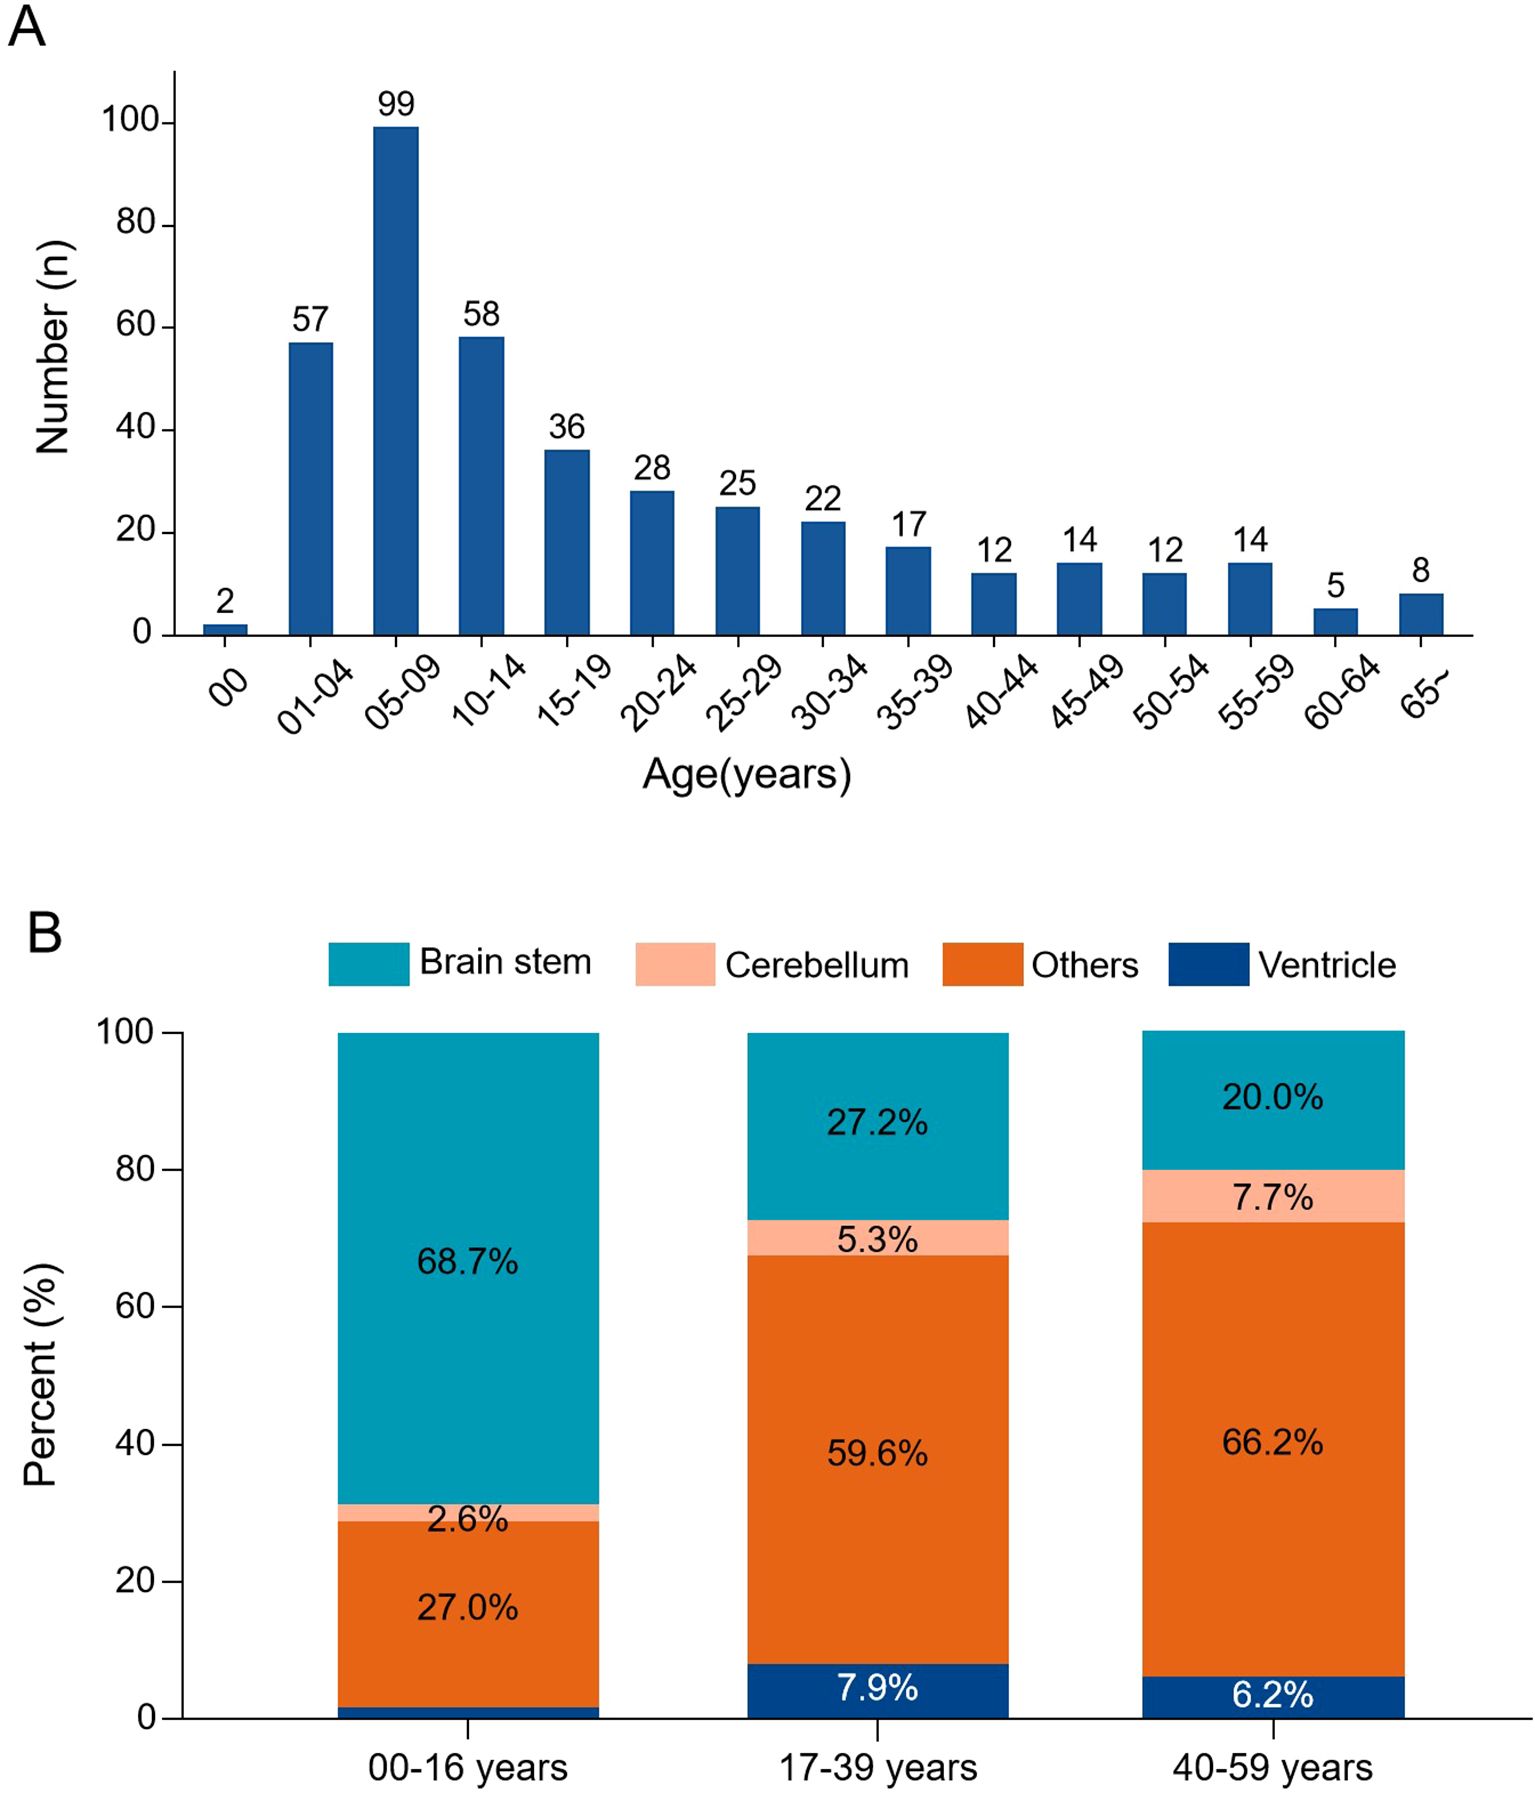
Figure 1. Age distribution and tumor location patterns in DMG. (A) Age-specific incidence histogram showing the number of cases across age groups. (B) Stacked bar chart illustrating tumor location distribution stratified by age groups. Brainstem tumors predominated in pediatric patients, while non-brainstem locations were more frequent in adults.
3.3 Survival analyses
Kaplan–Meier analysis (Figure 2) demonstrated that older age (>12 years; p < 0.001), non-brainstem tumor location (p < 0.001), receipt of chemotherapy (p < 0.001), higher household income (≥$100,000; p = 0.038), and shorter diagnosis-to-treatment intervals (p = 0.045) were significantly associated with improved OS. Sex, race, and extent of surgical resection showed no significant correlation with survival (all p > 0.05).
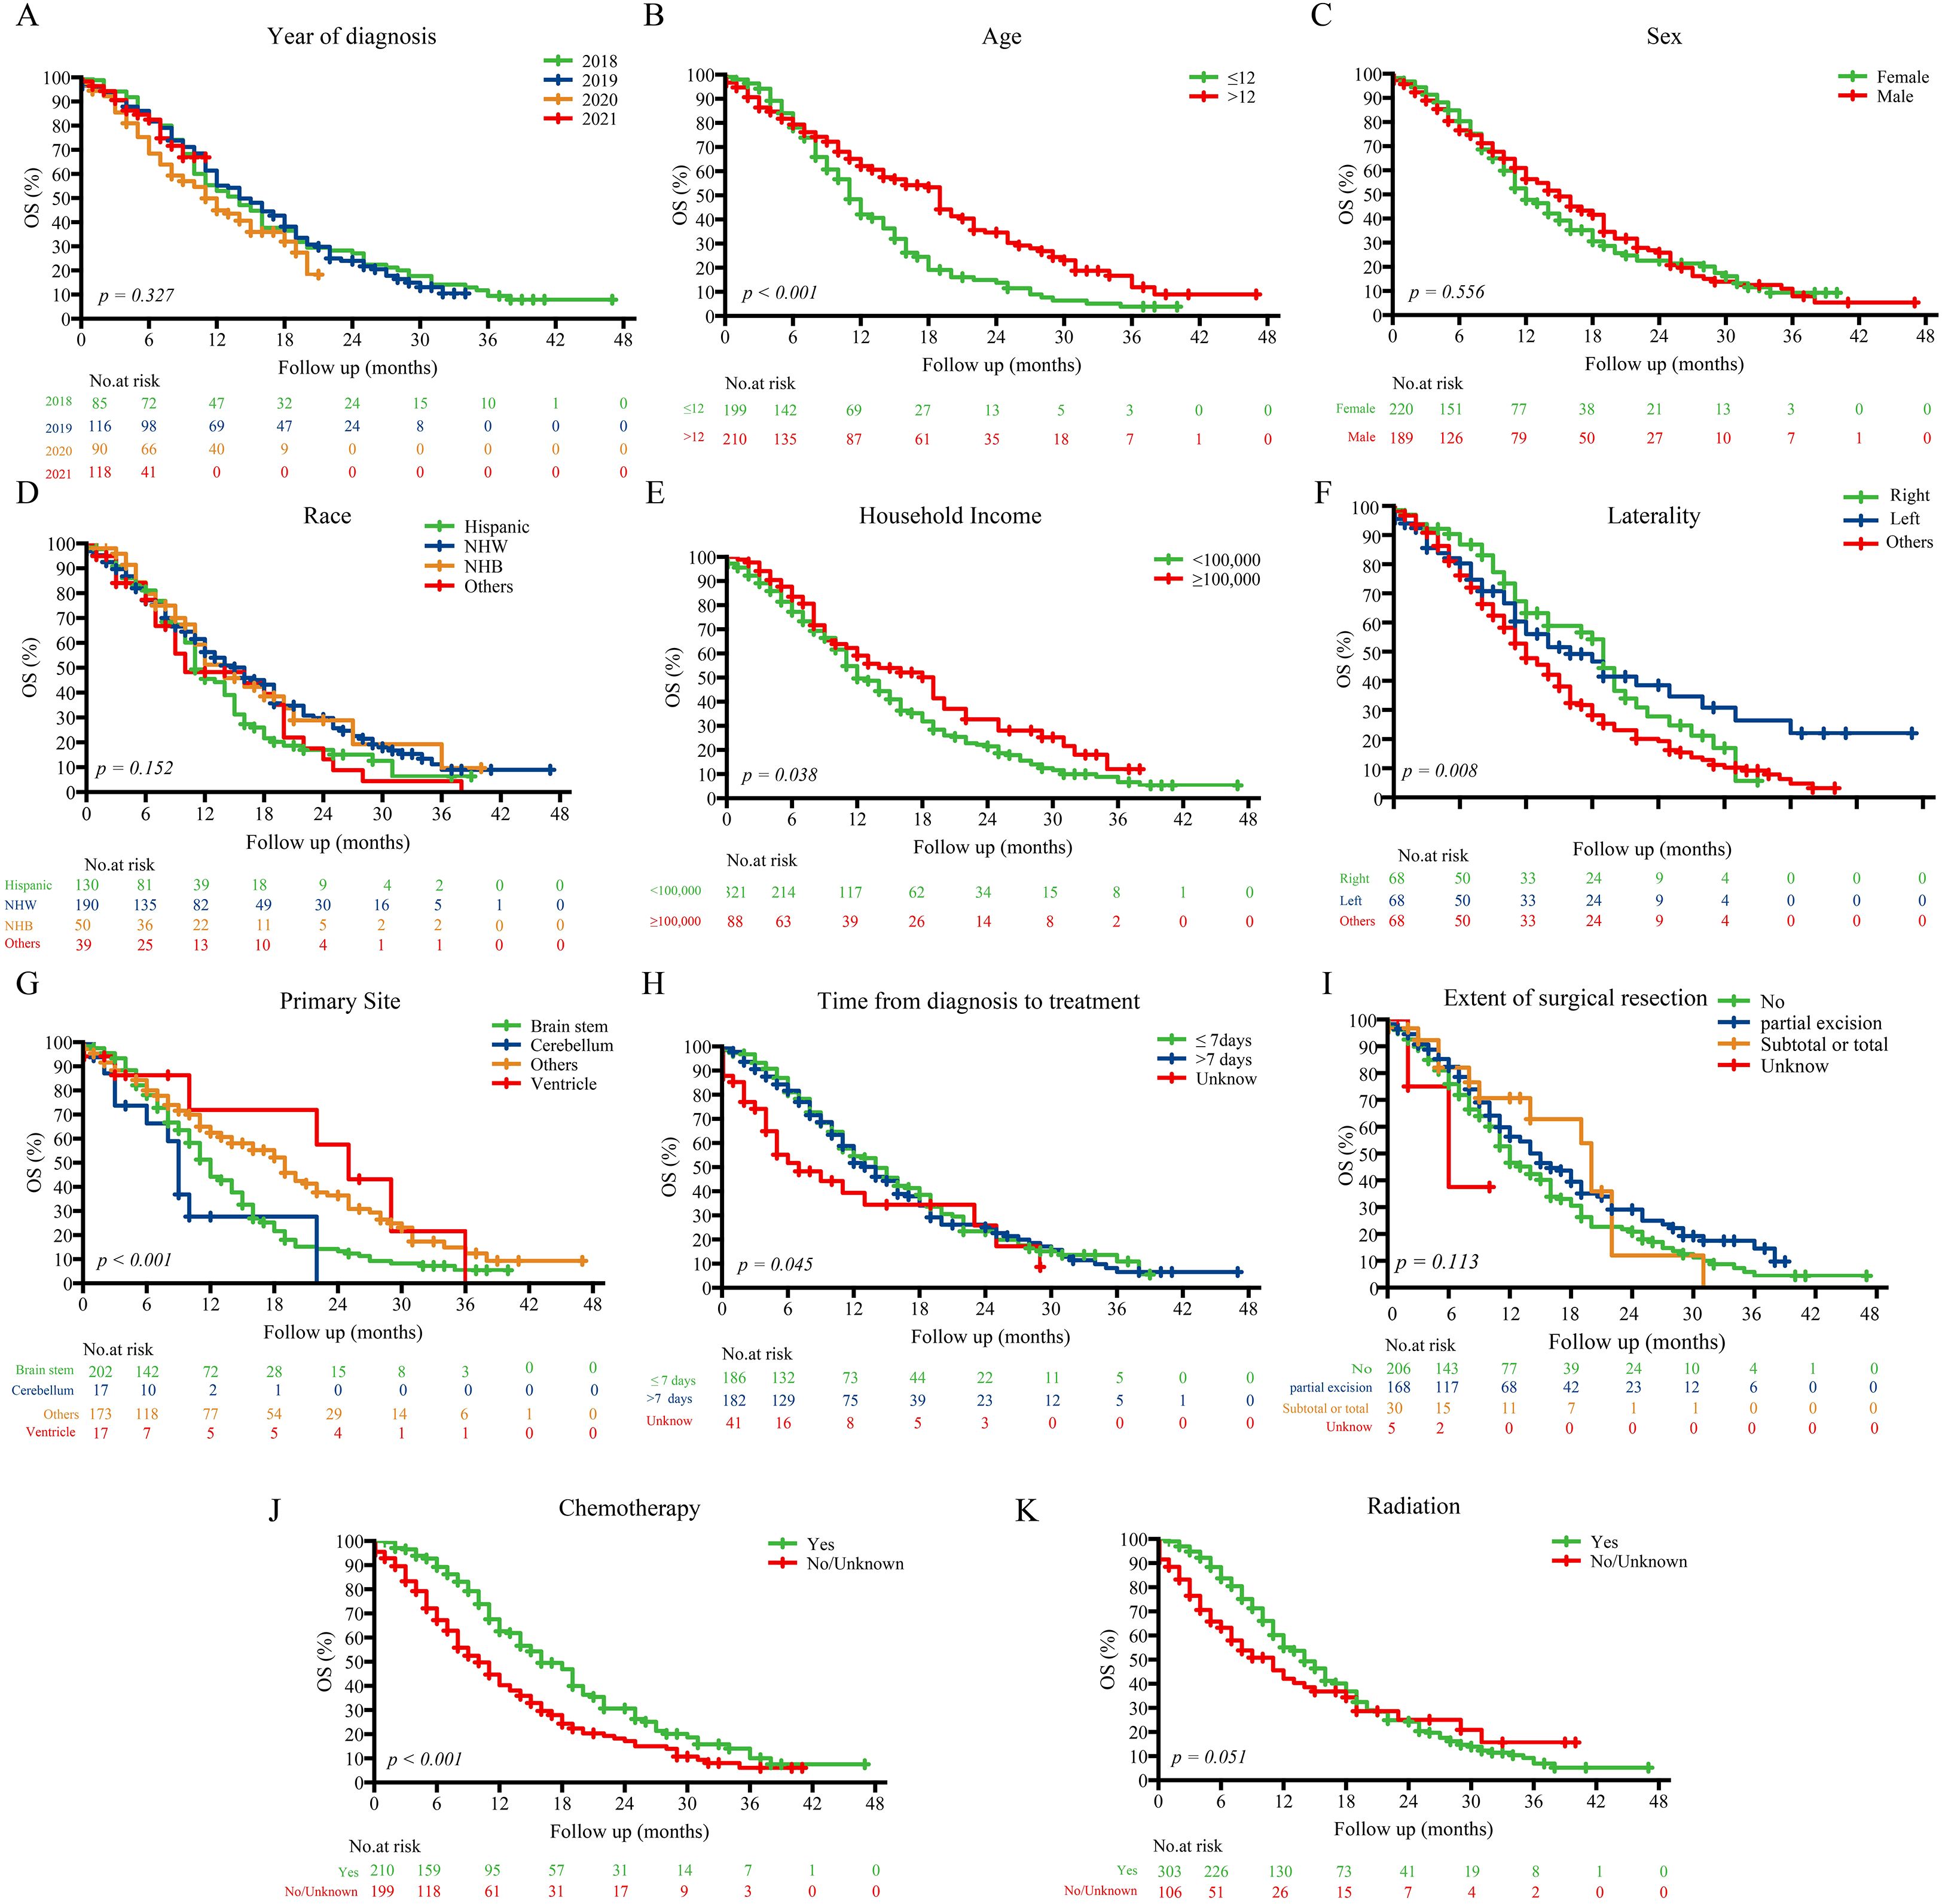
Figure 2. Kaplan–Meier survival curves stratified by prognostic factors in the entire cohort.Kaplan–Meier curves showing overall survival differences across subgroups defined by key prognostic variables: (A) Year of diagnosis; (B) Age; (C) Sex; (D) Race; (E) Household income; (F) Laterality; (G) Primary site; (H) Time from diagnosis to treatment; (I) Extent of surgical resection; (J) Chemotherapy; (K) Radiation. NHW, Non-Hispanic White; NHB, Non-Hispanic Black.
3.4 Cox regression analyses and development of nomogram
Univariate Cox regression analysis (Table 2) showed protection factors, including age >12 years (HR = 0.565, 95%CI 0.416-0.769; p<0.001), male sex (HR = 0.724, 95%CI 0.535-0.981; p=0.037), non-Hispanic White ethnicity (HR = 0.678, 95%CI 0.476-0.965; p=0.031), and higher income (≥$100,000; HR = 0.661, 95%CI 0.452-0.968; p=0.033). Conversely, the lack of chemotherapy (HR = 1.814, 95%CI 1.338-2.458; p<0.001) or radiotherapy therapy (HR = 1.608, 95%CI 1.129-2.289; p=0.008) independently predicted poorer results.
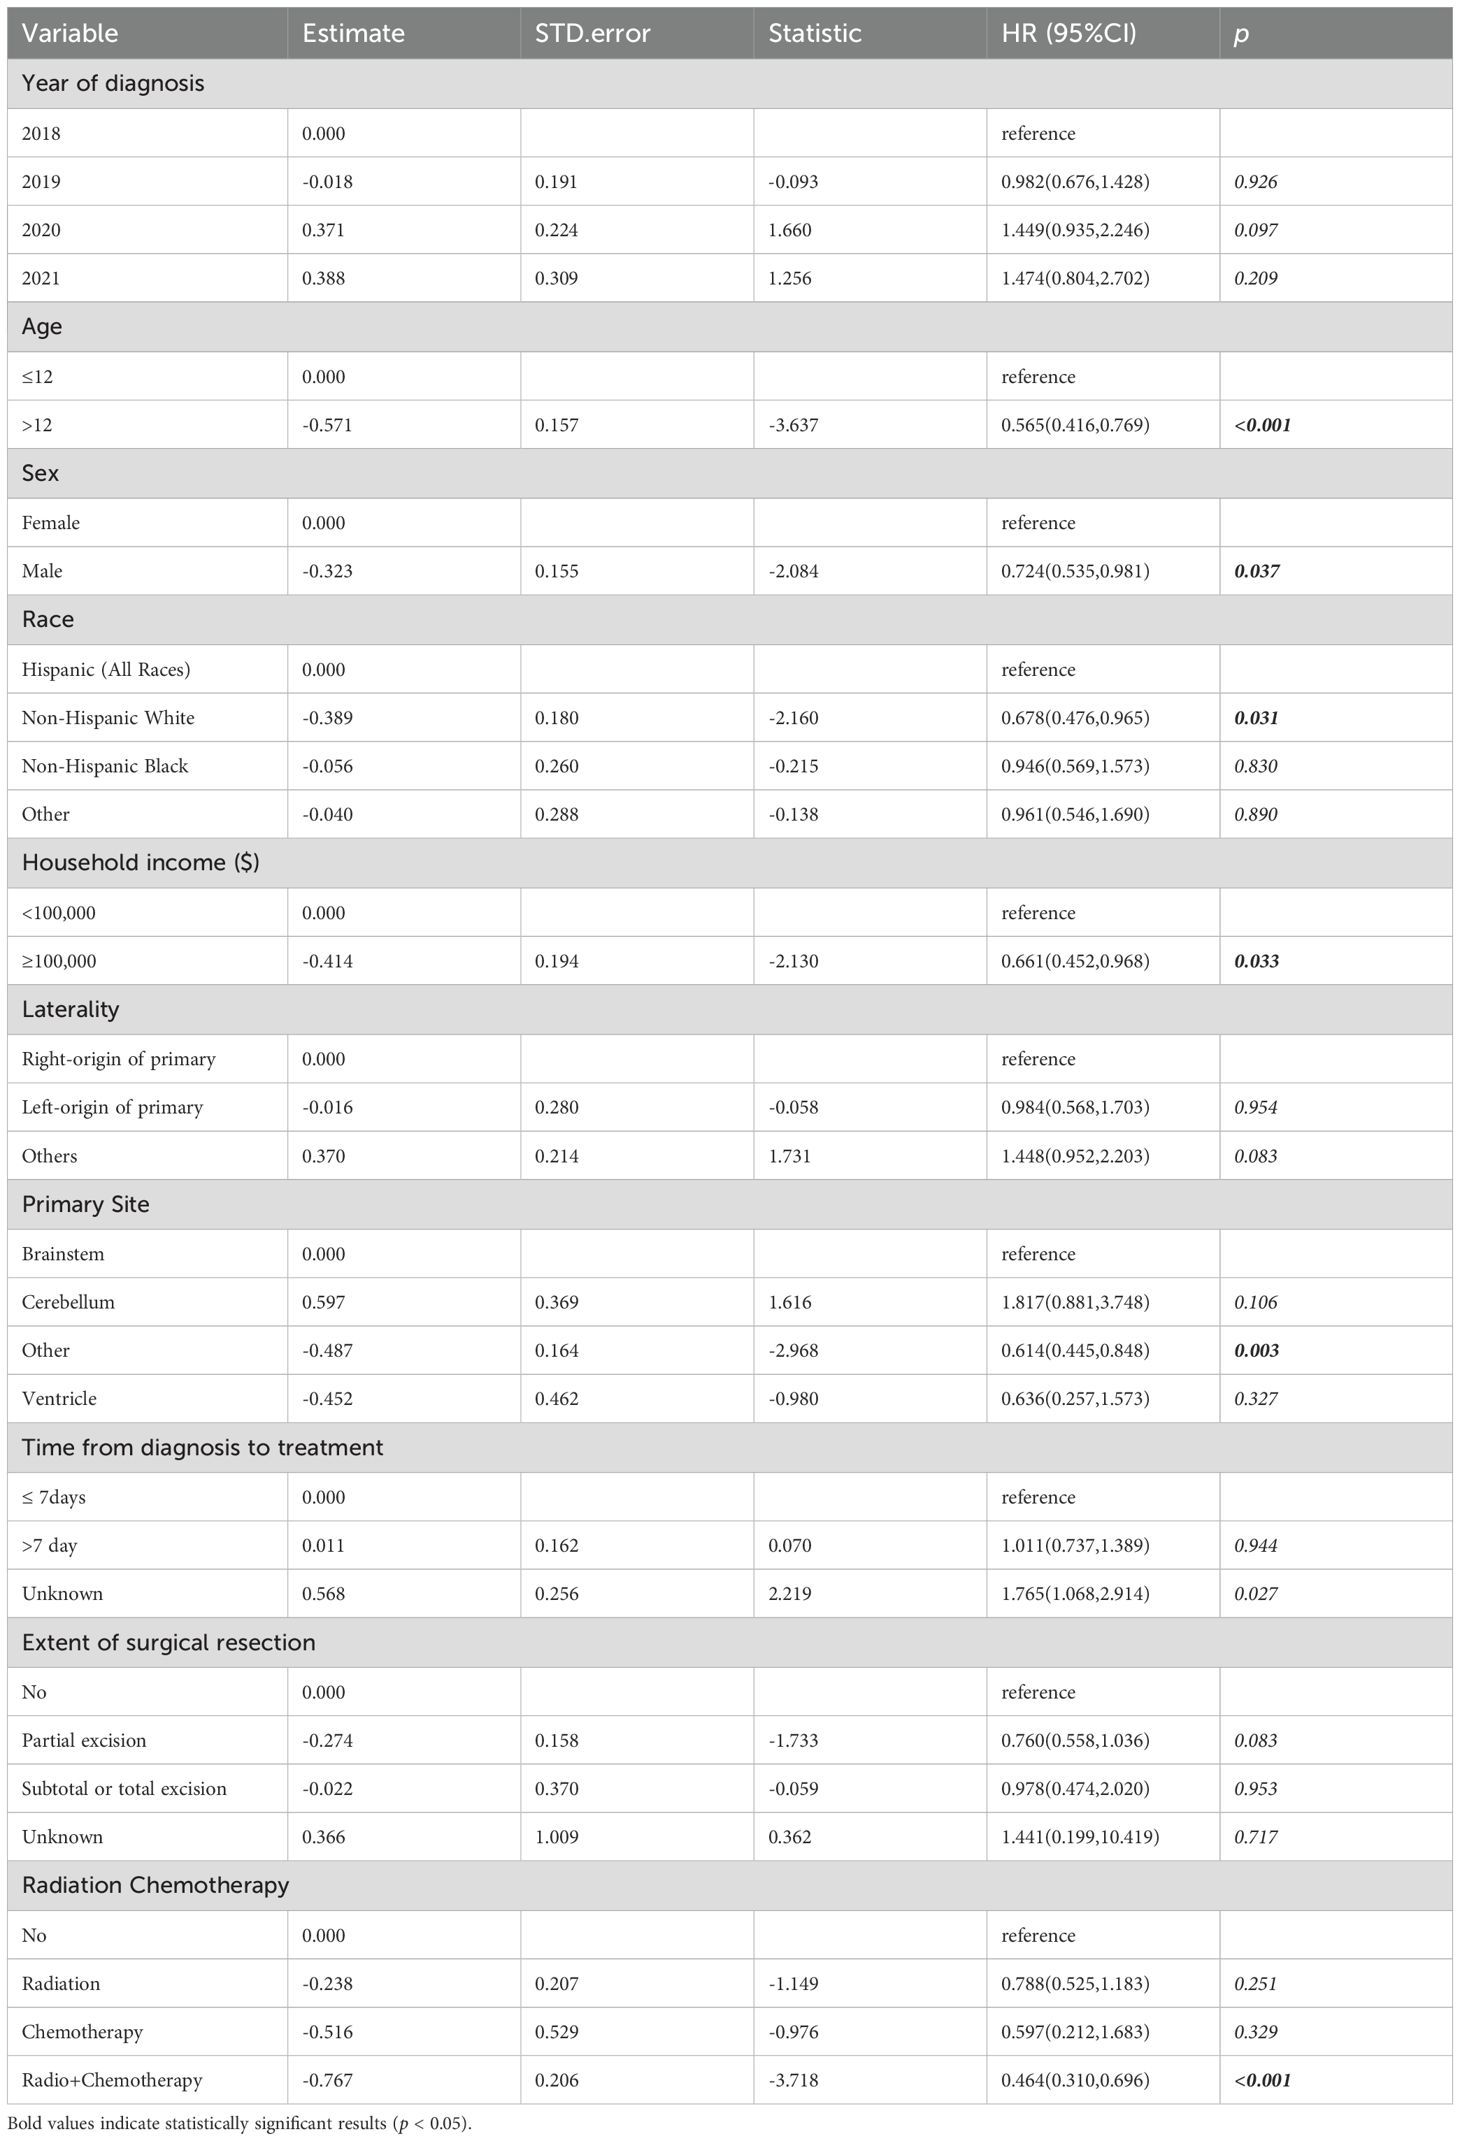
Table 2. Univariate Cox regression analysis in the training cohorts.
Multivariate Cox regression (Figure 3) confirmed that age >12 years (HR = 0.602, 95%CI 0.413-0.877; p=0.0083), household income ≥$100,000 (HR = 0.642, 95%CI 0.436-0.947; p=0.0254), and cerebellum tumors location (vs. brainstem: HR = 2.839, 95%CI 1.310-6.152; p=0.0082) as independent prognostic factors. Therapeutically, radiotherapy alone (HR = 0.593, 95%CI 0.378-0.931; p=0.0232) and combined chemoradiotherapy (HR = 0.411, 95%CI 0.270-0.626; p<0.001) significantly improved survival compared with no/unknown treatment, whereas chemotherapy alone showed no benefit (HR = 0.606, 95%CI 0.270-1.725; p=0.3481).
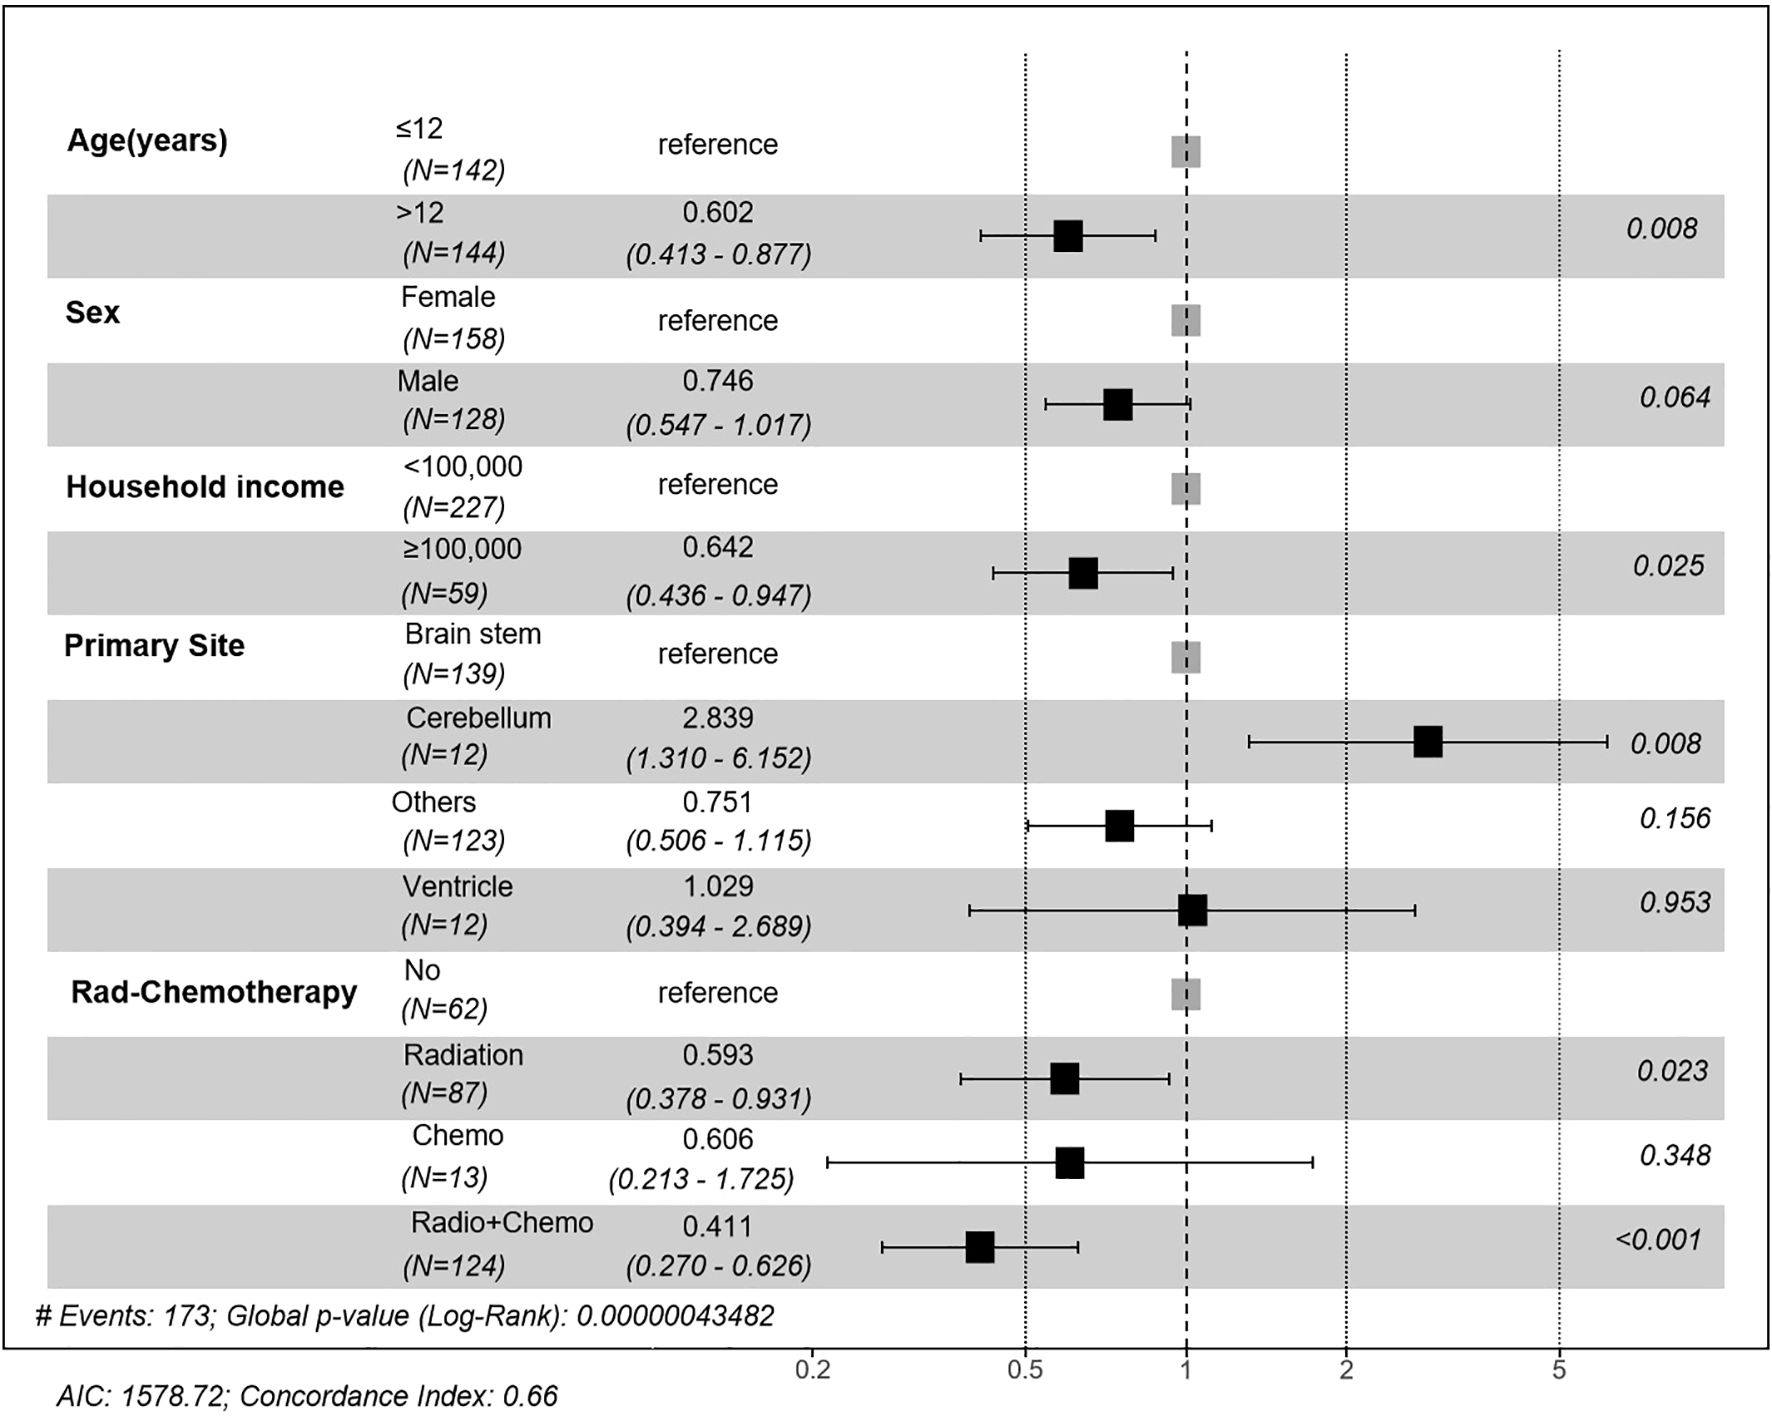
Figure 3. Forest plot of multivariate Cox regression analysis of prognostic factors. Hazard ratios (HR) and 95% confidence intervals (CI) are presented for age, sex, household income, primary site, and treatment modality. Significant prognostic factors included age >12 years, household income ≥$100,000, tumor location, and receiving radiotherapy or combined chemoradiotherapy.
Based on these independent predictors, we developed a nomogram predicting OS at 6, 12, and 24 months (Figure 4). Younger age (≤12 years), lower income, cerebellum location, and lack of treatment (radiotherapy or chemotherapy) corresponded to higher nomogram scores, indicating poorer prognosis.
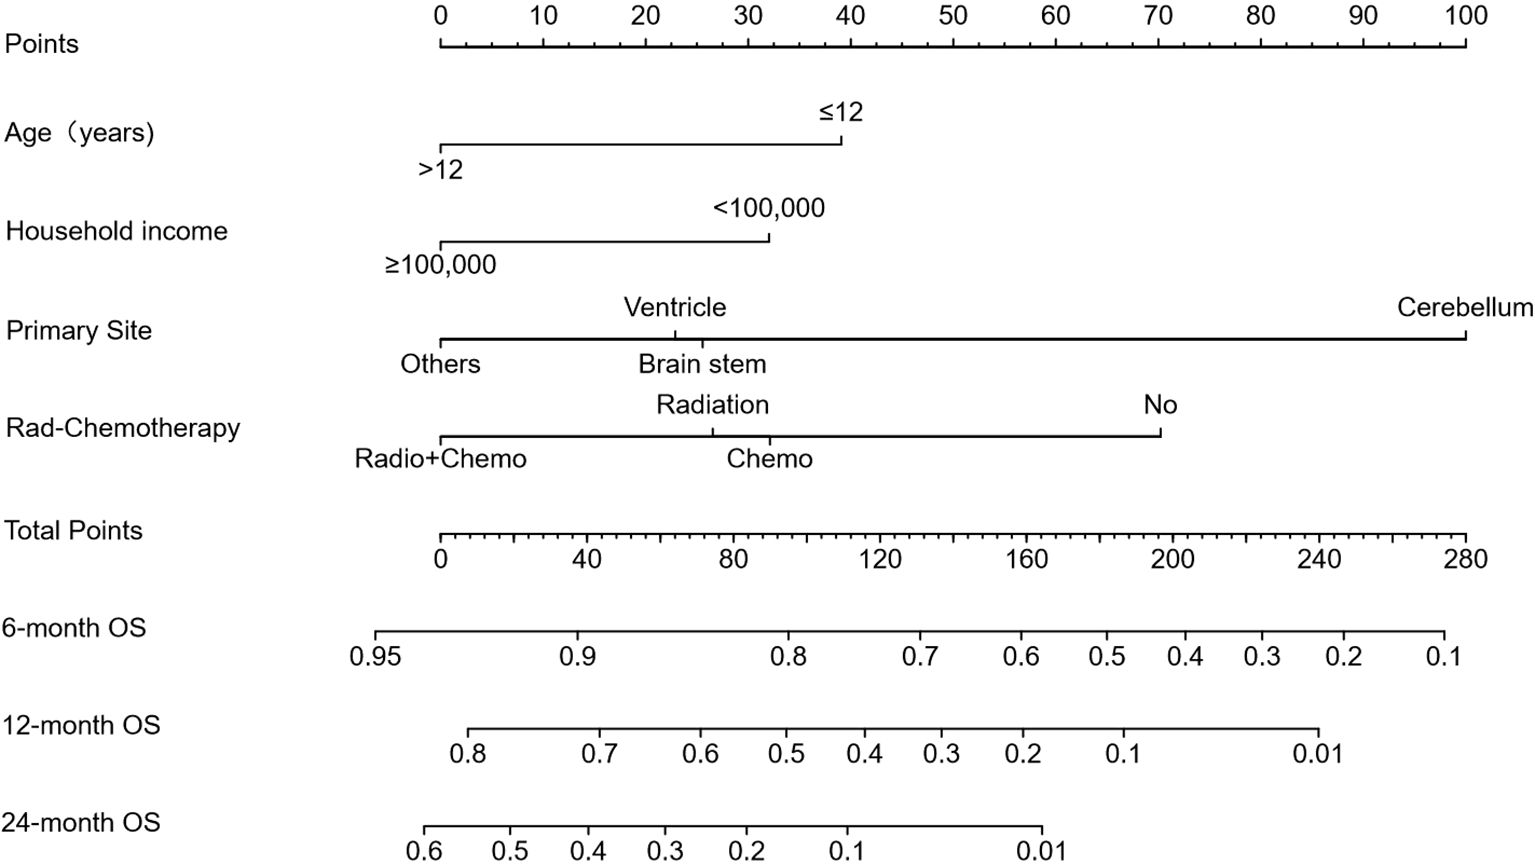
Figure 4. Prognostic nomogram for predicting 6-, 12-, and 24-month overall survival (OS). The nomogram was constructed based on age, household income, tumor location, and treatment modality. Points are assigned for each variable, and total points correspond to predicted survival probabilities at specified timepoints.
3.5 Nomogram evaluation and risk stratification
The nomogram exhibited moderate discrimination in both training (6-month AUC = 0.708; C-index=0.660) and validation cohorts (24-month AUC = 0.725; C-index=0.575) (Figure 5). Calibration curves demonstrated acceptable predictive accuracy. Risk stratification based on optimal cutoff (71.099 points) succeeded in differentiating high- and low-risk groups, demonstrating a significant difference in survival in training (HR = 2.53, p<0.001) and validation cohorts (HR = 1.67, p=0.021).
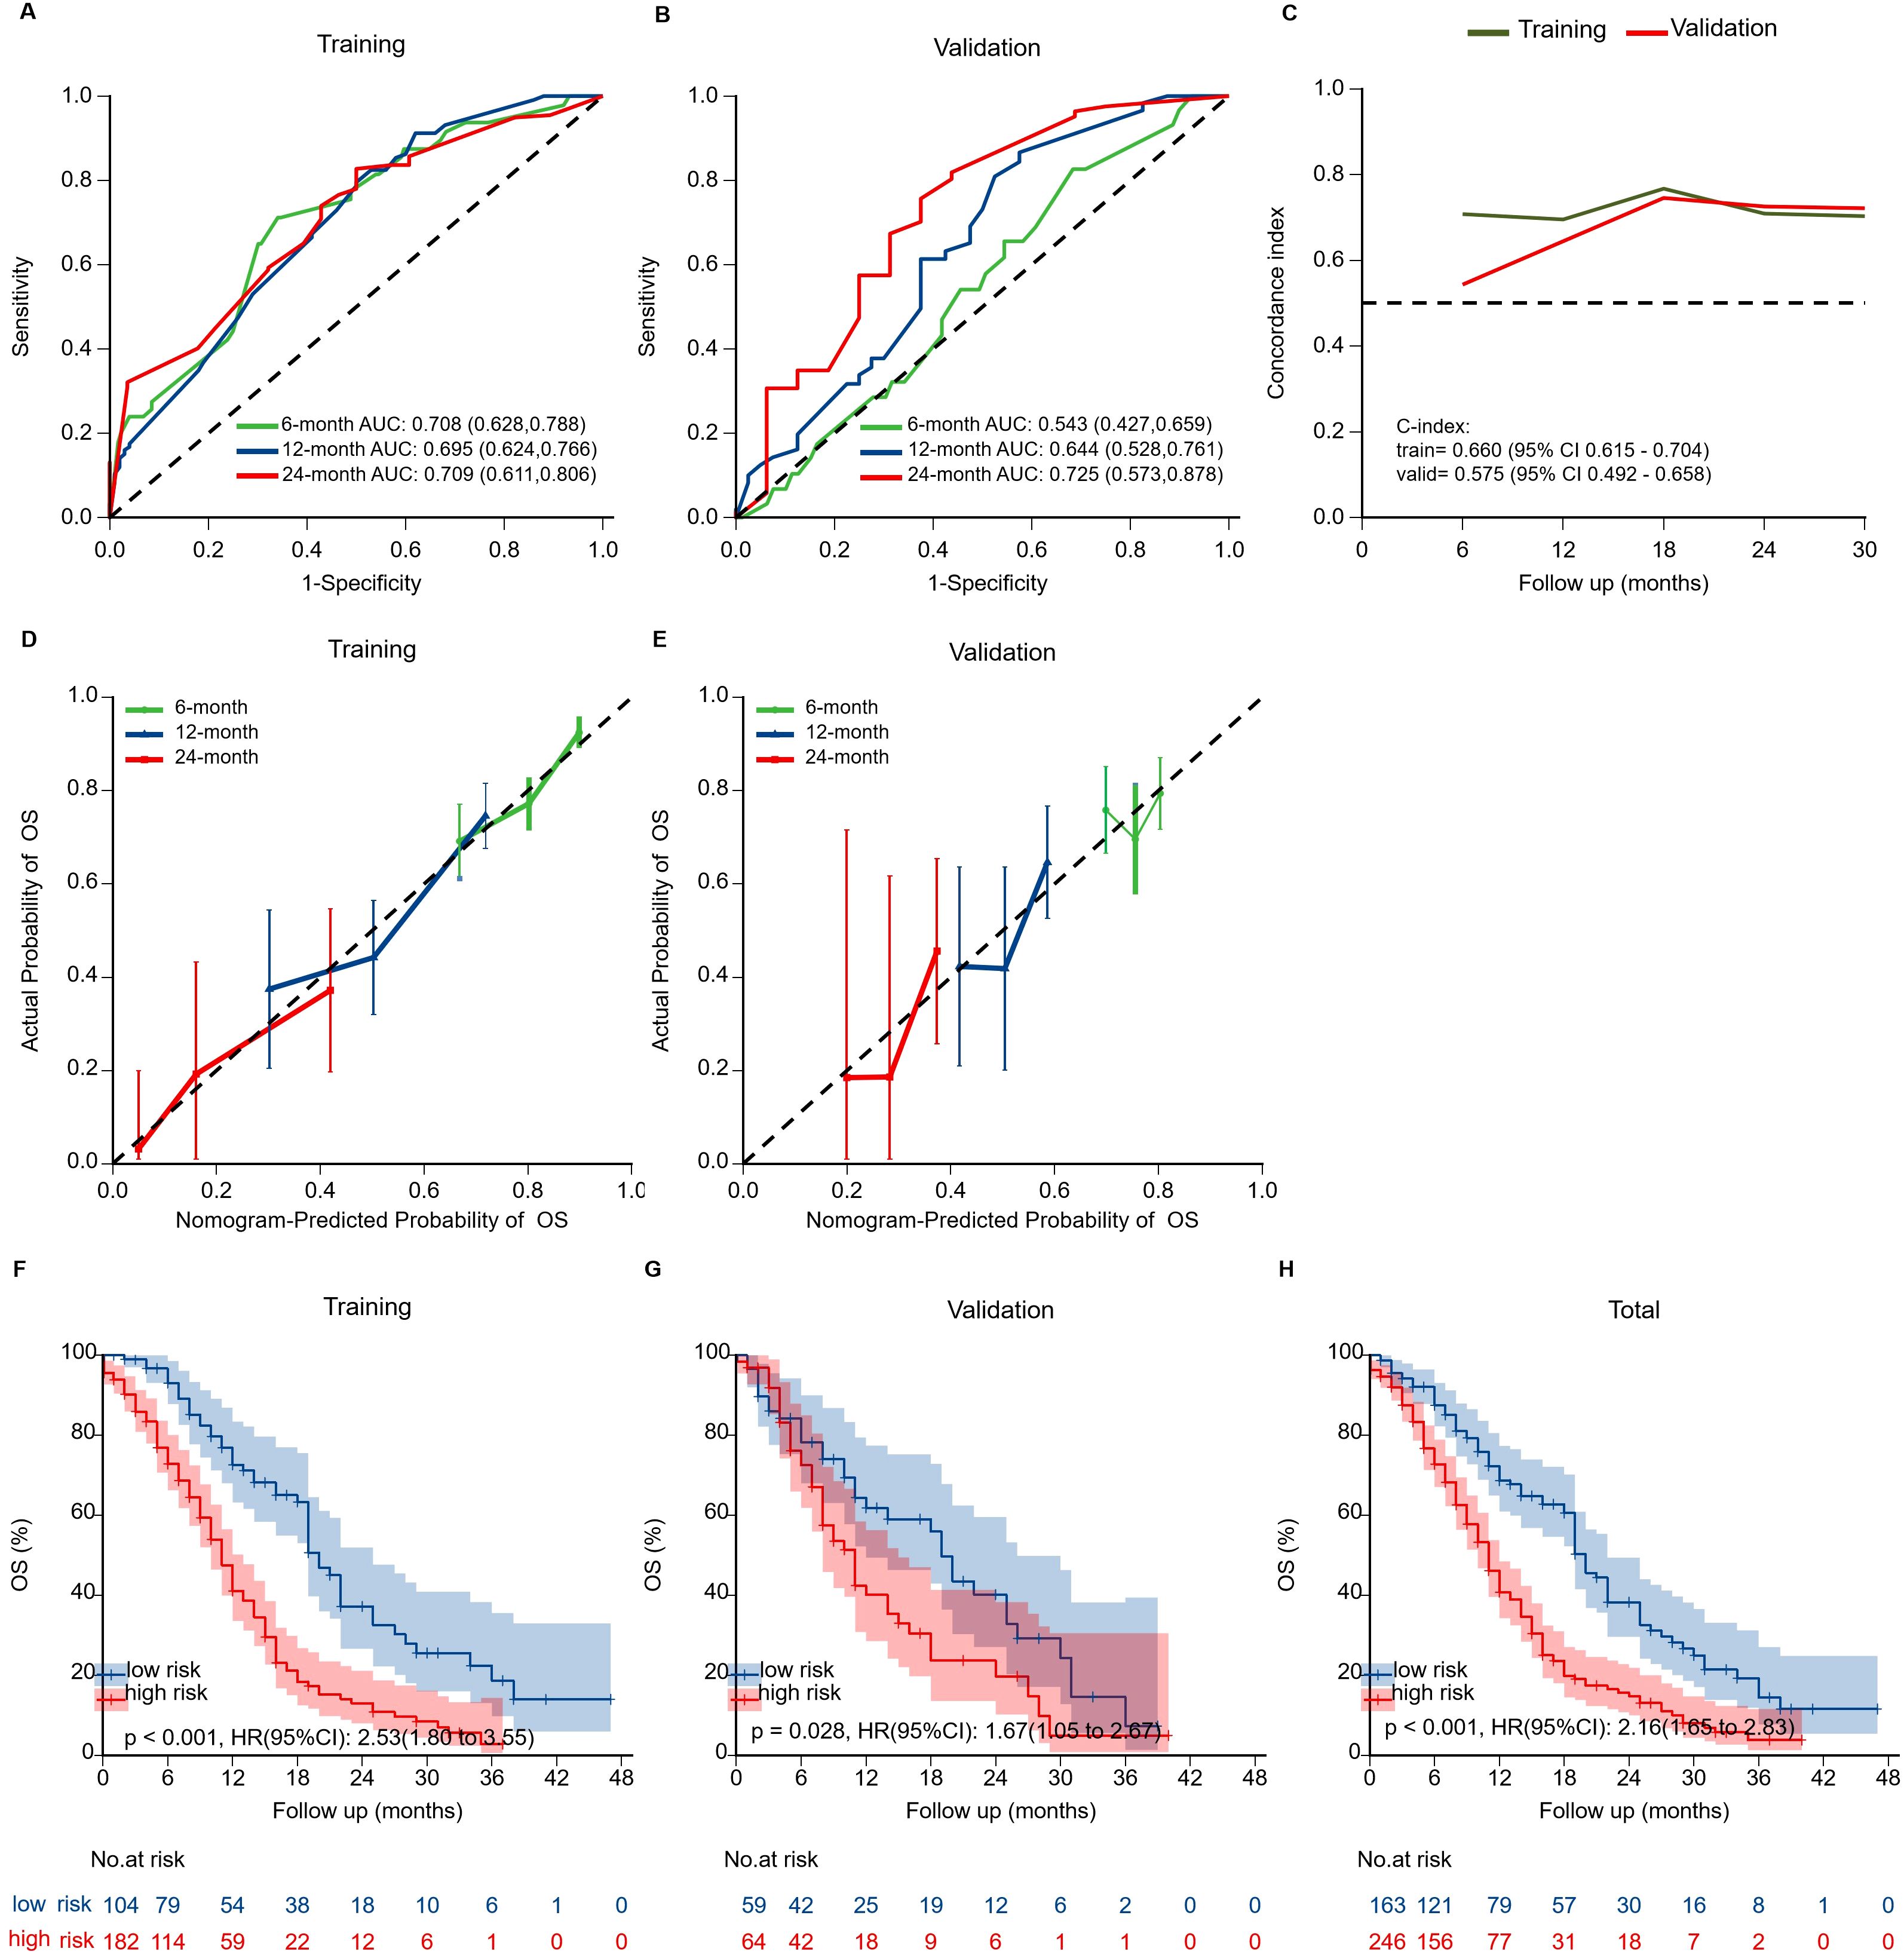
Figure 5. Validation of the prognostic nomogram. (A, B) Time-dependent ROC curves evaluating nomogram discrimination in training and validation cohorts. (C) Time-dependent concordance index (C-index) curves for both cohorts. Overall C-index was 0.660 (95% CI: 0.615–0.704) in the training cohort and 0.575 (95% CI: 0.492–0.658) in the validation cohort. (D, E) Calibration curves for 6-, 12-, and 24-month OS showing agreement between predicted and observed survival. (F-H) Kaplan-Meier survival curves stratified by risk groups in training, validation, and overall cohorts. High-risk patients showed significantly worse OS than low-risk patients in all cohorts.
3.6 External validation
To assess real-world applicability, we applied the nomogram to an independent institutional cohort of 22 DMG patients. Patients were stratified into high- and low-risk groups using the same cutoff value. Survival curves showed a trend toward poorer outcomes in the high-risk group, although the difference did not reach statistical significance (p = 0.188) (Figure 6). Baseline clinical features of these patients are summarized in Supplementary Table 1.
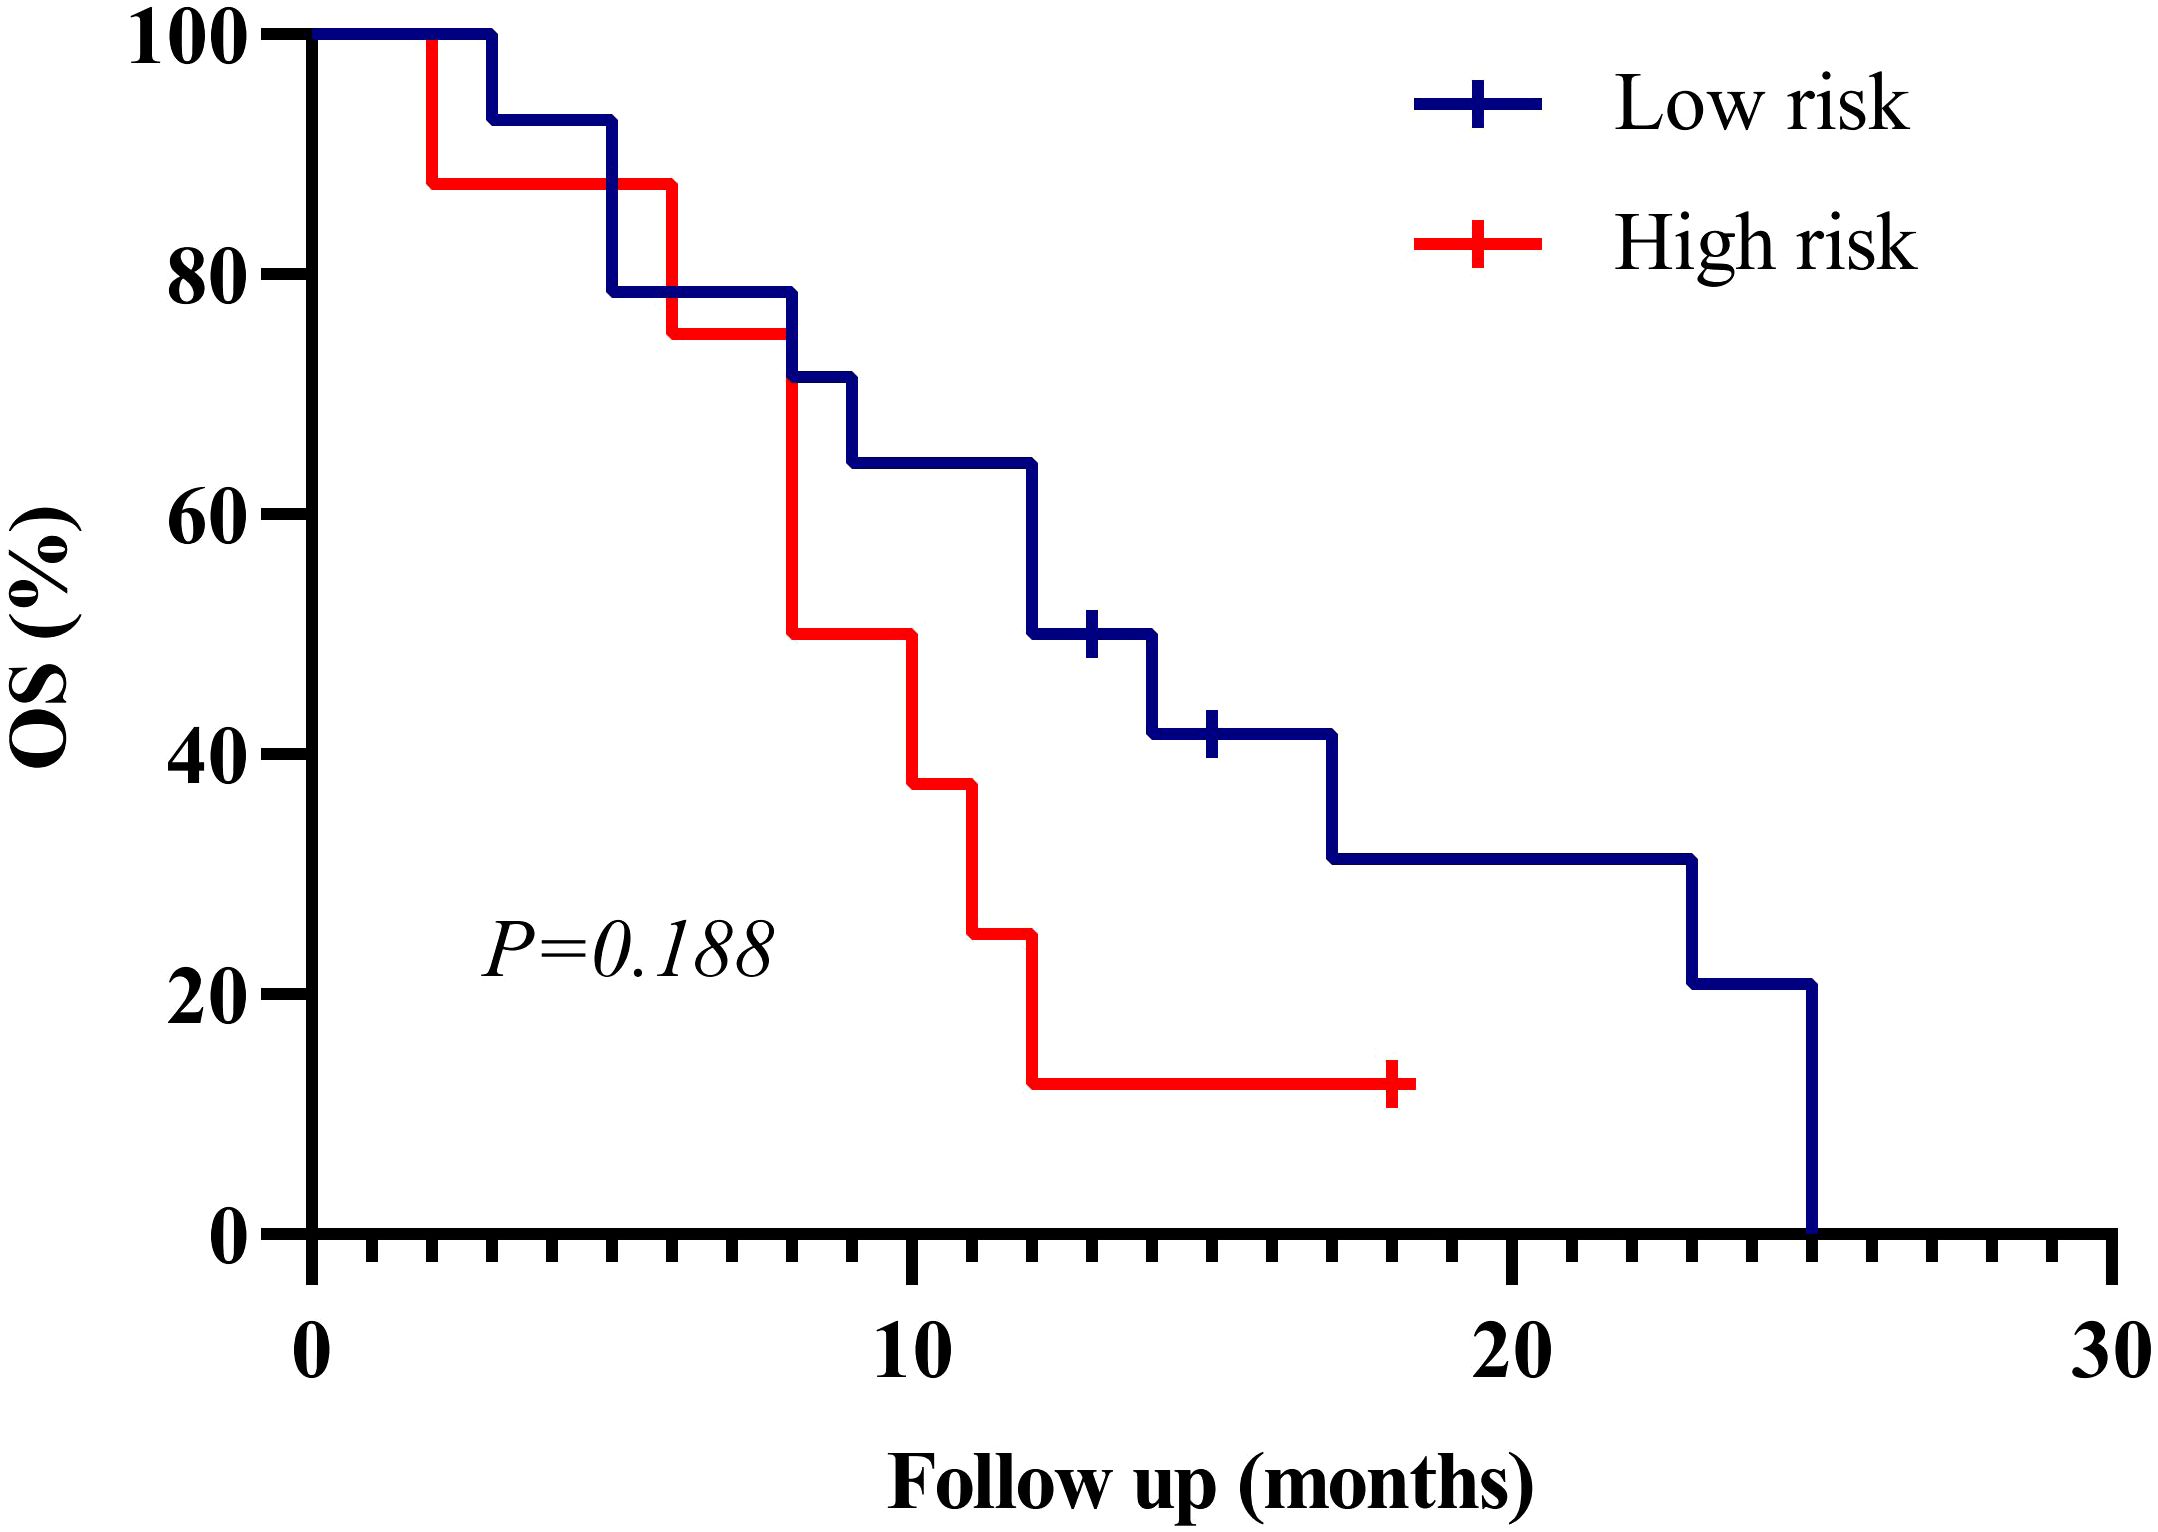
Figure 6. Kaplan–Meier survival curves for external validation cohort (n=22). Patients were stratified into high- and low-risk groups based on the SEER-derived nomogram. Although the difference in overall survival (OS) did not reach statistical significance (p = 0.188), a consistent trend toward better prognosis in the low-risk group was observed, supporting the generalizability of the model.
4 Discussion
This population-based study provides an accurate prognosis assessment of the prognosis of DMG, which will reveal important clinicopathological factors influencing survival, and emphasize age-specific patterns of tumor location and therapeutic response, which may help to improve the understanding of DMG and individualized clinical practice.
4.1 Age-location dynamics and biological implications
As in previous literature, we found a clear age-dependent tumor site distribution: pediatric DMG was primarily located in the brainstem (classic DIPG); versus adults with mainly thalamus or spinal cord involvement (17–21). Consistent with previous findings, this age-dependent survival difference, combined with the anatomical distribution of tumors, suggesting fundamental biological heterogeneity between pediatric and adult DMGs, with age probably being a key driver for the heterogeneity of the molecular behavior of tumors (17, 19, 22–25). The survival time of children with DMG was significantly different, and the prognosis of the patients with thalamic or spinal cord tumor was better than those with brainstem tumors (26). These observations support the role of developmental biology in disease behavior and advocate for location- and age-adapted treatment strategies. These findings are consistent with prior reports identifying both age and tumor location as independent prognostic factors in DMG, supporting their inclusion in our prognostic model.
4.2 Methodological rigor and clinical implications of treatment stratification
One of the main methodological advances in our study was the introduction of a refined three-tiered classification of therapy (radiation therapy alone, chemotherapy alone, or combined chemoradiotherapy) to overcome the limitations of conventional binary classifications (for example, radiation versus no radiation, chemotherapy versus no chemotherapy).Our analysis showed that chemotherapy alone did not provide a survival benefit, while the combination treatment significantly improved the outcome — thus correcting the misleading conclusion that only chemotherapy in the binary analysis improved the prognosis. This difference can be explained by the fact that the brain stem and thalamic areas are particularly intact (BBB), which limits the penetration of chemotherapy agents like temozolomide (TMZ), and eventually reduces the effectiveness of monotherapy (27–29). In addition, the methylation of the MGMT promoter is typically absent in DMG, resulting in a poor efficacy of TMZ (27, 30). On the contrary, it has been found that radiation therapy can temporarily destroy the blood-brain barrier, which may increase the delivery efficiency and therapeutic efficacy of chemotherapy drugs at the tumor site (31). Although SEER lacks molecular data, these interpretations are supported by biological plausibility and prior literature. These findings highlight the need for individualized treatment regimens based on tumor location and biological characteristics, ideally guided by future molecular-integrated datasets.
4.3 Surgical resection: limitations and anatomical considerations
Consistent with prior research, our analysis demonstrated that surgical resection extent—biopsy, partial, or subtotal—did not significantly affect OS in DMG patients (32–34). This result highlights DMG’s diffuse infiltrative nature and frequent involvement of anatomically critical midline structures, significantly limiting surgical efficacy. Although our study did not specifically analyze surgical outcomes stratified by tumor location, the predominance of brainstem lesions (where aggressive resection is rarely feasible) likely contributed to this overall negative result.
These findings support minimally invasive biopsy for molecular characterization as the preferred standard approach, given its vital role in diagnosis, prognosis, and eligibility for targeted therapy trials (13). Prospective analyses involving larger cohorts of non-brainstem DMGs may help clarify whether location-specific surgical approaches could provide selective survival benefits.
4.4 Clinical application and external validation of the prognostic model
Based on our prognostic nomogram, we propose a risk-adapted management approach to improve clinical outcomes. Patients identified as high-risk may be candidates for early enrollment in clinical trials investigating novel targeted therapies (e.g., ONC201 or GD2 CAR-T therapy), which were not captured in the SEER database but represent promising investigational options for DMG (11, 12, 35–40), while low-risk patients could benefit from standard chemoradiation as recommended by current guidelines. This stratification approach aligns with precision medicine principles, facilitating personalized clinical decisions and optimizing therapeutic strategies. Prospective validation of this strategy is crucial for further refinement of individualized treatment algorithms.
To further evaluate the generalizability of our model, we performed external validation using an independent institutional cohort (n=22). Although statistical significance was not achieved in this small dataset (p=0.081), the direction and magnitude of the risk stratification effect mirrored the SEER findings, suggesting a consistent prognostic trend across populations. Given the inherent challenges in assembling large, histologically confirmed DMG cohorts, this level of validation is rare and valuable. Nonetheless, caution should be exercised in interpreting these results due to the limited sample size, and larger multicenter prospective studies are warranted to substantiate the external validity of our model.
4.5 Limitations and future directions
This study is constrained by the inherent limitations of retrospective SEER-based analysis, including the lack of molecular and detailed treatment data. While we incorporated an external validation cohort (n=22) to enhance model credibility, statistical power remains limited. Future prospective studies should incorporate comprehensive molecular profiles (e.g., H3K27M status, MGMT methylation) and multicenter validation to refine prognostic models and strengthen clinical utility.
In addition, socioeconomic factors also emerged as a prognostic variable in our model. Although not directly related to tumor biology, previous studies in glioma and other cancers have shown that lower socioeconomic status is associated with limited access to care, reduced treatment adherence, and worse survival outcomes (41–43). This highlights the need to consider not only biological but also socioeconomic factors in DMG management, and future prospective studies should further examine these associations.
5 Conclusions
This study represents the largest SEER-based analysis of DMG to date, establishing a robust prognostic nomogram incorporating demographic, anatomical, and treatment-related factors. The model demonstrated good predictive performance and practical utility in both internal and external validation. Our findings highlight the prognostic value of age, tumor site, and combined therapy, while reaffirming the limited role of extensive resection. Future efforts should prioritize integration of molecular diagnostics and prospective validation, enabling improved risk stratification and personalized care in DMG.
Data availability statement
The original contributions presented in the study are included in the article/Supplementary Material. Further inquiries can be directed to the corresponding author.
Ethics statement
The studies involving humans were approved by Research Ethics Committee of the Second Hospital of Hebei Medical University. The studies were conducted in accordance with the local legislation and institutional requirements. Written informed consent for participation in this study was provided by the participants’ legal guardians/next of kin.
Author contributions
GZ: Funding acquisition, Software, Formal analysis, Writing – review & editing, Writing – original draft, Data curation, Methodology, Validation. HZ: Validation, Funding acquisition, Writing – review & editing, Formal analysis, Software. WH: Investigation, Writing – review & editing. LL: Investigation, Writing – review & editing. XX: Conceptualization, Project administration, Writing – review & editing, Funding acquisition.
Funding
The author(s) declare financial support was received for the research and/or publication of this article. The project was supported by the S&T Program of Hebei (Grant Number 236Z7718G) and Hebei Provincial Government funded Clinical Medicine Excellent Talents Project (Grant Number ZF2025093) and Medical Science Research Project of Hebei (Grant Number 20250054).
Conflict of interest
The authors declare that the research was conducted in the absence of any commercial or financial relationships that could be construed as a potential conflict of interest.
Generative AI statement
The author(s) declare that Generative AI was used in the creation of this manuscript. During the preparation of this manuscript, the authors used ChatGPT (OpenAI, GPT-4o) for the purposes of English language polishing and editorial refinement. The authors have reviewed and edited the output and take full responsibility for the content of this publication.
Any alternative text (alt text) provided alongside figures in this article has been generated by Frontiers with the support of artificial intelligence and reasonable efforts have been made to ensure accuracy, including review by the authors wherever possible. If you identify any issues, please contact us.
Publisher’s note
All claims expressed in this article are solely those of the authors and do not necessarily represent those of their affiliated organizations, or those of the publisher, the editors and the reviewers. Any product that may be evaluated in this article, or claim that may be made by its manufacturer, is not guaranteed or endorsed by the publisher.
Supplementary material
The Supplementary Material for this article can be found online at: https://www.frontiersin.org/articles/10.3389/fonc.2025.1644388/full#supplementary-material
References
1. von Bueren AO, Karremann M, Gielen GH, Benesch M, Fouladi M, van Vuurden DG, et al. A suggestion to introduce the diagnosis of “diffuse midline glioma of the pons, H3 K27 wildtype (WHO grade IV). Acta Neuropathol. (2018) 136:171–3. doi: 10.1007/s00401-018-1863-6
2. Louis DN, Perry A, Wesseling P, Brat DJ, Cree IA, Figarella-Branger D, et al. The 2021 WHO classification of tumors of the central nervous system: a summary. Neuro Oncol. (2021) 23:1231–51. doi: 10.1093/neuonc/noab106
3. Castel D, Philippe C, Calmon R, Le Dret L, Truffaux N, Boddaert N, et al. Histone H3F3A and HIST1H3B K27M mutations define two subgroups of diffuse intrinsic pontine gliomas with different prognosis and phenotypes. Acta Neuropathol. (2015) 130:815–27. doi: 10.1007/s00401-015-1478-0
4. Hoffman LM, Veldhuijzen van Zanten S, Colditz N, Baugh J, Chaney B, Hoffmann M, et al. Clinical, radiologic, pathologic, and molecular characteristics of long-term survivors of diffuse intrinsic pontine glioma (DIPG): A collaborative report from the international and European society for pediatric oncology DIPG registries. J Clin Oncol. (2018) 36:1963–72. doi: 10.1200/JCO.2017.75.9308
5. Al Sharie S, Abu Laban D, and Al-Hussaini M. Decoding diffuse midline gliomas: A comprehensive review of pathogenesis, diagnosis and treatment. Cancers (Basel). (2023) 15:4869. doi: 10.3390/cancers15194869
6. Jansen MH, van Vuurden DG, Vandertop WP, and Kaspers GJ. Diffuse intrinsic pontine gliomas: a systematic update on clinical trials and biology. Cancer Treat Rev. (2012) 38:27–35. doi: 10.1016/j.ctrv.2011.06.007
7. Gajjar A, Mahajan A, Bale T, Bowers DC, Canan L, Chi S, et al. Pediatric central nervous system cancers, version 2.2025, NCCN clinical practice guidelines in oncology. J Natl Compr Canc Netw. (2025) 23:113–30. doi: 10.6004/jnccn.2025.0012
8. Weller M, van den Bent M, Preusser M, Le Rhun E, Tonn JC, Minniti G, et al. EANO guidelines on the diagnosis and treatment of diffuse gliomas of adulthood. Nat Rev Clin Oncol. (2021) 18:170–86. doi: 10.1038/s41571-020-00447-z
9. Mohile NA, Messersmith H, Gatson NT, Hottinger AF, Lassman A, Morton J, et al. Therapy for diffuse astrocytic and oligodendroglial tumors in adults: ASCO-SNO guideline. J Clin Oncol. (2022) 40:403–26. doi: 10.1200/JCO.21.02036
10. Rechberger JS, Power EA, and Daniels DJ. Convection-enhanced delivery for H3K27M diffuse midline glioma: how can we efficaciously modulate the blood-brain barrier. Ther Deliv. (2021) 12:419–22. doi: 10.4155/tde-2021-0026
11. Arrillaga-Romany I, Gardner SL, Odia Y, Aguilera D, Allen JE, Batchelor T, et al. ONC201 (Dordaviprone) in recurrent H3 K27M-mutant diffuse midline glioma. J Clin Oncol. (2024) 42:1542–52. doi: 10.1200/JCO.23.01134
12. Arrillaga-Romany I and Miller JJ. Demonstrated efficacy and mechanisms of sensitivity of ONC201: H3K27M-mutant diffuse midline glioma in the spotlight. Neuro Oncol. (2024) 26:991–2. doi: 10.1093/neuonc/noae051
13. Di Carlo D, Annereau M, Vignes M, Denis L, Epaillard N, Dumont S, et al. Real life data of ONC201 (dordaviprone) in pediatric and adult H3K27-altered recurrent diffuse midline glioma: Results of an international academia-driven compassionate use program. Eur J Cancer. (2025) 216:115165. doi: 10.1016/j.ejca.2024.115165
14. Che WQ, Li YJ, Tsang CK, Wang YJ, Chen Z, Wang XY, et al. How to use the Surveillance, Epidemiology, and End Results (SEER) data: research design and methodology. Mil Med Res. (2023) 10:50. doi: 10.1186/s40779-023-00488-2
15. Adhikari S, Bhutada AS, Ladner L, Cuoco JA, Entwistle JJ, Marvin EA, et al. Prognostic indicators for H3K27M-mutant diffuse midline glioma: A population-based retrospective surveillance, epidemiology, and end results database analysis. World Neurosurg. (2023) 178:e113–113e121. doi: 10.1016/j.wneu.2023.07.001
16. Peng Y, Ren Y, Huang B, Tang J, Jv Y, Mao Q, et al. A validated prognostic nomogram for patients with H3 K27M-mutant diffuse midline glioma. Sci Rep. (2023) 13:9970. doi: 10.1038/s41598-023-37078-0
17. Jiang H, Yang K, Ren X, Cui Y, Li M, Lei Y, et al. Diffuse midline glioma with H3 K27M mutation: a comparison integrating the clinical, radiological, and molecular features between adult and pediatric patients. Neuro Oncol. (2020) 22:e1–1e9. doi: 10.1093/neuonc/noz152
18. Kim Y, Kudo T, Tamura K, Sumita K, Kobayashi D, Tanaka Y, et al. Clinical findings of thalamic and brainstem glioma including diffuse midline glioma, H3K27M mutant:A clinical study. No Shinkei Geka. (2021) 49:901–8. doi: 10.11477/mf.1436204469
19. Duan ZJ, Feng J, Yao K, Hu ZJ, Ma Z, Xiang L, et al. Clinicopathological characteristics of H3K27-altered diffuse midline glioma and evaluation of NTRK as its therapeutic target. Zhonghua Bing Li Xue Za Zhi. (2022) 51:1115–22. doi: 10.3760/cma.j.cn112151-20220507-00378
20. Li J, Ma YY, Feng J, Zhao D, Ding F, Tian L, et al. Diffuse midline gliomas with H3K27 alteration in children: a clinicopathological analysis of forty-one cases. Zhonghua Bing Li Xue Za Zhi. (2022) 51:319–25. doi: 10.3760/cma.j.cn112151-20210830-00625
21. Broggi G, Salzano S, Failla M, Barbagallo G, Certo F, Zanelli M, et al. Clinico-pathological features of diffuse midline glioma, H3 K27-altered in adults: A comprehensive review of the literature with an additional single-institution case series. Diagnostics (Basel). (2024) 14(23). doi: 10.3390/diagnostics14232617
22. Liu I, Jiang L, Samuelsson ER, Marco Salas S, Beck A, Hack OA, et al. The landscape of tumor cell states and spatial organization in H3-K27M mutant diffuse midline glioma across age and location. Nat Genet. (2022) 54:1881–94. doi: 10.1038/s41588-022-01236-3
23. Gong X, Kuang S, Deng D, Wu J, Zhang L, and Liu C. Differences in survival prognosticators between children and adults with H3K27M-mutant diffuse midline glioma. CNS Neurosci Ther. (2023) 29:3863–75. doi: 10.1111/cns.14307
24. Jiang J, Li WB, and Xiao SW. Prognostic factors analysis of diffuse midline glioma. J Neurooncol. (2024) 167:285–92. doi: 10.1007/s11060-024-04605-6
25. Sim Y, McClelland AC, Choi K, Han K, Park YW, Ahn SS, et al. A comprehensive multicenter analysis of clinical, molecular, and imaging characteristics and outcomes of H3 K27-altered diffuse midline glioma in adults. J Neurosurg. (2025) 142(5):1307–18. doi: 10.3171/2024.8.JNS241180
26. Vuong HG, Le HT, Jea A, McNall-Knapp R, and Dunn IF. Risk stratification of H3 K27M-mutant diffuse midline gliomas based on anatomical locations: an integrated systematic review of individual participant data. J Neurosurg Pediatr. (2022) 30:99–106. doi: 10.3171/2022.3.PEDS2250
27. Abe H, Natsumeda M, Kanemaru Y, Watanabe J, Tsukamoto Y, Okada M, et al. MGMT expression contributes to temozolomide resistance in H3K27M-mutant diffuse midline gliomas and MGMT silencing to temozolomide sensitivity in IDH-mutant gliomas. Neurol Med Chir (Tokyo). (2018) 58:290–5. doi: 10.2176/nmc.ra.2018-0044
28. Warren KE. Beyond the blood: brain barrier: the importance of central nervous system (CNS) pharmacokinetics for the treatment of CNS tumors, including diffuse intrinsic pontine glioma. Front Oncol. (2018) 8:239. doi: 10.3389/fonc.2018.00239
29. Pachocki CJ and Hol EM. Current perspectives on diffuse midline glioma and a different role for the immune microenvironment compared to glioblastoma. J Neuroinflammation. (2022) 19:276. doi: 10.1186/s12974-022-02630-8
30. Banan R, Christians A, Bartels S, Lehmann U, and Hartmann C. Absence of MGMT promoter methylation in diffuse midline glioma, H3 K27M-mutant. Acta Neuropathol Commun. (2017) 5:98. doi: 10.1186/s40478-017-0500-2
31. Hart E, Odé Z, Derieppe M, Groenink L, Heymans MW, Otten R, et al. Blood-brain barrier permeability following conventional photon radiotherapy - A systematic review and meta-analysis of clinical and preclinical studies. Clin Transl Radiat Oncol. (2022) 35:44–55. doi: 10.1016/j.ctro.2022.04.013
32. Karremann M, Gielen GH, Hoffmann M, Wiese M, Colditz N, Warmuth-Metz M, et al. Diffuse high-grade gliomas with H3 K27M mutations carry a dismal prognosis independent of tumor location. Neuro Oncol. (2018) 20:123–31. doi: 10.1093/neuonc/nox149
33. Bin-Alamer O, Jimenez AE, Azad TD, Bettegowda C, and Mukherjee D. H3K27M-altered diffuse midline gliomas among adult patients: A systematic review of clinical features and survival analysis. World Neurosurg. (2022) 165:e251–251e264. doi: 10.1016/j.wneu.2022.06.020
34. Jang SW, Song SW, Kim YH, Cho YH, Hong SH, Kim JH, et al. Clinical features and prognosis of diffuse midline glioma: A series of 24 cases. Brain Tumor Res Treat. (2022) 10:255–64. doi: 10.14791/btrt.2022.0035
35. Jones C, Karajannis MA, Jones D, Kieran MW, Monje M, Baker SJ, et al. Pediatric high-grade glioma: biologically and clinically in need of new thinking. Neuro Oncol. (2017) 19:153–61. doi: 10.1093/neuonc/now101
36. Park C, Kim TM, Bae JM, Yun H, Kim JW, Choi SH, et al. Clinical and genomic characteristics of adult diffuse midline glioma. Cancer Res Treat. (2021) 53:389–98. doi: 10.4143/crt.2020.694
37. Neth BJ, Balakrishnan SN, Carabenciov ID, Uhm JH, Daniels DJ, Kizilbash SH, et al. Panobinostat in adults with H3 K27M-mutant diffuse midline glioma: a single-center experience. J Neurooncol. (2022) 157:91–100. doi: 10.1007/s11060-022-03950-8
38. Zhang L, Nesvick CL, Day CA, Choi J, Lu VM, Peterson T, et al. STAT3 is a biologically relevant therapeutic target in H3K27M-mutant diffuse midline glioma. Neuro Oncol. (2022) 24:1700–11. doi: 10.1093/neuonc/noac093
39. Jackson ER, Duchatel RJ, Staudt DE, Persson ML, Mannan A, Yadavilli S, et al. ONC201 in combination with paxalisib for the treatment of H3K27-altered diffuse midline glioma. Cancer Res. (2023) 83(14):2421–37. doi: 10.1158/0008-5472.CAN-23-0186
40. Hotchkiss KM, Cho EJ, and Khasraw M. A first-in-human peptide vaccine targeting H3K27M; encouraging early findings in 8 adults with diffuse midline glioma. Neuro Oncol. (2024) 26:5–6. doi: 10.1093/neuonc/noad203
41. Lee JH, Holste KG, Bah MG, Franson AT, Garton H, Maher CO, et al. Influence of socioeconomic status on clinical outcomes of diffuse midline glioma and diffuse intrinsic pontine glioma. J Neurosurg Pediatr. (2024) 33:507–15. doi: 10.3171/2023.10.PEDS23118
42. Demetz M, Krigers A, Klingenschmid J, Thomé C, Freyschlag CF, and Kerschbaumer J. Socioeconomic influences on survival outcome in idh-wildtype glioma patients: examining the role of age, education, and lifestyle factors. Acta Neurochir (Wien). (2025) 167:178. doi: 10.1007/s00701-025-06594-5
Keywords: diffuse midline glioma, prognostic nomogram, survival analysis, radiotherapy, chemotherapy
Citation: Zhang G, Zhou H, Han W, Lou L and Xue X (2025) Prognostic modeling for diffuse midline glioma: development and validation of a risk stratification nomogram using SEER and institutional cohorts. Front. Oncol. 15:1644388. doi: 10.3389/fonc.2025.1644388
Received: 10 June 2025; Accepted: 14 October 2025;
Published: 27 October 2025.
Edited by:
Nail Bulakbasi, University of Kyrenia, CyprusCopyright © 2025 Zhang, Zhou, Han, Lou and Xue. This is an open-access article distributed under the terms of the Creative Commons Attribution License (CC BY). The use, distribution or reproduction in other forums is permitted, provided the original author(s) and the copyright owner(s) are credited and that the original publication in this journal is cited, in accordance with accepted academic practice. No use, distribution or reproduction is permitted which does not comply with these terms.
*Correspondence: Xiaoying Xue, eHh5MDYzNkBoZWJtdS5lZHUuY24=