 Yonglong Li1†
 Jun Zhou
 Chunrong Wu
 Ruipeng Liang
- 1Department of Radiology, Chongqing University Jiangjin Hospital, Jiangjin, Chongqing, China
- 2Department of Emergency Medicine, Chongqing University Jiangjin Hospital, Jiangjin, Chongqing, China
- 3Department of Pathology, Chongqing University Jiangjin Hospital, Jiangjin, Chongqing, China
- 4Department of Oncology, Chongqing University Jiangjin Hospital, Jiangjin, Chongqing, China
Background: The heterogeneity of the lung cancer brain metastasis (LCBM) microenvironment limits therapeutic efficacy, while invasive pathological biopsies fail to dynamically assess brain metastasis (BM) comprehensively. Non-invasive imaging techniques thus hold clinical value for visualizing the LCBM microenvironment. This study aimed to achieve non-invasive quantitative analysis of vascular function and cellular structures in LCBM using multiparametric Dynamic Contrast-Enhanced Magnetic Resonance Imaging (DCE-MRI) and Diffusion-Weighted Imaging (DWI).
Methods: A prospective cohort of 114 LCBM patients (63 lung adenocarcinoma [LUAD]-BM, 28 lung squamous cell carcinoma [LUSC]-BM, 23 small cell lung cancer [SCLC]-BM) underwent DCE-MRI and DWI on a 3.0T MRI scanner. Parameters including volume transfer constant (Ktrans), rate constant (Kep), extravascular extracellular volume (Ve), and plasma volume fraction (Vp) were derived using the Extended Tofts model. Group differences were analyzed via Mann-Whitney U test, diagnostic efficacy via ROC curves, and parameter interactions via multivariate logistic and linear regression.
Results: ADC distinguished SCLC-BM from NSCLC-BM with AUC=0.891 (specificity=95.05% at 752.4×10⁻⁶mm²/s), while Ktrans differentiated LUAD-BM from LUSC-BM with AUC=0.998 (sensitivity=98.48%, specificity=97.79% at 157 min−1/1000). Microenvironmental profiles: LUAD-BM showed high Vp (51.50/1000) and Ktrans (424.8 min−1/1000); LUSC-BM had low Ktrans (61.15 min−1/1000) and medium ADC (1163×10−6mm²/s); SCLC-BM exhibited high cellular density (ADC=661×10−6mm²/s) and abnormal contrast kinetics (high Kep, low Vp). Vp and ADC were identified as independent predictors for LUAD-BM and SCLC-BM, respectively. Parameter interactions varied by subtype: ADC in LUAD-BM correlated with Kep and Delay Time; in LUSC-BM, with Ktrans and Ve; and in SCLC-BM, showed weaker vascular associations. Ktrans regulation involved distinct parameter contributions across subtypes.
Conclusion: A DCE-MRI-DWI “Vascular-Cellular Microenvironment Visualization Model” was established, revealing distinct profiles: high microvascular density/permeability in LUAD-BM, low permeability/medium cellularity in LUSC-BM, and high cellularity/abnormal contrast kinetics in SCLC-BM. This validates multimodal imaging for characterizing LCBM heterogeneity and provides insights into tumor angiogenesis, cellular density, and BBB regulation, supporting microenvironment-targeted therapy.
Introduction
Lung Cancer Brain Metastasis (LCBM) is a central clinical challenge leading to shortened patient survival and diminished quality of life (1, 2). Although targeted therapy and immunotherapy have significantly prolonged the overall survival of lung cancer patients (3), the dynamic evolution of the Brain Metastasis (BM) microenvironment—including disruption of the blood-brain barrier (BBB) (4), tumor vascularization patterns (5), and heterogeneity in extracellular matrix remodeling (6)—remains a critical factor limiting therapeutic efficacy. Traditional pathological biopsies face challenges in dynamically assessing the comprehensive microenvironment of BM due to the high risks associated with cranial surgery, significant sampling bias (which captures only local lesion characteristics), and the time lag in postoperative pathological analysis. Consequently, the development of noninvasive, reproducible imaging biomarkers to holistically characterize the vascular-cellular microenvironment of LCBM has become a pivotal research direction in the era of precision medicine.
The microenvironment heterogeneity of LCBM serves as the core biological basis for its aggressiveness and therapy resistance. This heterogeneity encompasses multidimensional interactions, including vascularization patterns (e.g., microvascular density and permeability), cellular structural characteristics (e.g., cellular density and extracellular space), and the functional status of the BBB/Blood-Tumor Barrier (BTB) (e.g., tight junction protein expression and efflux pump activity). Traditional pathological biopsy, due to its invasiveness and sampling limitations, fails to meet the dynamic assessment requirements for microenvironment heterogeneity in BM.In recent years, Magnetic Resonance Imaging (MRI) has emerged as a crucial tool in LCBM diagnosis and treatment owing to its multimodal functional imaging capabilities (7–10). Among these techniques, Diffusion-Weighted Imaging (DWI) quantifies the restricted diffusion of water molecules within tissues via the Apparent Diffusion Coefficient (ADC), offering an intuitive reflection of tumor cellular density and the physical properties of the extracellular matrix (11, 12). Conversely, Dynamic Contrast-Enhanced Magnetic Resonance Imaging (DCE-MRI) noninvasively characterizes multidimensional micro-pathophysiological information—such as tumor perfusion, vascular permeability, and microvascular content—by quantifying parameters including the Volume Transfer Constant (Ktrans), Rate Constant (Kep), Extravascular Extracellular Volume (Ve), and Plasma Volume (Vp) (3, 13, 14).Theoretically, these two modalities possess complementary analytical potential, providing tumor microenvironment insights from the dual dimensions of “cellular structure” and “vascular function.” However, current research utilizing imaging techniques to evaluate LCBM microenvironment heterogeneity faces significant limitations. One major drawback is that conventional imaging analysis relies on single-parameter thresholds, which inadequately capture the heterogeneous distribution of the tumor microenvironment (15, 16). Another issue is that most DCE-MRI studies focus on primary lung cancer (12), and conclusions drawn from body-based analyses cannot be directly extrapolated to the brain due to its unique physiological structure (e.g., blood supply patterns) (8).
To address the aforementioned issues, this study proposes a multiparameter fusion method based on the combination of DCE-MRI and DWI. By quantifying parameters such as Ktrans, Vp, and ADC, we constructed a visual model of the vascular-cellular microenvironment in LCBM. Specifically, this research aims to elucidate the characteristic profiles of DCE-MRI/DWI parameters across different histopathological subtypes of LCBM and reveal the features of the vascular-cellular microenvironment in LCBM. The innovation of this study lies in the first integration of vascular functional parameters from DCE-MRI with structural parameters from DWI to establish a visual model of the vascular-cellular microenvironment in LCBM. This model provides an imaging basis for the precise subtyping of LCBM and the selection of anti-angiogenic therapy targets, thereby offering a novel tool for the pathophysiological assessment of LCBM and laying an imaging foundation for individualized treatment strategies targeting LCBM pathophysiology.
Methods
Patients
This study was approved by the Hospital Ethics Review Committee (Approval No. KY2023073). All participants were fully informed of the research objectives and provided written informed consent. The research process adhered to the ethical principles outlined in the Declaration of Helsinki. A total of 114 patients with LCBM who underwent MRI examinations were prospectively enrolled from August 2022 to June 2025. Based on the pathological type of the primary lung cancer, the patients were divided into three groups: the lung adenocarcinoma (LUAD) group (n=63, 93 brain metastases [BM]), the lung squamous cell carcinoma (LUSC) group (n=28, 44 BM), and the small cell lung cancer (SCLC) group (n=23, 38 BM).Inclusion Criteria:① Primary pathological type of lung cancer confirmed by needle biopsy or surgical pathology;② Complete clinical and MRI data.Exclusion Criteria:① Undergoing radiotherapy, chemotherapy, or anti-angiogenic therapy;② BM located in the meninges, brainstem, or cerebellum;③ Maximum diameter of BM less than 0.5 cm;④ History of cranial surgery;⑤ Concurrent central nervous system diseases.
Examination method
The examinations were performed using a United Imaging 3.0T MRI scanner (UMR780).Conventional sequence scanning, including DWI, was conducted first, followed by DCE-MRI sequence scanning. The DCE-MRI protocol comprised a multi flip-angle scanning sequence with five flip angles and subsequent multi-phase dynamic enhancement sequences.The multi flip-angle scanning sequence included five single-phase flip-angle scans with flip angles of 3°, 6°, 9°, 12°, and 15°, respectively. The matrix size was 112 × 100, the field of view (FOV) was 230 mm × 200 mm, the repetition time (TR)/echo time (TE) was 4.11 ms/1.84 ms, and the number of excitations (NEX) was 1. A total of 20 slices were acquired, with a slice thickness of 6 mm and a slice gap of 0 mm. The slice direction offset was set to 2.For the multi-phase dynamic enhancement sequence, the flip angle was set to 10°, TR/TE to 2.51 ms/0.92 ms, and the temporal resolution to 3 s. Other parameters, including the number of slices, slice thickness, slice gap, slice direction offset, matrix size, and FOV, were consistent with those of the single-phase flip-angle scanning sequence. A total of 90 phases were scanned, yielding 3,600 images. The total scan time for dynamic perfusion was 253 s. The contrast agent (Gadobutrol) was administered intravenously via the antecubital vein using a high-pressure injector at a rate of 3 mL/s at the end of phase 5 and the beginning of phase 6 of the dynamic enhancement sequence. Immediately after contrast agent injection, 20 mL of 0.9% saline solution was infused at the same rate.
Image analysis
This study employed the Extended Tofts two-compartment model for post-processing DCE-MRI data. First, motion correction was performed to eliminate respiratory motion artifacts. The middle cerebral artery was selected as the arterial input function, and the superior sagittal sinus as the venous output function to derive time-signal intensity curves. On the maximum cross-section of lesions in enhanced T1-weighted imaging (T1WI) sequences, regions of interest (ROIs) were manually delineated. For ring-enhancing or large-volume lesions, a multi-region ROI delineation strategy (3–5 ROIs per lesion) was adopted to adequately reflect the heterogeneity of brain metastases (BM), strictly avoiding necrotic, cystic, and hemorrhagic areas.
Two radiologists independently delineated tumor ROIs (excluding necrotic, cystic, and hemorrhagic regions). Inter-observer agreement was evaluated using a two-way mixed-effects model. After validation, the intraclass correlation coefficient (ICC) for all parameters was ≥0.8. Data from the senior radiologist were ultimately used for analysis (ROI counts: 136 for the LUAD group, 66 for the LUSC group, and 62 for the SCLC group).
Statistical analysis
This study employed SPSS 22.0 for data processing and regression analysis, and GraphPad Prism 9 for graph generation and receiver operating characteristic (ROC) curve analysis. Quantitative data were first subjected to normality testing using the Kolmogorov-Smirnov test. Normally distributed data were expressed as mean ± standard deviation (SD), and pairwise comparisons were performed using the LSD-t test. Non-normally distributed data were presented as median (interquartile range) [M (P25, P75)], and pairwise comparisons were conducted using the Mann-Whitney U test.The diagnostic efficacy of each parameter was evaluated using ROC curves, with the area under the curve (AUC), optimal Youden index, sensitivity, and specificity calculated (AUC ≥ 0.7 indicating good performance; AUC ≥ 0.8 indicating excellent performance). A multivariate binary logistic regression model was constructed with pathological type as the dependent variable and ADC values and DCE-MRI parameters as independent variables. After adjusting for confounding factors, the independent predictive value of each parameter for histopathological subtypes was assessed (results expressed as β, odds ratio [OR], and 95% confidence interval [CI]). Additionally, multiple linear regression models were built with ADC values and Ktrans as dependent variables to analyze parameter interaction mechanisms. All statistical tests were two-sided, and a p-value < 0.05 was considered statistically significant.
Results
Differences in ADC values and DCE-MRI parameters among different pathological types of LCBM
Significant heterogeneity in ADC values and DCE-MRI parameters was observed across three pathological types of LCBM, as detailed in Table 1, with pathophysiological differences corroborated by pathological examination (Figure 1). The ADC value for lung adenocarcinoma brain metastases (LUAD-BM) was 1168 (838–1358) ×10-6 mm²/s, while for lung squamous cell carcinoma brain metastases (LUSC-BM) it was 1163 (885.4–1484) ×10-6 mm²/s, showing no significant difference between them (p=0.431). However, both values were significantly higher than that of small cell lung cancer brain metastases (SCLC-BM) at 661 (509.4–807.2) ×10-6 mm²/s (p<0.0001), indicating higher cellular density in SCLC-BM. Among DCE-MRI parameters, Ktrans was highest in LUAD-BM [424.8 (271.5–525.2) min-¹/1000], significantly exceeding SCLC-BM [124.7 (64.58–154.4) min-¹/1000] and LUSC-BM [61.15 (44.98–102) min-¹/1000] (all p<0.0001). Kep followed a similar trend: LUAD-BM [1250 (843–1695) min-¹/1000] > SCLC-BM [671.1 (520.8–861.3) min-¹/1000] > LUSC-BM [456.3 (368.1–571.3) min-¹/1000] (all p<0.0001). Ve in LUAD-BM [294.3 (215.7–478.7)/1000] was significantly greater than in both LUSC-BM [144.1 (96.63–215.5)/1000] and SCLC-BM [160.9 (90.2–228.6)/1000] (all p<0.0001), though no difference existed between LUSC-BM and SCLC-BM (p=0.71). Vp decreased progressively: LUAD-BM [51.50 (42.1–70.5)/1000] > SCLC-BM [35.45 (25.05–46.93)/1000] > LUSC-BM [15.55 (12.18–24.35)/1000] (all p<0.0001). Enhancement-related parameters—including initial area under the curve at 90 seconds (iAUC90), contrast enhancement ratio (CER), and maximum slope of enhancement (Max. Slope)—were significantly elevated in LUAD-BM compared to both other groups (all p<0.0001), while no significant differences emerged between LUSC-BM and SCLC-BM for these metrics. Time to peak enhancement (Delay) also varied significantly (all p<0.05), with LUSC-BM [5.9 (4.75–6.8) s] > LUAD-BM [4.9 (4.2–6.1) s] > SCLC-BM [4.45 (3.5–5.4) s].
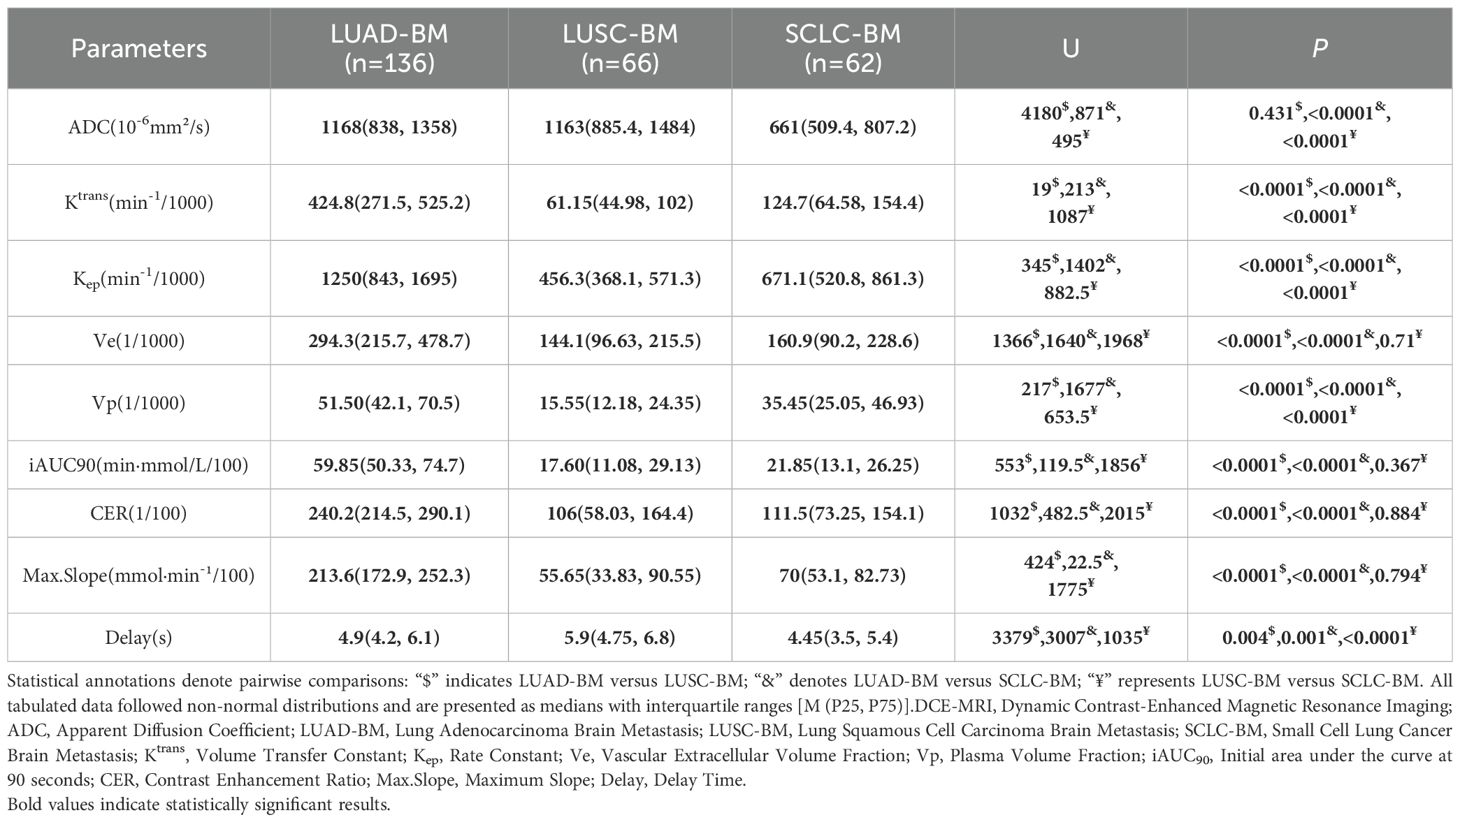
Table 1. Compares ADC values and DCE-MRI parameters across distinct pathological subtypes of LCBM.
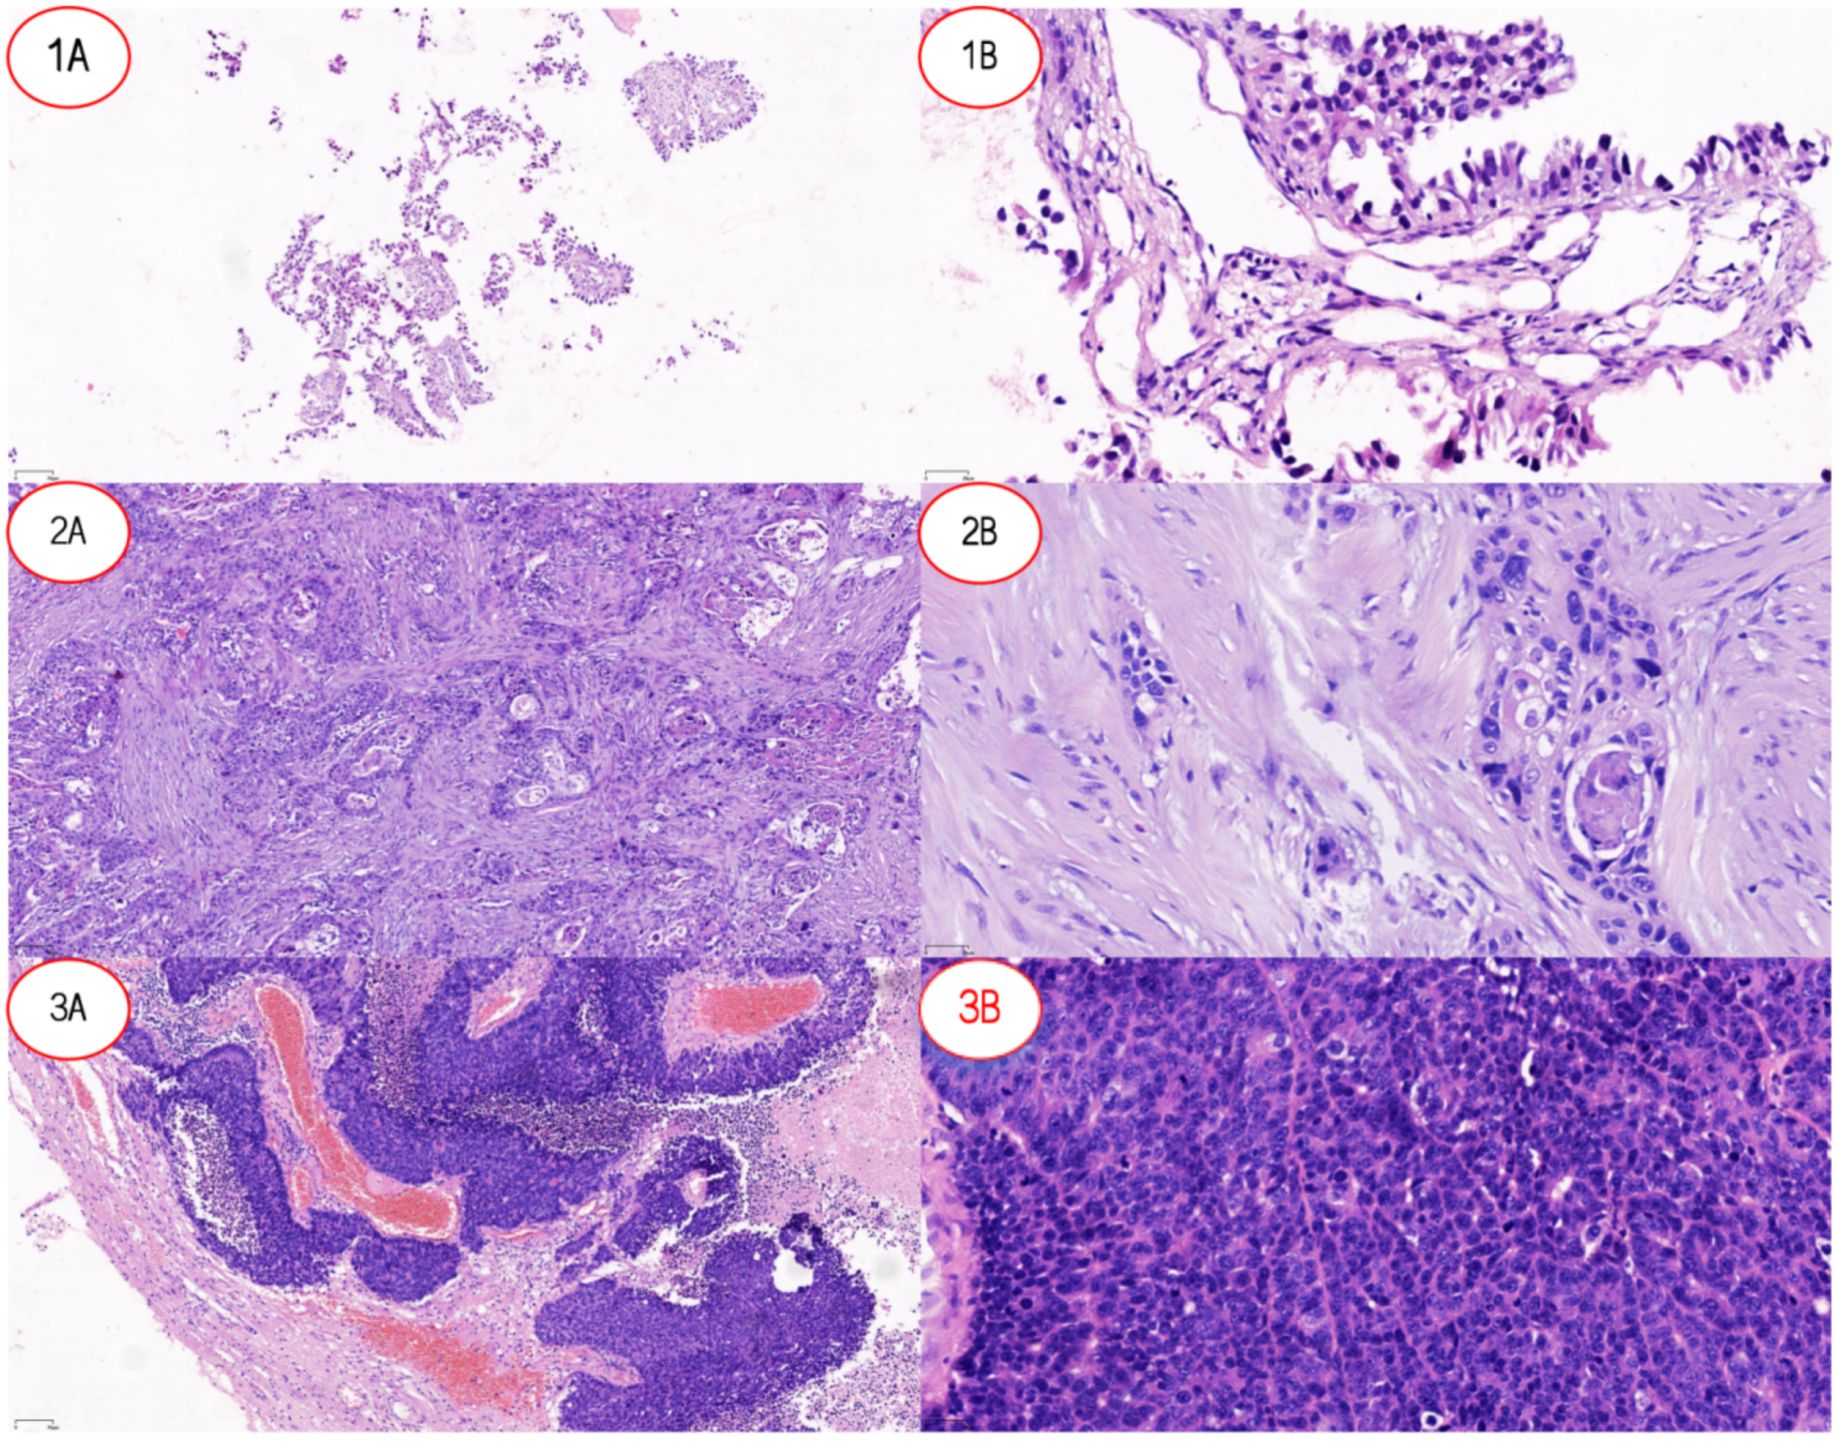
Figure 1. Pathological features of lung cancer and lung cancer brain metastases. (1A) Low-power view (×10) of LUAD-BM showing tumor tissue arranged in an acinar pattern with loose distribution. (1B) High-power view (×20) of LUAD-BM demonstrating columnar tumor cells forming glandular structures, consistent with adenocarcinoma differentiation. (2A) Low-power view (×10) of LUSC revealing nested tumor growth with well-defined stromal boundaries. (2B) High-power view (×20) of LUSC highlighting polygonal tumor cells with focal keratinization, characteristic of squamous cell carcinoma morphology. (3A) Low-power view (×10) of SCLC-BM displaying densely infiltrating tumor cells with stromal hemorrhage. (3B) High-power view (×20) of SCLC-BM showing small tumor cells with hyperchromatic nuclei (high nuclear-to-cytoplasmic ratio) diffusely distributed, typical of small cell carcinoma. Abbreviations: LUAD-BM, lung adenocarcinoma brain metastasis; LUSC, lung squamous cell carcinoma; SCLC-BM, small cell lung cancer brain metastasis.
Diagnostic value of DCE-MRI and DWI parameters in differentiating pathological subtypes of LCBM
For two critical pathological differentiation tasks in LCBM—distinguishing SCLC from non-small cell lung cancer (NSCLC), and LUAD from LUSC—this study systematically evaluated the diagnostic efficacy of DCE-MRI parameters and ADC values. The results, summarized in Tables 2 and 3 and illustrated in Figure 2, are as follows:
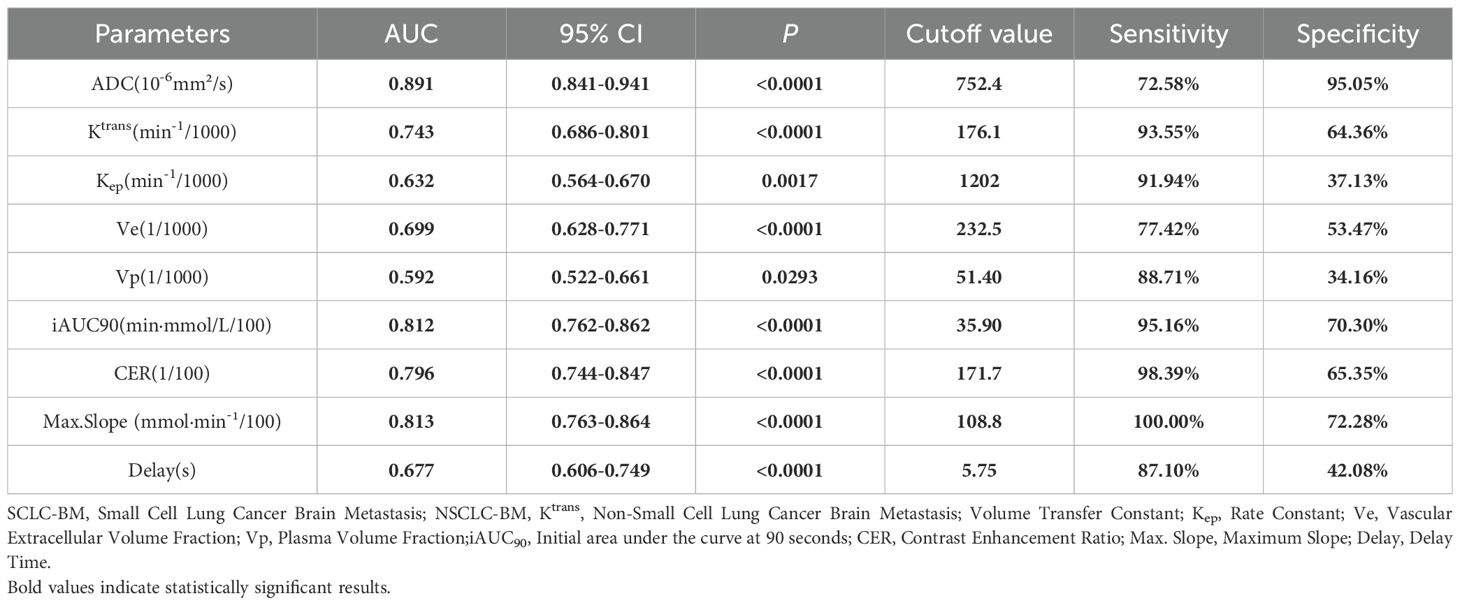
Table 2. Histopathological differential diagnosis of SCLC-BM and NSCLC-BM.
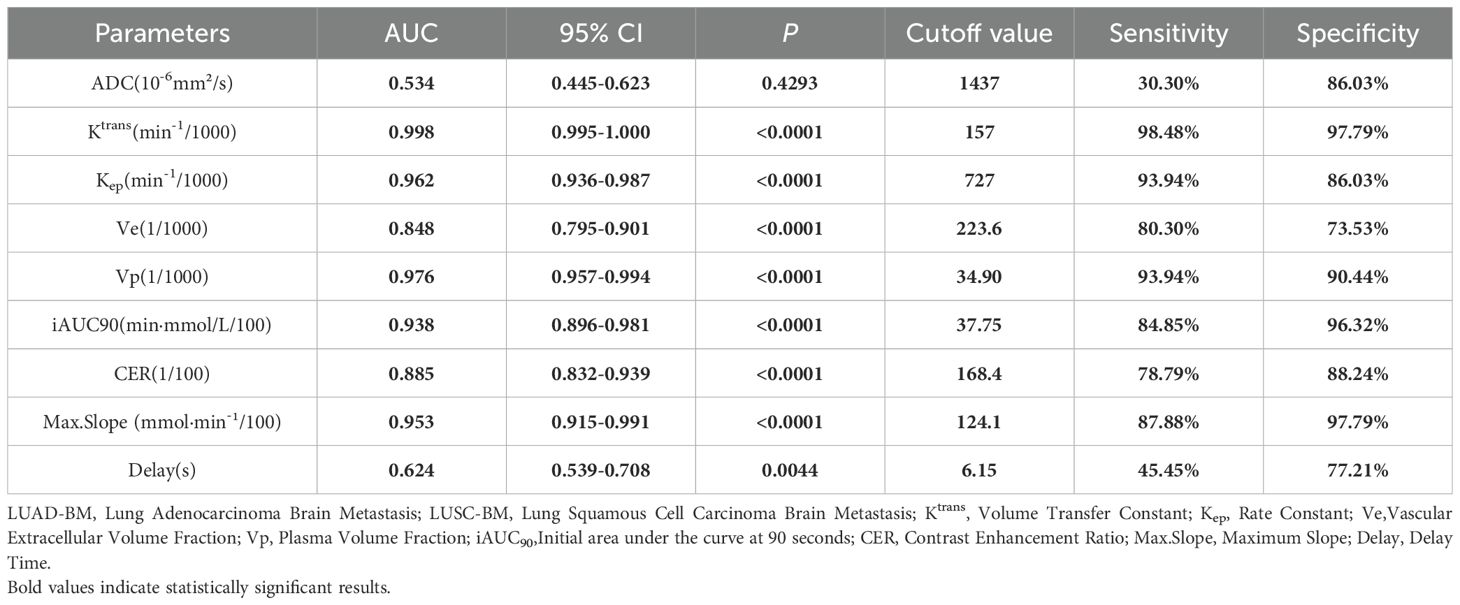
Table 3. Histopathological differential diagnosis of LUAD-BM and LUSC-BM.
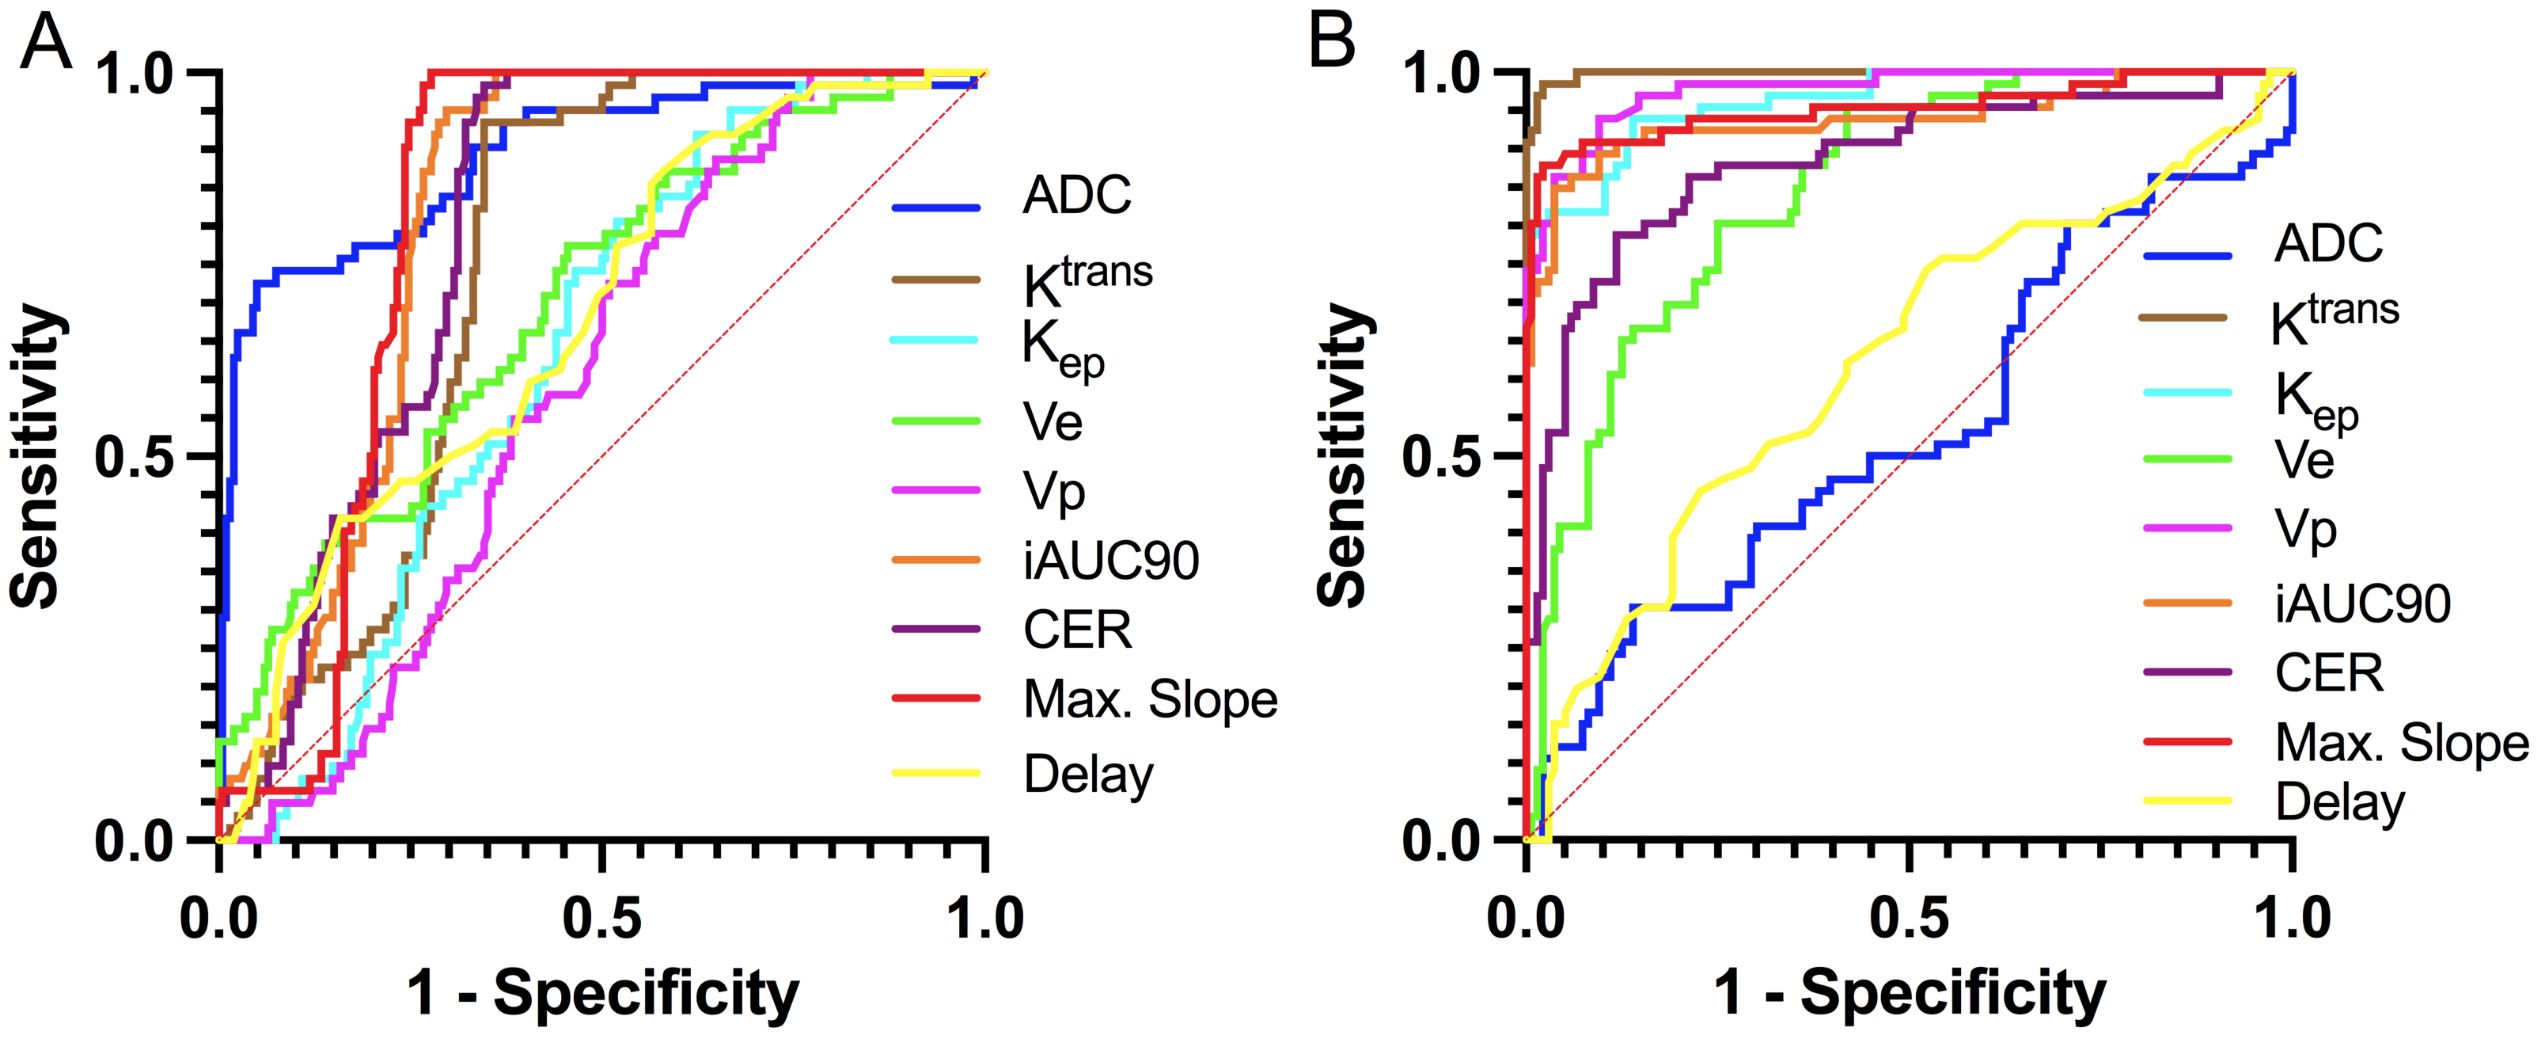
Figure 2. ROC curves for discriminating histopathological subtypes of LCBM based on DCE-MRI and DWI parameters. (A) SCLC vs. NSCLC; (B) CLC-BM vs. NSCLC-BM.
In differentiating SCLC-BM from NSCLC-BM, the ADC value demonstrated the highest efficacy (AUC = 0.891, p<0.0001). Using a cutoff value of 752.4 × 10⁻⁶ mm²/s, the sensitivity was 72.58% and specificity was 95.05%. A low ADC value (≤752.4 × 10⁻⁶ mm²/s) strongly indicated SCLC-BM. Among DCE-MRI parameters, Max. Slope exhibited good diagnostic capability (AUC = 0.813, p<0.0001), with 100% sensitivity and 72.28% specificity at a cutoff of 108.8 mmol·min-¹/100. iAUC90 also showed high diagnostic performance (AUC = 0.812), with 95.16% sensitivity and 70.30% specificity at a cutoff of 35.90 min·mmol/L/100. Both parameters achieved high sensitivity and specificity. CER and Ktrans showed moderate diagnostic efficacy (AUC = 0.796 and 0.743, respectively). For CER, a cutoff of 171.7/100 yielded 98.39% sensitivity and 65.35% specificity. For Ktrans, a cutoff of 176.1 min-¹/1000 resulted in 93.55% sensitivity and 64.36% specificity. Ve and Kep demonstrated limited diagnostic utility (AUC = 0.699 and 0.632, respectively), with Kep showing high sensitivity (91.94%) but low specificity (37.13%).
In differentiating LUAD-BM from LUSC-BM, DCE-MRI parameters exhibited superior reliability. The Ktrans parameter achieved near-perfect diagnostic performance (AUC = 0.998, p<0.0001), with 98.48% sensitivity and 97.79% specificity at a cutoff of 157 min-¹/1000, establishing it as the core diagnostic indicator. Vp and Max. Slope also demonstrated excellent efficacy (AUC = 0.976 and 0.953, respectively). For Vp, a cutoff of 34.90/1000 resulted in 93.94% sensitivity and 90.44% specificity. For Max. Slope, a cutoff of 124.1 mmol·min-¹/100 yielded 87.88% sensitivity and 97.79% specificity. Kep and iAUC90 also performed notably well (AUC = 0.962 and 0.938, respectively). At cutoffs of 727 min-¹/1000 and 37.75 min·mmol/L/100, they achieved sensitivities of 93.94% and 84.85%, and specificities of 86.03% and 96.32%. Ve and CER parameters showed moderate efficacy (AUC = 0.848 and 0.885, respectively), with sensitivities of 80.30% and 78.79% and specificities of 73.53% and 88.24% at cutoffs of 223.6/1000 and 168.4/100. In contrast, the ADC value (AUC = 0.534, p=0.4293) lacked statistical significance and was ineffective for differentiating LUAD-BM from LUSC-BM.
In summary, the ADC value is highly effective for distinguishing SCLC-BM from NSCLC-BM, while DCE-MRI parameters such as Ktrans and Vp are exceptionally reliable for differentiating LUAD-BM from LUSC-BM. These findings provide critical imaging-based evidence for noninvasive pathological classification in clinical practice.
Quantifying the contributions of ADC values and DCE-MRI parameters to different histopathological LCBM subtypes using logistic regression
By constructing a multivariate logistic regression model adjusted for parameters including Ktrans, Ve, Vp, Kep, iAUC90, CER, Max. Slope, and Delay, the independent predictive effects of these indicators on different histopathological subtypes of LCBM exhibited significant heterogeneity, as detailed in Table 4.
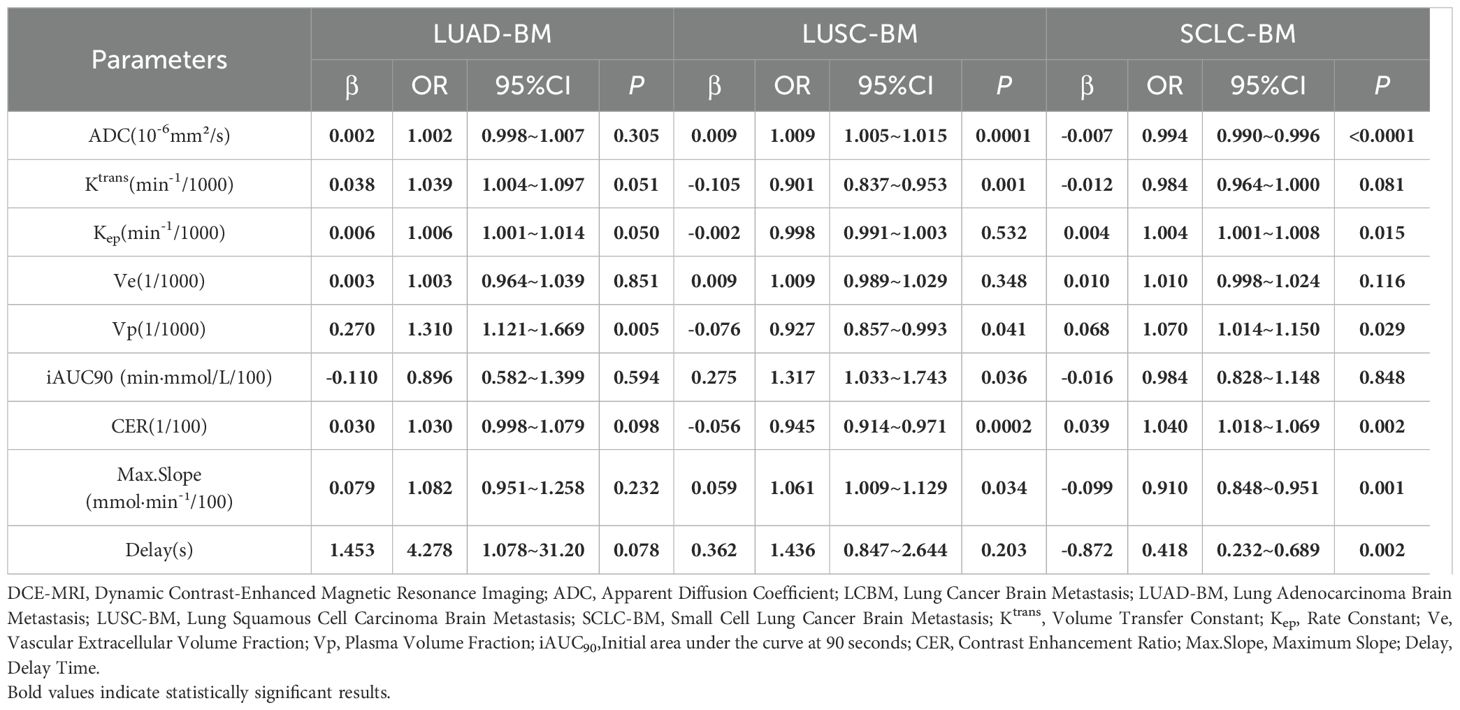
Table 4. Logistic regression assessment of the contributions of ADC Values and DCE-MRI parameters to different histopathological subtypes of LCBM.
For LUAD-BM, only Vp emerged as an independent positive predictive factor (β=0.270, OR = 1.310, 95% CI: 1.121–1.669, p=0.005). Other parameters, such as ADC value (β=0.002,p=0.305) and Ktrans (β=0.038,p=0.051), showed a positive trend but failed to reach statistical significance after adjustment.
In LUSC-BM, Ktrans was identified as an independent negative predictive factor (β=−0.105, OR = 0.901, 95% CI: 0.837–0.953, p=0.001). This, combined with the positive predictive effect of ADC value (β=0.009, OR = 1.009, 95% CI: 1.005–1.015, p=0.0001), suggests the characteristic features of squamous carcinoma: low vascular permeability and moderate cellular density. Furthermore, the independent contributions of CER (β=−0.056OR = 0.945, p<0.0002) and Max. Slope (β=0.059, OR = 1.061, p=0.034) indicated their potential to assist in evaluating vascular function in LUSC-BM.
For SCLC-BM, ADC value was an independent negative predictor (β=−0.007, OR = 0.993, 95% CI: 0.990–0.996, p<0.0001), highlighting high cellular density as a core feature. This necessitates caution regarding drug permeation limitations due to compressed extracellular space. Additionally, the independent positive predictions of Kep (β=0.004, OR = 1.004, 95% CI: 1.001–1.008, p=0.015) and Ve (β=0.010, OR = 1.010, p=0.116), along with associations with enhancement curve parameters—Delay (β=−0.872, OR = 0.418, p=0.002), Max. Slope (β=−0.099, OR = 0.910, p=0.001), and CER (β=0.039, OR = 1.040, p=0.002).
Impact of DCE-MRI parameters on ADC values in different pathological types of LCBM: a multivariate linear regression analysis
Multivariate linear regression analysis revealed distinct pathological subtype-specific influences of DCE-MRI parameters on ADC values in LCBM. as detailed in Table 5.
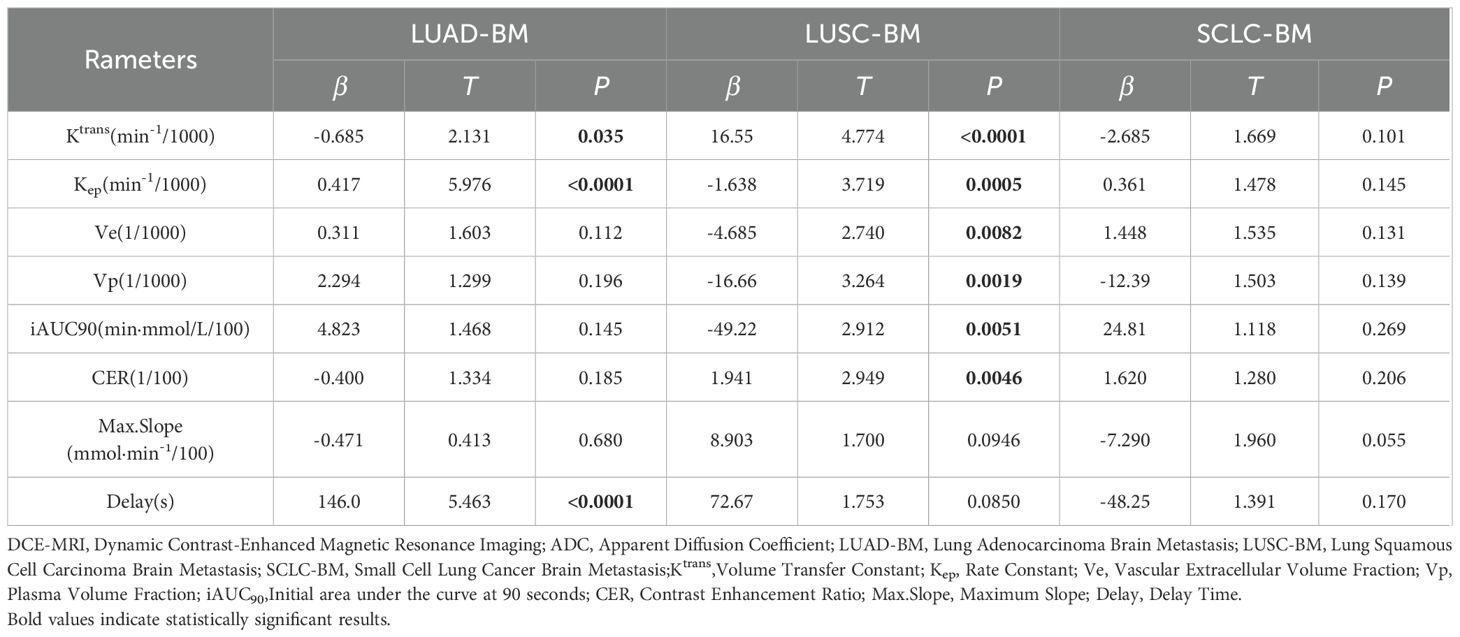
Table 5. Linear regression: pathology-specific effects of DCE-MRI parameters on ADC Values.
For LUAD-BM, ADC values exhibited significant positive regulation by the Kep (β=0.417, p < 0.0001) and Delay(β=146.0,p<0.0001), while showing weak negative association with Ktrans (β=−0.685, p=0.035). Parameters including Ve(β=0.311), Vp (β=2.294), iAUC90 (β=4.823), CER (β=−0.400), and Max.Slope (β=−0.471) demonstrated no statistical significance (all p > 0.05).
In LUSC-BM, ADC values were positively driven by Ktrans (β=16.55, p<0.0001) and CER (β=1.941,p=0.005),but negatively associated with Ve(β=−4.685,p=0.008),Vp(β=−16.66,p=0.002),iAUC90(β=−49.22,p=0.005),and Kep (β=−1.638, p=0.001), with Max.Slope approaching significance (β=8.903, p=0.095).
SCLC-BM displayed only marginal negative correlation between Max.Slope and ADC (β=−7.290, = 0.055), while other parameters (Ktrans, Kep, Ve, Vp, iAUC90, CER, Delay) showed no significant associations (all p>0.05).
Impact of DCE-MRI parameters and ADC values on BBB leakage in different pathological types of LCBM: a multivariate linear regression analysis
Multivariate linear regression analysis demonstrated significant pathological subtype-specific effects of DCE-MRI parameters and ADC values on BBB permeability (Ktrans)in LCBM.as detailed in Table 6.
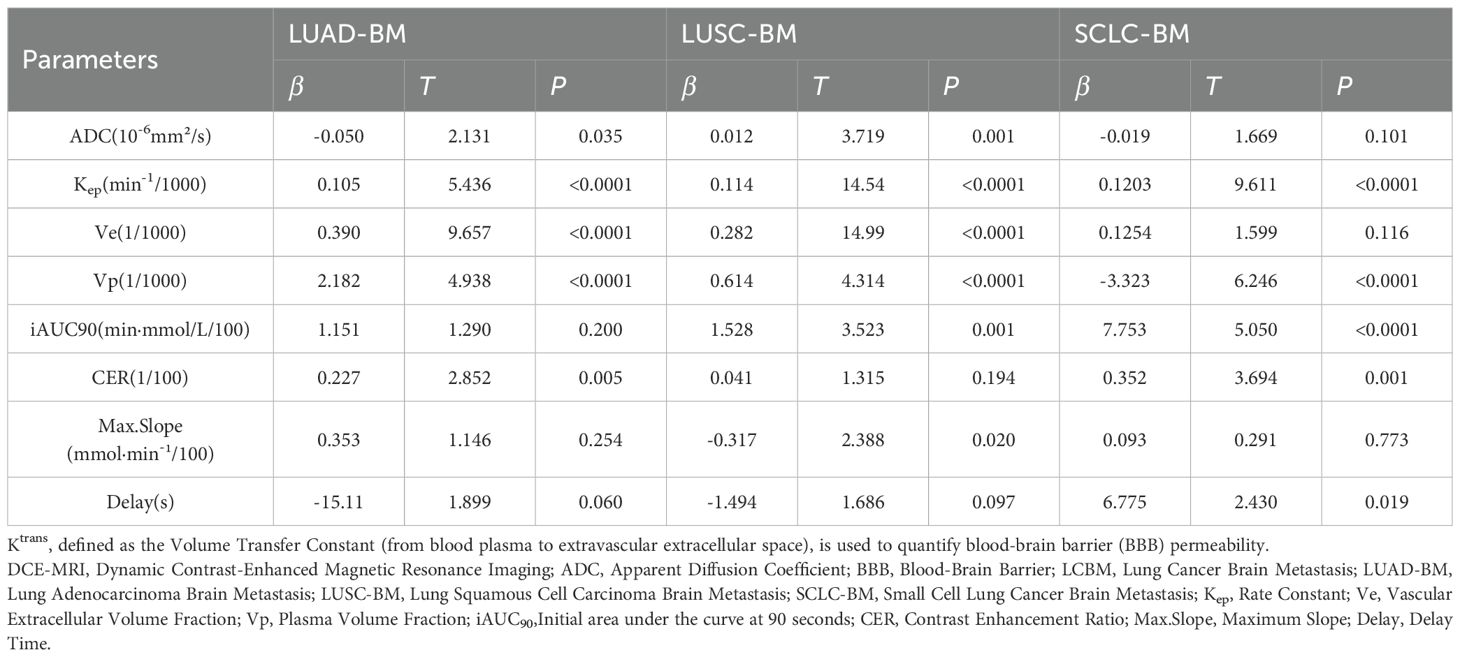
Table 6. Linear regression- effects of DCE-MRI and ADC parameters on blood-brain barrier permeability in different histopathological types of LCBM.
In LUAD-BM, Kep(β=0.105,p<0.0001),Ve(β=0.390,p<0.0001),and Vp(β=2.182,p<0.0001) exhibited significant positive associations with Ktrans, while reduced ADC values (β=−0.050,p=0.035) and elevated CER(β=0.227,p=0.005) increased BBB permeability. Parameters including iAUC90(β=1.151,p=0.200), Max.Slope(β=0.353,p=0.254),and Delay(β=−15.11,0p=0.060) showed no statistical significance.
For LUSC-BM, Ktrans was positively driven by Kep(β=0.114p<0.0001), Ve (β=0.282,p<0.0001), and Vp(β=0.614, p<0.0001). Increased ADC values (β=0.012,p=0.001) and iAUC90 (β=1.528,p=0.001) enhanced BBB permeability, whereas Max.Slope reduction correlated with decreased Ktrans (β=−0.317,p=0.020). CER (β=0.041,p=0.194) and Delay (β=−1.494,p=0.097) lacked significant contributions.
In SCLC-BM, Ktrans was prominently enhanced by Kep (β=0.1203,p<0.0001) and iAUC90 (β=7.753,p<0.0001), with CER further elevating permeability (β=0.352,p=0.001). Notably, Vp reduction (β=−3.323,p<0.0001) and prolonged Delay (β=6.775,p=0.019) revealed unique regulatory mechanisms. ADC (β=−0.019,p=0.101), Ve(β=0.1254,p=0.116), and Max.Slope (β=0.093,p=0.773) showed no significant effects. Collectively, BBB permeability regulation exhibited pathology-dependent patterns: LUAD-BM was dominated by microvascular function (Vp) and extracellular space (Ve); LUSC-BM relied on vascular transport kinetics (Kep) and enhancement kinetics (iAUC90); SCLC-BM demonstrated antagonistic effects between abnormal contrast agent kinetics (Kep/iAUC90) and microvascular density (Vp).
Discussion
The pathophysiological heterogeneity of LCBM, encompassing factors such as BBB disruption, vascularization patterns, and extracellular matrix remodeling, constitutes a critical constraint on therapeutic efficacy (17). Traditional pathological biopsies, limited by their invasiveness, sampling bias, and postoperative diagnostic delays, fail to comprehensively and dynamically assess the tumor microenvironment. This study innovatively integrates vascular functional parameters from DCE-MRI with DWI to establish a “vascular-cellular microenvironment visualization model” for LCBM. Through multiparametric fusion analysis, we systematically characterized the microenvironmental profiles of distinct histopathological LCBM subtypes: LUAD-BM exhibited high microvascular density and vascular permeability; LUSC-BM was defined by low vascular permeability and moderate cellular density; SCLC-BM demonstrated high cellular density and anomalous contrast agent transport kinetics. These findings not only validate the capability of multimodal functional imaging parameters to characterize LCBM microenvironmental heterogeneity but also provide novel insights into tumor vascularization, cellular density, and BBB regulation. Specifically, the quantification of independent parameter contributions (e.g., the independent positive predictive role of Vp for LUAD-BM in logistic regression, β=0.270, p=0.005) and interactive mechanisms (e.g., the synergistic regulation of LUSC-BM ADC values by Ktrans-driven enhancement and Ve mediated suppression in linear regression) establishes an imaging foundation for personalized therapeutic strategies targeting the tumor microenvironment.
The observed differences in imaging parameters among LCBM fundamentally reflect the heterogeneity of their vascular-cellular microenvironment. Through multiparametric fusion analysis of DCE-MRI and DWI, this study systematically delineates the imaging characteristics of the vascular-cellular microenvironment in LCBM. Key findings include: The ADC value demonstrated exceptional efficacy in discriminating SCLC-BM from NSCLC-BM (AUC = 0.891), achieving 95.05% specificity at a cutoff of 752.4×10⁻⁶ mm²/s, thereby providing a reliable indicator for identifying SCLC-BM with high cellular density. For distinguishing LUAD-BM from LUSC-BM, Ktrans exhibited near-perfect diagnostic performance (AUC = 0.998), with sensitivity and specificity exceeding 97% at a cutoff of 157 min-¹/1000, confirming vascular permeability as a core stratification indicator. Mechanistically, logistic regression quantified Vp as an independent positive predictor for LUAD-BM (β=0.270, OR = 1.310, 95% CI: 1.121–1.669, p=0.005), validating its biological essence of “microvascular richness.” Conversely, Ktrans served as an independent negative predictor for LUSC-BM (β=-0.105, OR = 0.901, 95% CI: 0.837–0.953, p=0.001), Combined with the positive association of ADC value (β=0.009, OR = 1.009, 95% CI: 1.005–1.015, p<0.0001), this indicates a microenvironment characterized by low vascular permeability and moderate cellular density. The independent contributions of CER (β=-0.056, p<0.0002) and Max.Slope (β=0.059, p=0.034) further corroborate the pathologically restricted vascular function in LUSC-BM. For SCLC-BM, ADC value emerged as an independent negative predictor (β=-0.007, OR = 0.993, 95% CI: 0.990–0.996, p<0.0001), while positive trends were observed for Kep (β=0.004, OR = 1.004, 95% CI: 1.001–1.008, p=0.015) and Ve (β=0.010, OR = 1.010, p=0.116), quantitatively capturing the biological drivers of its “high cellular density and rapid contrast agent transport” phenotype and highlighting high cellular density as a defining feature. Multivariate linear regression further elucidated parameter interactions: LUAD-BM ADC values were primarily positively regulated by Kep (β=0.417, p<0.0001) and Delay (β=146.0, p<0.0001), suggesting that vascular transport kinetics and contrast arrival time indirectly modulate cellular density via extracellular space pressure – consistent with LUAD-BM’s abundant microvasculature and large extracellular volume (median Ve=294.3). LUSC-BM ADC values showed positive association with Ktrans (β=16.55, p<0.0001) but were negatively constrained by Ve (β=-4.685, p=0.008) and Vp (β=-16.66, p=0.002), reflecting fibrotic matrix-mediated restriction of microvascular formation (low Vp) and reduced extracellular space (low Ve), leading to elevated extracellular pressure and ADC limitation, thereby forming a “low vascular permeability-high matrix density” regulatory interplay. SCLC-BM exhibited minimal association between ADC and DCE-MRI parameters, with only marginal negative correlation to Max.Slope (β=-7.290, p=0.055), confirming its proliferation-dominant pathology where cellular density is primarily driven by intrinsic proliferative activity rather than vascular function, aligning with extracellular space compression (low ADC) and passive microvascular damage (high Kep) resulting from high proliferative activity. Analysis of BBB permeability (Ktrans) revealed distinct drivers: LUAD-BM showed strong positive associations with Kep (β=0.105, p<0.0001), Ve (β=0.390, p<0.0001), and Vp (β=2.182, p<0.0001), and negative association with ADC (β=-0.050), indicating that rich microvascular content (high Vp), large extracellular volume (high Ve), and rapid transport kinetics (high Kep) are core drivers of its high BBB leakage. In LUSC-BM, BBB leakage was primarily maintained by limited microvascular function (low Vp), evidenced by positive drives from Kep (β=0.114, p<0.0001), Vp (β=0.614, p<0.0001), and ADC (β=0.010). SCLC-BM demonstrated prominent positive contributions from Kep (β=0.1203, p<0.0001) and iAUC90 (β=7.753, p<0.0001), coupled with strong negative association with Vp (β=-3.323, p<0.0001), suggesting its BBB leakage is governed by abnormal contrast transport patterns (high Kep, high iAUC90) rather than microvascular content (low Vp). Collectively, these differences demonstrate that distinct pathological subtypes of LCBM achieve functional regulation through specific parameter combinations (e.g., “high Vp + high Ve + high Kep” in LUAD-BM; “high Kep + high iAUC90 + low Vp” in SCLC-BM), providing quantitative evidence for deciphering the pathophysiological heterogeneity of LCBM. This study not only validates the hypothesis that multiparametric functional imaging reflects LCBM microenvironment heterogeneity but also, by quantifying independent parameter contributions and interactive relationships, offers novel insights into the biological mechanisms underlying tumor angiogenesis, cellular density, and dynamic BBB alterations, thereby establishing an imaging foundation for developing individualized therapies targeting the microenvironment.
This study confirms the robust diagnostic efficacy of ADC values in differentiating SCLC-BM from NSCLC-BM, aligning with prior reports (18, 19) that ADC effectively distinguishes high-cellular-density SCLC from other subtypes. Simultaneously, Ktrans demonstrated near-perfect discriminative capability for LUAD-BM versus LUSC-BM, corroborating Abreu et al. (7) who identified Ktrans as a pivotal biomarker of vascular permeability differences critical for LUAD/LUSC differentiation. Regarding the vascular-cellular microenvironment across pathological subtypes, LUAD-BM exhibited elevated vascular permeability, consistent with findings by Gozde Uzunalli et al. (4) and Du et al. (20). Du et al. attributed this to VEGF-driven angiogenesis, while Gozde Uzunalli et al. implicated EGFR mutation-mediated HIF-1α upregulation in immature vascularization. Our multiparameter logistic regression further quantified LUAD-BM’s “microvascular enrichment,” evidenced by Vp’s independent positive prediction, reinforcing Wei et al.’s (12) conclusion on microvascular density as a hallmark of adenocarcinoma. Crucially, unlike previous studies, we identified that LUAD-BM’s Ktrans is co-driven by Kep, Ve, and Vp while ADC negatively modulated Ktrans, suggesting reduced ADC (high cellular density) may enhance BBB leakage—a novel insight into cellular-vascular feedback.LUSC-BM displayed low Ktrans, echoing Lang et al. (21) who attributed reduced permeability in spinal metastases to fibrotic matrix-impaired angiogenesis. This aligns with our observation of moderate ADC values in LUSC-BM. Mechanistically, Gozde Uzunalli et al. (4) linked BTB evolution to basement membrane degradation and pericyte dysfunction, complementing our findings: Ve negatively suppressed ADC in LUSC-BM, while SCLC-BM showed aberrantly elevated Kep, collectively highlighting microenvironmental specificity.For SCLC-BM, Zhang Bin et al. (22) reported significantly lower ADC than NSCLC-BM, with low ADC percentiles inversely correlating with Ki-67 (r=–0.521), strongly supporting our data: ADC independently predicted SCLC-BM negatively, while multivariate regression revealed minimal DCE-MRI influence. This limitation likely stems from extracellular space compression due to high proliferative activity or intrinsic proliferation-driven cellular density decoupled from vascular function—consistent with Huang et al. (23) who noted Ve-Ki-67 inverse correlation and Makoto et al. (18) reporting high cellular density in SCLC-BM. However, diverging from Makoto et al.’s observation of low vascular density (CD31+), our data showed SCLC-BM’s Vp exceeded LUSC-BM’s, potentially reflecting sampling bias in prior studies with imbalanced subtype representation.Additionally, while Ye et al. (24) reported deficient BBB/BTB efflux pumps (e.g., P-gp) in SCLC-BM, our observed high Kep (indicating rapid contrast reflux) appears contradictory. Critically, these mechanisms differ fundamentally: efflux pumps mediate active drug transport, whereas contrast reflux reflects passive extravasation governed by vascular leakage and extracellular space heterogeneity. This distinction necessitates future investigation into the interplay between vascular permeability parameters (e.g., Kep) and active transport functionality in SCLC-BM.
The findings of this study hold direct clinical implications for the management of LCBM. In diagnostics, the high specificity of the ADC value in distinguishing SCLC-BM can circumvent the risks of invasive biopsy and prevent treatment delays. The near-perfect discriminative power of Ktrans for differentiating LUAD-BM from LUSC-BM provides a non-invasive preoperative subtyping tool, particularly critical for inoperable patients, thereby optimizing clinical decision-making. For therapeutic strategies, the independent positive prediction of Vp for LUAD-BMsuggests prioritizing anti-angiogenic agents in lesions with rich microvasculature. Conversely, the low ADC value and high Kep in SCLC-BM indicate compressed extracellular spaces that may limit drug penetration, necessitating combination with small-molecule targeted therapies or adjusted chemotherapy dosing. The low Ktrans in LUSC-BM supports localized radiotherapy over systemic anti-angiogenic therapy. Diagnostic pitfalls, such as overreliance on single parameters (e.g., ADC’s inability to distinguish adenocarcinoma from squamous carcinoma) or overlooking microenvironmental interactions (e.g., opposing effects of Ktrans and Ve on ADC in LUSC-BM), must be addressed to avoid misclassification or suboptimal treatment responses.At the pathophysiological level, the results validate established theories: LUAD-BM’s high Ktrans aligns with VEGF-mediated angiogenesis (20), while ADC regulation by Kep and Delay reflects indirect effects of vascular transport kinetics on cellular density via extracellular pressure. SCLC-BM’s ADC independence from DCE-MRI parameters confirms its proliferation-driven (non-angiogenic) pathology (24). The fibrotic matrix in LUSC-BM, restricting angiogenesis (low Vp, low Ve), aligns with the “stroma-vascular antagonism” model proposed by Chen et al. (13).
This study advances beyond prior descriptive approaches through a multiparametric fusion model with four key innovations:1)Integration of DCE-MRI vascular parameters and DWI structural metrics to construct a “vascular-cellular microenvironment visualization model,” systematically characterizing LUAD-BM (“high microvascular density + large extracellular space”), SCLC-BM (“high cellular density + aberrant vascular function”), and LUSC-BM (“low vascular permeability”) heterogeneity.2)Quantification of independent parameter contributions via logistic regression, identifying Vp as the sole independent positive predictor for LUAD-BM (β=0.270) and ADC as an independent negative predictor for SCLC-BM, transforming correlation into mechanistic insight.3)Elucidation of parameter interactions through multivariate linear regression, revealing LUAD-BM’s ADC dominance by Kep and Delay, and LUSC-BM’s ADC dual regulation by Ktrans(positive) and Ve (negative).4)Incorporation of key thresholds (e.g., SCLC-BM ADC: 752.4 × 10⁻⁶ mm²/s; LUAD-BM Ktrans: 176.1 min-¹/1000) into clinical scoring systems (e.g., DS-GPA), enabling personalized strategies such as “anti-angiogenic therapy for high-Vp LUAD-BM” or “combination targeted therapy for low-ADC SCLC-BM,” thereby establishing an “imaging-pathology-clinical” framework that enhances translational impact.Collectively, this work not only validates multiparametric MRI for characterizing LCBM microenvironments but also provides novel theoretical and technical pathways for fundamental research and precision therapeutics through multimodal integration, parameter weighting, interaction analysis, and clinical application frameworks.
This study acknowledges several limitations: the relatively small sample size and single-center design necessitate caution when generalizing the results; lesions smaller than 0.5 cm were excluded based on inclusion criteria; manual ROI delineation may introduce observer bias despite achieving inter-observer ICC values ≥0.8; the absence of post-treatment follow-up data precludes validation of the parameters’ predictive value for therapeutic response; and potential confounding factors—including enhancement patterns, perilesional edema, spatial distribution of metastases, and genetic mutation status—were not systematically controlled. Furthermore, molecular biomarkers from both primary and metastatic sites remain unanalyzed, highlighting the need for future exploration of imaging-molecular correlations. Subsequent research should validate the model’s generalizability through multi-center studies with larger cohorts, integrate PET/CT or MR spectroscopy to supplement metabolic information, conduct longitudinal investigations to correlate parameter dynamics with clinical outcomes, and leverage AI-driven techniques to extract more sensitive microstructural features, thereby enhancing diagnostic efficacy.
Conclusions
In summary, this study systematically revealed the vascular-cellular microenvironmental heterogeneity of LCBM through multiparametric fusion analysis of DCE-MRI and DWI. Key findings elucidated distinct pathophysiological characteristics: cellular density in SCLC-BM is predominantly driven by autonomous proliferation, LUAD-BM exhibits hyperactive vascular function, and LUSC-BM demonstrates restricted angiogenesis. These results hold significant implications across clinical and basic scientific domains. Clinically, they establish a reliable noninvasive imaging tool for pathological subtyping of LCBM, enabling optimized therapeutic decisions—such as prioritizing anti-angiogenic agents (e.g., bevacizumab) for LUAD-BM, selecting stereotactic radiotherapy for LUSC-BM, and identifying high-risk SCLC-BM cases via low ADC values. From a fundamental research perspective, this work deepens the mechanistic understanding of dynamic vascular-cellular microenvironmental regulation in LCBM, validates the theoretical hypothesis that multimodal functional imaging parameters can precisely characterize microenvironmental heterogeneity, and provides an imaging-based rationale for developing therapeutic strategies targeting critical pathological components such as the BBB/BTB, and extracellular matrix.
Data availability statement
The original contributions presented in the study are included in the article/supplementary material. Further inquiries can be directed to the corresponding authors.
Ethics statement
The studies involving humans were approved by Jiangjin Central Hospital of Chongqing the Hospital Ethics Review Committee (Approval No. KY2023073). All participants were fully informed of the research objectives and provided written informed consent. The research process adhered to the ethical principles outlined in the Declaration of Helsinki. The studies were conducted in accordance with the local legislation and institutional requirements. The participants provided their written informed consent to participate in this study. Written informed consent was obtained from the individual(s) for the publication of any potentially identifiable images or data included in this article.
Author contributions
YL: Data curation, Investigation, Writing – original draft, Formal Analysis. ZL: Data curation, Funding acquisition, Investigation, Resources, Writing – original draft. HW: Data curation, Formal Analysis, Software, Writing – original draft. ZP: Data curation, Formal Analysis, Resources, Writing – original draft. XZ: Formal Analysis, Project administration, Supervision, Writing – original draft. JZ: Supervision, Validation, Writing – original draft, Software. CW: Data curation, Formal Analysis, Investigation, Resources, Supervision, Validation, Writing – original draft, Writing – review & editing, Project administration. RL: Supervision, Validation, Writing – original draft, Conceptualization, Data curation, Formal Analysis, Funding acquisition, Investigation, Resources, Visualization, Writing – review & editing.
Funding
The author(s) declare financial support was received for the research and/or publication of this article. This study was supported by the Science and Health Joint Project of Chongqing Municipality (Grant No. 2024QNXM042), the Natural Science Foundation Project of Chongqing Municipality (Grant No. CSTB2025NSCQ-GPX1064), the Hospital-Level Project of Chongqing University Jiangjin Hospital (Grant No. 2023yjky005), and the In-Hospital Cultivation Project of Chongqing University Jiangjin Hospital (Grant No. 2024LCXM003).
Conflict of interest
The authors declare that the research was conducted in the absence of any commercial or financial relationships that could be construed as a potential conflict of interest.
Generative AI statement
The author(s) declare that no Generative AI was used in the creation of this manuscript.
Any alternative text (alt text) provided alongside figures in this article has been generated by Frontiers with the support of artificial intelligence and reasonable efforts have been made to ensure accuracy, including review by the authors wherever possible. If you identify any issues, please contact us.
Publisher’s note
All claims expressed in this article are solely those of the authors and do not necessarily represent those of their affiliated organizations, or those of the publisher, the editors and the reviewers. Any product that may be evaluated in this article, or claim that may be made by its manufacturer, is not guaranteed or endorsed by the publisher.
References
1. Sridharan N, Salem A, Little RA, Taric M, Cheung S, Dubec MJ, et al. Measuring repeatability of dynamic contrast-enhanced MRI biomarkers improves evaluation of biological response to radiotherapy in lung cancer. Eur Radiol. (2024) 35(2):664–73. doi: 10.1007/s00330-024-10970-7, PMID: 39122855
2. Zhou H, Zeng Y, Hida T, Hsu R, Huang Y, Dong X, et al. The current landscape and prospects of antibody-drug conjugates for lung cancer brain metastases: a narrative review. Transl Lung Cancer Res. (2024) 13(12):3778–94. doi: 10.21037/tlcr-24-964, PMID: 39830739
3. Bernatowicz K, Amat R, Prior O, Frigola J, Ligero M, Grussu F, et al. Radiomics signature for dynamic monitoring of tumor inflamed microenvironment and immunotherapy response prediction. J For Immunotherapy Of Cancer. (2025) 13(1). doi: 10.1136/jitc-2024-009140, PMID: 39800381
4. Uzunalli G, Dieterly AM, Kemet CM, Weng HY, Soepriatna AH, Goergen CJ, et al. Dynamic transition of the blood-brain barrier in the development of non-small cell lung cancer brain metastases. Oncotarget. (2019) 10(59):6334–48. doi: 10.18632/oncotarget.27274, PMID: 31695842
5. Chen Y, Wang Q, Zhou G, Liu K, Qin S, Zhao W, et al. Predictive model based on DCE-MRI and clinical features for the evaluation of pain response after stereotactic body radiotherapy in patients with spinal metastases. Eur Radiol. (2023) 33:4812–21. doi: 10.1007/s00330-023-09437-y, PMID: 36735042
6. Wang D, Liu S, Fu J, Zhang P, Zheng S, Qiu B, et al. EP08.03–05 role of DCE MRI in predicting treatment response to induction immunochemotherapy in locally advanced NSCLC patients. J Thorac Oncol. (2023) 18:1. doi: 10.1016/j.jtho.2023.09.1109
7. Abreu VS, Tarrio J, Silva J, Almeida F, Pinto C, Freitas D, et al. Multiparametric analysis from dynamic susceptibility contrast-enhanced perfusion MRI to evaluate Malignant brain tumors. J Neuroimaging. (2024) 34(2):257–66. doi: 10.1111/jon.13183, PMID: 38173078
8. de Godoy LL, Chen YJ, Chawla S, Viaene AN, Wang S, Loevner LA, et al. Prognostication of overall survival in patients with brain metastases using diffusion tensor imaging and dynamic susceptibility contrast-enhanced MRI. Br J Radiol. (2022) 95(1140):20220516. doi: 10.1259/bjr.20220516, PMID: 36354164
9. Zhang D-F, Ma H, Yang G-J, Zhang ZP, He YF, Feng MY, et al. Blood-brain barrier and brain structural changes in lung cancer patients with non-brain metastases. Front Oncol. (2022) 12(0):1015011. doi: 10.3389/fonc.2022.1015011., PMID: 36330467
10. Messana G, Bortolotto C, Thulasi Seetha S, Marrocco A, Pairazzi C, Sanvito F, et al. Non-invasive PD-L1 stratification in non-small cell lung cancer using dynamic contrast-enhanced MRI. Eur Radiol. (2025) 0:0. doi: 10.1007/s00330-025-11524-1, PMID: 40146425
11. Mustafa B, Ali E, and Sümeyye E. Differentiation of brain metastases originating from lung and breast cancers using apparent diffusion coefficient histogram analysis and the relation of histogram parameters with Ki-67. Neuroradiol J. (2021) 35(3):370–7. doi: 10.1177/19714009211049082, PMID: 34609916
12. Wei F, Weidong F, Wenming Z, He L, Cheng X, Mao Z, et al. Discrimination between benign and Malignant lung lesions using volumetric quantitative dynamic contrast-enhanced MRI. Curr Med Imaging Rev. (2024) 20:8. doi: 10.2174/1573405620666230727111222, PMID: 37497704
13. Yang C, Zhu F, Yang J, Wang M, Zhang S, and Zhao S. DCE-MRI quantitative analysis and MRI-based radiomics for predicting the early efficacy of microwave ablation in lung cancers. Cancer Imaging. (2025) 25(1):26. doi: 10.1186/s40644-025-00851-7, PMID: 40065426
14. Nissan N, Anaby D, Mahameed G, Bauer E, Moss Massasa EE, Menes T, et al. Ultrafast DCE-MRI for discriminating pregnancy-associated breast cancer lesions from lactation related background parenchymal enhancement. Eur Radiol. (2023) 33(11):8122–31. doi: 10.1007/s00330-023-09805-8, PMID: 37278853
15. Jin T, Zhang H, Liu X, Kong X, Makamure J, Chen Z, et al. Enhancement degree of brain metastases: correlation analysis between enhanced T2 FLAIR and vascular permeability parameters of dynamic contrast-enhanced MRI. Eur Radiol. (2021) 31:5595–604. doi: 10.1007/s00330-020-07625-8, PMID: 33847812
16. Hu J, Liu M, Zhao W, Ding Z, Wu F, Hu W, et al. Value for combination of TWI starVIBE with TWISTVIBE dynamic contrastenhanced MRI in distinguishing lung nodules. Zhong Nan Da Xue Bao Yi Xue Ban. (2023) 48(4):581–93. doi: 10.11817/j.issn.1672-7347.2023.220588, PMID: 37385621
17. Sun HF, Li LD, Lao IW, Li X, Xu BJ, Cao YQ, et al. Single-cell RNA sequencing reveals cellular and molecular reprograming landscape of gliomas and lung cancer brain metastases. Clin Transl Med. (2022) 12(11):e1101. doi: 10.1002/ctm2.1101, PMID: 36336787
18. Kiyose M, Herrmann E, Roesler J, Zeiner PS, Steinbach JP, Forster MT, et al. MR imaging profile and histopathological characteristics of tumour vasculature, cell density and proliferation rate define two distinct growth patterns of human brain metastases from lung cancer. Neuroradiology. (2022) 65(2):275–85. doi: 10.1007/s00234-022-03060-2, PMID: 36184635
19. Ye C, Lin Q, Zhang J, Zheng C, and Ma S. Predictive effect of DCE-MRI and DWI in brain metastases from NSCLC. Open Med (Wars). (2021) 16(1):1265–75. doi: 10.1515/med-2021-0260, PMID: 34514171
20. Du Y, Zhang S, Liang T, Shang J, Guo C, Lian J, et al. Dynamic contrast-enhanced MRI perfusion parameters are imaging biomarkers for angiogenesis in lung cancer. Acta Radiol. (2023) 64:572–80. doi: 10.1177/02841851221088581, PMID: 35369721
21. Lang N, Zhang Y, Zhang E, Zhang J, Chow D, Chang P, et al. Differentiation of spinal metastases originated from lung and other cancers using radiomics and deep learning based on DCE-MRI. Magn Reson Imaging. (2019) 64:4–12. doi: 10.1016/j.mri.2019.02.013, PMID: 30826448
22. Zhang B, Zhou F, Zhou Q, Xue C, Ke X, Zhang P, et al. Whole-tumor histogram analysis of multi-parametric MRI for differentiating brain metastases histological subtypes in lung cancers: relationship with the Ki-67 proliferation index. Neurosurg Rev. (2023) 46:218. doi: 10.1007/s10143-023-02129-7, PMID: 37659040
23. Huang YN, Zhao ZH, Mao H J, Yang JF, Wang T, Zhao L, et al. Correlation between DCE-MRI quantitative perfusion histogram parameters, apparent diffusion coefficient and Ki-67 in different pathological types of lung cancer. Zhonghua Yi Xue Za Zhi. (2019) 99:1645–50. doi: 10.3760/cma.j.issn.0376-2491.2019.21.011, PMID: 31189264
Keywords: diffusion-weighted imaging (DWI), dynamic-contrast-enhanced magnetic resonance imaging, lung cancer, brain metastasis (BM), microenvironment
Citation: Li Y, Li Z, Wang H, Pei Z, Zhang X, Zhou J, Wu C and Liang R (2025) Visualizing the vascular-cellular microenvironment in lung cancer brain metastasis via multiparametric fusion of DCE-MRI and DWI. Front. Oncol. 15:1645589. doi: 10.3389/fonc.2025.1645589
Received: 12 June 2025; Accepted: 02 October 2025;
Published: 21 October 2025.
Edited by:
Abhishek Mahajan, The Clatterbridge Cancer Centre, United KingdomCopyright © 2025 Li, Li, Wang, Pei, Zhang, Zhou, Wu and Liang. This is an open-access article distributed under the terms of the Creative Commons Attribution License (CC BY). The use, distribution or reproduction in other forums is permitted, provided the original author(s) and the copyright owner(s) are credited and that the original publication in this journal is cited, in accordance with accepted academic practice. No use, distribution or reproduction is permitted which does not comply with these terms.
*Correspondence: Chunrong Wu, MjAwOHpqd2NyQDE2My5jb20=; Ruipeng Liang, eHJheV9ocHJvdG9uQDE2My5jb20=
†These authors have contributed equally to this work and share first authorship