 Jinlei Mao
 Yuhang Tao
 Keke Wang
 Liang Jin
 Yi Pan
- State Key Laboratory of Natural Medicines, Jiangsu Key Laboratory of Druggability of Biopharmaceuticals, School of Life Science and Technology, China Pharmaceutical University, Nanjing, Jiangsu, China
A Correction on
Identification of hub genes within the CCL18 signaling pathway in hepatocellular carcinoma through bioinformatics analysis
By Mao J, Tao Y, Wang K, Sun H, Zhang M, Jin L and Pan Y (2024). Front. Oncol. 14:1371990. doi: 10.3389/fonc.2024.1371990
In the published article, there were errors in Figure 6. Due to carelessness during the preparation of the Figures 6E and F, the images labeled “CCR3” in the row for “Migration, LM3, MHCC-97H”, images labeled “LDHA” in the row for “Migration, LM3, MHCC-97H”, images labeled “CCR3”,”LDHA” in the row for “Invasion, LM3”, images labeled “CCR3”,”LDHA” in the row for “Invasion, MHCC-97H” and images labeled”Vector”,”CDC25C” in the row for “Invasion, MHCC-97H” show overlapping fields of view. We replaced images with the correct ones. The corrected Figure 6 and its caption appear below.
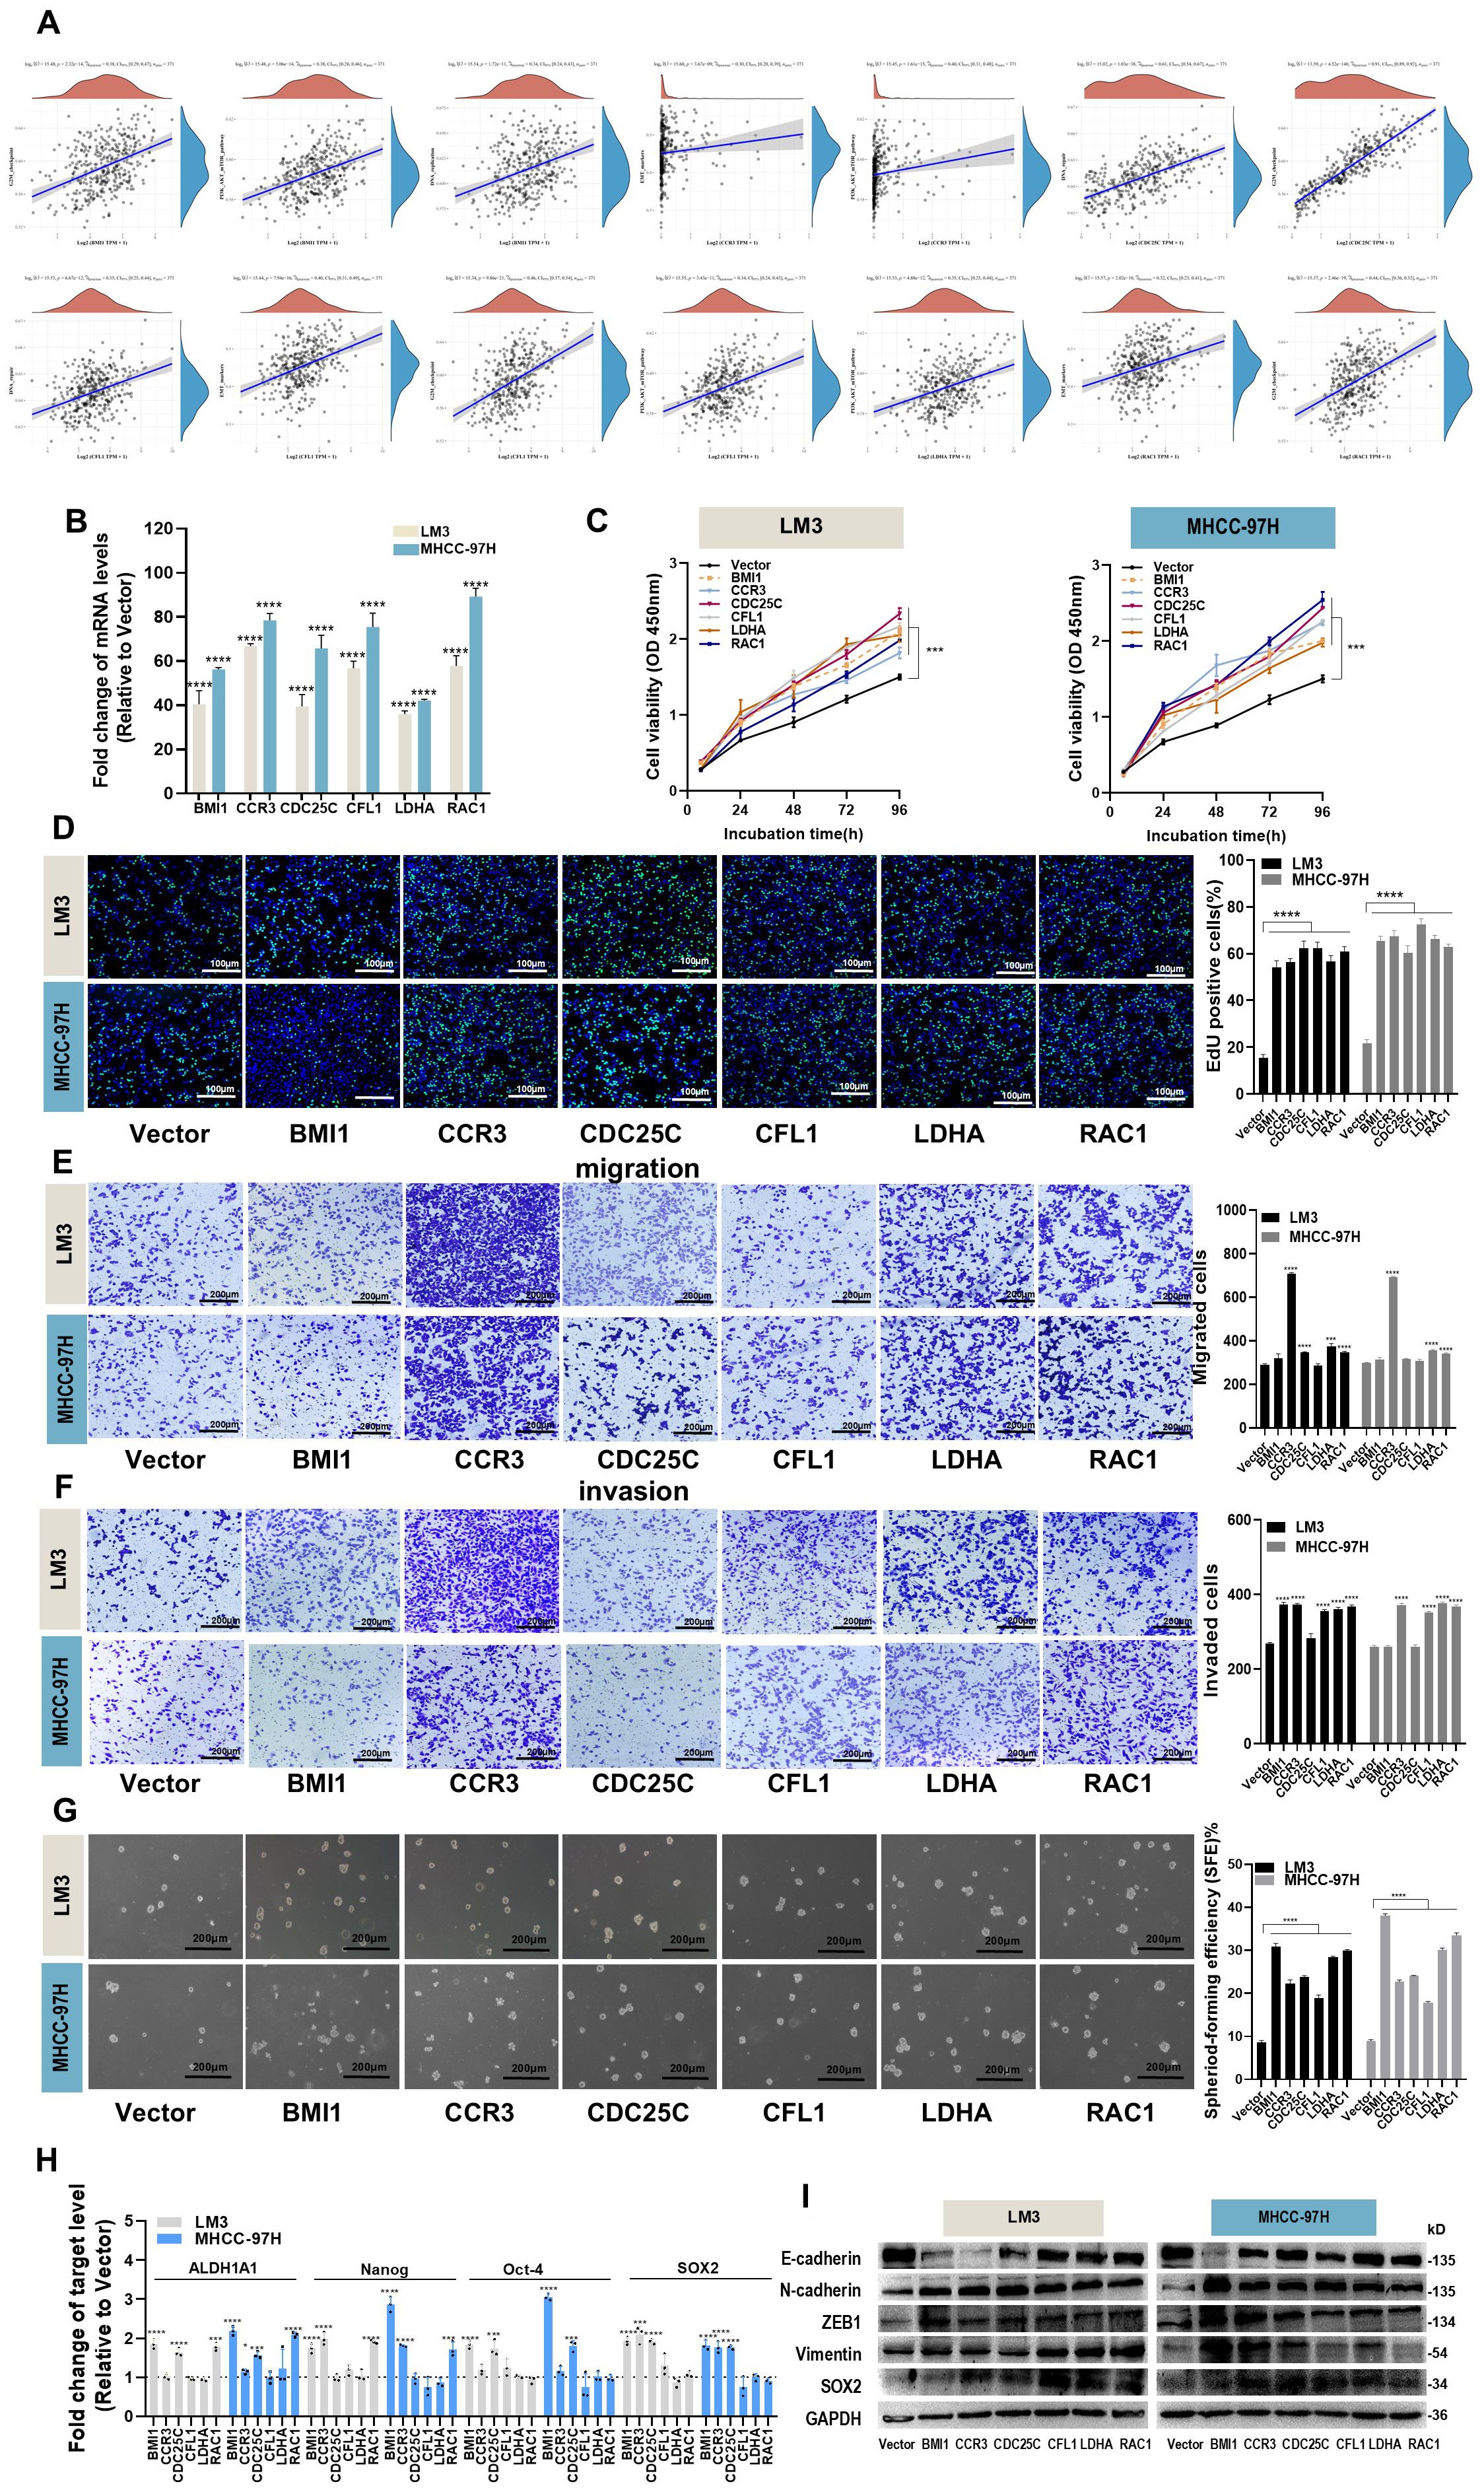
Figure 6. Effects of hub genes on proliferation, migration, invasion and stemness properties in HCC cells. (A) The correlations between six hub genes and pathway score were analyzed using Spearman. The abscissa represents the distribution of gene expression, and the ordinate represents the distribution of pathway score. The density curve on the right represents the trend in the distribution of pathway immune score, while the upper density curve represents the trend in the distribution of gene expression. The value on the top represents the correlation p value, correlation coefficient and correlation calculation method. (B) The overexpression efficiency of BMI1, CCR3, CDC25C, CFL1, LDHA and RAC1 overexpression plasmid was assessed by RT-qPCR. (C, D) Proliferation of LM3 and MHCC-97H cells after transfection with BMI1, CCR3, CDC25C, CFL1, LDHA and RAC1 overexpression plasmid for 48h was examined by CCK-8 assays (C) and EdU assays ((D), Scale bar:100 μm). (E, F) Migration (E) and invasion (F) of LM3 and MHCC-97H cells after transfection with BMI1, CCR3, CDC25C, CFL1, LDHA and RAC1 overexpression plasmid for 48h were detected by Transwell assays. Scale bar:200 μm. (G) Sphere-formation abilities of LM3 and MHCC-97H cells were observed after transfection with BMI1, CCR3, CDC25C, CFL1, LDHA, and RAC1 overexpression plasmids for 48h. Scale bar: 200 μm. (H) The expression of stemness-related genes in LM3 and MHCC-97H cells was analyzed after transfection with BMI1, CCR3, CDC25C, CFL1, LDHA, and RAC1 overexpression plasmids for 48h. (I) The protein levels of EMT-related genes in LM3 and MHCC-97H cells were measured after transfection with BMI1, CCR3, CDC25C, CFL1, LDHA, and RAC1 overexpression plasmids for 48h. All data are shown as the mean ± SD. *P<0.05, **P<0.01, ***P<0.001 and ****P<0.0001 by two-tailed Student’s t-test.
The original version of this article has been updated.
Publisher’s note
All claims expressed in this article are solely those of the authors and do not necessarily represent those of their affiliated organizations, or those of the publisher, the editors and the reviewers. Any product that may be evaluated in this article, or claim that may be made by its manufacturer, is not guaranteed or endorsed by the publisher.
Keywords: hepatocellular carcinoma, CCL18, tumor microenvironment, prognostic, diagnosis
Citation: Mao J, Tao Y, Wang K, Sun H, Zhang M, Jin L and Pan Y (2025) Correction: Identification of hub genes within the CCL18 signaling pathway in hepatocellular carcinoma through bioinformatics analysis. Front. Oncol. 15:1649612. doi: 10.3389/fonc.2025.1649612
Received: 18 June 2025; Accepted: 30 June 2025;
Published: 18 July 2025.
Edited and reviewed by:
Luisa Lanfrancone, European Institute of Oncology (IEO), ItalyCopyright © 2025 Mao, Tao, Wang, Sun, Zhang, Jin and Pan. This is an open-access article distributed under the terms of the Creative Commons Attribution License (CC BY). The use, distribution or reproduction in other forums is permitted, provided the original author(s) and the copyright owner(s) are credited and that the original publication in this journal is cited, in accordance with accepted academic practice. No use, distribution or reproduction is permitted which does not comply with these terms.
*Correspondence: Yi Pan, cGFueWlAY3B1LmVkdS5jbg==; Liang Jin, bGpzdGVtY2VsbEBjcHUuZWR1LmNu
†These authors have contributed equally to this work