 Yuting Yang
 Song Zhao1
- 1Department of Thoracic Surgery, Affiliated Hospital of Chengde Medical University, Chengde, Hebei, China
- 2Hebei Key Laboratory of Panvascular Disease, Chengde, Hebei, China
Objective: To investigate the regulatory mechanism by which MicroRNA-582-3p (miR-582-3p) targets protein tyrosine phosphatase receptor type C-associated protein (PTPRCAP) and modulates Wnt/β-catenin signaling in lung adenocarcinoma pathogenesis.
Methods: Bioinformatics analysis of TCGA data assessed miR-582-3p expression and its clinicopathological relevance in LUAD. PTPRCAP mRNA and protein levels were evaluated via RT-qPCR and immunohistochemistry. The miR-582-3p-PTPRCAP interaction was validated using TargetScan8.0 and dual-luciferase reporter assays. Functional assays (CCK-8, scratch, Transwell) determined the effects of miR-582-3p and PTPRCAP on LUAD cell proliferation, migration, and invasion. Western blotting analyzed Wnt/β-catenin pathway components (β-catenin, GSK3β, p-GSK3β).
Results: miR-582-3p was significantly upregulated in LUAD tissues and cell lines (A549, H1299), correlating with advanced disease features. PTPRCAP, a predicted target of miR-582-3p, showed reduced expression in LUAD. Dual-luciferase assays confirmed miR-582-3p directly binds the PTPRCAP 3′-UTR (P < 0.05). Overexpressing miR-582-3p suppressed PTPRCAP, enhanced malignant phenotypes (P < 0.05), and activated Wnt/β-catenin signaling (increased β-catenin and p-GSK3β; decreased GSK3β). Conversely, PTPRCAP overexpression inhibited tumorigenic behaviors and Wnt pathway activity. Rescue experiments demonstrated that PTPRCAP restoration counteracted miR-582-3p–mediated oncogenic effects (P < 0.05).
Conclusion: Our findings reveal a novel miR-582-3p/PTPRCAP/Wnt/β-catenin axis in LUAD progression, where miR-582-3p drives tumor growth by silencing PTPRCAP and activating Wnt signaling. These results highlight miR-582-3p as a potential therapeutic target and PTPRCAP as a tumor suppressor in LUAD, offering new insights for targeted intervention strategies.
Introduction
Lung cancer remains the leading cause of cancer-related mortality worldwide, with lung adenocarcinoma (LUAD) accounting for approximately 40% of all lung cancer cases (1, 2). Owing to the absence of specific early symptoms, most patients are diagnosed at advanced stages, frequently accompanied by local invasion and distant metastasis, resulting in a 5-year overall survival rate below 20% (3). Advances in modern biomedical technologies and the integration of multidisciplinary approaches have opened new therapeutic avenues for LUAD; however, a deeper understanding of its molecular pathogenesis is still required to identify effective therapeutic targets (4).
Protein tyrosine phosphatase receptor type C-associated protein (PTPRCAP) belongs to the PTPR family and directly interacts with PTPRC, thereby stabilizing its expression. PTPRC encodes CD45, one of 18 PTP genes among 72 survival phosphatases (5). Mounting evidence demonstrates that PTPRCAP down-regulation promotes immune evasion in colorectal cancer (6) and associates with adverse clinicopathological features and poor prognosis in hepatocellular carcinoma (7, 8). Moreover, our recent single-cell RNA-seq study revealed that PTPRCAP is up-regulated in NK and B cells of patients with carbapenem-resistant Klebsiella pneumoniae (CRKP) pneumonia, suggesting its potential as an immune-status biomarker (9). While PTPRC has been reported to modulate epithelial–mesenchymal transition (EMT) via the Wnt signaling pathway in non-small-cell lung cancer (NSCLC) (10), the precise role of its binding partner PTPRCAP in LUAD remains largely unexplored.
MicroRNAs (miRNAs) are a class of small non-coding RNAs that post-transcriptionally regulate gene expression by binding to complementary sequences in target mRNAs (11). Aberrant expression of multiple miRNAs has been documented in NSCLC and is implicated in tumorigenesis and progression (12, 13). Among them, miR-582-3p has been shown to suppress prostate cancer bone metastasis by inhibiting the TGF-β pathway (14), to control proliferation and invasion in hepatocellular carcinoma (15), and to be sponged by lncRNA PRKCQ-AS1 in LUAD, thereby regulating downstream gene expression (16). In silico analysis using TargetScan predicts that miR-582-3p harbors potential binding sites within the 3′-UTR of PTPRCAP, suggesting the existence of a novel miR-582-3p/PTPRCAP regulatory axis.
The Wnt/β-catenin signaling cascade is a pivotal pathway driving tumor progression (17). Aberrant activation of this pathway has been described in breast (18), gastric (19), cervical (20), and lung cancers (21). Specifically, miR-1246 promotes NSCLC metastasis by targeting GSK-3β and activating Wnt/β-catenin signaling (21). Recent evidence further indicates that miR-582-3p can enhance Wnt/β-catenin pathway activity (22). We therefore hypothesize that miR-582-3p may promote LUAD progression by directly targeting PTPRCAP and concomitantly activating the Wnt/β-catenin pathway.
Based on the above background, this study integrates clinical specimens, functional assays, and animal models with bioinformatics and molecular biology to elucidate how miR-582-3p targets PTPRCAP and, via the Wnt/β-catenin pathway, drives LUAD progression, thereby providing new molecular insights.
Materials and methods
Data source
We obtained miRNA-seq data from 33 cancer types in the TCGA database (https://portal.gdc.cancer.gov/), including 521 primary lung adenocarcinoma (LUAD) tumor samples and 46 paired adjacent normal lung tissues. The raw sequencing data were processed using the BCGSC miRNA Profiling Pipeline and normalized to reads per million (RPM) mapped reads. All analyses were performed in R (version 4.2.1) without log transformation or batch correction to maintain data integrity. Corresponding clinical data were retrieved from the TCGA-LUAD dataset for integrated analysis.
Tissue and cell
A total of 45 paired tumor and adjacent normal tissue specimens were obtained from lung adenocarcinoma patients undergoing surgical resection at the Department of Thoracic Surgery, Affiliated Hospital of Chengde Medical University. All specimens were immediately snap-frozen in liquid nitrogen following surgical resection and stored at -80 °C until subsequent experiments. Among them, 27 were female and 18 were male; 28 cases were ≥ 60 years old and 17 cases were < 60 years old, with an average age of (62.29 ± 7. 45) years old; 23 cases were in stage I and 22 cases were in stage II; 3 cases were poorly differentiated, 39 cases were moderately differentiated and 3 cases were well differentiated; Lymphatic metastasis in 6 cases. Inclusion criteria: 1. Patients with lung adenocarcinoma confirmed by pathology; 2. No anti-tumor treatment (radiotherapy, chemotherapy, immunotherapy, or anti-tumor ready-for-use traditional Chinese medicine treatment) has been performed before taking the specimen; 3 Patients who have never had any other malignant tumors. Exclusion criteria: 1. Patients with incomplete data and or other malignant tumors; 2. Patients who had undergone radiotherapy and chemotherapy, and other anti-tumor treatments, before surgery. Human lung adenocarcinoma cells A549, H1299, and normal lung epithelial cells BEAS-2B were derived from the central laboratory of Affiliated Hospital of Chengde Medical University. The study was approved by the hospital ethics committee, and informed consent was obtained from patients.
Reagents and instruments
Serum and basal medium were purchased from Punosai Life Technology Co., Ltd.; miR-582-3p mimics (miR-582-3p mimics) and negative control (mimics NC) were purchased from Anhui Jinbiao Biotechnology Co., Ltd.; PTPRCAP overexpression plasmid was purchased from Nanjing Jingpusaier Biotechnology Co., Ltd.; Lipofectamine 3000 transfection reagent, PTPRCAP primer and GAPDH primer were purchased from Invitrogen, USA; Dual-Lucifarase Reporter Assay System was purchased from Promega Corporation, USA; miR-582-3p primer and U6 primer were purchased from Tiangen Biochemical Technology (Beijing) Co., Ltd.; Reverse transcription kit, real-time fluorescent polymerase chain reaction (RT-qPCR) kit and CCK-8 kit were purchased from Cisco Biotechnology Co., Ltd.; Matrigel was purchased from Biozellen Corporation, USA; PTPRCAP antibody was purchased from Wuhan Sanying Biotechnology Co., Ltd., China, and GAPDH antibody was purchased from Wuhan Sevier Biotechnology Co., Ltd.; β-catenin antibody was purchased from Huaan Biotechnology Co., Ltd.; GSK3β and p-GSK3β antibodies were purchased from Ebiwei Biotechnology Co., Ltd.; Goat anti-rabbit immunoglobulin G secondary antibody was purchased from Aibotek Biotechnology Co., Ltd.
Cell culture, transfection, and grouping
BEAS-2B, A549, and H1299 cells were resuscitated and passaged in DMEM, RPMI-1640, and F12K medium, respectively, supplemented with 10% fetal bovine serum (FBS) and 1% penicillin-streptomycin, followed by incubation in a constant-temperature incubator. A549 and H1299 cells were seeded into 6-well plates, and upon reaching approximately 80% confluence, they were transfected using Lipofectamine 3000 transfection reagent. The cells were divided into the following groups: the miR-582-3p group, miR-NC group, OE group, Vector group, miR-582-3p + OE group, and miR-582-3p + Vector group. Specifically, the miR-582-3p group and miR-NC group were transfected with miR-582-3p mimics and mimics NC at a final concentration of 100 nM, respectively; the OE group and Vector group were transfected with the PTPRCAP overexpression plasmid and the corresponding control plasmid at 2500 ng per well, respectively; and the miR-582-3p + OE group and miR-582-3p + Vector group were co-transfected with the respective reagents. After transfection, cells were initially cultured in basal medium for 24 h, followed by replacement with complete medium containing 10% FBS for an additional 24 h before subsequent experiments.
RNA extraction, reverse transcription, and real-time fluorescence quantitative polymerase reaction
The tissues were ground with a low-temperature tissue homogenizer, and the total RNA of tissues and cells was extracted with Trizol reagent, and the RNA was reverse transcribed into cDNA by a reverse transcription kit. The configuration of the RT-qPCR system and the reaction conditions were carried out in strict accordance with the instructions of the fluorescence quantification kit. The relative quantities were calculated using the 2-ΔΔct method. PTPRCAP forward primer sequence 5’-CAGGACACACAGACTATGACCACG-3’ ́; Reverse primer sequence 5’-GTCACTGTCTCTGGCTTCCTCA-3’. GAPDH forward primer sequence 5’-CGACCACTTTGACAAGCTCA-3’ ́, reverse primer sequence 5’-AGGGGTCTACATGGCAACTG-3’ ́. miR-582-3p forward primer sequence 5’-UCAGUGACAGUAGUUUGUCAAG-3’; Reverse primer sequence 5’-CCAGTGCAGGGTCCGAGGT-3’. U6 forward primer sequence 5’-CTCGCTTCGGCAGCACA-3’; Reverse primer sequence 5’-AACGCTTCACGAATTTGCGT-3’.
Immunohistochemistry
Tissue sections were dewaxed, repaired by microwave antigen retrieval, and incubated in 3% hydrogen peroxide blocking solution for 15 minutes. After the sections were cooled, 10% goat serum was blocked; Primary antibody (PTPRCAP 1: 500) was added dropwise at 4°C overnight; The next day, the primary antibody was rewarmed for 1h; Add secondary antibody dropwise and incubate at 37°C for 30 min; DBA color development, hematoxylin counterstaining, dehydration transparency, gum sealing, microscope observation results. The percentage score of positive cells was 0-4 (0 was 0%-5%, 1 was 5%-24%, 2 was 25%-49%, 3 was 50%-74%, and 4 was 75%-100%). The staining intensity score was 0 ~ 3 (0 was negative staining, 1 was weak staining, 2 was moderate staining, and 3 was strong staining). Immunoreactive Score (IRS) was calculated as IRS = PP*SI, where PP represents the score of the percentage of positive cells and SI is the level of staining intensity.IRS ≤ 2 was classified as low expression, and > 2 as high expression.
Dual luciferase gene reporter assay
Potential interactions between miR-582-3p and PTPRCAP, along with the predicted binding sites, were identified using Target Scan. To experimentally validate this interaction, we constructed wild-type (WT-PTPRCAP) and mutant (MUT-PTPRCAP) luciferase reporter vectors containing the putative miR-582-3p binding sequence. A549 and H1299 cells were seeded in 6-well plates and co-transfected with either miR-582-3p mimics or mimics NC, along with the respective reporter vectors (WT-PTPRCAP or MUT-PTPRCAP). Following transfection, cells were cultured in basal medium for 24 h, followed by replacement with complete medium (10% FBS) for an additional 24 h. Luciferase activity was measured using a dual-luciferase reporter assay system, and the relative activity was determined by calculating the ratio of firefly luciferase to Renilla luciferase luminescence. This assay confirmed the regulatory effect of miR-582-3p on PTPRCAP expression.
Western blot experiment
Total protein was extracted from each experimental group and quantified. Protein samples were separated by SDS-PAGE (160 V constant voltage) and transferred to methanol-activated PVDF membranes (400 mA constant current). After transfer, membranes were blocked with 5% skim milk in TBST for 2h at room temperature, followed by incubation with primary antibodies: anti-PTPRCAP (1:1000), anti-GAPDH (1:4000), anti-β-catenin (1:1000), anti-GSK3β (1:2000), and anti-p-GSK3β (1:4000) at 4 °C overnight. The next day, membranes were rewarmed for 1 h, washed with TBST (3×10 min), and incubated with HRP-conjugated secondary antibody (1:10000) for 1h. After final washes (3×10 min TBST), protein bands were visualized using the C300 imaging system. Band intensities were quantified using ImageJ software by calculating the ratio of target protein to GAPDH signal.
CCK-8 assay to detect cell proliferation activity
The cell suspensions were counted and seeded into 96-well plates with 6 replicate wells in each group, and 100 μl of cell suspension containing 2500 cells was added to each well. After the cells were cultured for 0 h, 24 h, 48 h, 72 h, 10 μl of CCK-8 reagent was added to each well. After continued incubation in a 37°C incubator for 2 hours, the absorbance value (OD value) at 450 nm wavelength was measured with a microplate reader.
Scratch healing experiment
A549 cells and H1299 cells were seeded in 6-well plates, with 3 double wells in each group. When the cell density reaches about 80%, transfection is carried out. After the cells are cultured until the bottom of the well is covered, the bottom of the vertical well plate is scratched with the tip of a 10 μl pipette. The floating cells were washed off with PBS and added to basal medium for culture. The scratched areas were photographed under an inverted microscope at 0 h and 24 h, respectively.
Transwell cell migration and invasion experiment
Migration assay: Forty-eight hours post-transfection, cells (3×10⁴/well) in 1% FBS medium were seeded into the upper chamber, while the lower chamber contained 700 μl of 20% FBS medium. After 24 h incubation, non-migrated cells were removed by a cotton swab. Cells that migrated through the membrane were fixed with methanol, stained with 1% crystal violet, and quantified under an inverted microscope. Invasion assay: The upper chamber was pre-coated with Matrigel (Corning). Cells (5×10⁴/well) were seeded as described for the migration assay, with subsequent steps performed identically.
Statistical analysis
The data were statistically analyzed and plotted using Graphpad Prism 10.0 software. The measurement data obeying the normal distribution is represented by; t-test was used for data comparison between the two groups, and One-way ANOVA or two-way ANOVA was used for data comparison between multiple groups; Wilcoxon rank sum test was used for data that did not obey the normal distribution. Count data are shown as [Example (%)] using a paired four-cell Table χ2 test. The difference was statistically significant with P < 0.05. (*P < 0.05, **P < 0.01, ***P < 0.001, ****P < 0.001).
Results
Expression of miR-582-3p and PTPRCAP in lung adenocarcinoma and their targeting relationship
We downloaded data from the TCGA database and analyzed the expression of miR-582-3p in pan-cancer. The results showed that miR-582-3p was significantly highly expressed in a variety of tumors, including lung adenocarcinoma (Figure 1A). Further investigation of the TCGA-LUAD dataset showed that miR-582-3p expression was significantly higher in lung adenocarcinoma tissues than in adjacent tissues (n = 521, P = 0.018, 95%CI: 0.080-0.873, Figure 1B). This finding was further validated in vitro. qRT-PCR analysis demonstrated that miR-582-3p expression was significantly upregulated in lung adenocarcinoma cell lines A549 and H1299 compared to normal human bronchial epithelial cells BEAS-2B, showing 3-fold (n = 5, 95%CI: 1.678-2.329, P < 0.0001) and 2.6-fold (n = 5, 95%CI: 0.997-2.273, P < 0.001) increases, respectively (Figure 1C). Target Scan bioinformatics prediction suggested that the PTPRCAP gene contains a binding site complementary to miR-582-3p, which indicates that PTPRCAP may be the direct target gene of miR-582-3p. We performed targeted verification that in the dual luciferase reporter experiment, the experimental group cells transfected with miR-582-3p mimics and WT-PTPRCAP showed significantly reduced relative luciferase activity compared to the control group transfected with miR-NC and WT-PTPRCAP; There was no statistically significant difference in relative luciferase activity between the experimental group cells transfected with miR-582-3p mimics and MUT-PTPRCAP compared to the control group transfected with miR-NC and MUT-PTPRCAP, indicating that there was indeed targeted binding of miR-582-3p to PTPRCAP (n = 3, 95%CI:0.189-0.321, P < 0.0001, Figures 1D, E). The relative expression levels of PTPRCAP mRNA in 18 cases of lung adenocarcinoma and adjacent tissues, as well as normal lung epithelial BEAS-2B cells and lung adenocarcinoma A549 and H1299 cells, were detected by qRT-PCR. The results demonstrated that PTPRCAP expression was significantly downregulated in tumor tissues compared with adjacent normal tissues (P = 0.001, Figure 1F). Notably, PTPRCAP mRNA levels in A549 and H1299 cells showed 70% (n = 4, P < 0.0001) and 50% (n = 4, P < 0.001) reductions respectively relative to BEAS-2B cells(Figure 1G). It can be seen that miR-582-3p can target and bind PTPRCAP to play a role in LUAD.
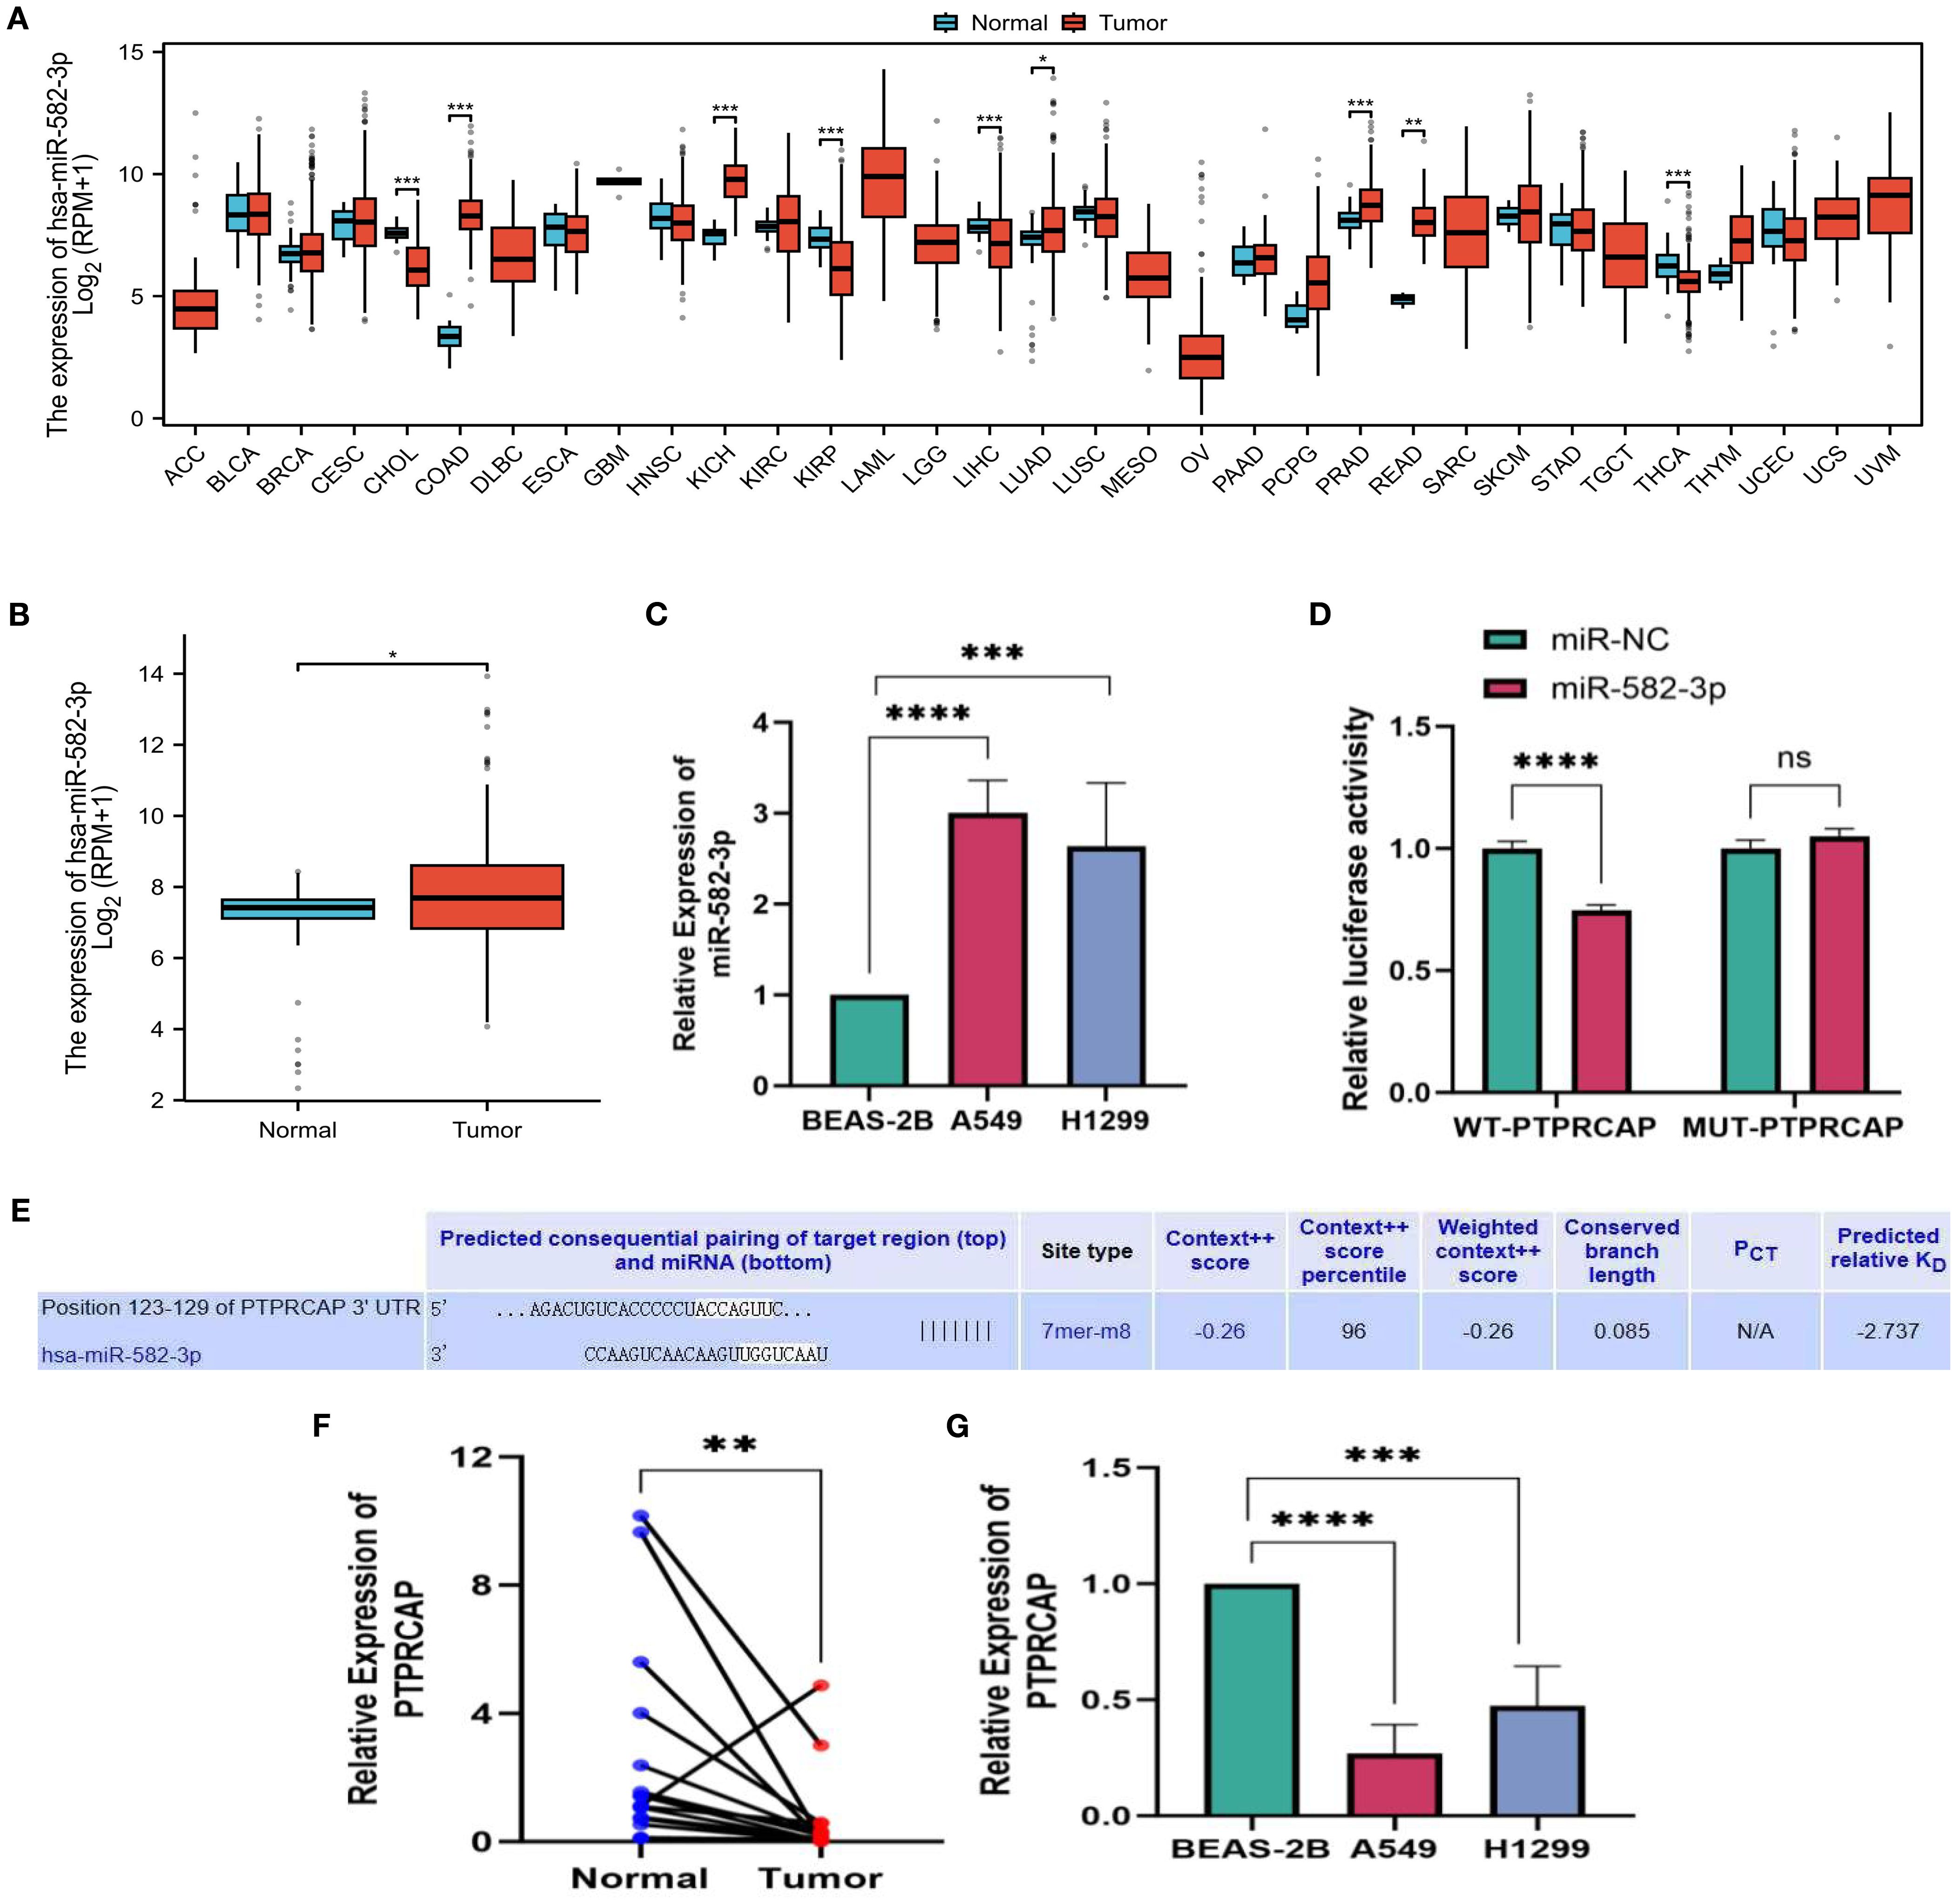
Figure 1. miR-582-3p, expression level of PTPRCAP. (A) Expression of miR-582-3p in 33 cancers in TCGA database. (B) Differential expression of miR-582-3p in TCGA-LUAD data. (C) Expression of miR-582-3p in BEAS-2B, A549 and H1299 cells (D) Luciferase reporter gene experiment of miR-582-3p target gene PTPRCAP. (E) Target Scan bioinformatics database predicts binding sites for miR-582-3p and PTPRCAP. (F) Relative expression of PTPRCAP in cancer tissues and adjacent tissues of 18 patients with lung adenocarcinoma (G) Relative expression of PTPRCAP mRNA in BEAS-2B, A549 and H1299 cells. *P < 0.05, **P < 0.01, ***P < 0.001, ****P < 0.001.
The relationship between miR-582-3p and clinicopathological features
In this study, we analyzed the relationship between miR-582-3p expression and clinicopathological features using miRNA-seq data from the TCGA-LUAD (The Cancer Genome Atlas–Lung Adenocarcinoma) dataset, processed according to the BCGSC pipeline. Our results demonstrated that miR-582-3p expression was significantly correlated with T stage, N stage, pathological stage, and overall survival (OS) (Figures 2A, B, D, I and Table 1), but not with M stage, sex, age, primary tumor location, or smoking status (Figures 2C, E-H and Table 1). Specifically, miR-582-3p expression was significantly elevated in T2, T3, and T4 stage patients compared to those with T1 disease (P = 0.005, 95%CI:0.118-0.626, Figure 2A). Similarly, N2 and N3 stage tumors exhibited markedly higher miR-582-3p levels than N0 and N1 stage cases (P = 0.006, 95%CI:0.144-0.882, Figure 2B). Furthermore, stage III and IV patients showed significantly increased miR-582-3p expression relative to stage I and II individuals (P < 0.001, 95%CI:0.296-0.937, Figure 2D). Deceased patients exhibited higher miR-582-3p expression than surviving patients (P < 0.001, 95%CI:0.194-0.735, Figure 2I). Notably, the high-expression group had a greater proportion of T2-T4 stage disease (36.1% vs. 30.5%, P = 0.010), higher rates of N2-N3 lymph node metastasis (9.3% vs. 5.7%, P = 0.032), and increased prevalence of stage III-IV tumors (13.0% vs. 8.0%, P = 0.006). Importantly, patients with elevated miR-582-3p expression exhibited significantly worse mortality (20.9% vs. 14.8%, P = 0.004) (Table 1). Cox regression analysis (Table 2), adjusted for TNM stage and other confounding factors, confirmed that high miR-582-3p expression remained an independent prognostic predictor (HR = 1.440, 95% CI: 1.018-2.037, P = 0.039). The hazard ratio was comparable to those of T2-T4 stage (HR = 1.629, P = 0.030) and stage III-IV disease (HR = 2.376, P = 0.014). Intriguingly, while the N/M stage demonstrated prognostic significance in univariate analysis, it lost statistical significance in the multivariate model. These findings suggest that miR-582-3p may influence lung adenocarcinoma progression by enhancing local invasion and lymph node metastasis (Table 1). Collectively, our results not only establish miR-582-3p as a novel prognostic biomarker but also uncover its biological relevance in key tumor progression pathways, providing a rationale for developing miR-582-3p-targeted precision diagnostic and therapeutic strategies.
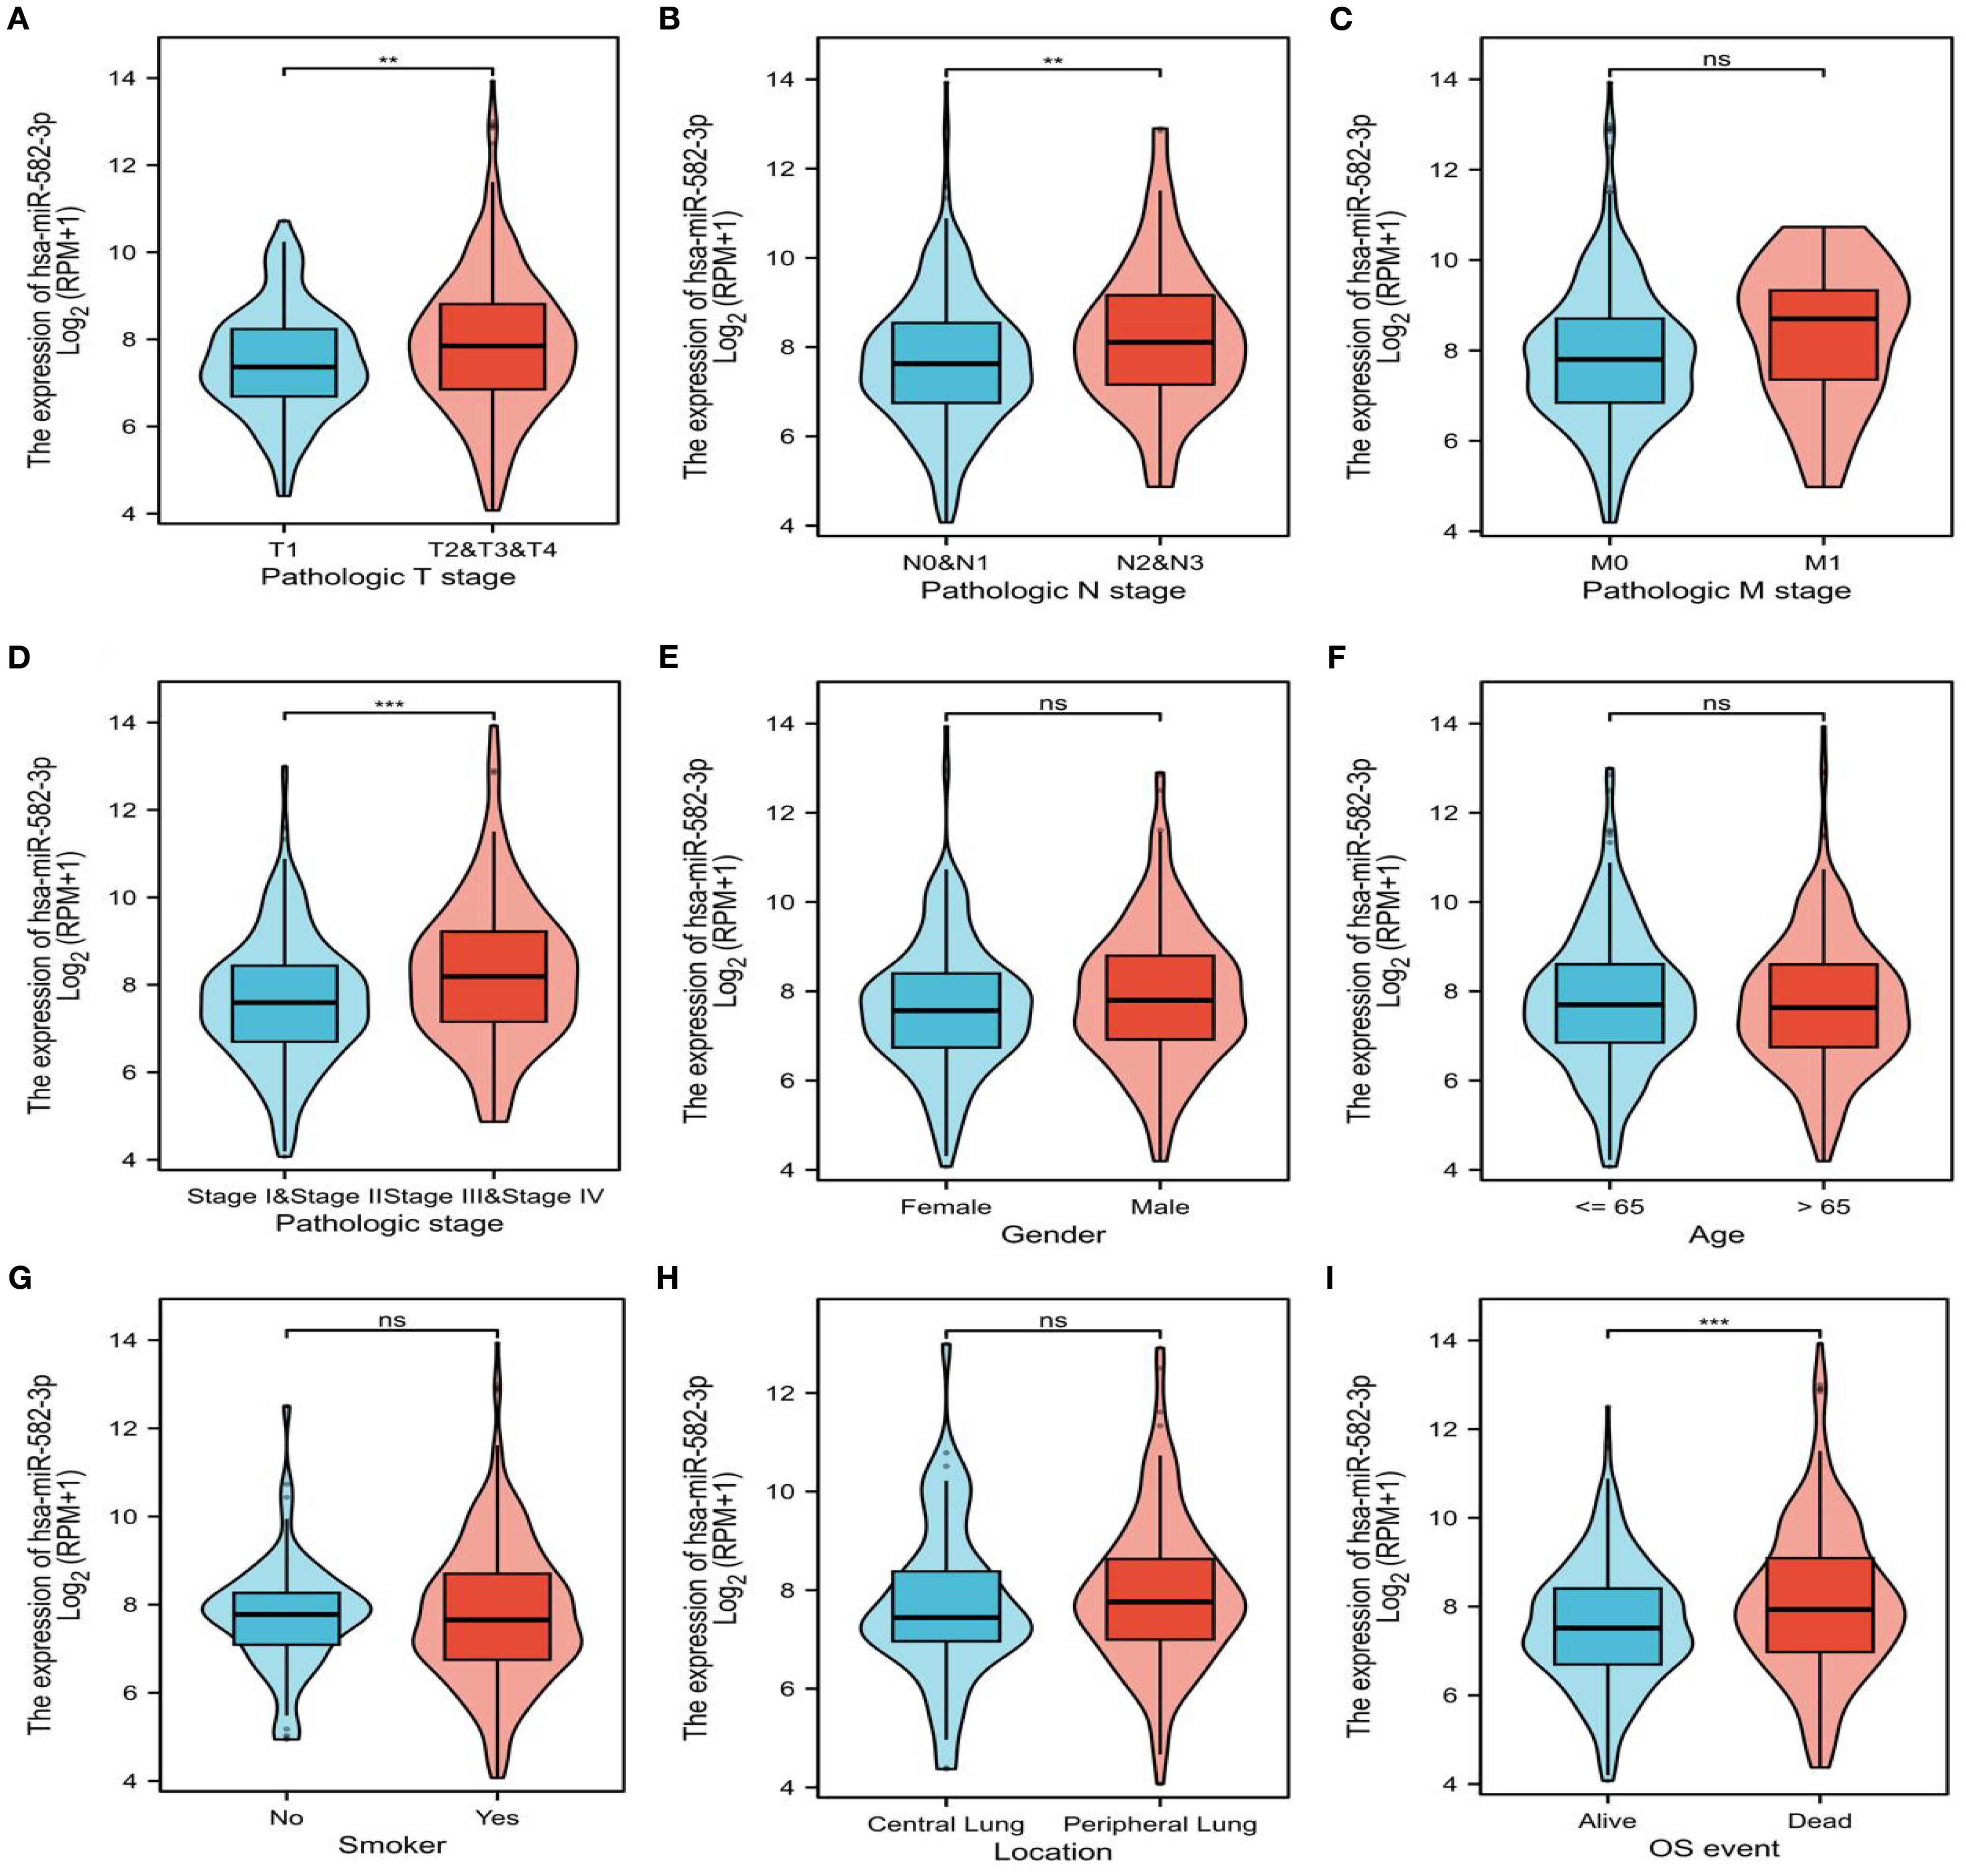
Figure 2. Expression of miR-582-3p in patients with different clinicopathological features and corresponding number of cases. (A) T staging (T1 = 178, T2 = 295, T3 & T4 = 68). (B) N stage (N0 = 352, N1 = 99, N2N3 = 77). (C) M stage (M0 = 370, M1 = 25). (D) Pathological stage (stage I = 298, stage II = 127, stage III = 85, stage IV = 26). (E) Gender (female = 291, male = 253). (F) Age (≤ 65 years = 258, > 65 years = 267). (G) Smokers (Yes = 453, No = 77). (H) Location (central lung = 64, peripheral lung = 127). (I) OS events (survival = 351, death = 193) **P < 0.01, ***P < 0.001.
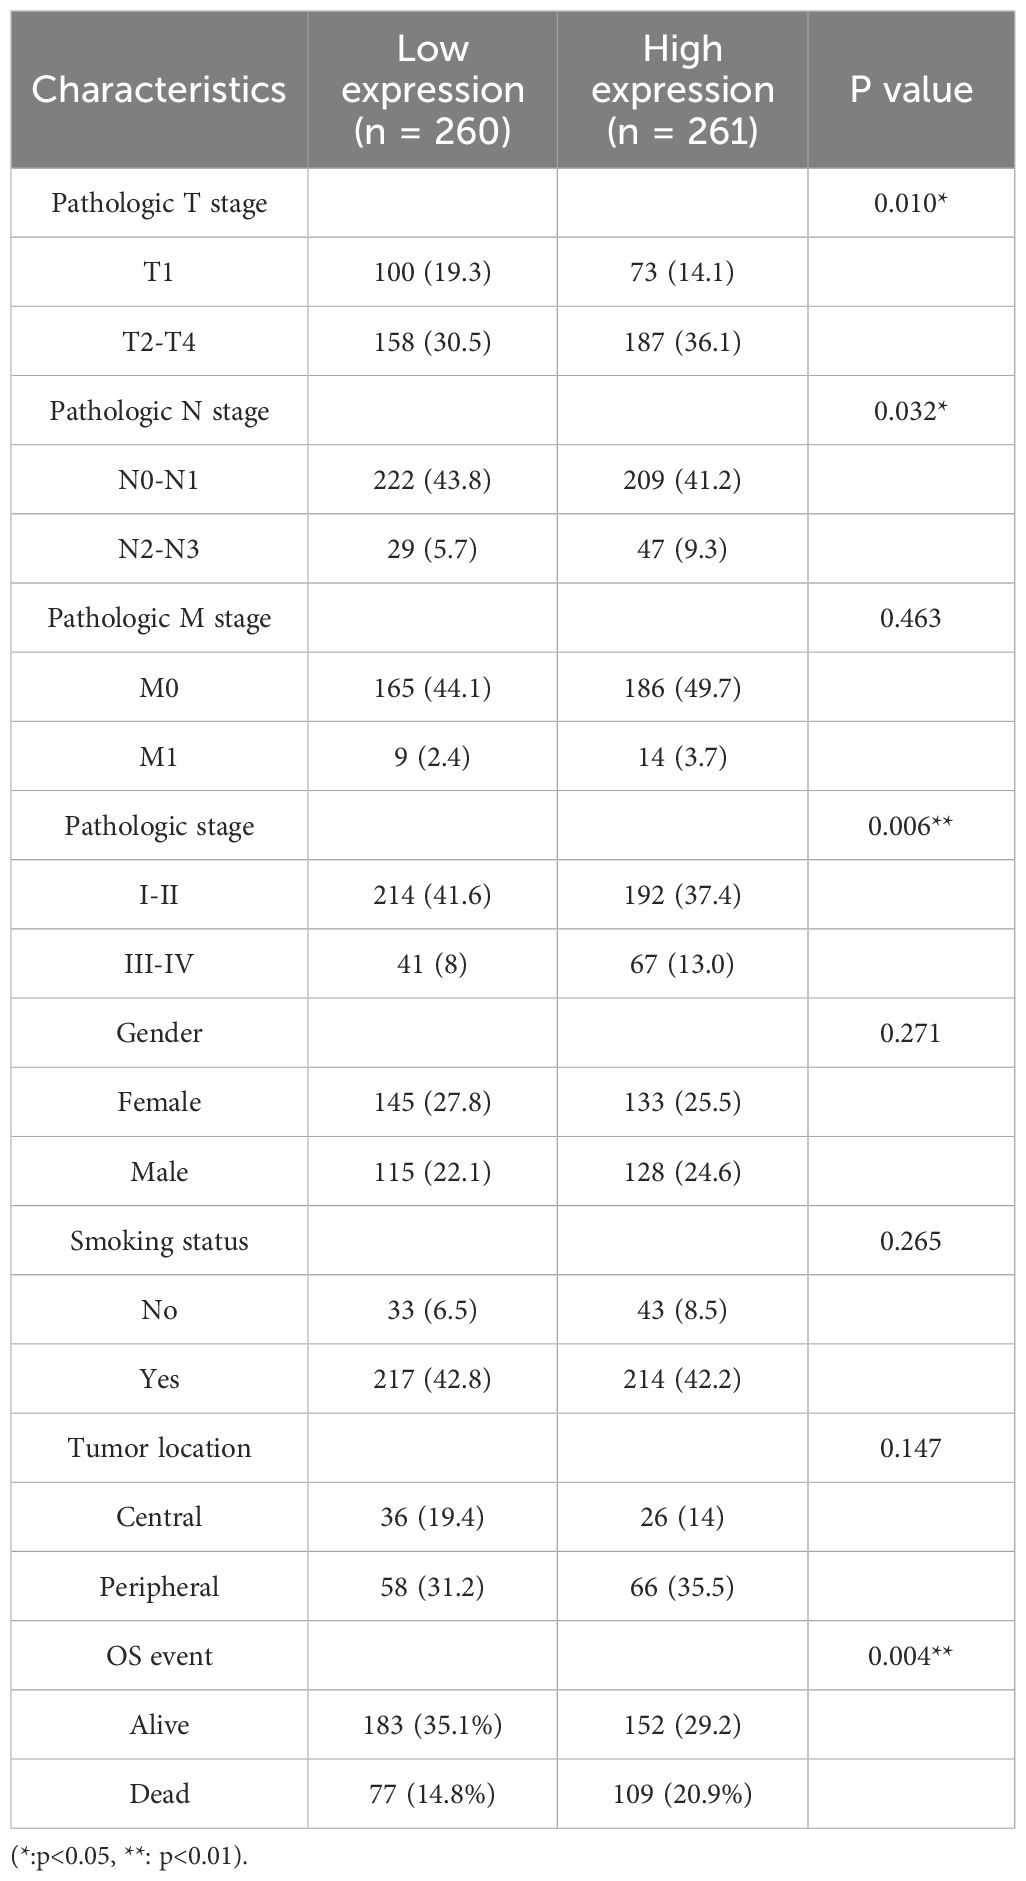
Table 1. Correlation of miR-582-3p expression with patients' clinicopathological features (n, %).
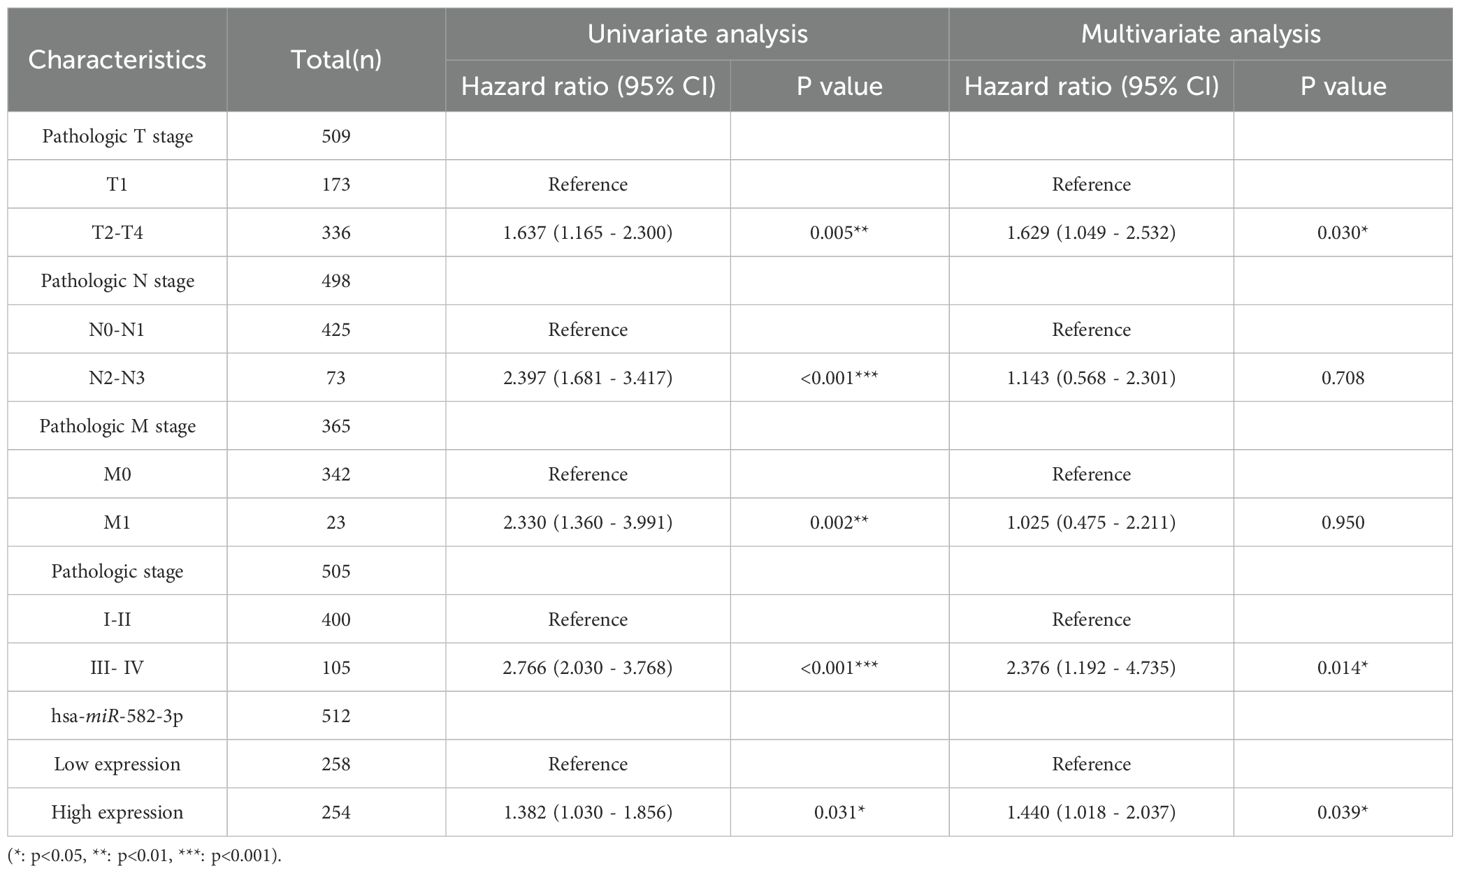
Table 2. Univariate and multivariate Cox regression analysis of prognostic factors.
Relationship between PTPRCAP and clinicopathological features and protein expression of PTPRCAP
The expression of PTPRCAP protein in normal lung epithelial cell line BEAS-2B and lung adenocarcinoma cell lines A549 and H1299 was detected by Western blot, and the expression of PTPRCAP protein in cancer tissues and adjacent tissues of 45 patients with lung adenocarcinoma was determined by immunohistochemistry, and the relationship between the expression level of PTPRCAP protein and clinical features was analyzed. The results of Western blot demonstrated a downregulation of PTPRCAP protein expression in lung adenocarcinoma cell lines A549 and H1299 compared to normal pulmonary epithelial BEAS-2B cells, with reductions of 20% (n = 3, P = 0.015) and 30% (n = 3, P = 0.01), respectively (Figures 3A, B). Immunohistochemical analysis of clinical samples revealed that the positive expression rate of PTPRCAP protein in cancerous tissue (22.22%, 10/45) was significantly lower than that in adjacent non-cancerous tissue (93.33%, 42/45), and the IRS score in the cancer group was significantly lower than that in the normal group (median = 1.8 (IQR 1.2–2.0) vs. median = 3.6 (IQR 2.8-4.0); Mann-Whitney U = 101, P < 0.0001, Figures 3C, D). There was a statistically significant difference in the positive expression rate of PTPRCAP in patients with different TNM stages and different degrees of tissue differentiation, but there was no statistically significant difference in the positive expression rate of PTPRCAP in patients with different ages, genders, and lymph node metastasis (Table 3). The above results indicate that PTPRCAP may play a certain inhibitory role in the occurrence and development of lung adenocarcinoma.
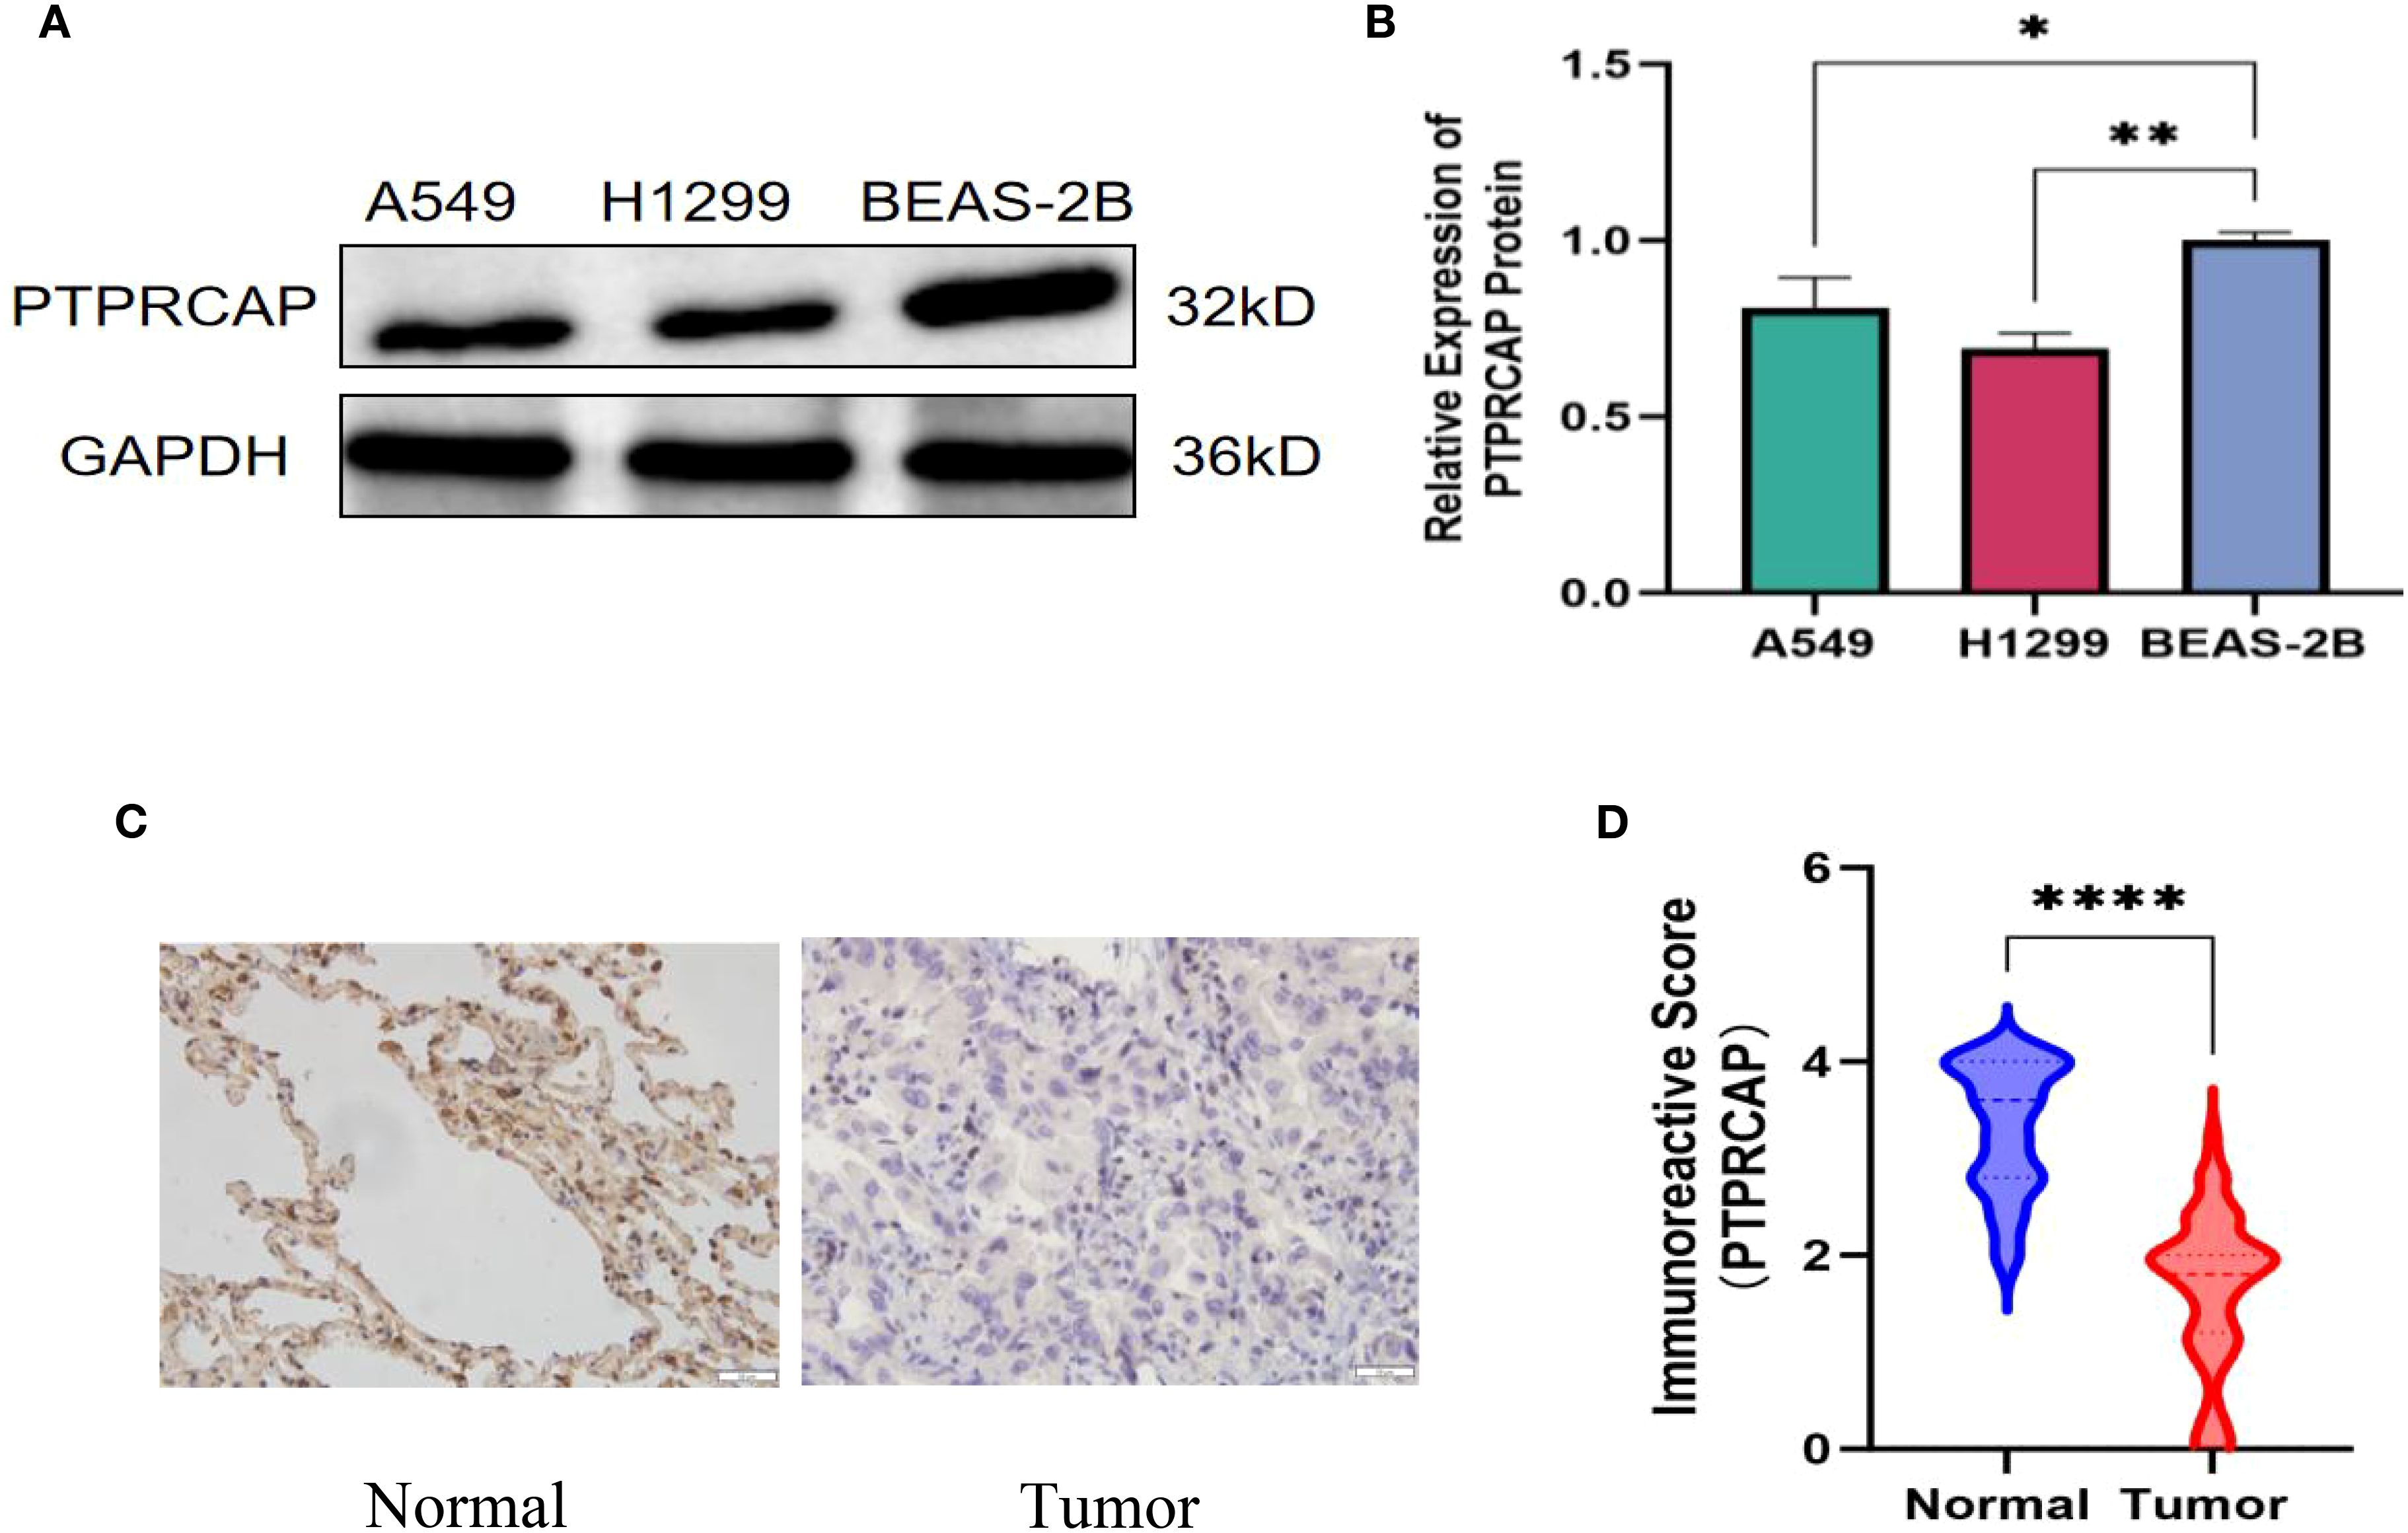
Figure 3. Protein expression of PTPRCAP. (A) Protein expression levels of PTPRCAP in BEAS-2B, A549 and H1299. (B) Comparison of protein expression of PTPRCAP in BEAS-2B, A549 and H1299. (C) Protein expression of PTPRCAP in lung adenocarcinoma cancer tissues and adjacent tissues. (D) Comparison of immunohistochemical scores of PTPRCAP protein expression in lung adenocarcinoma and adjacent tissues. *P < 0.05, **P < 0.01, ****P < 0.0001.
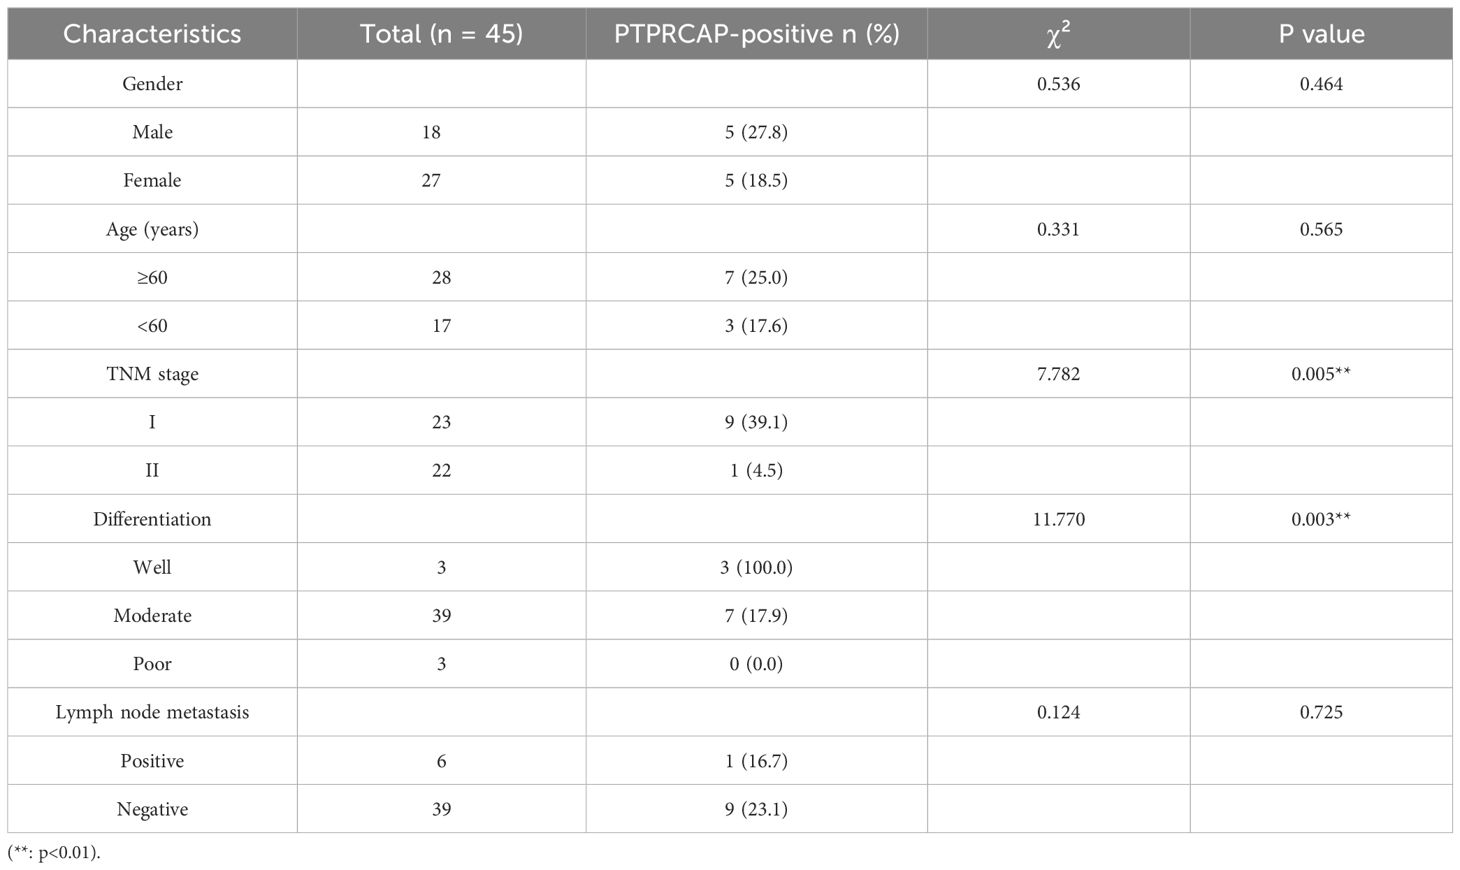
Table 3. Correlation of PTPRCAP expression with patients' clinicopathological features (n, %).
Verification of transfection efficiency of miR-582-3p, PTPRCAP
The control plasmids of miR-582-3p mimics, mimics NC, and PTPRCAP were transferred into A549 cells and H1299 cells with Lipofectamine 3000 transfection reagent, respectively, and divided into the miR-582-3p group, miR-NC group, OE group, and Vector group. The transfection efficiency of each group was verified by RT-qPCR and Western blot. After transfection of the PTPRCAP overexpression plasmid and the control plasmid, the transfection efficiency was initially revealed under the fluorescence microscope (n = 4, P < 0.001, Figure 4A). RT-qPCR results showed that in A549 and H1299 cells, miR-582-3p expression was significantly increased following transfection with miR-582-3p mimics compared to the negative control (n = 4, P < 0.01, Figure 4B). The expression of PTPRCAP was significantly higher in the OE group than in the Vector group (n = 4, P < 0.001, Figure 4C). This indicates that overexpression models were successfully constructed in lung adenocarcinoma cell lines A549 and H1299. After transfection with the overexpression plasmid, Western blot results showed that the protein expression of PTPRCAP in the OE group was significantly higher than that in the Vector group in the two cells (n = 3, P < 0.001, Figures 4D, E). Collectively, these findings suggest that each group of overexpression models has been stably constructed in A549 and H1299 cell lines, which can be used for subsequent experiments.
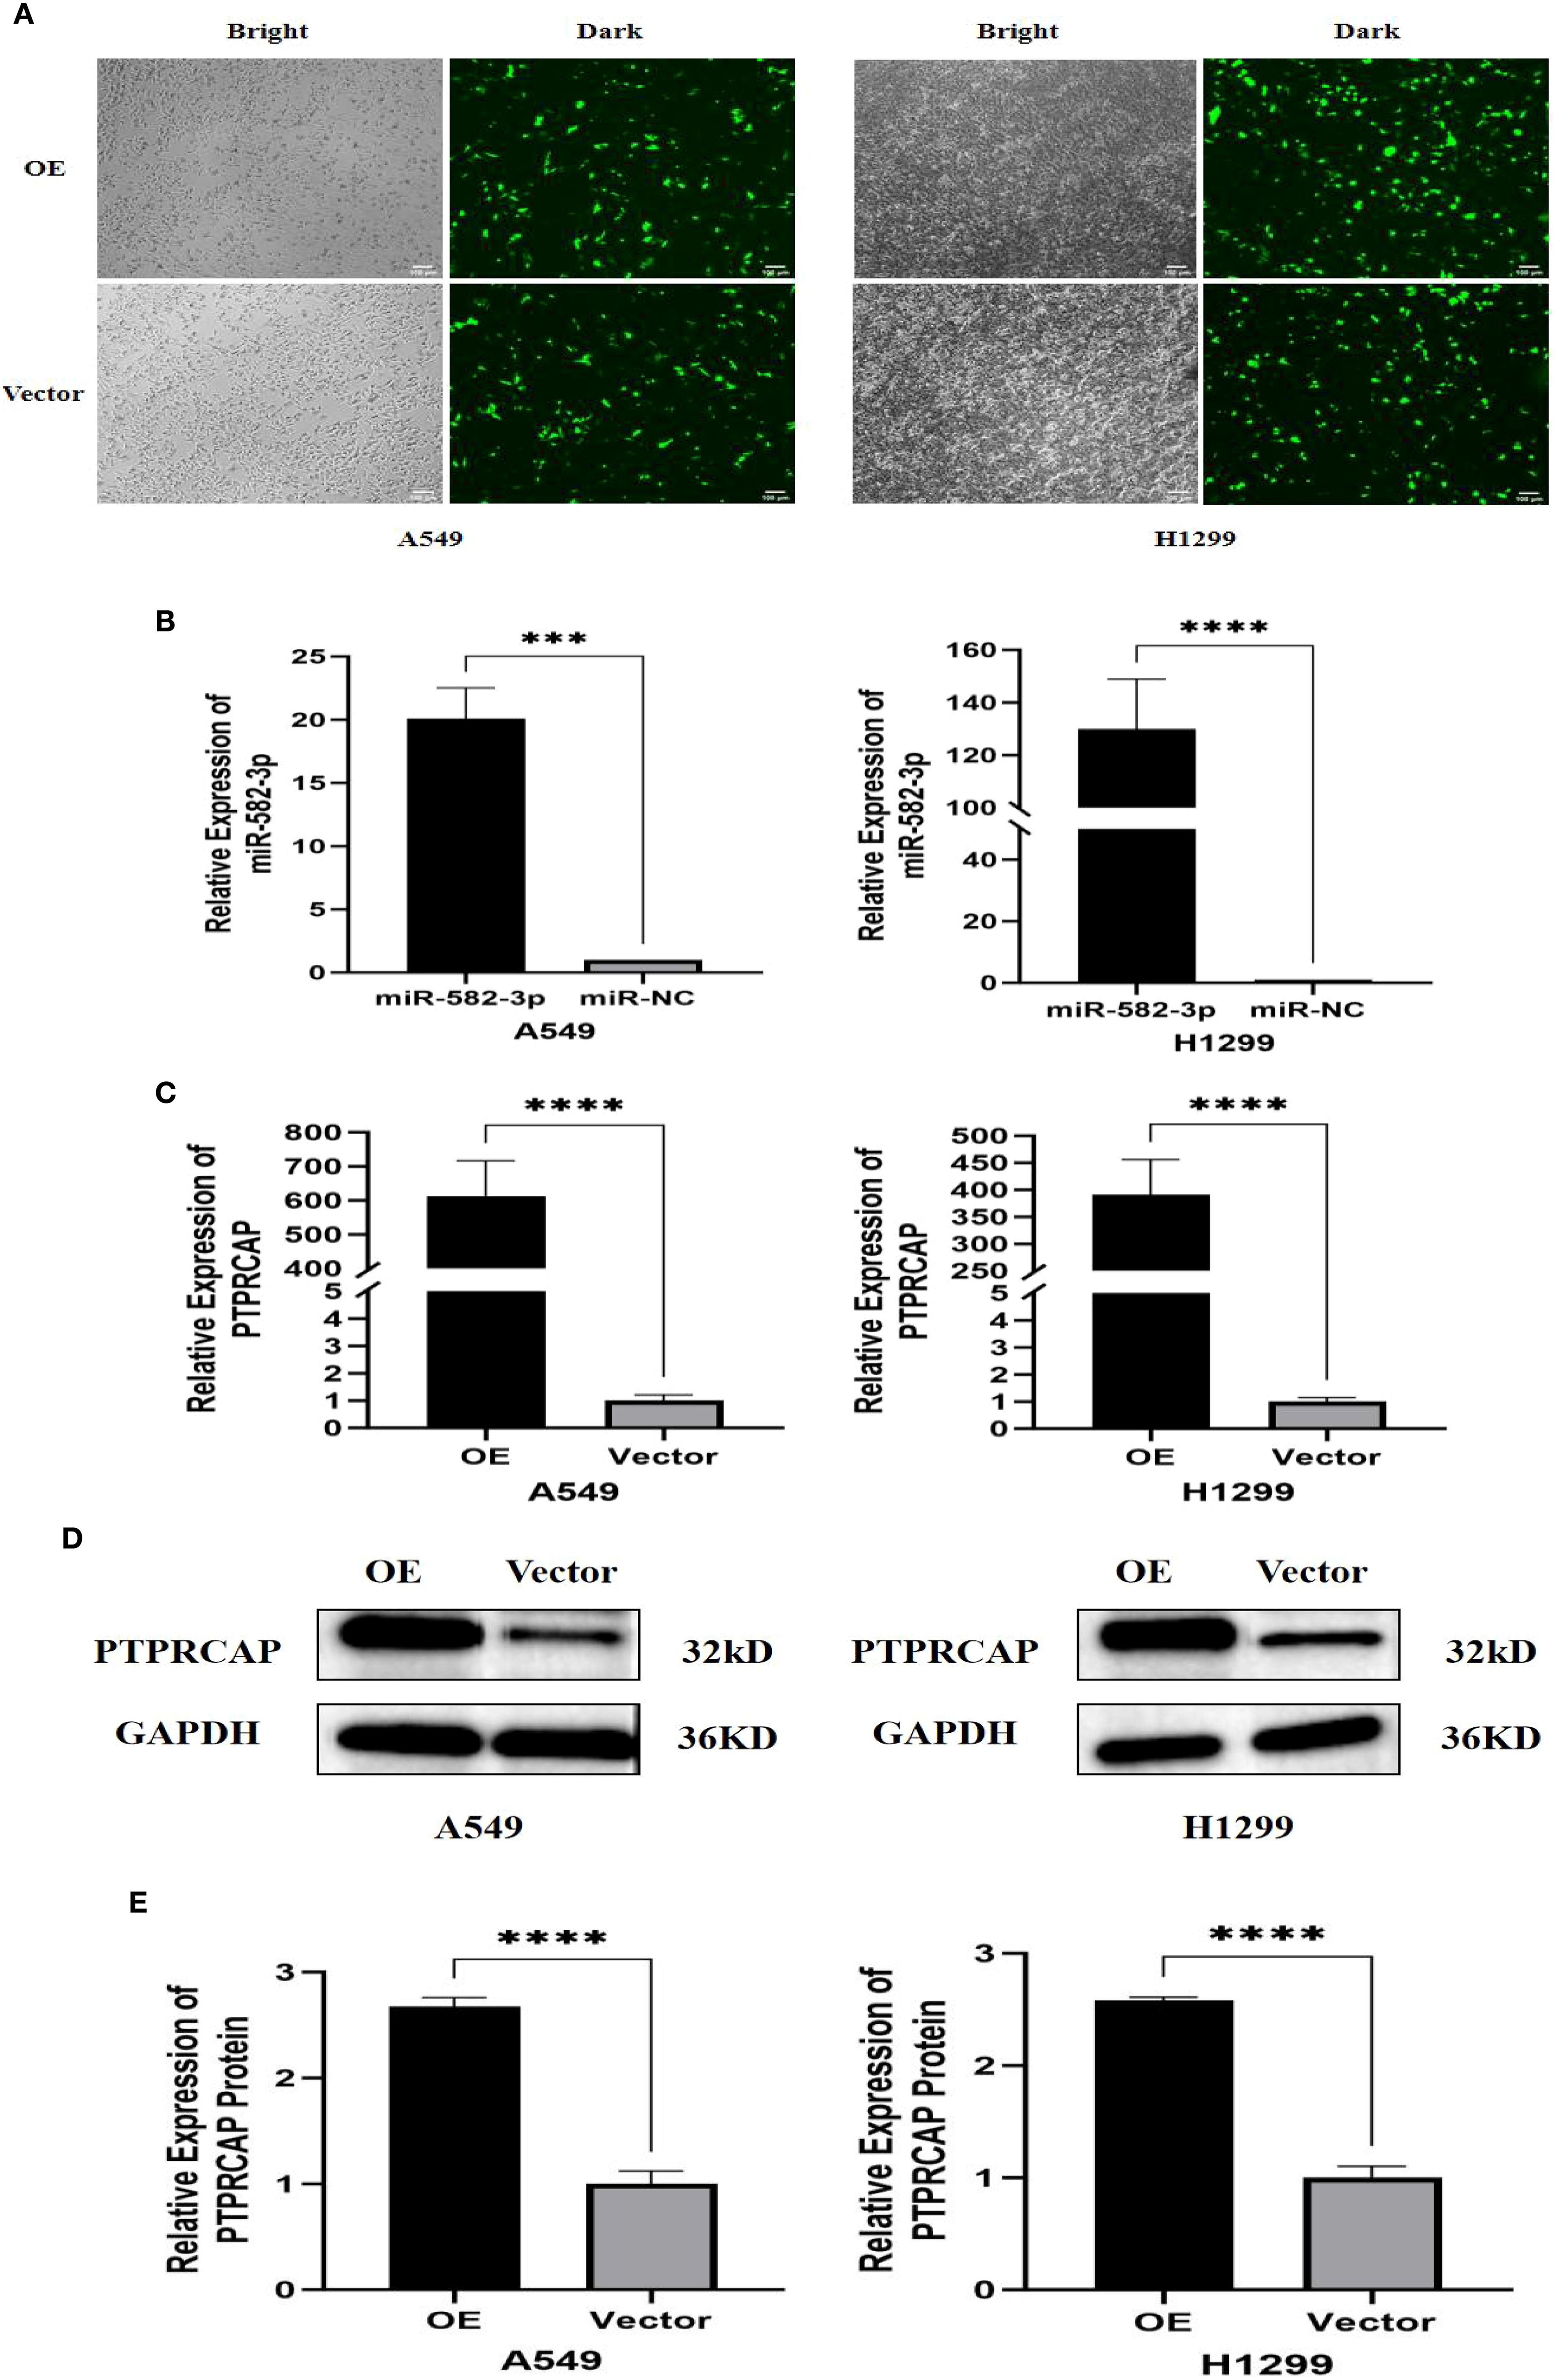
Figure 4. Validation of transfection efficiency of miR-582-3p and PTPRCAP. (A) Fluorescence transfection of PTPRCAP at A549 and H1299. (B) Comparison of transfection efficiency of miR-582-3p at A549 and H1299. (C) Comparison of transfection efficiency of PTPRCAP at A549 and H1299. (D) Protein expression levels of each group in A549 and H1299 cells after overexpression of PTPRCAP. (E) Protein expression comparison of groups in A549 and H1299 cells after overexpression of PTPRCAP. ***P < 0.001, ****P < 0.0001.
Effects of upregulated miR-582-3p on proliferation, migration, and invasion of lung adenocarcinoma A549 and H1299 cells
Following transfection with miR-582-3p mimics or negative control miRNA (miR-NC), A549 and H1299 cells were allocated into miR-582-3p and miR-NC groups, respectively. A series of functional assays, including CCK-8 proliferation, wound healing, Transwell migration and invasion, and flow cytometric apoptosis analysis, were conducted to assess the oncogenic effects of miR-582-3p. The CCK-8 assay revealed a significant enhancement in proliferative capacity in the miR-582-3p group compared to the miR-NC group for both A549 and H1299 cells (n = 3, P < 0.001; Figure 5A). Concordantly, wound healing assays demonstrated a markedly increased migratory ability in miR-582-3p-transfected cells (n = 6, P < 0.001; Figures 5B, C). Furthermore, Transwell assays confirmed substantial promotion of both migratory and invasive capacities, as evidenced by increased numbers of migrating and invading cells in the miR-582-3p group (n = 5, P < 0.001; Figures 5D, E). Collectively, these results demonstrate that miR-582-3p functions as an oncomiR by promoting proliferation, migration, and invasion in lung adenocarcinoma cells.
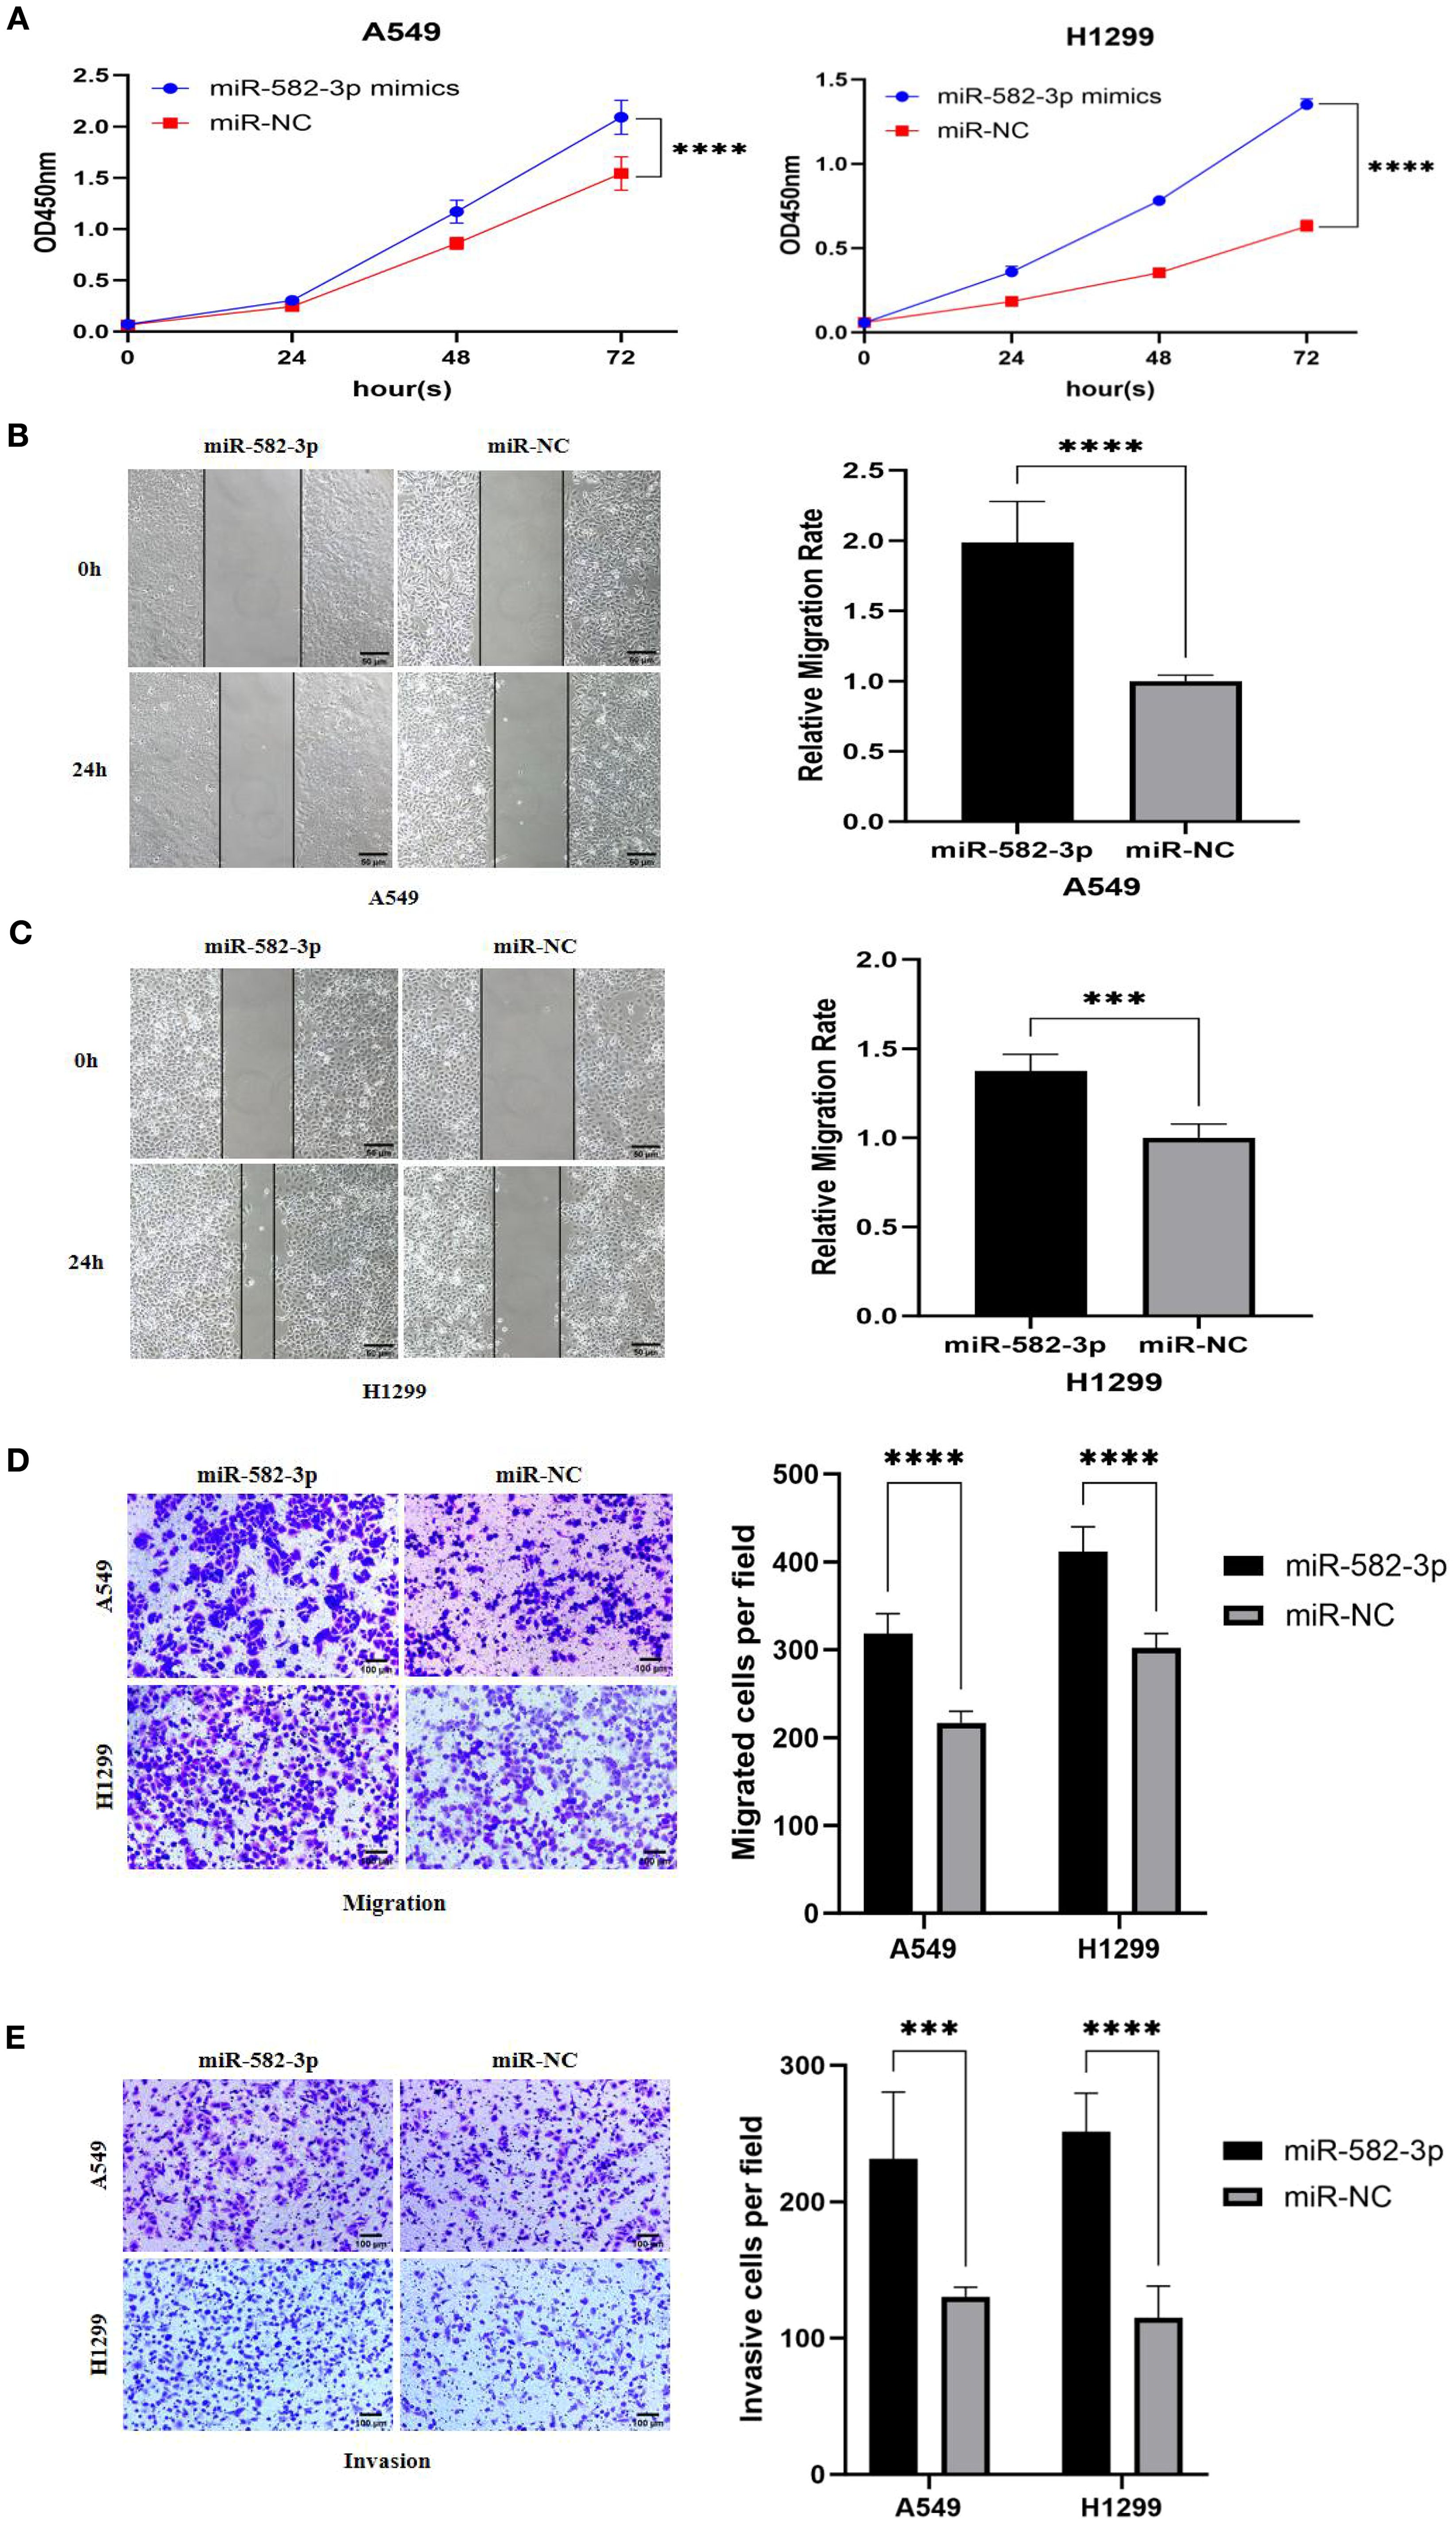
Figure 5. The effects of upregulating miR-582-3p on the proliferation, migration and invasion of lung adenocarcinoma A549 and H1299 cells. (A) CCK8 assay to detect the effect of upregulating miR-582-3p on the proliferation ability of A549 and H1299 cells. (B) Scratch assay to detect the effect of upregulating miR-582-3p on the migration ability of A549 cells. (C) Scratch assay to detect the effect of upregulating miR-582-3p on the migration ability of H1299 cells. (D) Transwell chamber migration assay to detect the effect of upregulating miR-582-3p on the migration ability of A549 and H1299 cells. (E) Transwell chamber invasion assay to detect the effect of upregulating miR-582-3p on the invasion ability of A549 and H1299 cells. ***P < 0.001, ****P < 0.0001.
Effects of overexpression of PTPRCAP on proliferation, migration, and invasion of lung adenocarcinoma A549 and H1299 cells
Functional phenotypic assays confirmed the significant tumor-suppressive role of PTPRCAP in lung adenocarcinoma cells. Following the establishment of stable PTPRCAP-overexpressing cell lines, functional analyses revealed that compared to the empty vector control (Vector) group, PTPRCAP overexpression markedly suppressed malignant phenotypes in both A549 and H1299 cells. Specifically, the CCK-8 proliferation assay demonstrated a significant reduction in cell viability after 72 hours, with OD values decreased by 64% and 60% in A549 and H1299 cells, respectively (n = 3; both P < 0.01; Figure 6A). Wound healing assays showed that the 24-hour wound closure rate was reduced by 50% and 57% in the two cell lines, respectively (n = 6; both P < 0.001; Figures 6B, C). Furthermore, Transwell assays indicated that the number of migrating cells was reduced by 34% and 37%, while the number of invading cells was decreased by 42% and 50%, respectively (n = 4; both P < 0.01; Figures 6D, E).
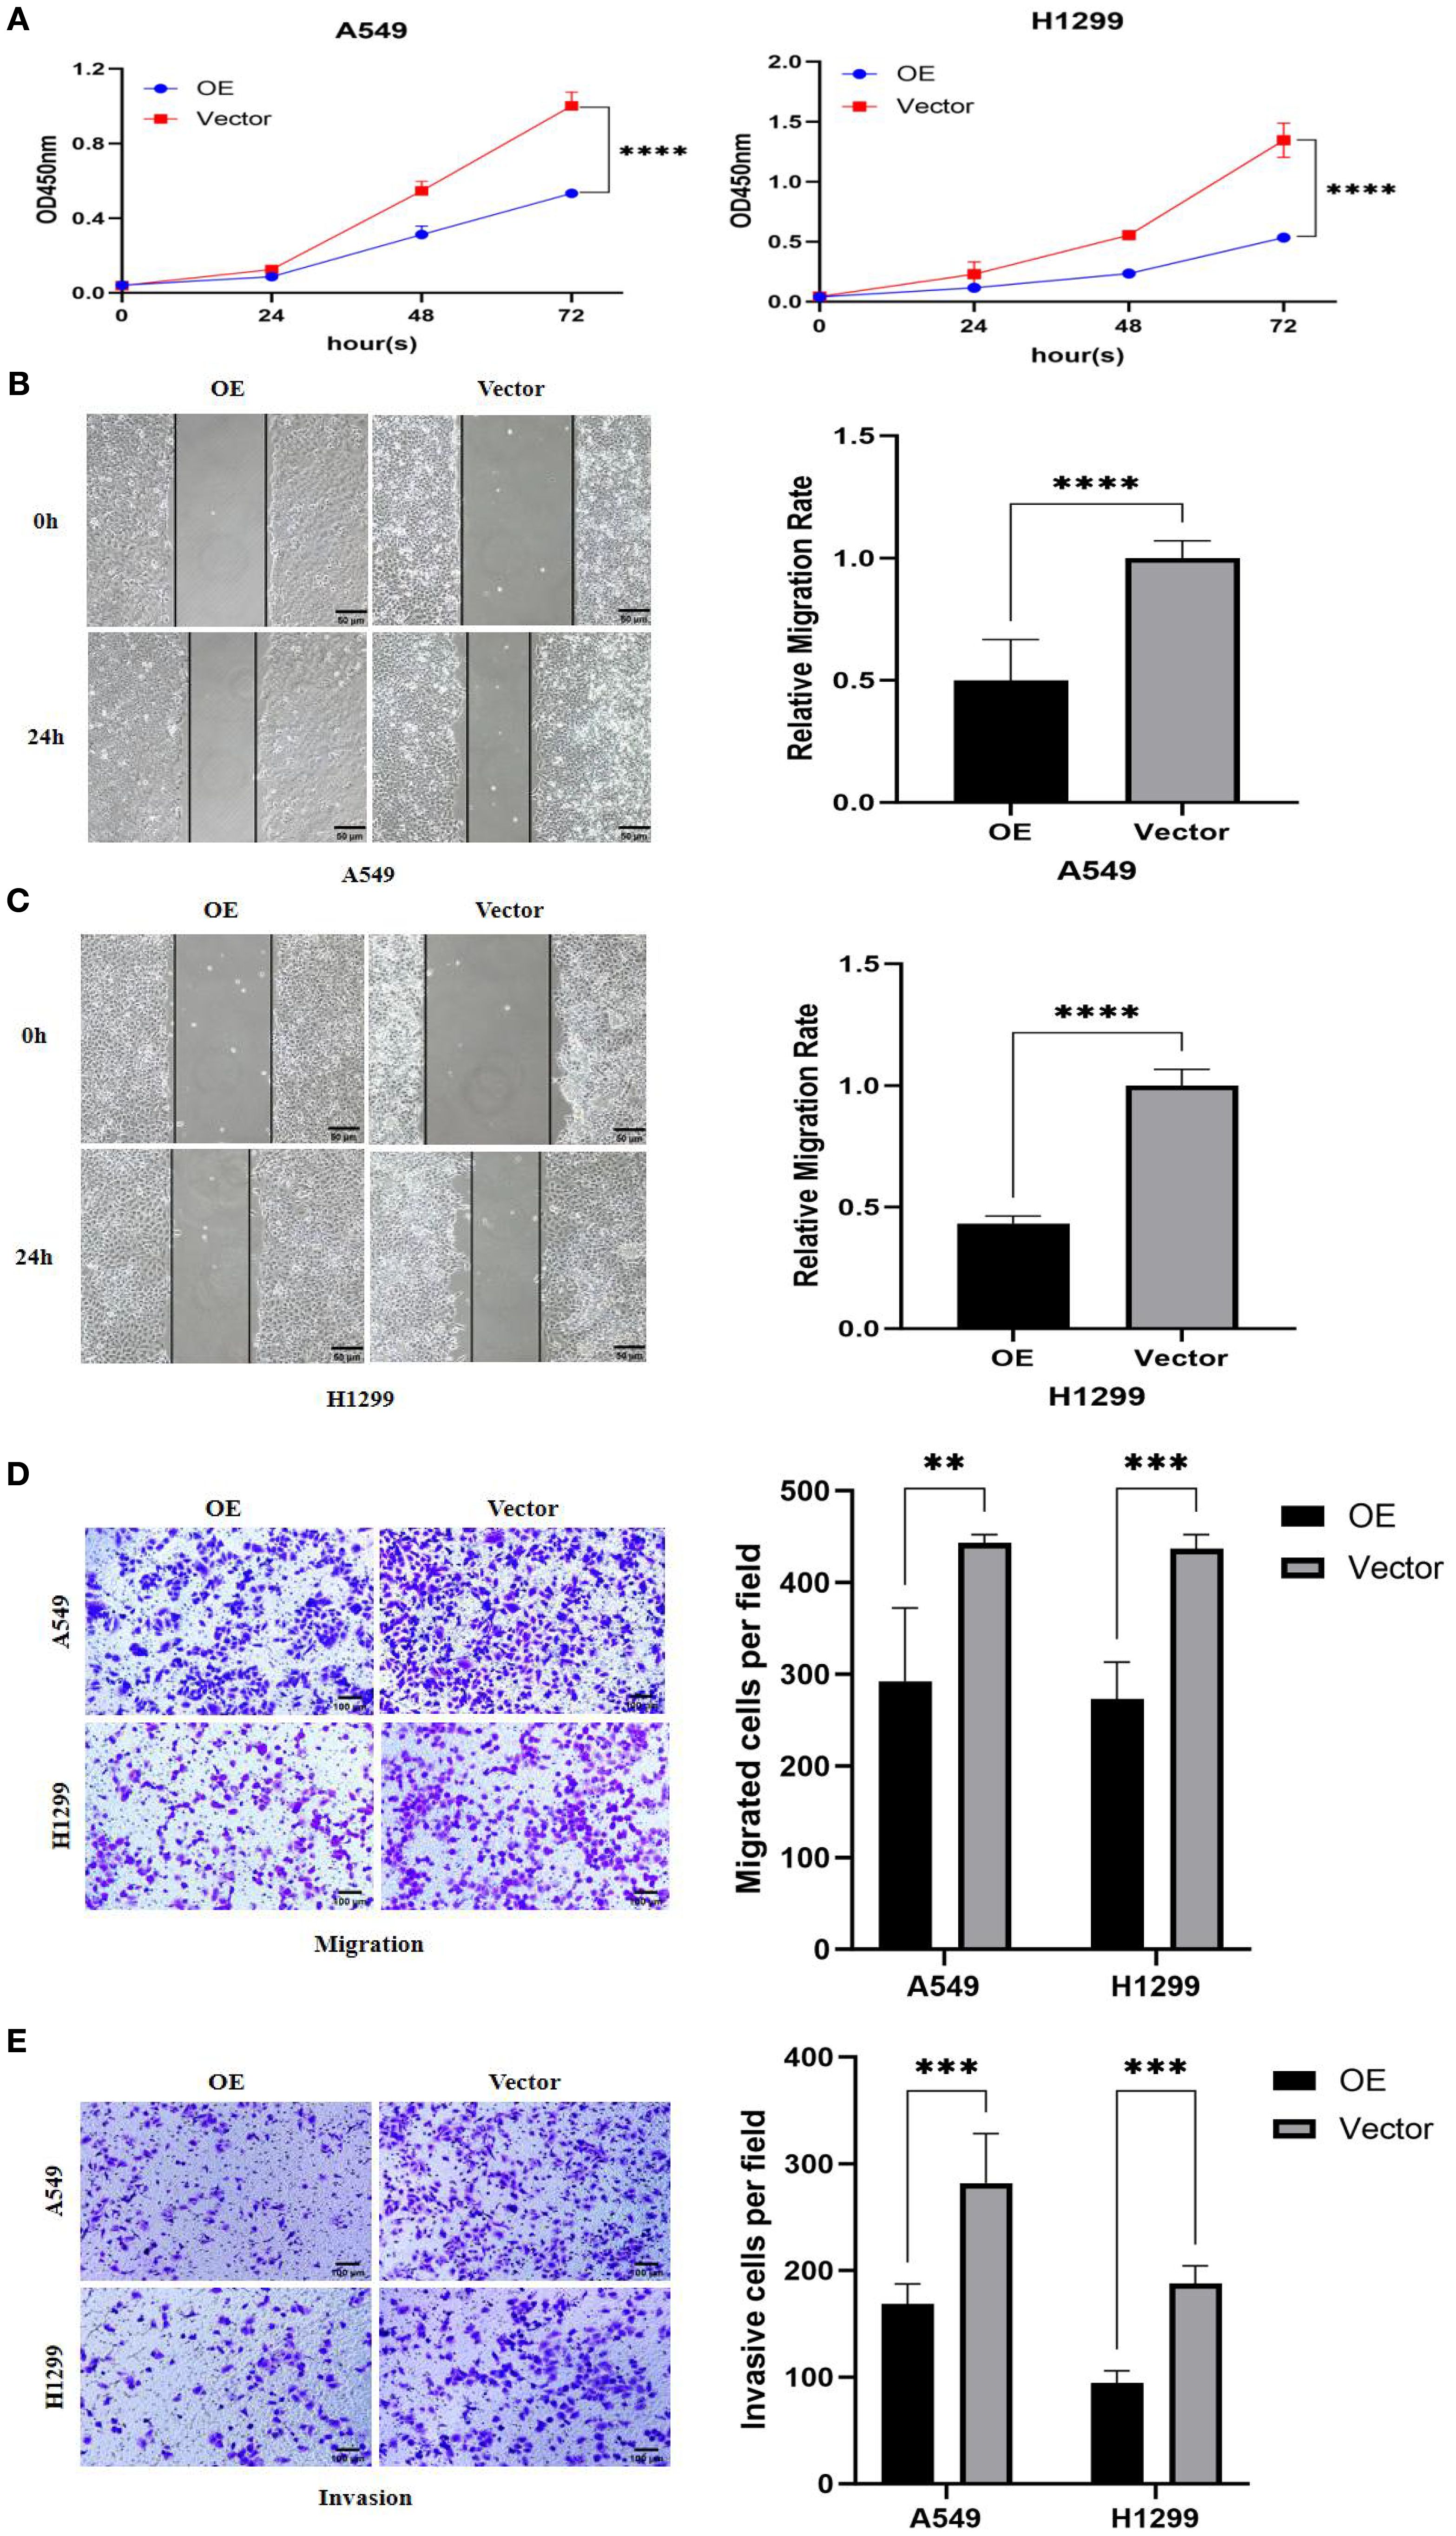
Figure 6. Effects of PTPRCAP overexpression on proliferation, migration and invasion of lung adenocarcinoma A549 and H1299 cells. (A) CCK8 detects the effect of overexpression of PTPRCAP on the proliferation ability of A549 and H1299 cells. (B) Scratch assay to detect the effect of overexpression of PTPRCAP on the migration ability of A549 cells. (C) Scratch assay to detect the effect of overexpression of PTPRCAP on the migration ability of H1299 cells. (D) The effect of overexpression of PTPRCAP on the migration ability of A549 and H1299 cells was examined by Trans well chamber migration assay. (E) Trans well chamber invasion assay to detect the effect of overexpression of PTPRCAP on the invasion ability of A549 and H1299 cells. **P < 0.01, ***P < 0.001, ****P < 0.0001.
Effect of upregulating miR-582-3p on the expression of PTPRCAP protein and Wnt/β-catenin pathway protein
To investigate the functional impact of miR-582-3p upregulation, we assessed the protein expression of PTPRCAP and key components of the Wnt/β-catenin signaling pathway, including GSK3β, p-GSK3β, and β-catenin, by Western blot analysis. Following miR-582-3p overexpression, PTPRCAP protein levels were significantly reduced in both lung adenocarcinoma cell lines, A549 and H1299. This downregulation was more pronounced in H1299 cells (80% reduction, n = 3, P < 0.001) than in A549 cells (20% reduction, n = 3, P = 0.030) (Figures 7A–D). Furthermore, miR-582-3p upregulation led to decreased protein expression of GSK3β, alongside increased levels of its phosphorylated form (p-GSK3β) and β-catenin in both cell lines, with the most notable change observed in β-catenin accumulation (Figures 7E–H). Quantitative analysis revealed that in A549 cells, GSK3β expression was reduced by 17% (n = 9, P = 0.004), while p-GSK3β and β-catenin levels were increased by 20% (n = 9, P = 0.011) and 115% (n = 9, P < 0.0001), respectively. Similarly, in H1299 cells, GSK3β expression decreased by 25% (n = 9, P = 0.002), whereas p-GSK3β and β-catenin levels increased by 23% (n = 9, P = 0.005) and 80% (n = 9, P < 0.0001), respectively. Collectively, these results suggest that miR-582-3p-mediated regulation of PTPRCAP may potentially function through the activation of the Wnt/β-catenin signaling pathway.

Figure 7. Effect of up-regulation of miR-582-3p on the expression of PTPRCAP protein and Wnt/β-catenin pathway protein. (A) Comparison of protein expression levels and relative expression levels of PTPRCAP in A549 after upregulation of miR-582-3p. (B) Comparison of protein expression and relative protein expression of PTPRCAP in H1299 after up-regulation of miR-582-3p. (C) Comparison of protein expression and relative protein expression levels of GSK3β, p-GSK3β and β-catenin in A549 cells after up-regulation of miR-582-3p. (D) Comparison of protein expression levels and relative protein expression levels of GSK3β, p-GSK3β and β-catenin in H129 9 cells after up-regulation of miR-582-3p. *P < 0.05, **P < 0.01, ***P < 0.001, ****P < 0.001.
Effect of overexpression of PTPRCAP on protein expression of the Wnt/β-catenin pathway
To investigate the regulatory role of PTPRCAP in the Wnt/β-catenin signaling pathway, we examined the protein expression levels of key pathway components—GSK3β, p-GSK3β, and β-catenin—following PTPRCAP overexpression via Western blot analysis. The results demonstrated that PTPRCAP overexpression in lung adenocarcinoma A549 and H1299 cells significantly increased GSK3β expression while decreasing both p-GSK3β and β-catenin levels (Figures 8A, B). Specifically, in A549 cells, GSK3β protein levels were elevated by 23% (n = 3, P = 0.001), whereas p-GSK3β and β-catenin were reduced by 22% (n = 3, P = 0.001) and 31% (n = 3, P < 0.0001), respectively. Similarly, in H1299 cells, GSK3β expression increased by 23% (n = 3, P = 0.008), while p-GSK3β and β-catenin levels decreased by 43% (n = 3, P < 0.0001) and 22% (n = 3, P = 0.011), respectively. These findings suggest that PTPRCAP may suppress the activation of the Wnt/β-catenin pathway by upregulating GSK3β expression, inhibiting its phosphorylation, and consequently promoting β-catenin degradation. This mechanism potentially represents a crucial aspect of PTPRCAP’s tumor-suppressive function.

Figure 8. Effects of PTPRCAP overexpression on the protein expression of Wnt/β-catenin pathway components. (A) Protein expression levels and quantitative comparison of GSK3β, p-GSK3β, and β-catenin in A549 cells following PTPRCAP overexpression. (B) Protein expression levels and quantitative comparison of GSK3β, p-GSK3β, and β-catenin in H1299 cells following PTPRCAP overexpression. *p<0.05. **p<0.01 ***p<0.001 ****p<0.0001.
Effects of co-transfection of miR-582-3p mimics and PTPRCAP plasmid on proliferation, migration, and invasion of lung adenocarcinoma A549 and H1299 cells
Rescue experiments were performed to investigate whether PTPRCAP overexpression could reverse the oncogenic effects of miR-582-3p. In A549 and H1299 lung adenocarcinoma cells, co-transfection with miR-582-3p mimics and either a PTPRCAP overexpression plasmid (miR-582-3p+OE group) or an empty vector control (miR-582-3p+Vector group) was conducted. Malignant phenotypes were subsequently assessed using CCK-8 proliferation, wound healing, and transwell migration and invasion assays. Compared to the miR-582-3p+Vector group, the miR-582-3p+OE group exhibited a significant reduction in proliferative capacity in both cell lines (n = 3, P < 0.0001; Figure 9A). Consistently, wound healing assays demonstrated markedly impaired migratory ability in the miR-582-3p+OE group, with wound closure rates reduced by 64% (A549, n = 4, P = 0.0001) and 30% (H1299, n = 4, P < 0.0001) (Figure 9B, C). Furthermore, Transwell assays revealed that the number of migrating cells was decreased by 38% (A549, n = 4, P < 0.0001) and 33% (H1299, n = 4, P = 0.002), while the number of invading cells was reduced by 27% (A549, n = 4, P < 0.001) and 52% (H1299, n = 4, P < 0.0001) in the miR-582-3p+OE group (Figures 9D, E). These rescue results suggest that the restoration of PTPRCAP expression effectively reverses the tumor-promoting phenotypes induced by miR-582-3p overexpression, supporting the conclusion that miR-582-3p likely promotes malignant progression in lung adenocarcinoma cells, at least in part, through targeted suppression of PTPRCAP.
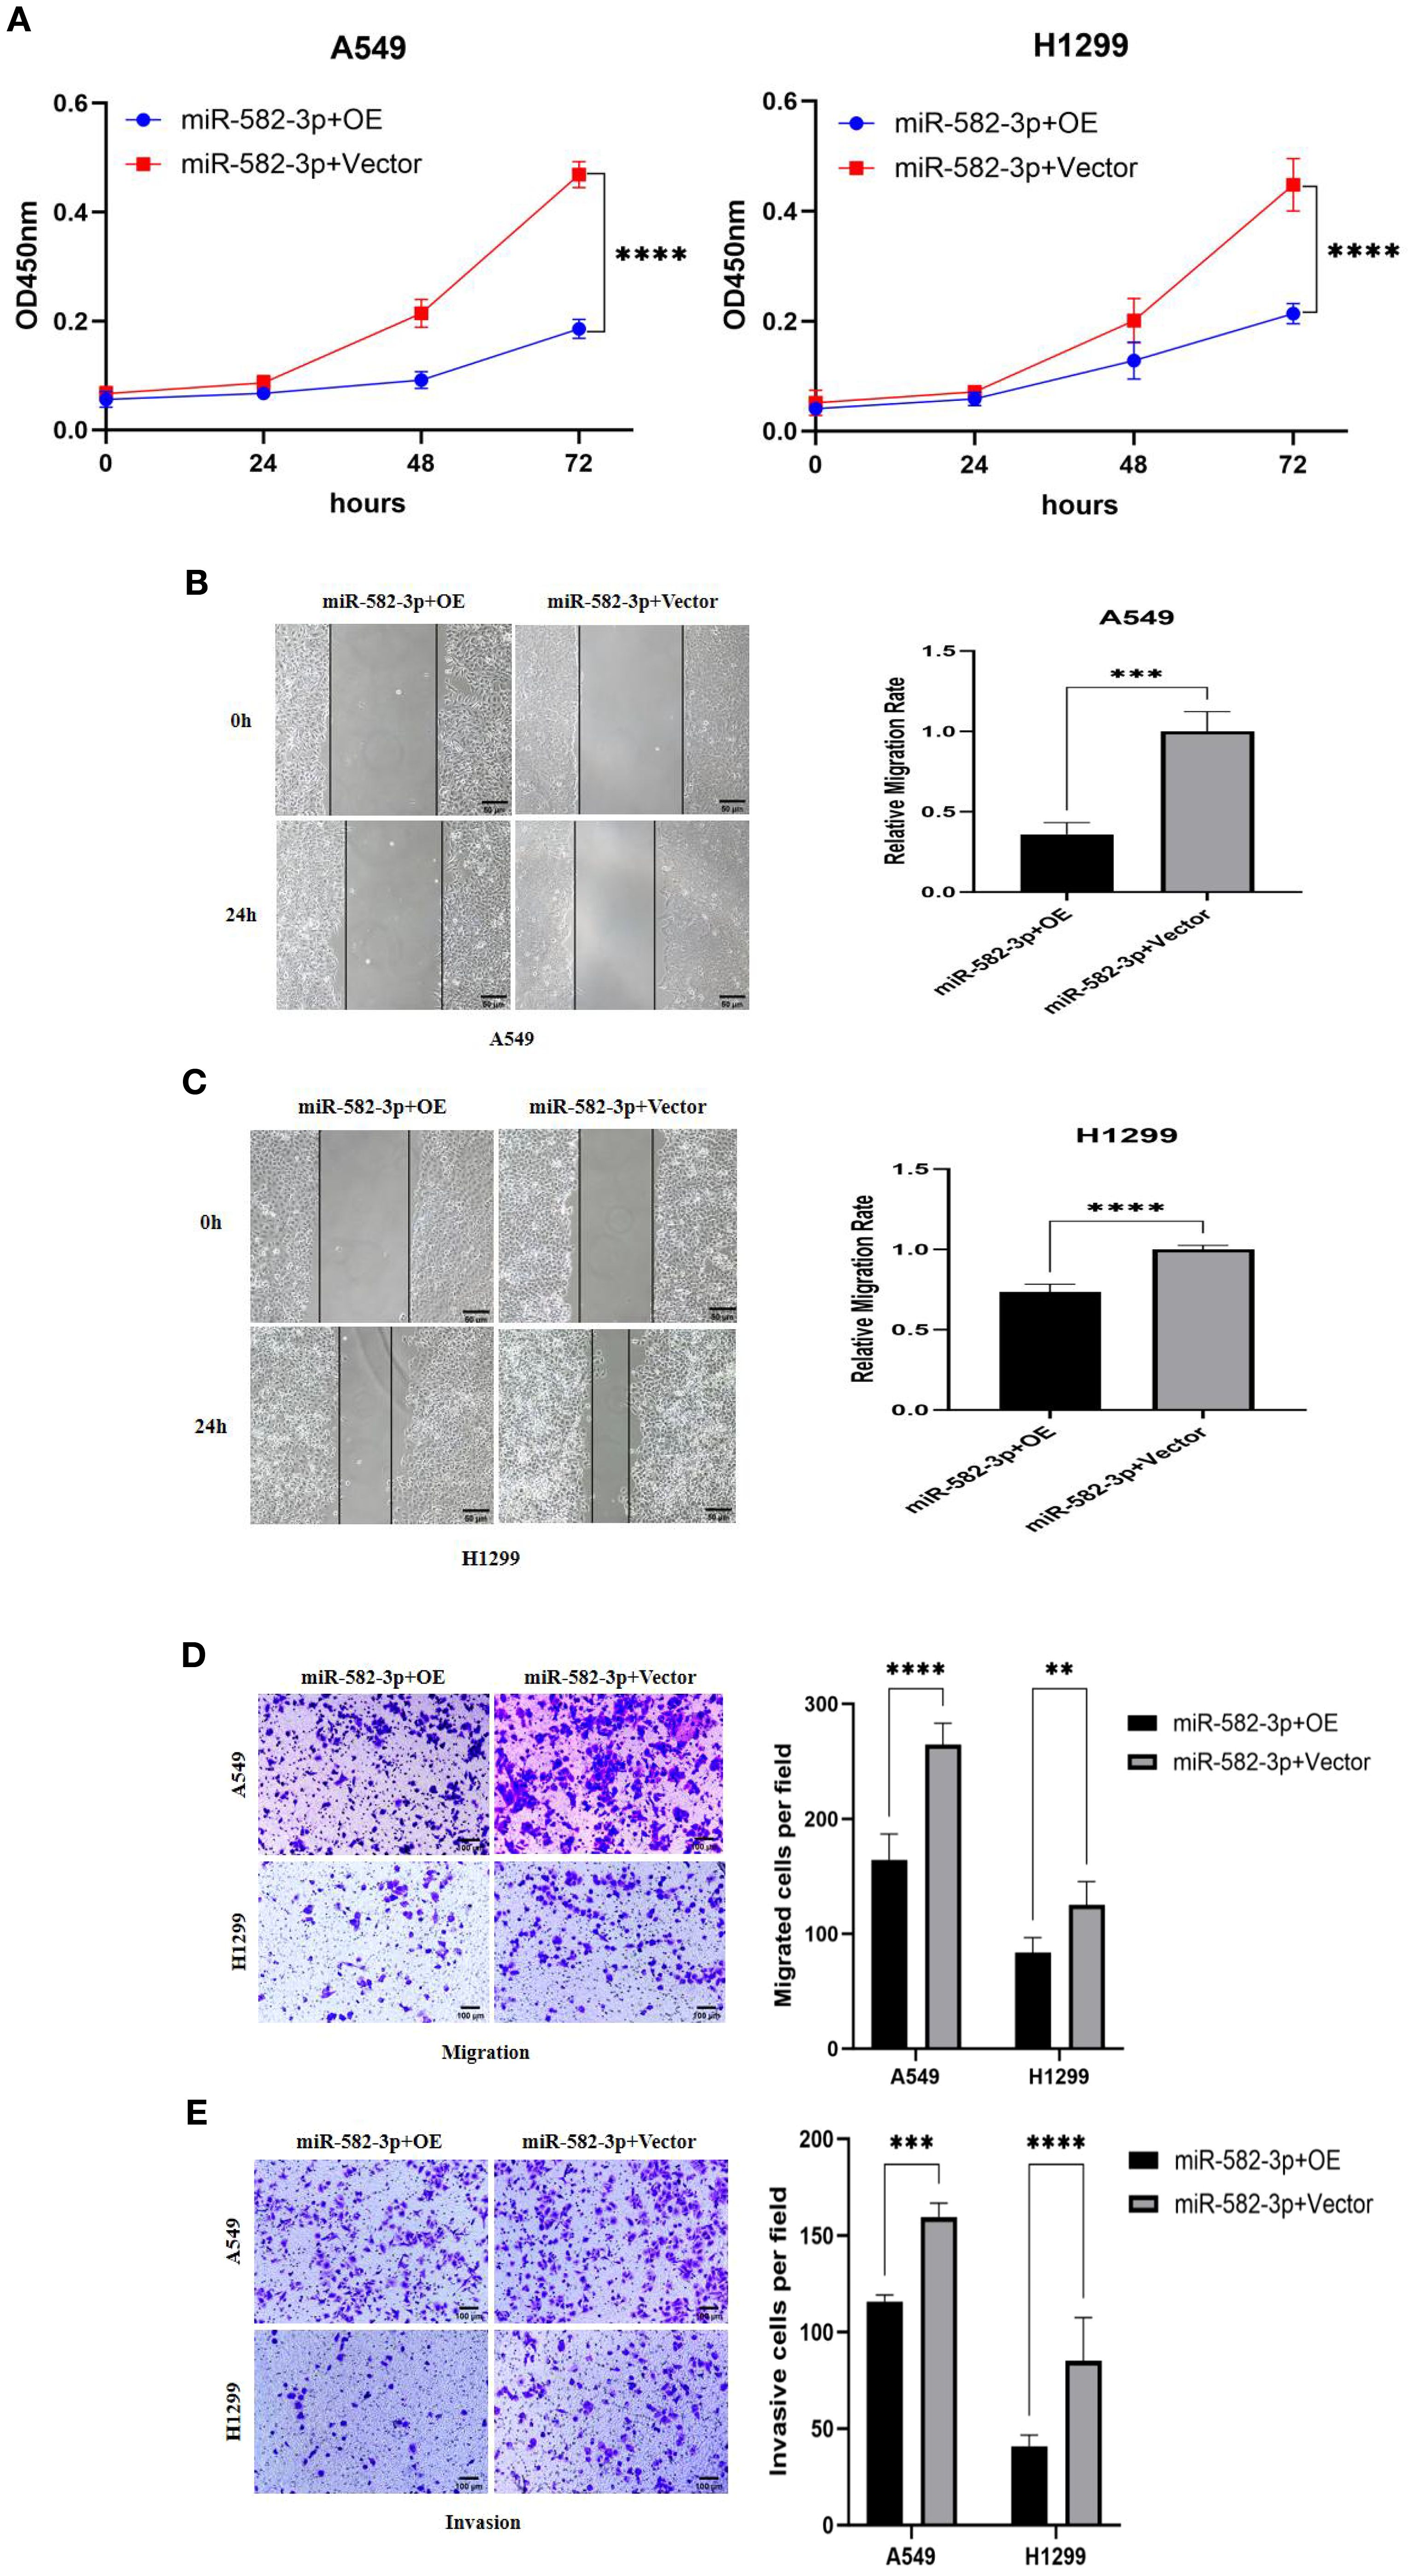
Figure 9. Effects of co-transfection of miR-582-3p and PTPRCAP on proliferation, migration and invasion of lung adenocarcinoma A549 and H1299 cells. (A) CCK8 assay was used to detect the effect of co-transfection of miR-582-3p and PTPRCAP on the proliferation ability of A549 and H1299 cells. (B) Scratch assay was used to detect the effect of co-transfection of miR-582-3p and PTPRCAP on the migration ability of A549 cells. (C) Scratch assay was used to detect the effect of co-transfection of miR-582-3p and PTPRCAP on the migration ability of H1299 cells. (D) Transwell chamber migration assay was used to detect the effect of co-transfection of miR-582-3p and PTPRCAP on the migration ability of A549 and H1299 cells. (E) Transwell chamber invasion assay was used to detect the effect of co-transfection of miR-582-3p and PTPRCAP on the invasion ability of A549 and H1299 cells. **P < 0.01, ***P < 0.001, ****P < 0.001.
Effects of co-transfection of miR-582-3p mimics and PTPRCAP plasmid on the expression of PTPRCAP protein and Wnt/β-catenin pathway protein
To investigate the regulatory relationship between miR-582-3p and PTPRCAP within the Wnt/β-catenin pathway, we co-transfected A549 and H1299 cells with miR-582-3p mimics and a PTPRCAP overexpression plasmid, followed by Western blot analysis to evaluate expression changes of PTPRCAP and key Wnt/β-catenin signaling proteins. Compared to the corresponding control group, the miR-582-3p+OE group showed a significant upregulation of PTPRCAP protein expression, with approximately 3-fold and 2-fold increases in A549 (n = 3, P = 0.005) and H1299 cells (n = 3, P = 0.007), respectively (Figures 10A, B). Concurrently, this intervention markedly affected the Wnt/β-catenin pathway: GSK3β protein levels increased in both cell lines, while levels of p-GSK3β and β-catenin were significantly reduced (Figures 10C, D). Specifically, in A549 cells, GSK3β increased by 10% (n = 3, P = 0.033), p-GSK3β decreased by 60% (n = 9, P < 0.0001), and β-catenin was reduced by 40% (n = 7, P < 0.0001). In H1299 cells, GSK3β rose by 24% (n = 3, P = 0.008), p-GSK3β declined by 58% (n = 9, P < 0.0001), and β-catenin decreased by 31% (n = 9, P < 0.0001). These results provide reverse genetic evidence suggesting that miR-582-3p may modulate the activity of the Wnt/β-catenin signaling pathway by targeted suppression of PTPRCAP.
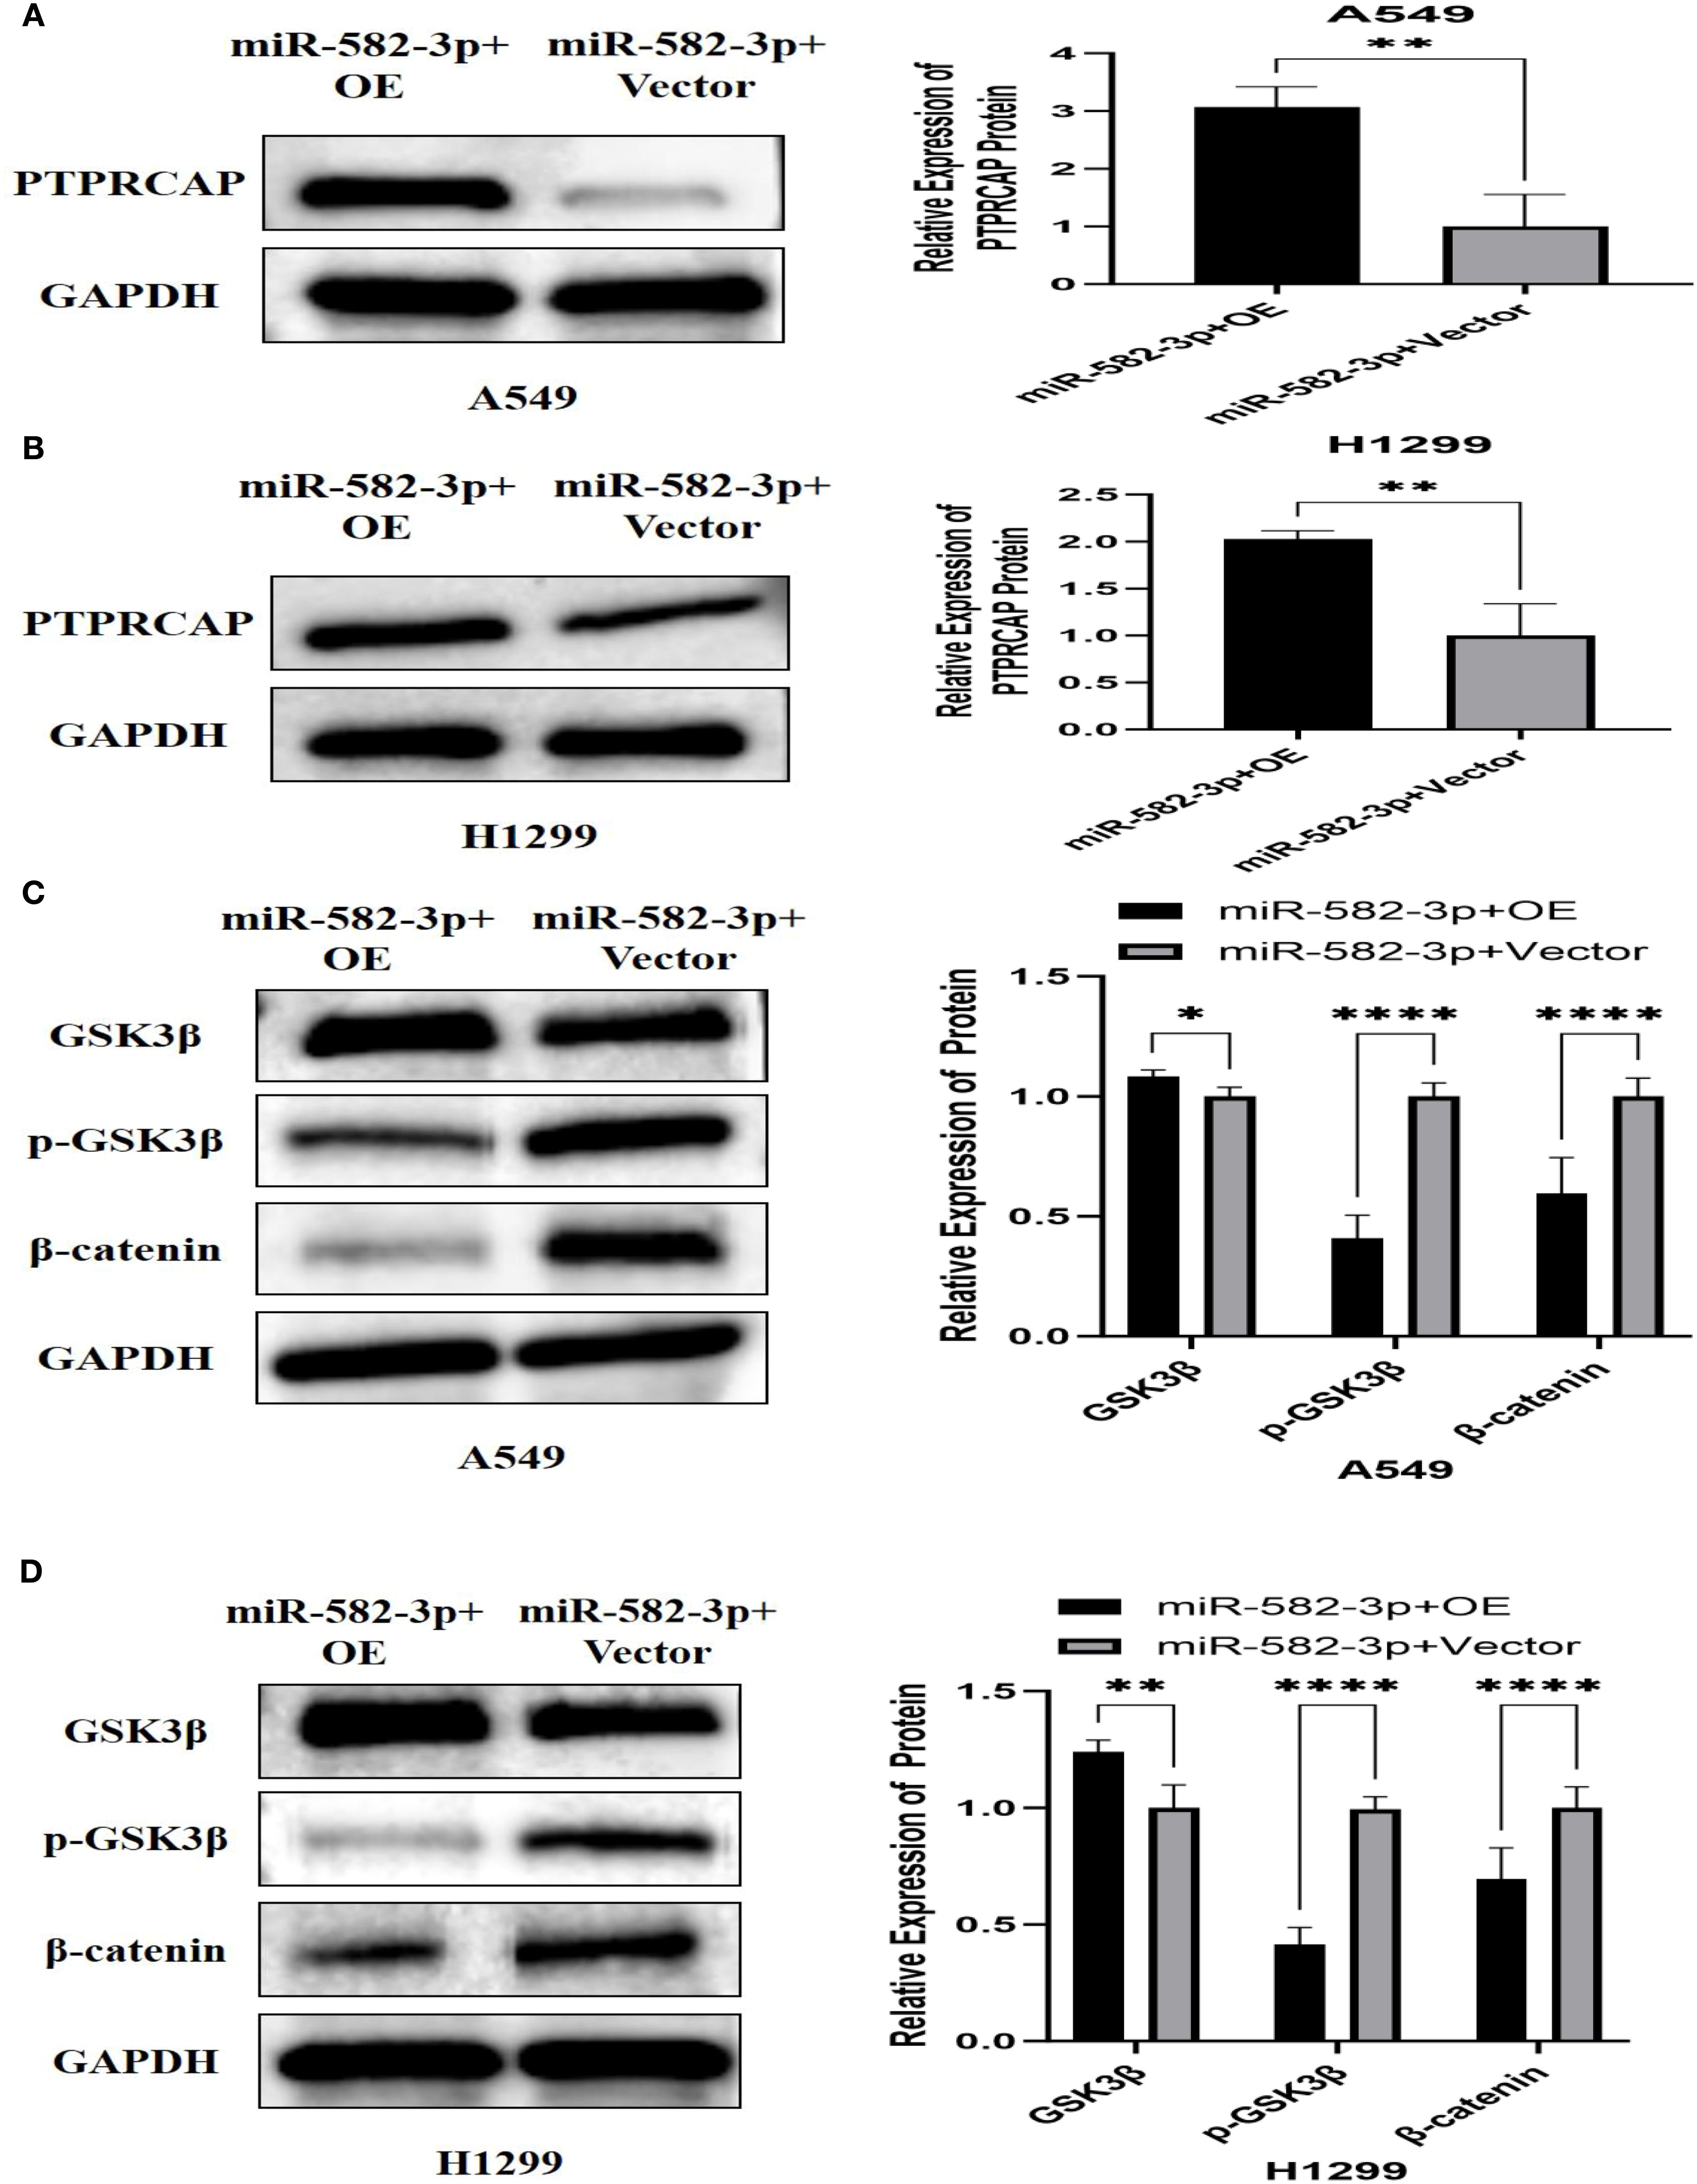
Figure 10. Effect of co-transfection of miR-582-3p mimics and PTPRCAP plasmid on the expression of PTPRCAP protein and Wnt/β-catenin pathway protein. (A) Comparison of protein expression and relative expression levels of PTPRCAP in A549 after co-transfection of miR-582-3p mimics and PTPRCAP plasmids. (B) Comparison of protein expression and relative protein expression levels of PTPRCAP in H1299 after co-transfection of miR-582-3p mimics and PTPRCAP plasmid. (C) Comparison of protein expression and relative protein expression levels of GSK3β, p-GSK3β and β-catenin in A549 cells after co-transfection with miR-582-3p mimics and PTPRCA P plasmid. (D) Comparison of protein expression and relative protein expression levels of GSK3β, p-GSK3β and β-catenin in H1299 cells after up-regulation of miR-582-3p. *P < 0.05, **P < 0.01, ****P < 0.001.
Discussion
Lung adenocarcinoma (LUAD) continues to be a leading cause of cancer-related mortality, with recurrence remaining a significant challenge even in early-stage disease, highlighting an urgent need to decipher its molecular underpinnings for improved therapeutic strategies (23, 24). In this study, we delineate a novel oncogenic pathway in LUAD, wherein miR-582-3p promotes tumor progression by directly suppressing PTPRCAP, consequently activating the Wnt/β-catenin signaling axis.
MicroRNAs, including miR-582-3p, are pivotal post-transcriptional regulators in cancer (25, 26). In nasopharyngeal carcinoma, it suppresses RAB31 expression by binding to the long non-coding RNA HOXA10-AS, thereby regulating cancer cell proliferation and migration (27). In bladder cancer, it inhibits tumor cell proliferation, migration, and invasion by targeting KIF3A (28). In LUAD, Sun et al. demonstrated that miR-582-3p directly regulates the expression of the cell cycle-related protein p27, promoting cancer cell proliferation (29). Notably, serum containing Astragalus and Hedyotis diffusa can inhibit A549 cell proliferation via the miR-582-3p–p27 pathway, highlighting its potential therapeutic value (29). Prognostic marker studies based on miRNA sequencing data have shown that high expression of miR-582-3p is significantly associated with reduced patient survival, indicating its importance as a prognostic indicator (30). Our analysis of the TCGA database revealed that miR-582-3p is overexpressed in multiple tumors, including LUAD. Further validation using the TCGA-LUAD dataset confirmed its significantly higher expression in LUAD tissues compared to adjacent non-tumor tissues. Cellular experiments demonstrated that miR-582-3p is highly expressed in A549 and H1299 cells, and its upregulation markedly enhanced their proliferative, migratory, and invasive capacities.
Integrating Target Scan prediction with dual-luciferase assays established protein tyrosine phosphatase receptor type C-associated protein (PTPRCAP/CD45-AP/LPAP) as a direct target of miR-582-3p. PTPRCAP stabilises the phosphatase PTPRC/CD45 (31), yet its role is context-dependent. Early studies showed that the minor allele at the rs869736 locus of the PTPRCAP gene promoter enhances promoter activity and nuclear protein binding, upregulating its expression and increasing susceptibility to diffuse gastric cancer; additionally, PTPRCAP can promote tumor progression by activating SRC family kinases (SFKs) and disrupting E-cadherin-mediated cell junctions (32). Recent TCGA analyses revealed PTPRCAP overexpression in ovarian cancers with DNA damage repair (DDR) deficiencies, where it contributes to a distinct immune signature (33). In breast cancer, MARCHETTI et al. combined bioinformatics with RT-qPCR and Western blot analyses to demonstrate that PTPRCAP expression is positively correlated with disease-free survival in triple-negative breast cancer patients, while its expression is low in corresponding cell lines (34). Proteogenomic profiling indicates that LUAD PTPRCAP abundance is controlled by DNA methylation (35), and stemness-index analyses uniquely associate PTPRCAP with stemness signatures in both blood and tumour tissue (36). We confirmed markedly reduced PTPRCAP mRNA and protein in 18 LUAD specimens and in A549 and H1299 cells; immunohistochemistry in 45 paired samples showed positivity in only 22% of tumours versus 93% of adjacent normal lung. Functional rescue demonstrated that PTPRCAP re-expression suppressed proliferation, migration, and invasion, confirming its tumour-suppressive role in LUAD.
We further elucidated the connection between this axis and the canonical Wnt/β-catenin pathway—a well-established driver of oncogenesis (37, 38) that contributes critically to breast (39), gastric (40), pancreatic (41), and colorectal carcinogenesis (42). In neuroblastoma, circ_0000285 sponges miR-582-3p, relieving its inhibition of GSK-3β, activating β-catenin, and thereby promoting the Wnt/β-catenin pathway and tumor progression (43). Conversely, in hepatocellular carcinoma, XU et al. found that miR-582-3p targets RRM2 to prevent GSK-3β dephosphorylation, block β-catenin nuclear translocation and subsequent c-Myc activation, ultimately inhibiting Wnt/β-catenin signaling and tumor progression (44). In lung cancer, Wnt/β-catenin pathway activation reduces GSK3β levels while increasing phosphorylated GSK3β (p-GSK3β, Ser9) levels, leading to β-catenin stabilization and accumulation, thereby enhancing cell proliferation, invasion, and metastatic potential (45, 46). Our data demonstrate that miR-582-3p upregulation or PTPRCAP knockdown activates the pathway, increasing levels of p-GSK3β (Ser9) and active β-catenin. Conversely, PTPRCAP overexpression had the opposite effect. This finding provides a crucial mechanistic bridge to the work of Fang et al. (22), who showed that miR-582-3p activates Wnt/β-catenin signaling to maintain stem-like properties; we propose that PTPRCAP is the functional target mediating this activation. Furthermore, the predicted involvement of PTPRCAP in Wnt signaling (47) and the association of its binding partner PTPRC with poor survival in NSCLC (48) lend further support to our model.
Despite these insights, our study has limitations. First, the clinical sample size for validation was limited; larger multi-center cohorts are needed to firmly establish the prognostic value of the miR-582-3p/PTPRCAP signature. Second, our mechanistic conclusions are primarily based on gain-of-function experiments; future studies employing knockdown/knockout models, especially in vivo, are essential. Third, the direct molecular mechanism connecting PTPRCAP to the regulation of GSK3β phosphorylation remains to be fully uncovered, warranting further investigation through co-IP and phosphoproteomics.
In summary, our data indicate that both miR-582-3p and PTPRCAP are involved in the pathogenesis of LUAD. We provide evidence that PTPRCAP, as a direct target of miR-582-3p, mediates its oncogenic effects, at least in part, by negatively regulating Wnt/β-catenin signaling, thereby controlling the proliferation, migration, and invasion of LUAD cells.
Our findings contribute to the growing body of literature on context-dependent miRNA–PTP interactions in cancer. The miR-582-3p/PTPRCAP axis adds a new layer to this complex regulatory network. Furthermore, our work aligns with and expands upon the study by FANG et al. (22), who showed miR-582-3p activates Wnt/β-catenin in lung cancer stem cells; we propose PTPRCAP as a novel and critical mechanistic link mediating this activation.
While these findings illuminate a potential new regulatory node in LUAD, the path to therapeutic application is long and fraught with challenges. The development of miR-582-3p antagonists (e.g., antagomiRs) or strategies to restore PTPRCAP function represents a compelling but speculative future direction. The significant hurdles of in vivo delivery, off-target effects, and the context-dependent functions of both the miRNA and its target gene must be thoroughly addressed in pre-clinical models. Therefore, we posit that the primary immediate value of our work lies in enhancing the mechanistic understanding of LUAD progression and offering a potential biomarker signature (miR-582-3p high/PTPRCAP low). Whether this axis can be therapeutically harnessed remains an open question for extensive future investigation.
Conclusion
Our findings establish a novel regulatory axis in lung adenocarcinoma (LUAD) pathogenesis, in which miR-582-3p directly targets PTPRCAP and represses its expression. This miR-582-3p/PTPRCAP interaction promotes malignant phenotypes in LUAD cells—including proliferation, migration, and invasion—through activation of the Wnt/β-catenin signaling pathway. These results reveal a previously undescribed mechanism contributing to LUAD progression and suggest that both miR-582-3p and PTPRCAP may represent potential biomarkers for this malignancy.
Data availability statement
The original contributions presented in the study are included in the article/supplementary material. Further inquiries can be directed to the corresponding author.
Ethics statement
The studies involving humans were approved by Affiliated Hospital Medical Ethics Committee of Chengde Medical University. The studies were conducted in accordance with the local legislation and institutional requirements. The participants provided their written informed consent to participate in this study.
Author contributions
YY: Conceptualization, Formal analysis, Methodology, Validation, Visualization, Writing – original draft, Writing – review & editing. SZ: Conceptualization, Methodology, Writing – original draft, Writing – review & editing. XH: Writing – review & editing. PG: Supervision, Writing – review & editing. BZ: Supervision, Writing – review & editing. ZL: Conceptualization, Funding acquisition, Resources, Supervision, Writing – original draft, Writing – review & editing.
Funding
The author(s) declare financial support was received for the research and/or publication of this article. This study is supported by Medical Science Research Project of Hebei (NO. 20231361).
Conflict of interest
The authors declare that the research was conducted in the absence of any commercial or financial relationships that could be construed as a potential conflict of interest.
Generative AI statement
The author(s) declare that no Generative AI was used in the creation of this manuscript.
Any alternative text (alt text) provided alongside figures in this article has been generated by Frontiers with the support of artificial intelligence and reasonable efforts have been made to ensure accuracy, including review by the authors wherever possible. If you identify any issues, please contact us.
Publisher’s note
All claims expressed in this article are solely those of the authors and do not necessarily represent those of their affiliated organizations, or those of the publisher, the editors and the reviewers. Any product that may be evaluated in this article, or claim that may be made by its manufacturer, is not guaranteed or endorsed by the publisher.
References
1. Kratzer TB, Bandi P, Freedman ND, Smith RA, Travis WD, Jemal A, et al. Lung cancer statistics, 2023. Cancer. (2024) 130:1330–48. doi: 10.1002/cncr.35128
2. Zhang Y, Vaccarella S, Morgan E, Li M, Etxeberria J, Chokunonga E, et al. Global variations in lung cancer incidence by histological subtype in 2020: a population-based study. Lancet Oncol. (2023) 24:1206–18. doi: 10.1016/S1470-2045(23)00444-8
3. Fang H, Sun Q, Zhou J, Zhang H, Song Q, Zhang H, et al. m6A methylation reader IGF2BP2 activates endothelial cells to promote angiogenesis and metastasis of lung adenocarcinoma. Mol Cancer. (2023) 22:99. doi: 10.1186/s12943-023-01791-1
4. Li Y, Juergens RA, Finley C, and Swaminath A. Current and future treatment options in the management of stage III NSCLC. J Thorac Oncol. (2023) 18:1478–91. doi: 10.1016/j.jtho.2023.08.011
5. Easty D, Gallagher W, and Bennett DC. Protein tyrosine phosphatases, new targets for cancer therapy. Curr Cancer Drug Targets. (2006) 6:519–32. doi: 10.2174/156800906778194603
6. Lin PC, Yeh YM, Hsu HP, Chan RH, Lin BW, Chen PC, et al. Comprehensively exploring the mutational landscape and patterns of genomic evolution in hypermutated cancers. Cancers (Basel). (2021) 13:4317. doi: 10.3390/cancers13174317
7. Luo R-Z, Cai P-Q, Li M, Fu J, Zhang Z-Y, Chen J-W, et al. Decreased expression of PTPN12 correlates with tumor recurrence and poor survival of patients with hepatocellular carcinoma. PloS One. (2014) 9:e85592. doi: 10.1371/journal.pone.0085592
8. Bard-Chapeau EA, Li S, Ding J, Zhang SS, Zhu HH, Princen F, et al. PTPN11/Shp2 acts as a tumor suppressor in hepatocellular carcinogenesis. Cancer Cell. (2011) 19:629–39. doi: 10.1016/j.ccr.2011.03.023
9. Sun Y, Chen F, Ma H, Wang D, Wang D, Zhang J, et al. Exploring the immune characteristions of CRKP pneumonia at single-cell level. Comput Biol Med. (2024) 177:108574. doi: 10.1016/j.compbiomed.2024.108574
10. An J, Chen P, Li X, Li X, and Peng F. Identification of potential hub genes and biological mechanism in rheumatoid arthritis and non-small cell lung cancer via integrated bioinformatics analysis. Trans Oncol. (2024) 45:101964. doi: 10.1016/j.tranon.2024.101964
11. Kosek DM, Banijamali E, Becker W, Petzold K, and Andersson ER. Efficient 3’-pairing renders microRNA targeting less sensitive to mRNA seed accessibility. Nucleic Acids Res. (2023) 51:11162–77. doi: 10.1093/nar/gkad795
12. Ni D, Teng J, Cheng Y, Zhu Z, Zhuang B, and Yang Z. circBIRC6 contributes to the development of non-small cell lung cancer via regulating microRNA-217/amyloid beta precursor protein binding protein 2 axis. Chin Med J. (2022) 135:714–23. doi: 10.1097/CM9.0000000000001940
13. Kundu ST, Rodriguez BL, Gibson LA, Warner AN, Perez MG, Bajaj R, et al. The microRNA-183/96/182 cluster inhibits lung cancer progression and metastasis by inducing an interleukin-2-mediated antitumor CD8+ cytotoxic T-cell response. Genes Dev. (2022) 36:582–600. doi: 10.1101/gad.349321.121
14. Huang S, Zou C, Tang Y, Wa Q, Peng X, Chen X, et al. miR-582-3p and miR-582-5p suppress prostate cancer metastasis to bone by repressing TGF-β signaling. Mol Ther Nucleic Acids. (2019) 16:91–104. doi: 10.1016/j.omtn.2019.01.004
15. Zhang H, Dai Q, Zheng L, Yuan X, Pan S, and Deng J. Knockdown of circ_HIPK3 inhibits tumorigenesis of hepatocellular carcinoma via the miR-582-3p/DLX2 axis. Biochem Biophys Res Commun. (2020) 533:501–9. doi: 10.1016/j.bbrc.2020.09.050
16. Liu L, Liu X, Wu X, Fang H, Shi J, and Jiang W. Clinical significance and biological function of PRKCQ-AS1/miR-582-3p expression in LUAD. Hereditas. (2025) 162:116. doi: 10.1186/s41065-025-00482-9
17. Goyal A, Murkute SL, Bhowmik S, Prasad CP, and Mohapatra P. Belling the “cat”: wnt/β-catenin signaling and its significance in future cancer therapies. Biochim Et Biophys Acta Rev Cancer. (2024) 1879:189195. doi: 10.1016/j.bbcan.2024.189195
18. Zhu Q, Wan N-B, Deng H-W, Lu L-L, Zhang Y, He X, et al. SEC14L3 plays a tumor-suppressive role in breast cancer through a wnt/β-catenin-related way. Exp Cell Res. (2022) 417:113161. doi: 10.1016/j.yexcr.2022.113161
19. Yu Y, Tan C, Ding L, Zhu Z, Zhang G, and Long C. ZIC2 accelerates growth and stemness in gastric cancer through the wnt/β-catenin pathway. Tissue Cell Tissue Cell. (2023) 85:102222. doi: 10.1016/j.tice.2023.102222
20. Ke L, Chen Y, Li Y, Chen Z, He Y, Liu J, et al. miR-142-5p promotes cervical cancer progression by targeting LMX1A through wnt/β-catenin pathway. Open Med (warsaw Poland) Open Med (Wars). (2021) 16:224–36. doi: 10.1515/med-2021-0218
21. Yang F, Xiong H, Duan L, Li Q, Li X, and Zhou Y. miR-1246 promotes metastasis and invasion of A549 cells by targeting GSK-3β–mediated wnt/β-catenin pathway. Cancer Res Treat. (2019) 51:1420–9. doi: 10.4143/crt.2018.638
22. Fang L, Cai J, Chen B, Wu S, Li R, Xu X, et al. Aberrantly expressed miR-582-3p maintains lung cancer stem cell-like traits by activating wnt/β-catenin signalling. Nat Commun. (2015) 6:8640. doi: 10.1038/ncomms9640
23. Siegel RL, Miller KD, Wagle NS, and Jemal A. Cancer statistics, 2023. CA Cancer J Clin. (2023) 73:17–48. doi: 10.3322/caac.21763
24. Carr SR, Wang H, Hudlikar R, Lu X, Zhang MR, Hoang CD, et al. A unique gene signature predicting recurrence free survival in stage IA lung adenocarcinoma. J Thorac Cardiovasc Surg. (2023) 165:1554–64. doi: 10.1016/j.jtcvs.2022.09.028
25. Emamiamin A, Shariati Pour, Serra T, Calabria D, Varone M, Di Nardo F, et al. New frontiers for the early diagnosis of cancer: screening miRNAs through the lateral flow assay method. Biosensors. (2025) 15:238. doi: 10.3390/bios15040238
26. Smolarz B, Durczyński A, Romanowicz H, Szyłło K, and Hogendorf P. miRNAs in cancer (Review of literature). Int J Mol Sci. (2022) 23:2805. doi: 10.3390/ijms23052805
27. Wang X, Nie P, and Zhu D. LncRNA HOXA10-AS activated by E2F1 facilitates proliferation and migration of nasopharyngeal carcinoma cells through sponging miR-582-3p to upregulate RAB31. Am J Rhinology Allergy. (2022) 36:348–59. doi: 10.1177/19458924211064400
28. Wang C and Yang X. CircRAPGEF5 sponges miR-582-3p and targets KIF3A to regulate bladder cancer cell proliferation, migration, and invasion. Int Immunopharmacol. (2024) 131:111613. doi: 10.1016/j.intimp.2024.111613
29. Sun H, Xu L, Liu S, and Ma T. Astragalus mongholicus and hedyotis diffusa will inhibit cell proliferation by attenuating the miR-582-3p-p27 signaling pathway in LUAD. Sci Rep. (2025) 15:13411. doi: 10.1038/s41598-025-97996-z
30. Siriwardhana C, Khadka VS, Chen JJ, and Deng Y. Development of a miRNA-seq based prognostic signature in lung adenocarcinoma. BMC Cancer. (2019) 19:34. doi: 10.1186/s12885-018-5206-8
31. Labbé DP, Hardy S, and Tremblay ML. Protein tyrosine phosphatases in cancer: friends and foes! Prog Mol Biol Trans Sci. (2012) 106:253–306. doi: 10.1016/B978-0-12-396456-4.00009-2
32. Ju H, Lim B, Kim M, Kim YS, Kim WH, Ihm C, et al. A regulatory polymorphism at position -309 in PTPRCAP is associated with susceptibility to diffuse-type gastric cancer and gene expression. Neoplasia (New York N.Y.) Neoplasia. (2009) 11:1340–47. doi: 10.1593/neo.91132
33. Tian W, Shan B, Zhang Y, Ren Y, Liang S, Zhao J, et al. Association between DNA damage repair gene somatic mutations and immune-related gene expression in ovarian cancer. Cancer Med. (2020) 9:2190–200. doi: 10.1002/cam4.2849
34. Marchetti P, Antonov A, Anemona L, Vangapandou C, Montanaro M, Botticelli A, et al. New immunological potential markers for triple negative breast cancer: IL18R1, CD53, TRIM, Jaw1, LTB, PTPRCAP. Discover Oncol. (2021) 12:6. doi: 10.1007/s12672-021-00401-0
35. Gillette MA, Satpathy S, Cao S, Dhanasekaran SM, Vasaikar SV, Krug K, et al. Proteogenomic characterization reveals therapeutic vulnerabilities in lung adenocarcinoma. Cell. (2020) 182:200–225.e35. doi: 10.1016/j.cell.2020.06.013
36. Yan B, Chen Y, Wang Z, Li J, Wang R, Pan X, et al. Analysis and identification of mRNAsi−related expression signatures via RNA sequencing in lung cancer. Oncol Lett. (2024) 28:549. doi: 10.3892/ol.2024.14682
37. Yu F, Yu C, Li F, Zuo Y, Wang Y, Yao L, et al. Wnt/β-catenin signaling in cancers and targeted therapies. Signal Transduction Targeted Ther. (2021) 6:307. doi: 10.1038/s41392-021-00701-5
38. Le PN, Keysar SB, Miller B, Eagles JR, Chimed T-S, Reisinger J, et al. Wnt signaling dynamics in head and neck squamous cell cancer tumor-stroma interactions. Mol Carcinogenesis. (2019) 58:398–410. doi: 10.1002/mc.22937
39. Zhu L, Tian Q, Gao H, Wu K, Wang B, Ge G, et al. PROX1 promotes breast cancer invasion and metastasis through WNT/β-catenin pathway via interacting with hnRNPK. Int J Biol Sci. (2022) 18:2032–46. doi: 10.7150/ijbs.68960
40. Li Y, Liu C, Zhang X, Huang X, Liang S, Xing F, et al. CCT5 induces epithelial-mesenchymal transition to promote gastric cancer lymph node metastasis by activating the wnt/β-catenin signalling pathway. Br J Cancer. (2022) 126:1684–94. doi: 10.1038/s41416-022-01747-0
41. Fu X, Ma J, Ma F, Guo S, Wang X, Li Y, et al. MISP-mediated enhancement of pancreatic cancer growth through the wnt/β-catenin signaling pathway is suppressed by fisetin. Biochim Et Biophys Acta Mol Basis Dis. (2025) 1871:167515. doi: 10.1016/j.bbadis.2024.167515
42. Han T, Gao M, Wang X, Li W, Zhuo J, Qu Z, et al. LINC00665 activates wnt/β-catenin signaling pathway to facilitate tumor progression of colorectal cancer via upregulating CTNNB1. Exp Mol Pathol. (2021) 120:104639. doi: 10.1016/j.yexmp.2021.104639
43. Du J, Zhuo Y, Sun X, Nie M, Yang J, Luo X, et al. hsa_circ_0000285 sponging miR-582-3p promotes neuroblastoma progression by regulating the wnt/β-catenin signaling pathway. Open Med. (2023) 18:20230726. doi: 10.1515/med-2023-0726
44. Xu H and Li B. MicroRNA-582-3p targeting ribonucleotide reductase regulatory subunit M2 inhibits the tumorigenesis of hepatocellular carcinoma by regulating the wnt/β-catenin signaling pathway. Bioengineered. (2022) 13:12876–87. doi: 10.1080/21655979.2022.2078026
45. Yang S, Liu Y, Li M-Y, Ng CSH, Yang S-L, Wang S, et al. FOXP3 promotes tumor growth and metastasis by activating wnt/β-catenin signaling pathway and EMT in non-small cell lung cancer. Mol Cancer. (2017) 16:124. doi: 10.1186/s12943-017-0700-1
46. Li HJ, Ke FY, Lin CC, Lu MY, Kuo YH, Wang YP, et al. ENO1 promotes lung cancer metastasis via HGFR and WNT signaling-driven epithelial-to-mesenchymal transition. Cancer Res. (2021) 81:4094–109. doi: 10.1158/0008-5472.CAN-20-3543
47. Gao P and Ren G. Identification of potential target genes of non-small cell lung cancer in response to resveratrol treatment by bioinformatics analysis. Aging. (2021) 13:23245–61. doi: 10.18632/aging.203616
Keywords: miR-582-3p, PTPRCAP, lung adenocarcinoma, Wnt/β-catenin, signaling pathways
Citation: Yang Y, Zhao S, Han X, Guo P, Zhao B and Liang Z (2025) Mechanistic studies of miR-582-3p targeting of PTPRCAP affecting lung adenocarcinoma via the Wnt/β-catenin pathway. Front. Oncol. 15:1652176. doi: 10.3389/fonc.2025.1652176
Received: 23 June 2025; Accepted: 04 September 2025;
Published: 23 September 2025.
Edited by:
Gary Piazza, Auburn University, United StatesReviewed by:
Mithalesh Kumar Singh, University of Texas Southwestern Medical Center, United StatesDattatrya Shetti, Charles University, Czechia
Copyright © 2025 Yang, Zhao, Han, Guo, Zhao and Liang. This is an open-access article distributed under the terms of the Creative Commons Attribution License (CC BY). The use, distribution or reproduction in other forums is permitted, provided the original author(s) and the copyright owner(s) are credited and that the original publication in this journal is cited, in accordance with accepted academic practice. No use, distribution or reproduction is permitted which does not comply with these terms.
*Correspondence: Zongying Liang, bGlhbmd6eTAzMThAMTYzLmNvbQ==