 Hieu Duc Nguyen1,2
 Ming-Jenn Chen3,4
 Chung-Ying Lee5,6,7Yi-Chun Ni2Ke Xin Yee2Yung-Fu Wu8*
 Kuen-Haur Lee1,2,7,9,10*
- 1Graduate Institute of Cancer Biology and Drug Discovery, College of Medical Science and Technology, Taipei Medical University, New Taipei City, Taiwan
- 2PhD Program for Cancer Molecular Biology and Drug Discovery, College of Medical Science and Technology, Taipei Medical University, New Taipei City, Taiwan
- 3Department of Surgery, Chi Mei Medical Center, Tainan, Taiwan
- 4Department of Sports Management, College of Leisure and Recreation Management, Chia Nan University of Pharmacy and Science, Tainan, Taiwan
- 5Division of Gastroenterology and Hepatology, Department of Internal Medicine, Taipei Medical University Shuang Ho Hospital Ministry of Health and Welfare, New Taipei City, Taiwan
- 6Gastroenterology and Hepatology, Taipei Medical University School of Medicine, Taipei, Taiwan
- 7TMU Research Center for Digestive Medicine, Taipei Medical University, Taipei, Taiwan
- 8National Defense Medical Center, School of Medicine, Department of Medical Research, Tri-Service General Hospital, Taipei, Taiwan
- 9Cancer Center, Wan Fang Hospital, Taipei Medical University, Taipei, Taiwan
- 10TMU Research Center of Cancer Translational Medicine, Taipei Medical University, Taipei, Taiwan
Introduction: The rapid increase in early-onset colorectal cancer (EoCRC) case numbers in recent years indicated an urgent need to identify the essential mechanisms and markers for EoCRC diagnosis and treatment. Therefore, this study aimed to analyze the metadata to overcome the limitation of the sample number of previous EoCRC research and to identify central mechanisms and genes that are crucial for EoCRC.
Methods: This study employed statistical analysis of data from the cBioPortal and GEPIA databases to identify overexpressed EoCRC genes. Using a protein–protein interaction map, it identified hub genes. The function of these genes was clarified via risk model, survival, and cell model analysis.
Results and Discussion: The results of clinical data analysis showed an increased rate of late-stage diagnosis and a lower overall survival of the EoCRC cohort. A total of 953 enriched gene samples were detected in EoCRC and 89 genes were identified as EoCRC overexpression genes. From the protein–protein interactions among 53 genes, the top 10 hub genes showed potential for EoCRC diagnosis and prognosis by linking gene expression to diagnosis and survival analysis data. The knockdown of four selected hub genes in the cell model identified the association of EoCRC overexpression hub genes with tumor development and suggested their role in mTOR signaling, cell cycle, and apoptosis regulation. In summary, the study analyzed molecular and clinical data to identify hub genes associated with cancer prognosis in patients with EoCRC. These genes may serve as targets for diagnosis and treatment.
1 Introduction
Early-onset colorectal cancer (EoCRC) is used to describe patients who are diagnosed with colorectal cancer before 50 years old; this term contrasts with late-onset colorectal cancer (LoCRC). In earlier studies, because patients with EoCRC only accounted for 12% of total patients with colorectal cancer (CRC) (American Cancer Society, https://www.cancer.org), EoCRC did not receive attention despite the evidence suggesting a low prognosis in younger patients. However, the Surveillance, Epidemiology, and End Results database from 1975 to 2010 showed an unexpected increase of patients in the age range of 20–34 (90% and 124%, respectively) and 35–49 years (28% and 46%, respectively) (1). Another analysis at that time showed a 2% rise per year of EoCRC from 1994, and this gradually turned EoCRC into a worldwide phenomenon (2). Therefore, along with the lowering of the recommended screening age for CRC average-risk adults, the diagnosis, treatment, and mechanism of EoCRC have become increasingly urgent in recent years.
Because of the limitation of EoCRC data, many previous studies used the data of CRC-related early-onset diseases to establish the link of EoCRC to many different risk factors from germline genetics, environment, and life habits (3, 4). Although the results did not show a clear relationship between genetics and EoCRC, the molecular mechanism was still mentioned in the research of Shah et al., which showed the trend of histopathological and molecular feature differences in patients with EoCRC (5). A later study on the ACCENT database and study by Cercek et al. focused more on genetic variance; both studies also showed a high percentage of germline variants in patients under 35 years old (6, 7).
On the other hand, gene expression analysis can also be a potential approach to resolving unanswered questions of previous research (8). The mutation database only showed the initialization of cancer development via the gain function of oncogenes and the loss function of suspended genes (9, 10). By analyzing gene expression levels, the difference in biological pathways between EoCRC and LoCRC can be detected. Gene expression analysis can also be used to detect the biomarker for EoCRC (11).
The study of the gene expression system of EoCRC has only gradually received attention in the past decade, in which the role of the Wnt signaling pathway has been identified in EoCRC samples (12). Analyses on EoCRC also show the age-related role of Myc overexpression along with lncRNA WiNTRLINC1 and the ASCL2 gene (13). The transcriptome of patients with EoCRC from The Cancer Genome Atlas (TCGA) suggested that seven genes had increased expression in younger patients but only PEG10 was associated with poor overall survival (OS) (14). In addition, EoCRC samples also show the relevance of overexpression of genes with the apoptosis/inflammation, adhesion, and proliferation signaling pathways (14, 15). However, most studies are limited by sample size and the availability of patient-matched control samples.
Therefore, this study aims to use the metadata from both TCGA and other available datasets in the cBioPortal database. The analysis of a larger number of EoCRC and LoCRC samples may suggest the molecular pathway and the important marker of EoCRC.
2 Materials and methods
2.1 Data collection
The available CRC datasets from the cBioPortal database (https://www.cbioportal.org) (Table 1) were collected, including clinical, genome transcriptome, and mutation data. In addition, the validation of the cBioPortal results was performed using clinical and gene expression data from TCGA data and the GEO dataset GSE39582 in the NCBI database (https://ncbi.nlm.nih.gov/), which were selected for their large sample sizes to ensure more accurate statistical analyses. The samples from collected data were divided into two groups: the below 50-year-old cohort (EoCRC) and the above 50-year-old cohort (LoCRC).
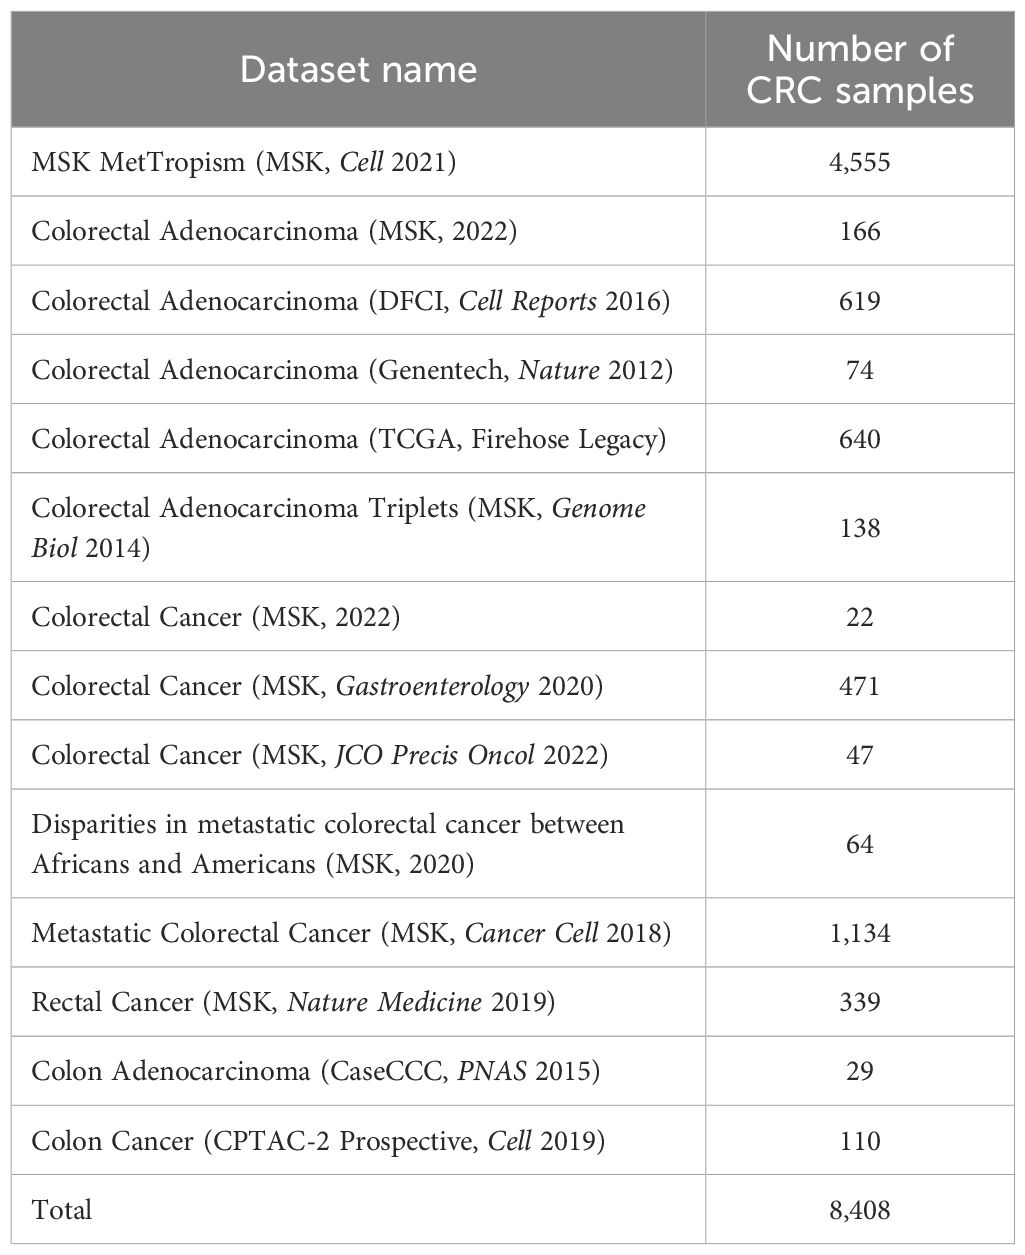
Table 1. Colorectal cancer datasets included in this study.
2.2 EoCRC identification
To identify EoCRC overexpression genes, a two-step analysis was conducted. First, gene expression profiles were statistically compared based on sample-type category. The comparison between EoCRC and LoCRC was sequentially performed on primary and metastatic colorectal cancer samples, respectively, using the cBioPortal group comparison tool. From each of these comparisons, amplification (AMP) genes significantly enriched (p ≤ 0.05) in EoCRC samples were selected. Then, a screening step was made between the enriched gene list and the CRC overexpressed gene list (logFC ≥ 1, p ≤ 0.05) from the GEPIA database (http://gepia.cancer-pku.cn). The overlapping genes were known as EoCRC overexpressed genes.
2.3 Protein–protein interaction analysis and hub gene identification
The EoCRC overexpressed genes were used to construct the protein–protein interaction (PPI) network by the STRING database (https://string-db.org/). The top 10 hub genes based on their degree were identified by the Cytoscape/CytoHubba package (16). After that, hub gene interactions were validated with the Genemania database (https://genemania.org/). The gene correlation was confirmed by the GEPIA database.
2.4 Biological pathway analysis
MSigDB Hallmark analysis was performed on EoCRC overexpressed genes using the Enrichr database (https://maayanlab.cloud/Enrichr/). The corelation gene pathway of selected hub genes was analyzed using Ingenuity Pathway Analysis (IPA) (17). Visualization of the top 10 pathways was performed on the imageGP website (http://www.ehbio.com/ImageGP).
2.5 Multivariate and risk model analysis
Using the Survival R package, we assessed the relationship between clinical data—including gender, clinical tumor stage (Stage), stage describing size of the original primary tumor (T stage), and stage describing the number of lymph nodes (N stage)—and cohort survival. The data were then subsequently used to perform a multivariate Cox regression analysis, with the findings presented in a forest plot.
To construct a risk model analysis, gene expression data from the TCGA and GSE39582 datasets were also analyzed using multivariate Cox regression to calculate coefficient values. The risk score for all samples was calculated using the following formula: risk score = ∑coefficient value ∗ expression level. Based on the median value of the risk score, the samples were divided into high-risk and low-risk groups. The log-rank test was performed to compare the effect of gene expression on OS between the two groups.
2.6 Cell line and siRNA transfection
The age-related cell model was built using four human colon cancer cell lines (HT29, HCT116, LOVO, and HCT15) that were derived from donors aged 44–67 years who were selected for this study. The CRL1459 was used as the healthy colorectal cell line. All cells were cultured in RPMI medium at 37°C and 5% CO2, which was added to 1% streptomycin and penicillin and 10% fetal bovine serum (FBS) (Corning).
The hub genes that exhibited a strong correlation with our age-related cell model were selected for further functional analysis. To build the hub gene targeted knockdown EoCRC cell model, the siRNA for four genes—GMNN, KPNA2, MYC, and PRDX4 (Table 2)—was designed and synthesized by BiONEER (Korea) and transfected into HCT116 cells using INTERFERin® in vitro siRNA/miRNA transfection reagent (Polyplus) for 48 h, following the company’s guidelines. The mRNA efficiency of the siRNA was evaluated using reverse transcription-quantitative polymerase chain reaction (RT-qPCR).
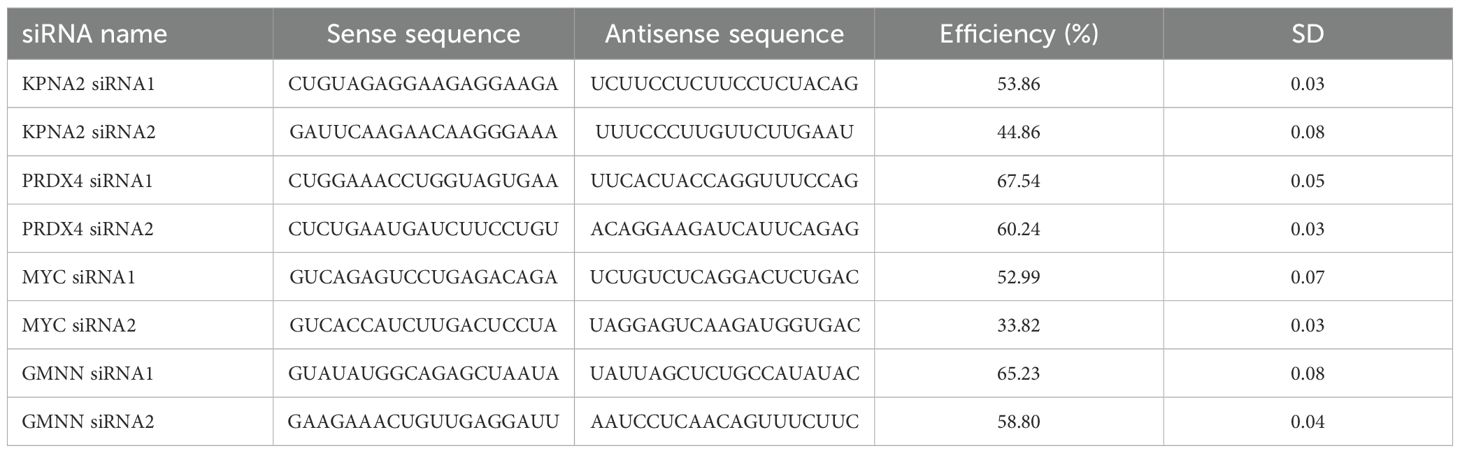
Table 2. siRNA list.
2.7 RNA extraction, cDNA synthesis, and reverse transcription-quantitative PCR
Total RNA was extracted from siRNA-transfected cells using GENEzol™ RNA extraction (Geneaid) and converted into cDNA using MIIIs™ 1st Strand gDNA clear cDNA Synthesis SuperMix (BIONOVAS). Primers were designed using Primer−BLAST (National Center for Biotechnology Information) (Table 3). GAPDH was used as the internal control gene. qPCR was performed using the Lightcycle 96 system (Roche) in 40 cycles with the QuantiTect SYBR Green PCR Kit (QIAGEN), 1 pmol/µL forward and reverse primer, 10 ng/µL cDNA template, and PCR-grade water. The qPCR conditions included an initial denaturation step for 10 min at 95˚C, followed by 40 cycles of denaturation at 95˚C for 15 s, and annealing/extension at 55˚C for 45 s.
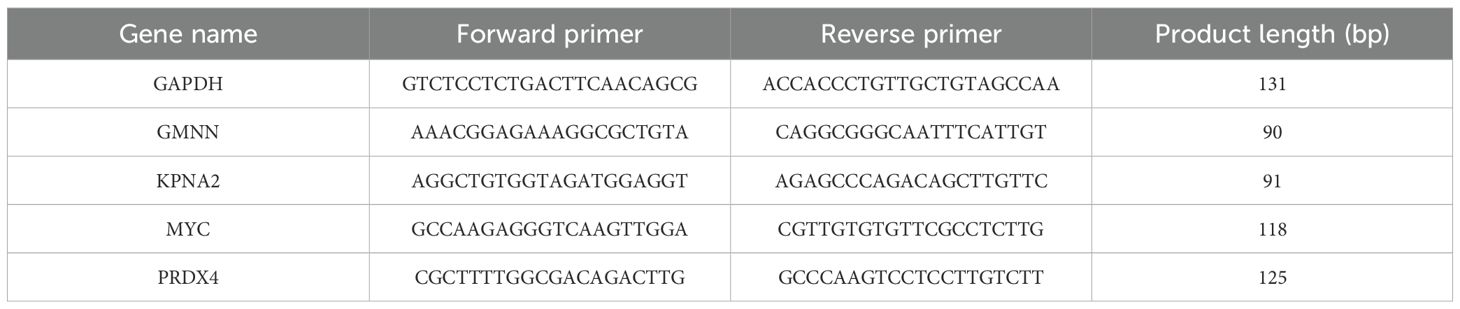
Table 3. Primer list.
2.8 Western blot analysis
The total transfected cell mass including suspension death cell was lysed using RIPA buffer (Invitrogen; Thermo Fisher Scientific, Inc.) supplemented with protease inhibitor (Roche) and phosphatase inhibitor (Roche). The collected protein was adjusted to equal amounts of protein samples and separated by 6%–12% SDS-PAGE. The separated proteins were then transferred onto nitrocellulose membranes (Immobilon, Merck Millipore, Darmstadt, Germany). Specific antibodies (Cell Signaling Technology) for mTOR, caspase 3, PARP, CDK4, and Cyclin D1 were used to detect the presence of mTOR, cell cycle, and cell death marker. Actin was used as the internal control gene. The signal generated by the complex of target protein, primary antibody, and secondary antibody was quantified using the ImageQuant LAS 4000 mini system (GE Healthcare, Chicago, IL, USA). The protein expression levels were further analyzed using ImageJ software (18).
2.9 Cell proliferation analysis, cell cycle, and apoptosis assay
To analyze cell proliferation, transfected cells were seeded at a density of 1 × 10³ cells per well in 96-well plates. Cell viability was assessed at 24, 48, 72, and 96 h using the MTT assay. Absorbance was measured at 570 nm using a spectrometer. For cell cycle and apoptosis analysis, the total population of transfected cells was harvested and processed according to the protocols of the Muse® Cell Cycle Kit and the Annexin V & Dead Cell Kit (Cytek Biosciences). Flow cytometry analysis was then performed using the Muse® Cell Analyzer.
2.10 Statistical analysis
The comparison of AMP genes between the EoCRC and LoCRC cohorts was performed using the GISTIC algorithm available on cBioPortal (19). Additionally, the CRC overexpression genes between the TCGA CRC and control group were identified using the LIMMA method from GEPIA (20). The cBioPortal clinical data and expression data from the cell model were analyzed using GraphPad Prism 5 software, employing chi-square and t-test methods, respectively. For the validation of the results, an in vitro triple replication experiment was conducted and statistically analyzed using t-test. Statistical significance was indicated by the following levels: *p ≤ 0.05; **p ≤ 0.01; ***p ≤ 0.001; ****p ≤ 0.0001.
3 Results
3.1 Impact of EoCRC on clinical features
A total of 8,408 CRC patient data points were collected from 15 cBioPortal datasets, but only 5,338 samples included patient age information, comprising 1,508 EoCRC and 3,830 LoCRC samples (Table 4). The statistical analysis indicated that the rate of patients with EoCRC diagnosed at a late clinical tumor stage and N stage was significantly higher than that in the LoCRC group (p < 0.0001). Then, the clinical data of these samples were used to conduct an independent survival analysis between age and clinical stage, which revealed that OS was shorter in the EoCRC group than in the LoCRC group (Figure 1A). The multivariate Cox regression forest plot analysis confirmed that a higher rate of late clinical tumor stage negatively impacts patient survival (Figure 1B). To demonstrate that the shorter survival time of the EoCRC group is not solely attributed to late medical examination, we compared OS between patients with EoCRC and LoCRC at each stage. The results showed that the EoCRC cohort had significantly lower OS than the LoCRC cohort in the early stages (stages I and II) (Figures 1C, D) but not in the late stages (stages III and IV) (Figures 1E, F). The prognosis of patients with EoCRC was nearly the same regardless of whether the cancer was detected early or late (p = 0.304) (Figure 1G), rather than depending on stage like the LoCRC cohort (p < 0.0001) (Figure 1H). This suggested that the patients with EoCRC did not have a better survival prognosis even when the disease was detected before it progressed to stage III.
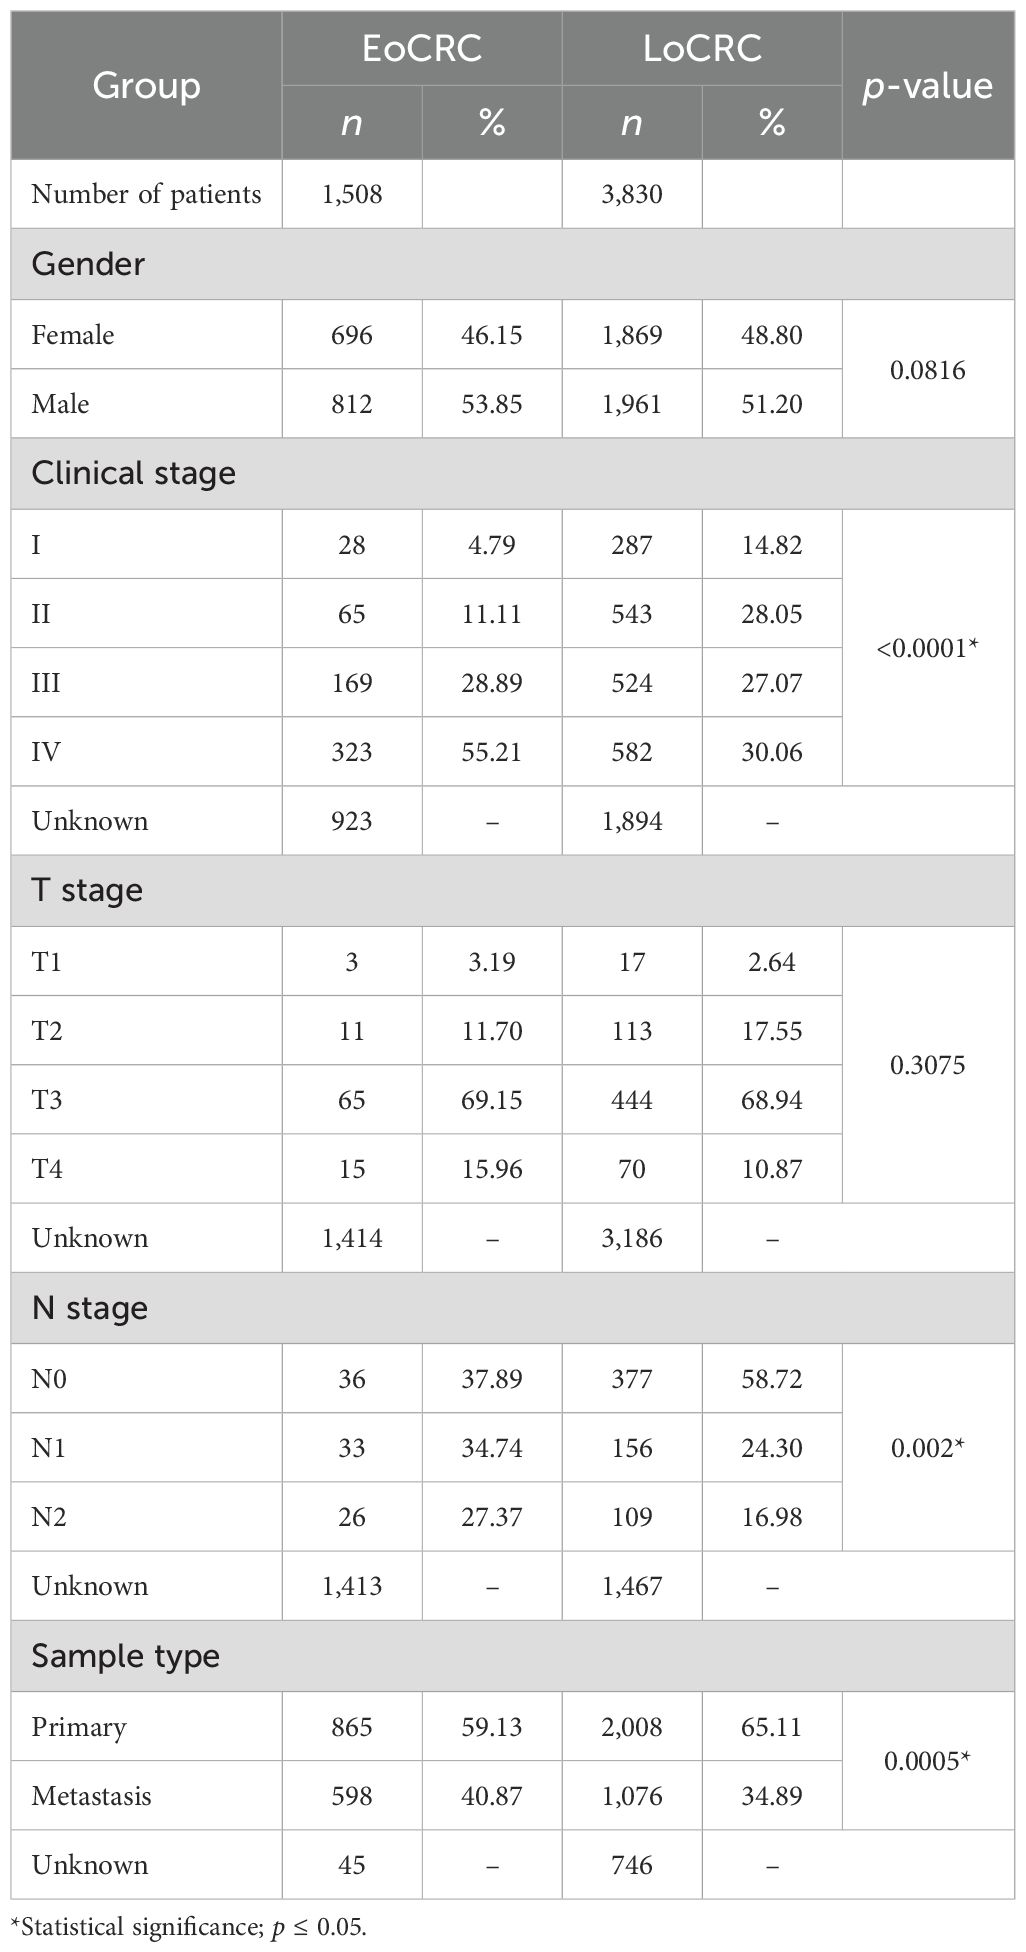
Table 4. Characteristics of patients with EoCRC and LoCRC according to colorectal cancer status.
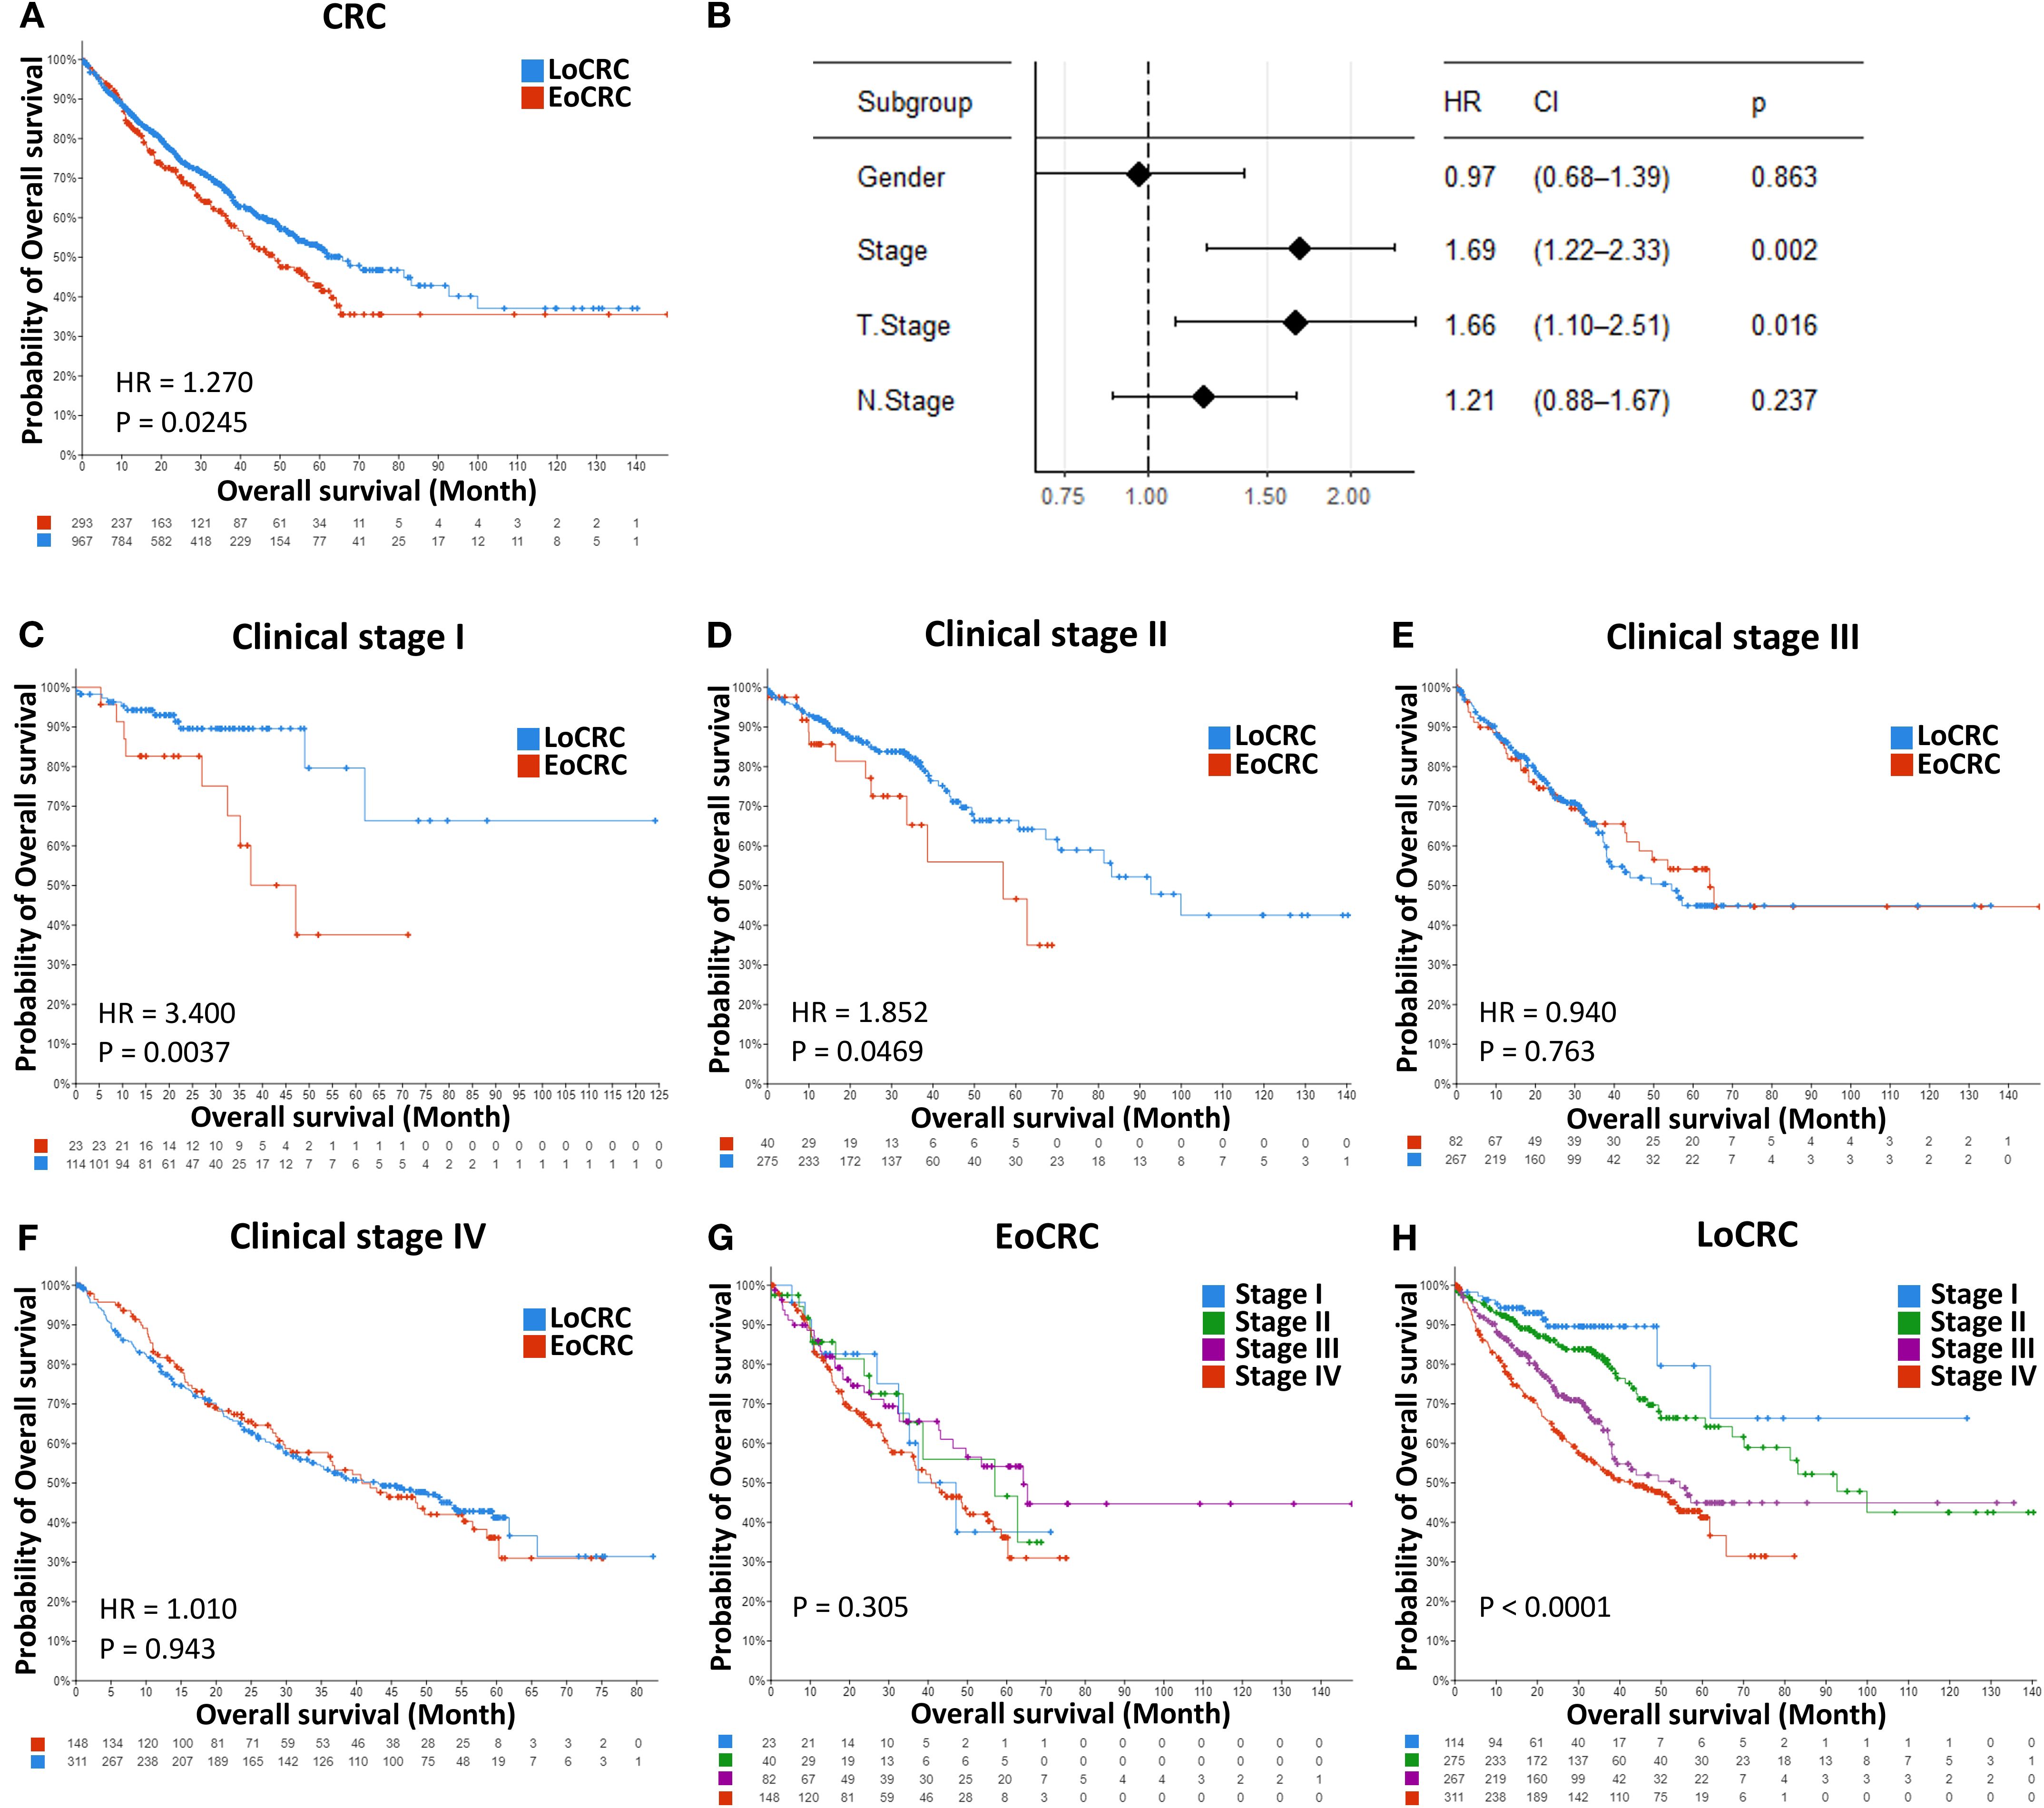
Figure 1. Independent survival analysis between age and clinical stage. (A) Comparison of overall survival between the EoCRC and LoCRC cohort. (B) Multivariate Cox regression forest plot analysis of total CRC samples available in the cBioPortal database. (C–F) Comparison of overall survival between patients with EoCRC and those with LoCRC within each clinical stage (I, II, III, and IV). (G, H) Comparison of overall survival across clinical stages (I, II, III, and IV) in EoCRC and LoCRC cohorts, respectively.
3.2 Transcriptome comparison and identification of EoCRC hub genes
By comparison of the AMP gene between EoCRC and LoCRC, the difference in transcriptome between the two groups was investigated. The results of the analysis showed a higher number of significant genes (p ≤ 0.05) in the primary tumor samples (Figure 2A) than in the metastasis tumor samples (Figure 2B), a finding that is consistent with the distinct clinical outcomes observed in patients with early-stage EoCRC. A total of 953 genes that were enriched in the EoCRC patient group were selected and screened through the CRC overexpression gene list obtained from the GEPIA dataset to identify key genes with a direct impact on tumor progression (Figure 2C). The overexpression of 89 overlap genes showed a strong impact on both patients with EoCRC and all patients with CRC (Figures 2D, E). Through the prediction of signaling pathways, these genes primarily participate in mTORC1 signaling pathways (p = 0.009), followed by glycolysis (p = 0.018), G2-M checkpoint (p = 0.018), and E2F targets pathway (p = 0.018) (Figure 2F).
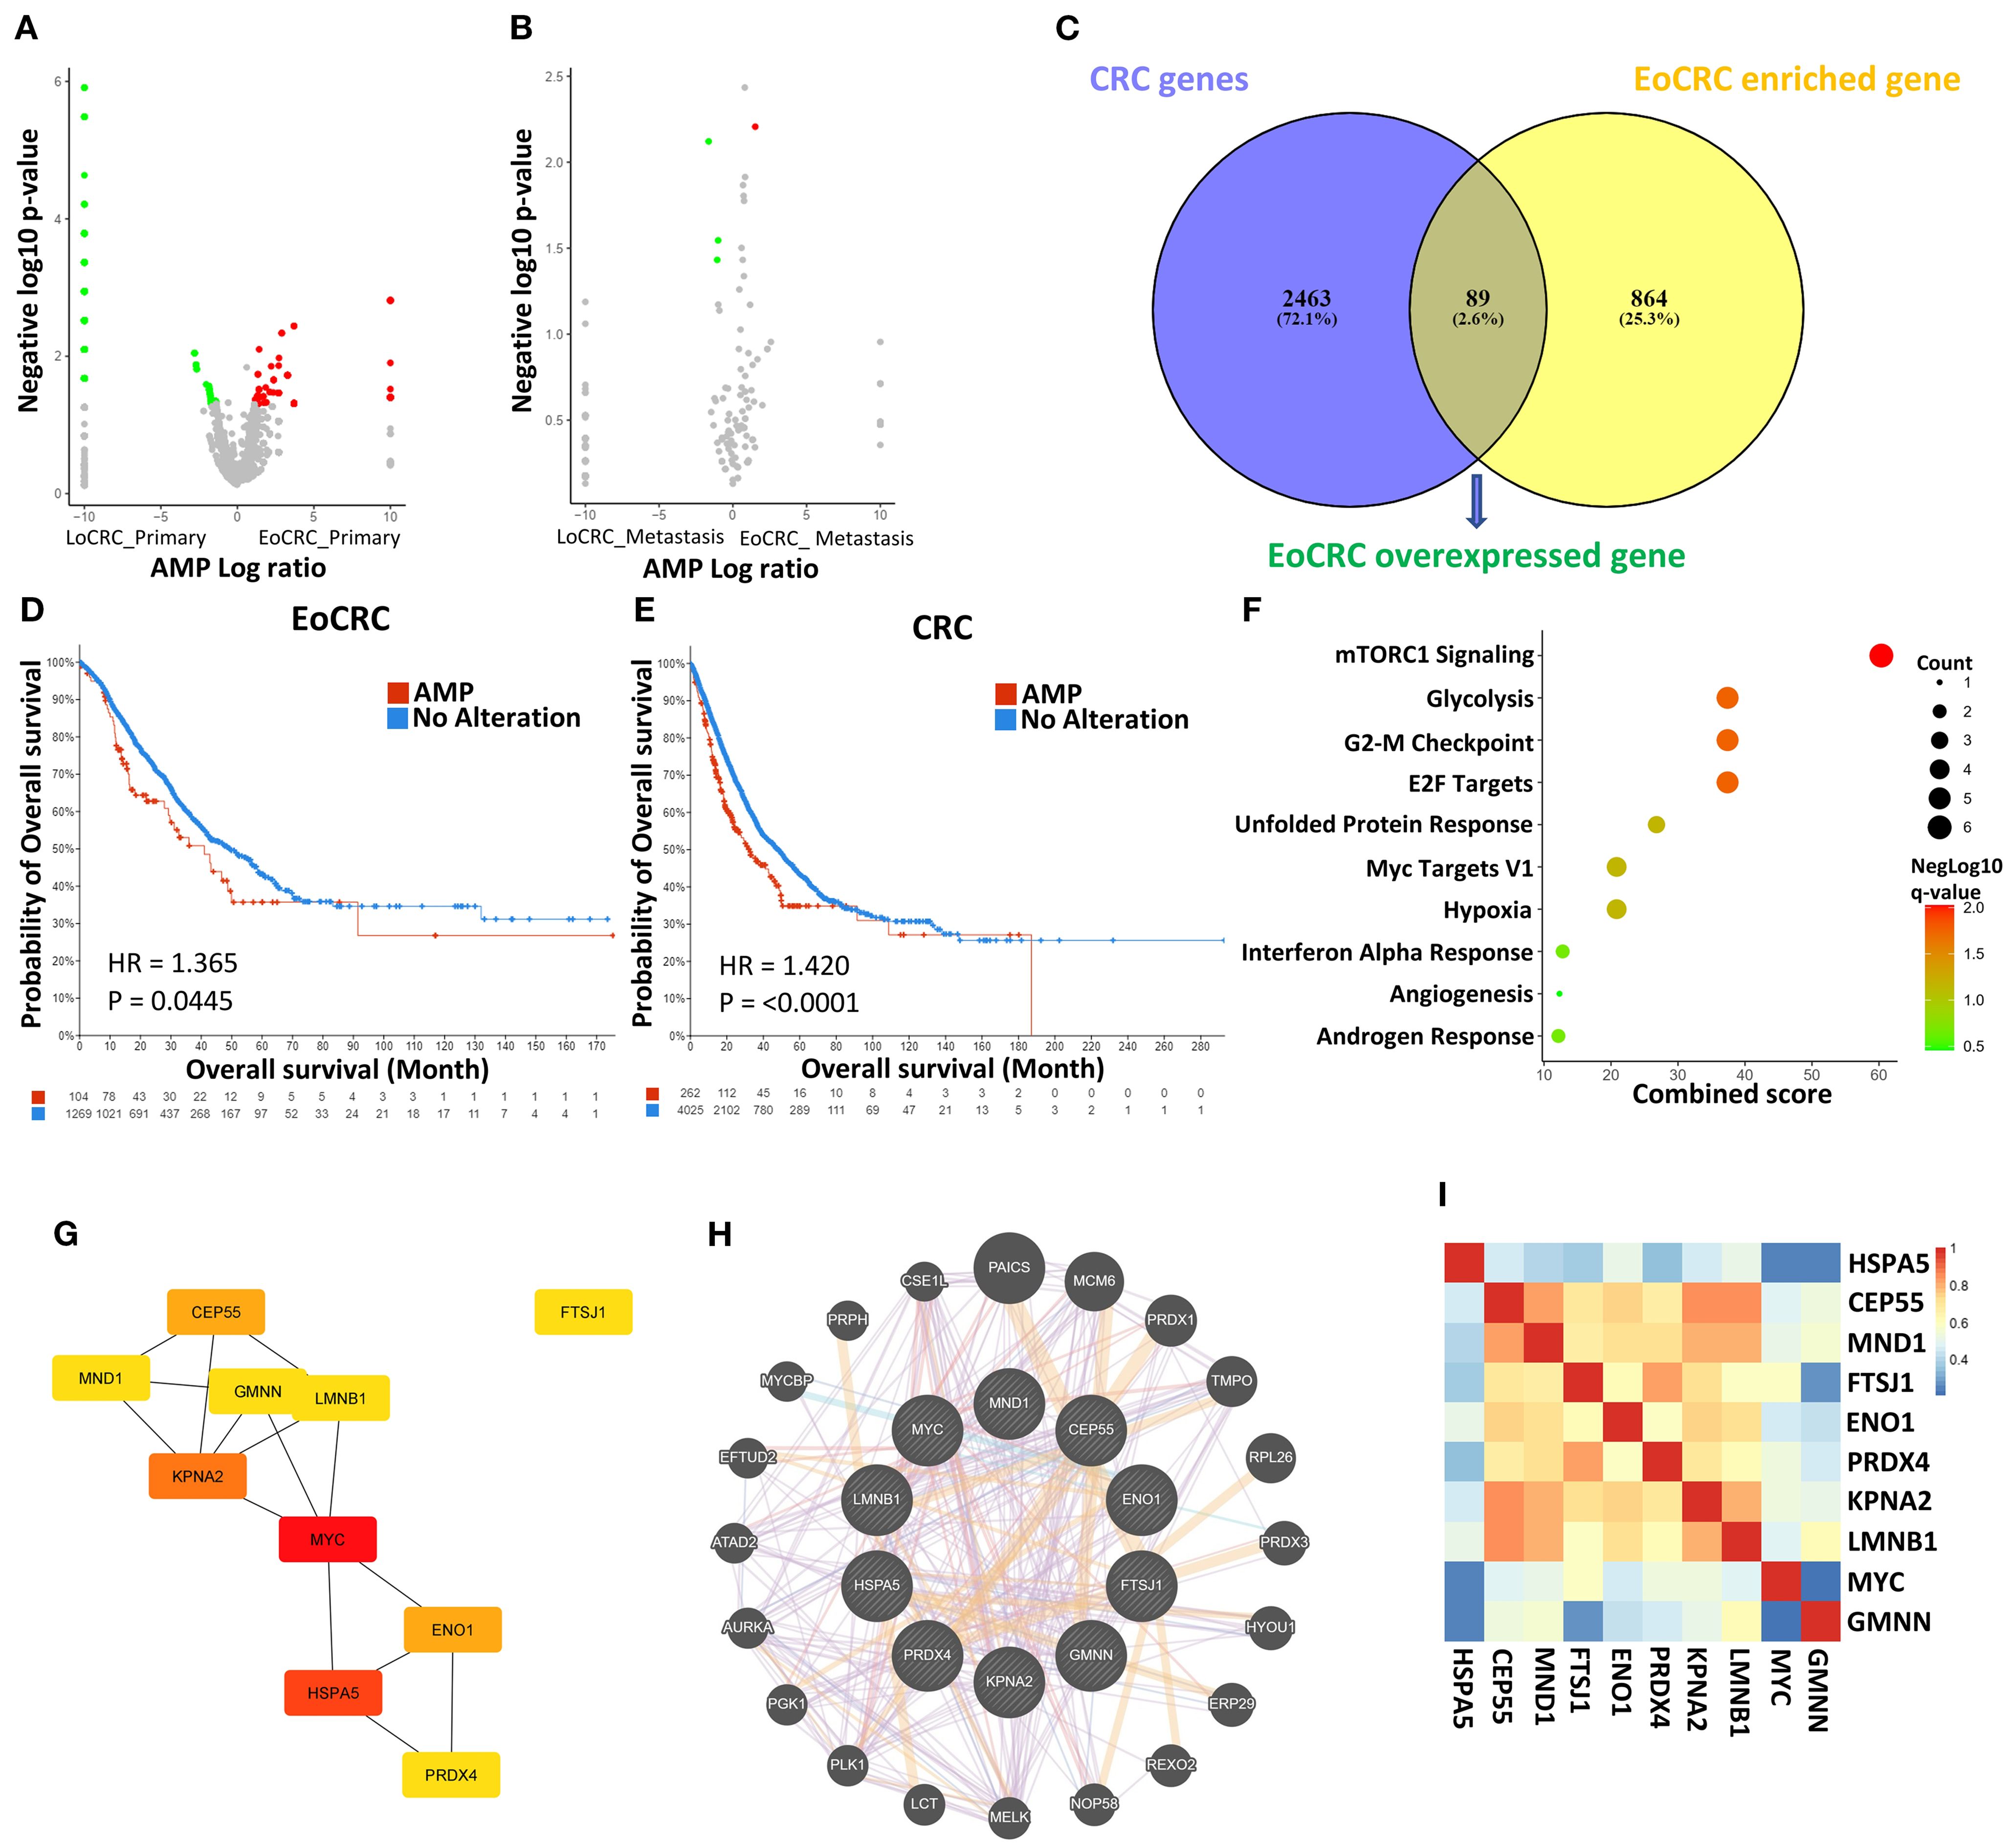
Figure 2. Analysis of gene expression data in EoCRC and LoCRC cohorts. (A, B) Volcano plots illustrating differentially expressed genes between EoCRC and LoCRC in primary colorectal cancer samples and metastatic samples, respectively. (C) Identification of EoCRC overexpressed genes by overlapping EoCRC-enriched genes with CRC gene database. (D, E) Comparison of overall survival between patients with amplified (AMP) and no-alteration (No Alteration) status of EoCRC overexpressed genes in the EoCRC and general CRC cohorts, respectively. (F) MSigDB Hallmark Pathway analysis of EoCRC overexpressed genes. (G) Identification of the top 10 hub genes based on their degree, using the Cytoscape/CytoHubba package. (H) Confirmation of protein–protein interactions (PPIs) among hub genes via GeneMANIA. (I) Validation of gene correlation among hub genes using GEPIA.
The STRING tool was used to predict PPI between the genes in the list. The results showed that 53 genes formed a PPI network (Supplementary Figure S1A). The top 10 hub gene-coded proteins showed a central role in the map (Figure 2G). These hub genes were known by the UniProtKB/Swiss-Prot Function as important for cell development (Supplementary Table S1). The interaction between these genes was confirmed through the Genemania tool (Figure 2H), and the prediction results also suggested that 22 other potential genes may be the signaling intermediaries for these genes. Correlations were also confirmed by the GEPIA dataset, showing that all are positive interactions (p ≤ 0.05) (Figure 2I).
3.3 Using a risk model as a validation of the hub genes’ impact
Because of the strong effects of high expression of hub genes in the OS of patients with EoCRC and CRC (Supplementary Figure S1B, C) from cBioPortal datasets, the impact of these hub genes was validated through the risk model in TCGA and GSE39582 datasets. We divided patients in each dataset into two risk groups based on the median risk value calculated (Figures 3A, F). The results confirmed that the high-risk group, as indicated by the expression of hub genes in both CRC and EoCRC patient groups, had significantly poorer survival rates compared to the low-risk group. This finding was consistent across both TCGA (Figures 3B, C) and GSE39582 datasets (Figures 3G, H). Although the predictive performance remains at a poor level, the AUC demonstrated higher diagnostic performance in the EoCRC cohort (0.747 and 0.730 in the TCGA and GSE39582 datasets, respectively) (Figures 3D, I), suggesting a more important role of hub genes in EoCRC compared to LoCRC (Figures 3E, J).
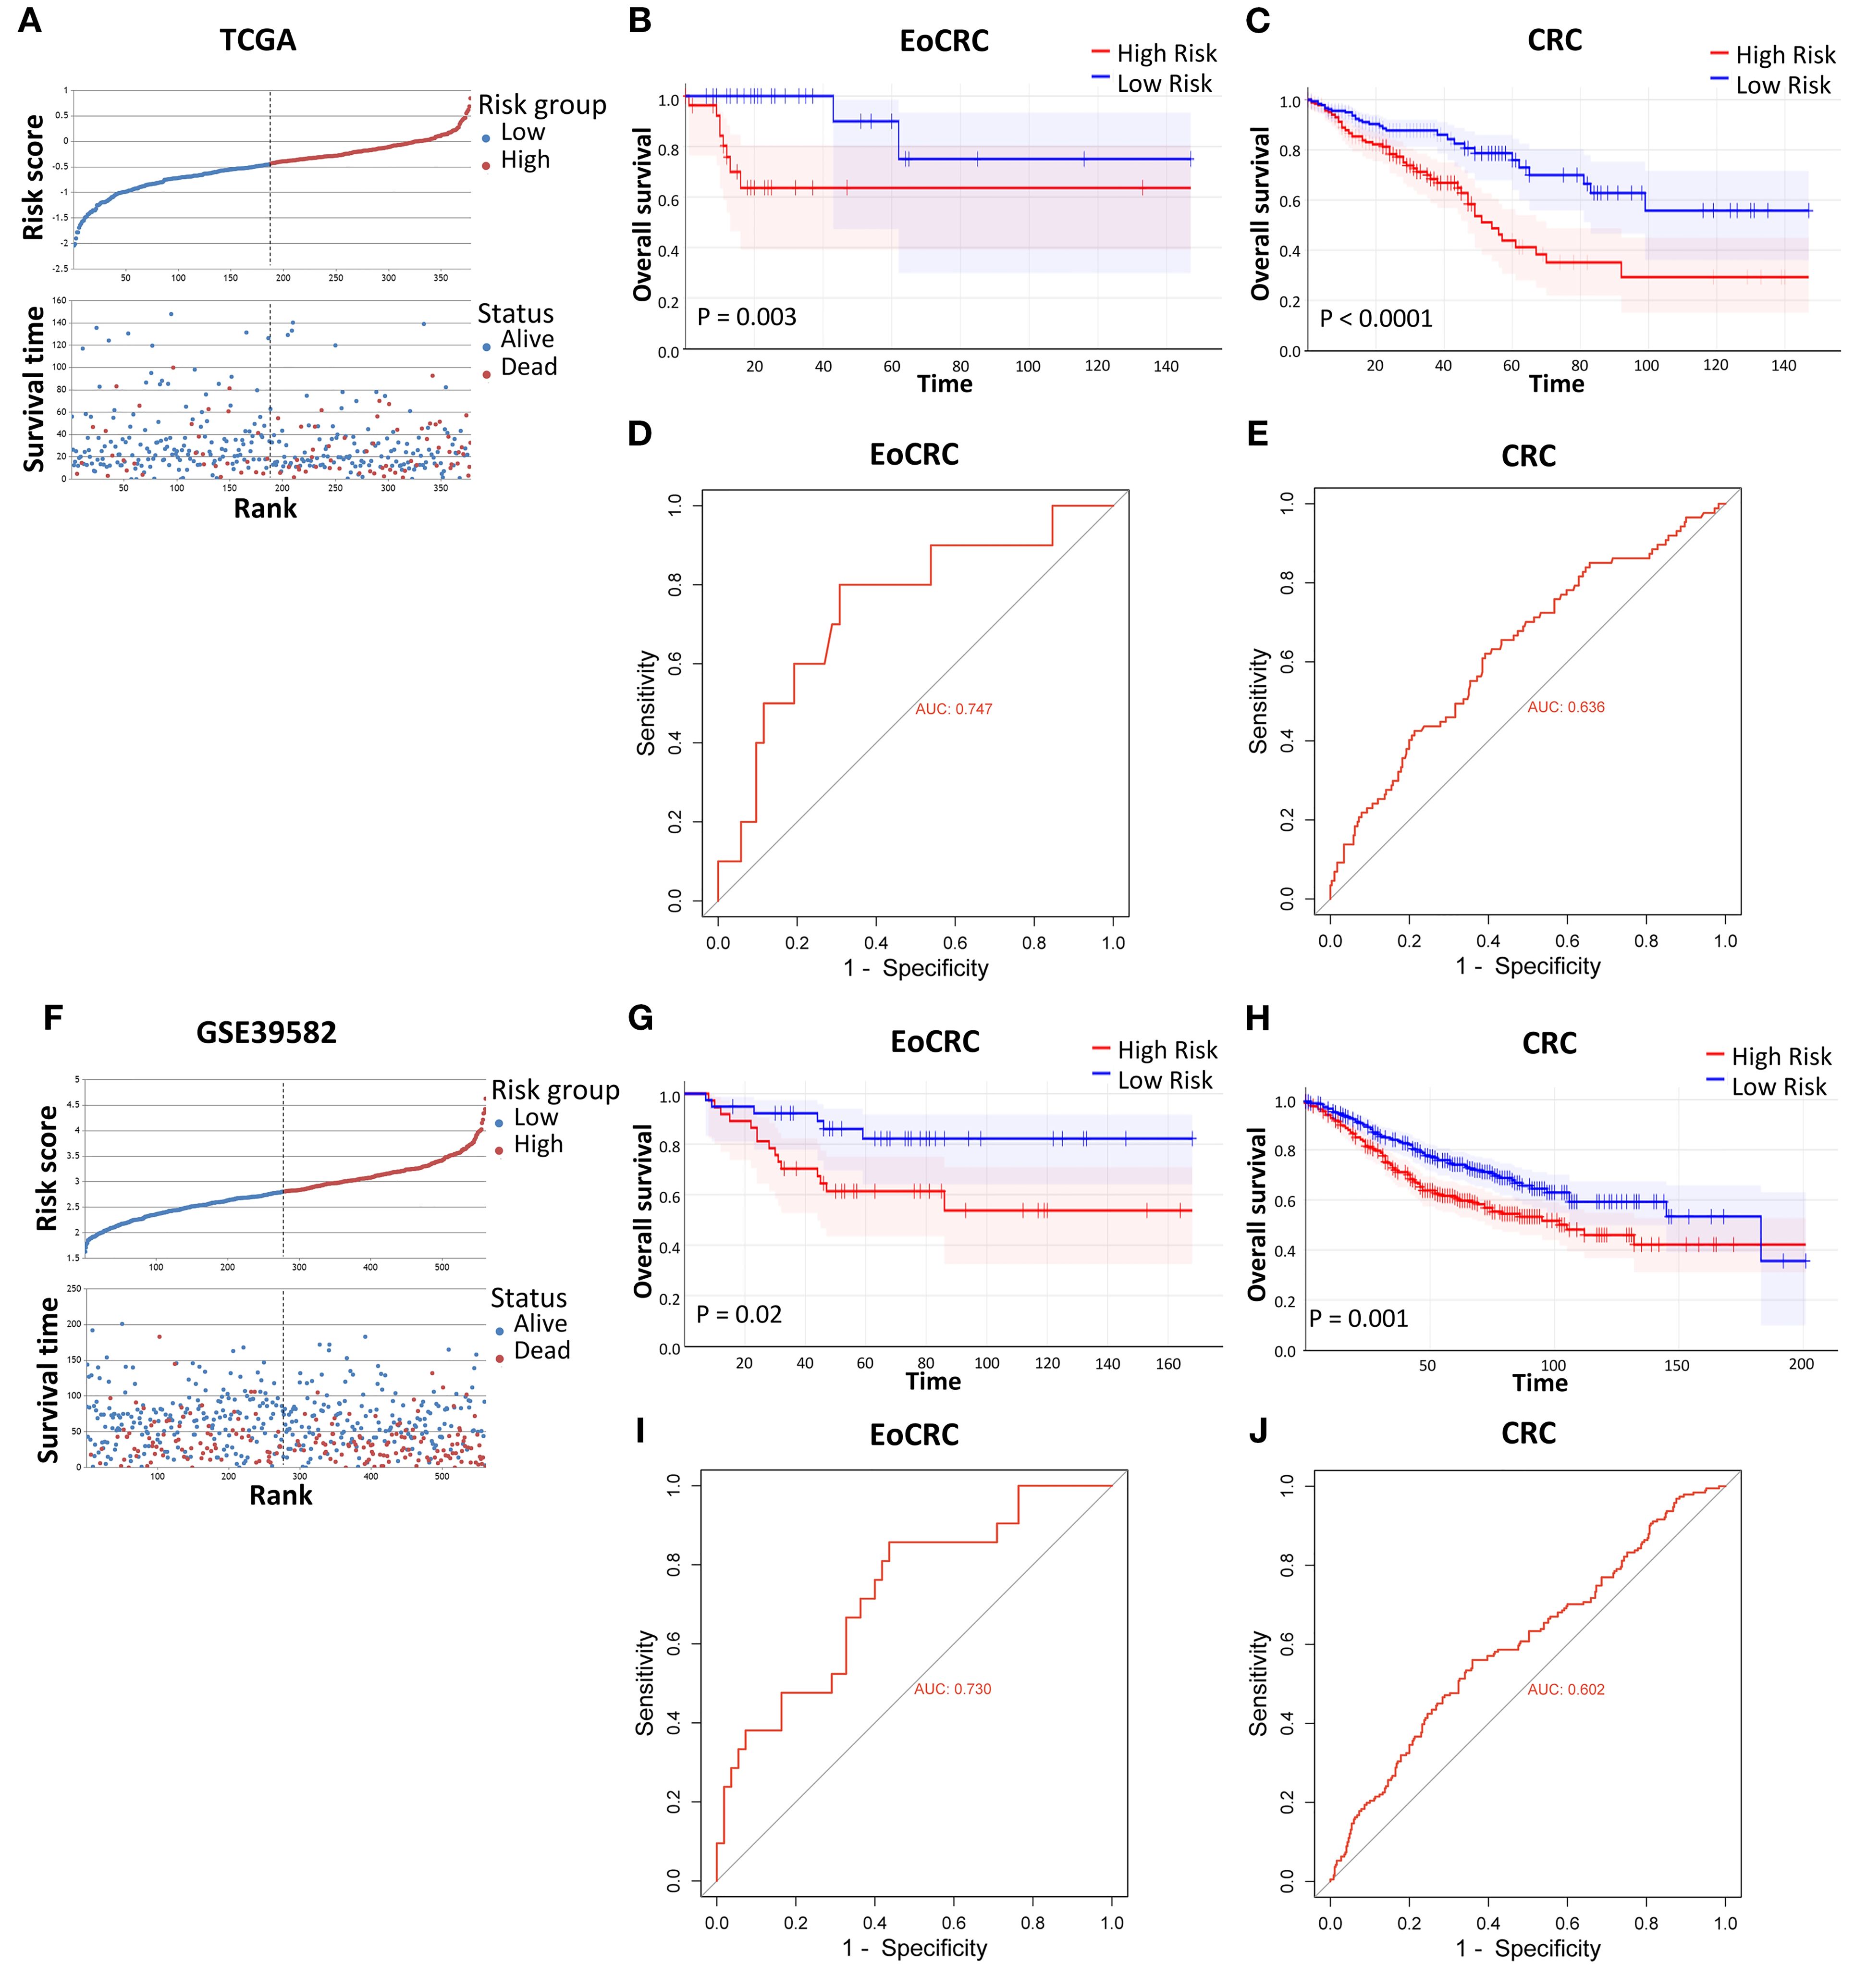
Figure 3. Validation of risk models on individual CRC datasets. (A, F) Relative survival visualization of CRC risk groups, separated by risk score median, in the TCGA and GSE39582 datasets, respectively. (B, C, G, H) Comparison of overall survival between high-risk and low-risk groups in the TCGA EoCRC and CRC cohorts, and the GSE39582 EoCRC and CRC cohorts, respectively. (D, E, I, J) ROC curve analysis evaluating the predictive performance of the risk model in the TCGA EoCRC and CRC cohorts, and the GSE39582 EoCRC and CRC cohorts, respectively.
3.4 Using a cell model as a validation of the hub genes’ impact
The expression levels of hub genes were assessed in our available CRC cell lines (Figure 4). These cells were organized in ascending order of donor age, including HT29 (44 years), HCT116 (48 years), LOVO (56 years), and HCT15 (67 years). The results indicated that these genes displayed higher expression levels compared to the control colorectal cell line CRL1459 except HSPA5 (Figure 4E). Additionally, we observed an inverse relationship between gene expression levels and age. This trend was more pronounced for the genes ENO1 (Figure 4B), GMNN (Figure 4D), KPNA2 (Figure 4F), MYC (Figure 4I), and PRDX4 (Figure 4J). As for the remaining genes (Figures 4A, C, E, G, H), they still demonstrated statistically significant differences between the cell groups obtained from EoCRC and LoCRC donors with the LOVO cell being a clear dividing point, but the trend exhibited lower stability. A summary of results showed that GMNN, KPNA2, MYC, and PRDX4 were deemed more stable for further functional analysis in the EoCRC cell model.
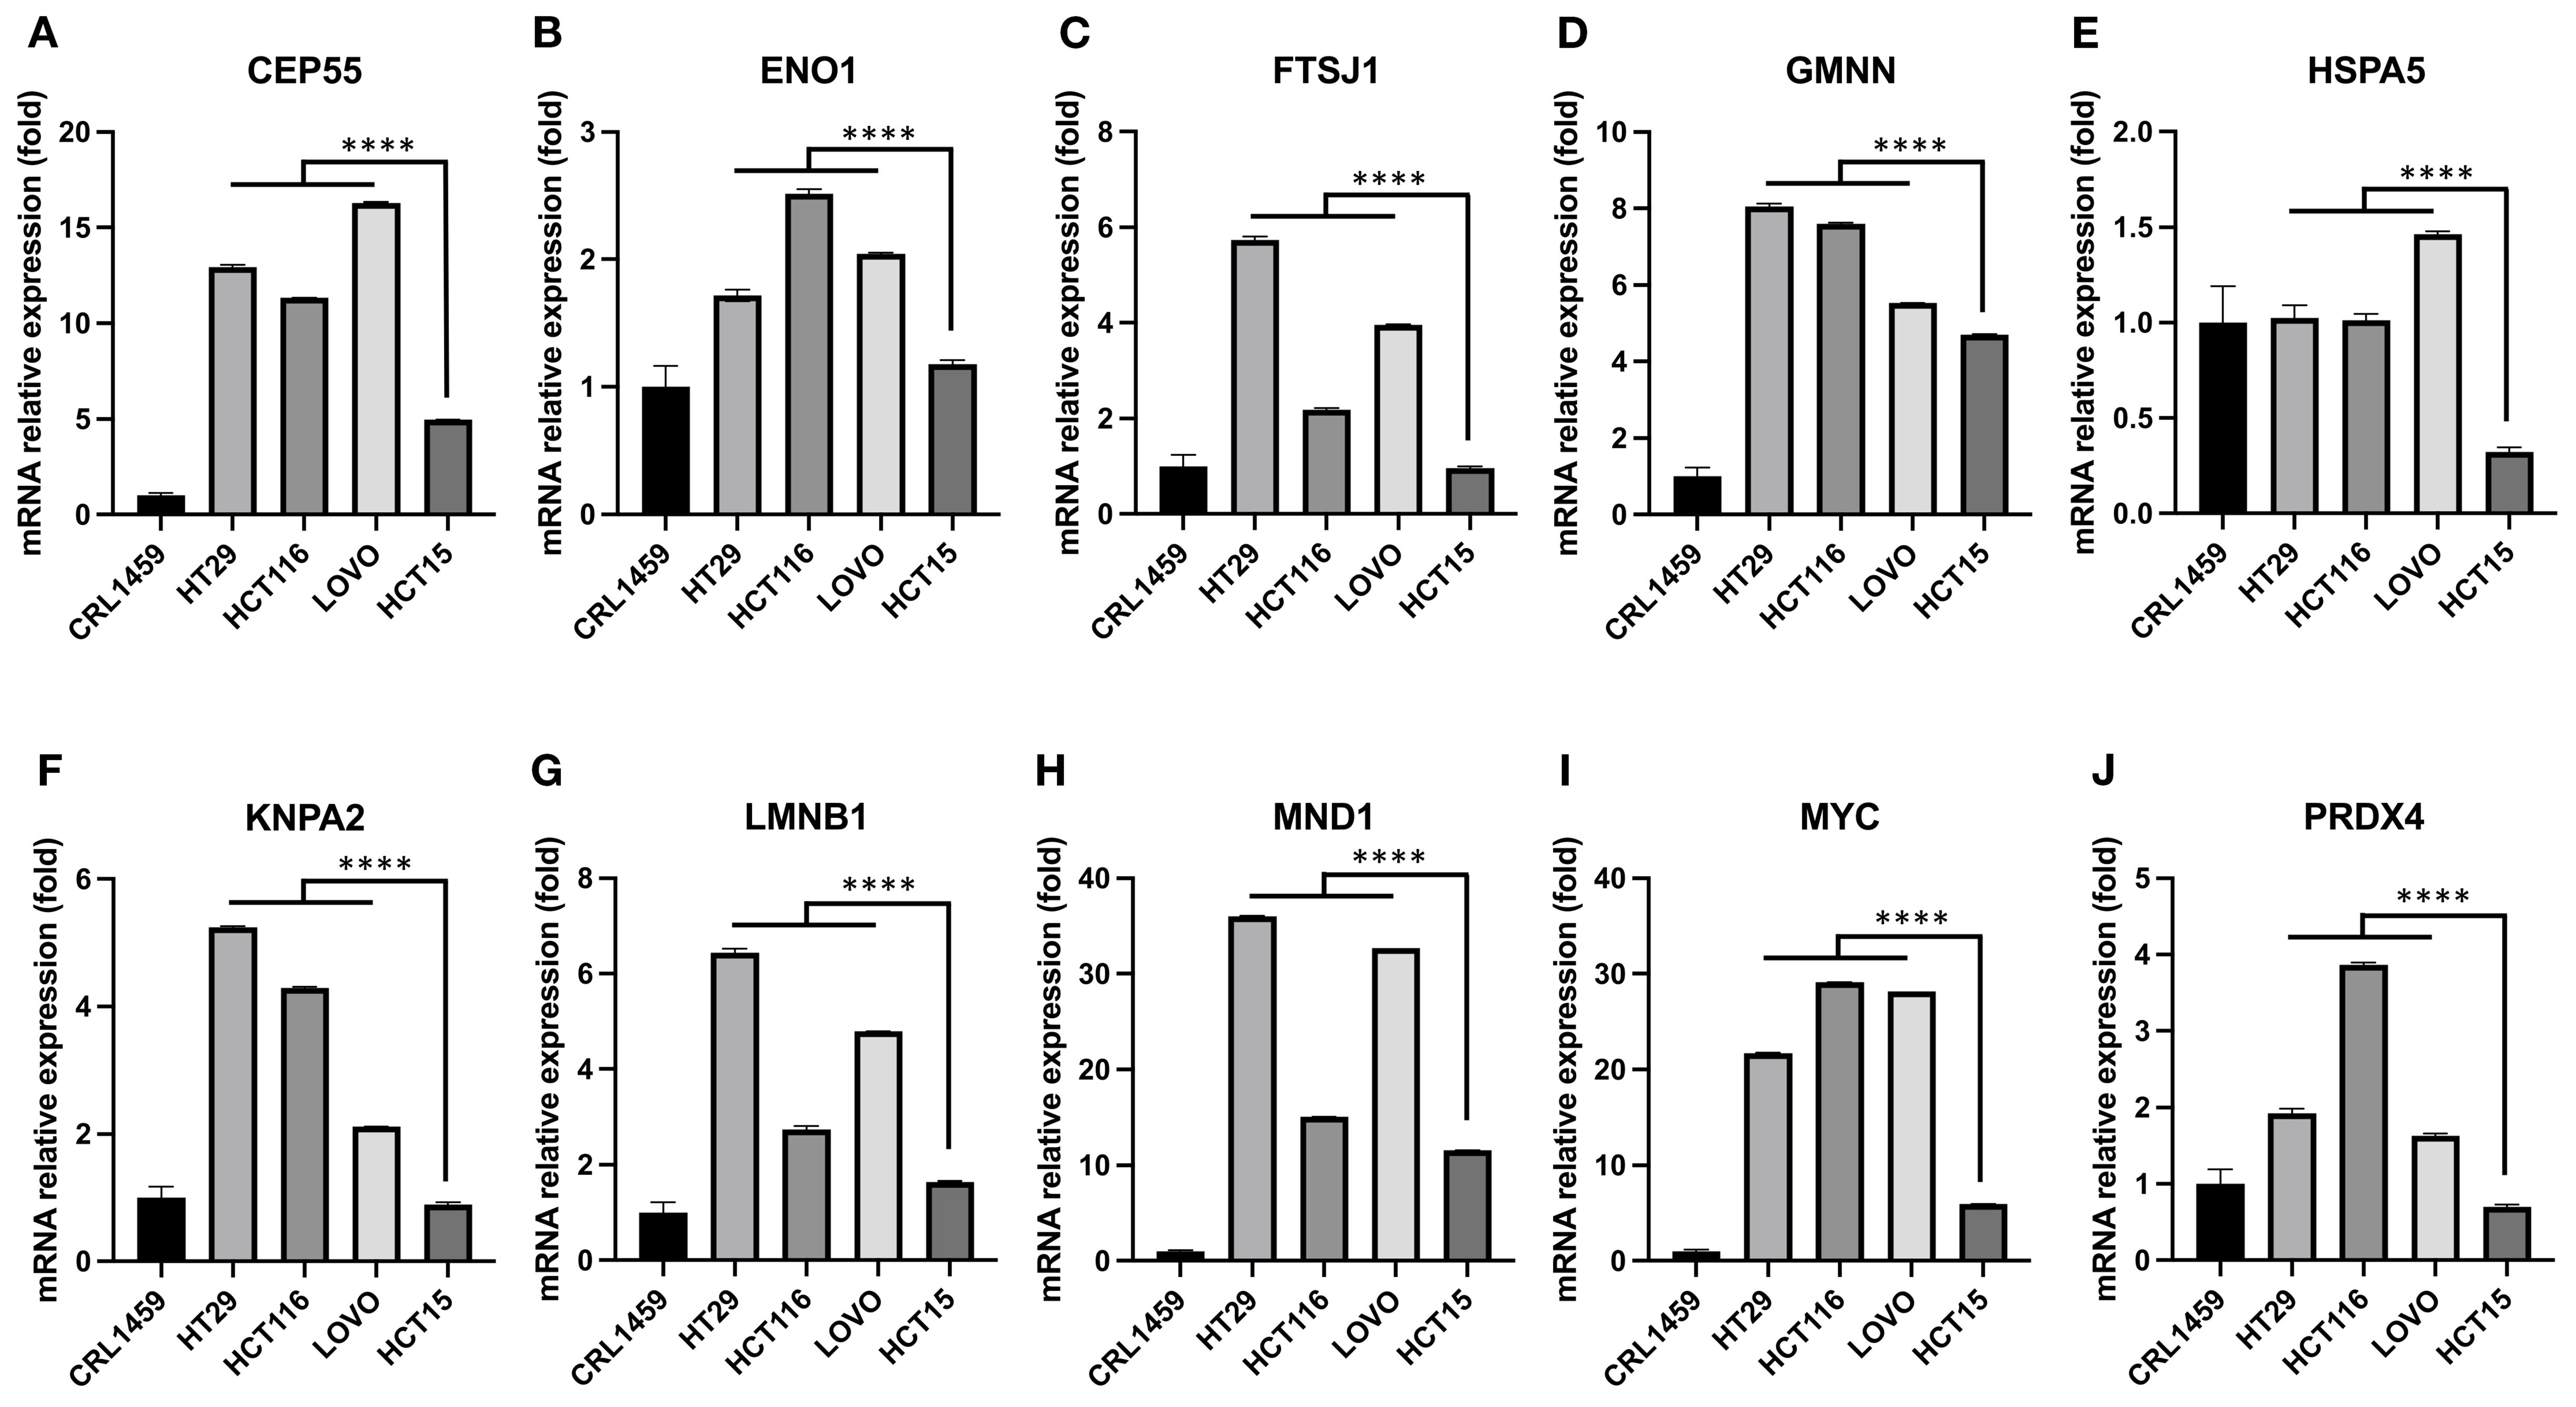
Figure 4. The relationship between hub gene expression levels and the age of cell donors in CRC cell lines. Hub gene expression was measured in CRC cell lines arranged from younger to older donor age—HT29 (44 y), HCT116 (48 y), LOVO (56 y), and HCT15 (67 y)—and compared with the normal colorectal cell line CRL1459. Overall, CRC cells showed higher expression than control for most hub genes, except HSPA5 (E). An inverse relationship with donor age was evident for ENO1 (B), GMNN (D), KPNA2 (F), MYC (I), and PRDX4 (J). For the remaining genes (A, C, E, G, and H), significant differences were still observed between cell groups derived from EoCRC and LoCRC donors, with LOVO (56 y) serving as a clear dividing point, though the age-related trend was less stable. Based on stability and significance across lines, GMNN, KPNA2, MYC, and PRDX4 were prioritized for subsequent functional studies in the EoCRC cell model. **** p ≤ 0.0001.
3.5 Role of EoCRC hub genes on tumor cell proliferation
Owing to their crucial role in regulating the mTORC1 signal pathway, the EoCRC hub gene function was essential for the development of EoCRC. Mutants of these hub genes were found to hinder both EoCRC and CRC development (Supplementary Figures S1D, E). Furthermore, analyzing the co-expressed genes of the chosen hub genes using IPA (Supplementary Figures S2A–D) revealed that these genes may play significant roles in cell cycle checkpoints and mitotic regulation (Supplementary Figure S2E). To determine the specific role of each gene in EoCRC, a hub gene-targeted knockdown assay was conducted. HCT116 and HT29 were selected due to their high and stable expression of the four genes, but only HCT116 demonstrated high efficiency of siRNA (Figures 5A–D and Table 2) and was used for further analysis. The results showed that all genes significantly impacted the growth of cancer cells (Figures 5E–H and Supplementary Figures S3A–D). They also exhibited a strong influence on markers representing the G0/G1 cell cycle checkpoint (CDK4 and Cyclin D1) and cell death (Cleaved-Caspase 3 and Cleaved-PARP) (Figure 5I and Supplementary Figures S3E–H). Moreover, the gene-targeted knockdown slightly impacted the phosphorylation of the mTOR protein, the pathway of which was related to the EoCRC PPI network (Figure 2F) and controlled the G0/G1 phase of the cell cycle (21).
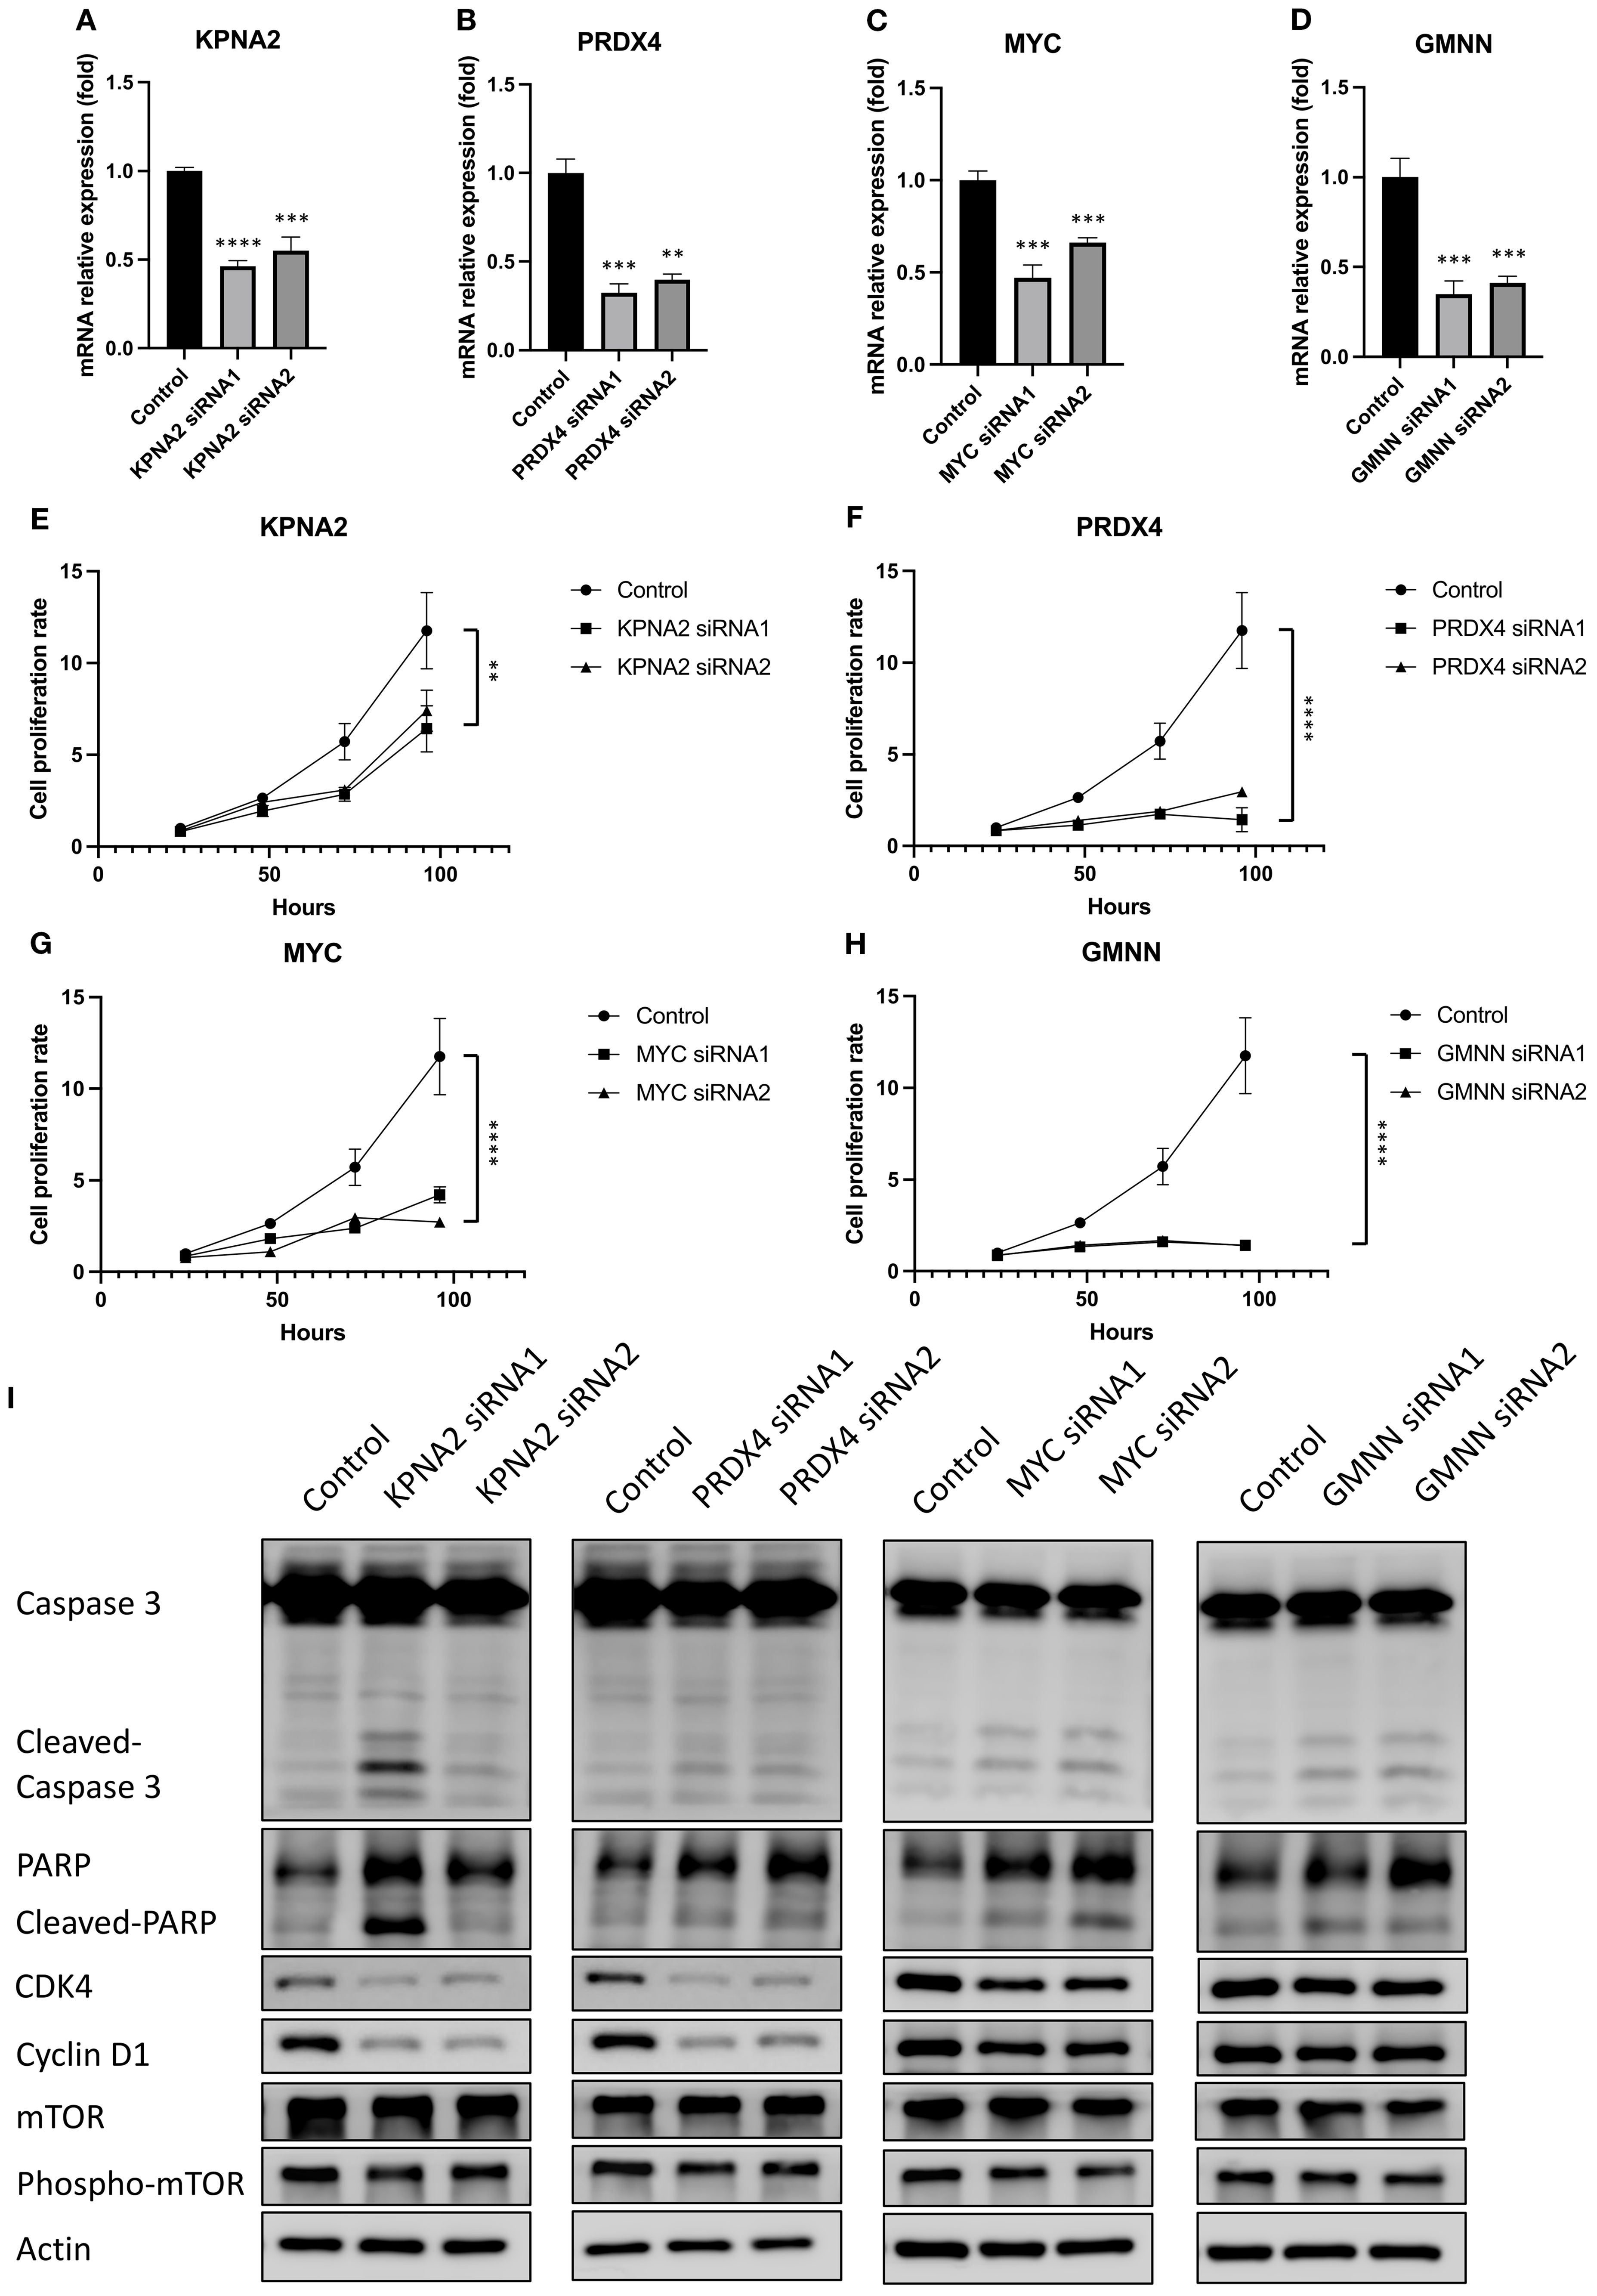
Figure 5. The effect of hub genes on the cell proliferation and cell cycle marker of EoCRC cell line HCT116. (A–D) RT-qPCR analysis demonstrating the knockdown efficiency of four selected hub genes. (E–H) Assessment of HCT116 cell line proliferation following knockdown of individual hub genes. (I) Western blot analysis of protein lysates from hub gene knockdown cell lines, evaluating changes in cell cycle and cell death markers. **p ≤ 0.01; ***p ≤ 0.001; ****p ≤ 0.0001.
3.6 Role of EoCRC hub genes on tumor cell cycle and apoptosis
The expression of cell cycle and cell apoptosis markers and the previous functional predictions provided evidence for us to test the role of these genes in cell cycle regulation and apoptosis (Figures 6A, F). Following flow cytometry analysis, cells with reduced expression of hub genes tended to arrest in the G0 phase instead of proceeding to the next growth phase (Figures 6B–E). In addition, the reduced expression of these genes also directly affected the rate of cells entering apoptosis (Figures 6G–J).
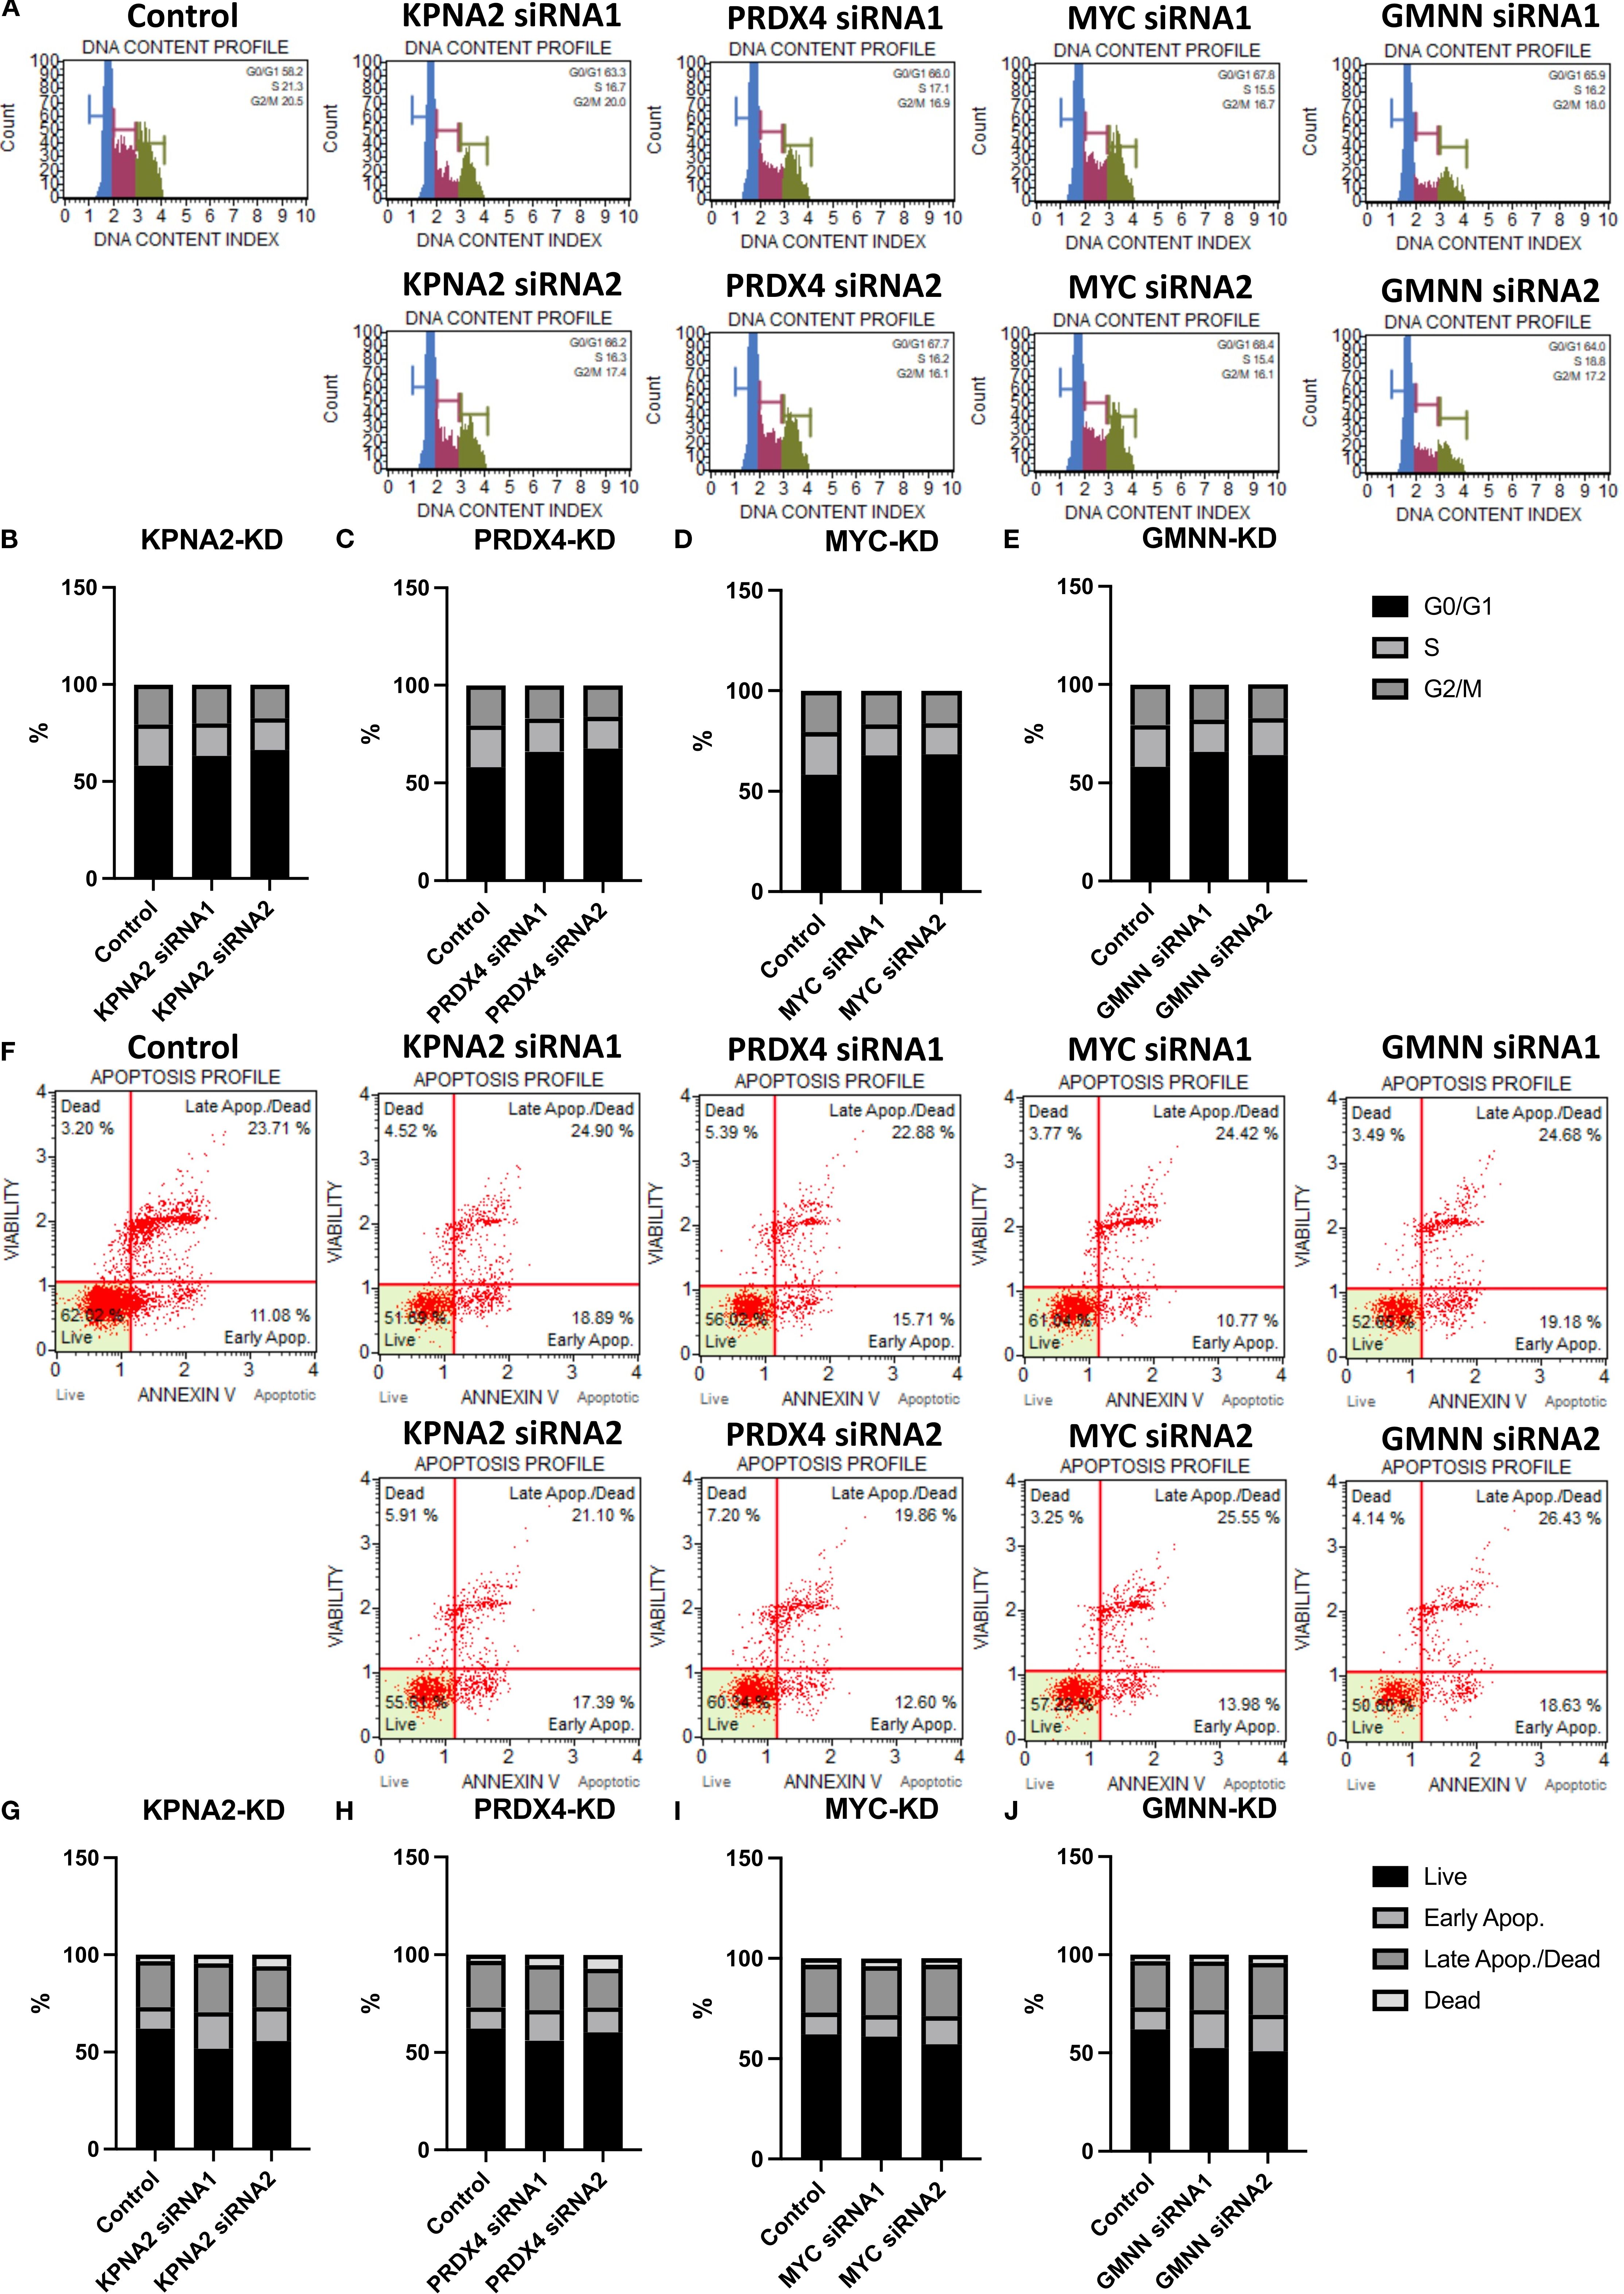
Figure 6. The effect of hub genes on the cell cycle and apoptosis of EoCRC cell line HCT116. (A) Cell cycle analysis of HCT116 cell lines following knockdown of hub genes. (B–E) Graphs illustrating the percentages of cells in different cell cycle phases for control and hub gene knockdown cell lines. (F) Apoptosis analysis of HCT116 cell lines after hub gene knockdown. (G–J) Graphs illustrating the percentages of apoptotic cells for control and hub gene knockdown cell lines.
4 Discussion
Previous studies have shown that the risk of developing EoCRC is associated with genetic, environmental, lifestyle, and late-stage diagnosis factors (3, 4, 22). However, using a large sample size of metadata to avoid biases due to race, genetics, and lifestyle of individual studies conducted in different regions (23–25), this study showed clinical evidence of increased tumor progression in early-onset patients reported in the previous research (26). These progressions not only were due to late detection (27) but also involved a mechanism that causes early-stage tumors to grow more rapidly.
Transcriptomic analysis revealed the significance of 89 overexpressed genes in primary colorectal cancer tumors. These genes play a crucial role in the survival of patients with CRC, particularly those with EoCRC, who often exhibit higher gene expression levels. The primary signaling pathways of these genes are all essential for regulating cell cycle and apoptosis (28, 29). This can be mediated by mTOR and regulated by E2F targeting (21, 30). Furthermore, there was a strong regulatory linkage between mTORC1 signaling and the glycolysis pathway, which is also being investigated. This evidence suggested that these pathways play a role in the connection between cancer and metabolic diseases such as obesity and diabetes (31, 32).
Furthermore, this study identified 10 hub genes that depended on PPI networks. Hub genes were genes with the highest number of interactions with other genes in the network. Therefore, these genes can be regulators or targets mediating various cancer regulatory processes (33, 34). This makes them important for cancer development processes. As regards all 10 genes found in this study and the correlation between their overexpression and the development of patients with CRC, patients exhibiting high expression of these genes are more likely to develop cancer than others in the group (35–38). However, diagnostic results in the EoCRC cohort demonstrated even better performance when utilizing hub genes for diagnosis among all patients with CRC. This has been validated not only in our metadata but also in independent datasets, including TCGA and two GEO datasets. Consequently, these genes may be regarded as potential targets for treatment and diagnosis, particularly for patients with EoCRC, and may play crucial roles in tumor growth.
To further elucidate the potential mechanisms of hub genes in EoCRC, we established a cancer cell model derived from patients of varying ages, reflecting differences in donor origin regarding the gene expression of the cell lines (39). While some genes in cell lines may display different expression results compared to their primary tissues (40)—an observation noted in long-term cultured cell lines—the trend in hub gene expression exhibited a negative correlation with donor age. We analyzed the results from the cell model tests to identify the four genes showing the highest correlation. These genes were expected to be the most affected by aging among those evaluated in this study, allowing the cell model testing to clarify their functions. In a previous study, all four genes were found to be related to cancer. MYC, a proto-oncogene, is frequently amplified or overexpressed in human cancers. It acts as a central transcriptional regulator, promoting cell proliferation and survival (41). KPNA2, a nuclear import protein, is often found elevated in various cancers. Its mislocalization of key regulatory proteins contributes to tumor progression and is linked to poor prognosis (42). PRDX4, an endoplasmic reticulum-resident antioxidant enzyme, helps cancer cells combat oxidative stress, promoting tumor growth, drug resistance, and metastasis (43). GMNN, a DNA replication inhibitor, is frequently overexpressed in tumors. Its dysregulation contributes to uncontrolled cell proliferation and genomic instability, making it a driver of cancer development (44). Both statistical analyses of the impact of the selected hub gene mutations and evaluations of gene knockdown demonstrated significant inhibition of tumor growth.
The EoCRC overexpression gene pathway prediction indicated their involvement in the mTORC1 pathway. Functional predictions and subsequent testing with protein markers in cell models confirmed that all four hub genes play crucial roles in regulating the G0/G1 phase of the cell cycle and apoptosis in EoCRC, which is one of the most significant functions of the mTOR and mTORC1 pathways (21, 45). Notably, there was a complex regulatory relationship between mTOR and MYC (44), and KPNA2 was also known to be regulated by mTOR (46). In this study, we discovered that the feedback impact of KPNA2 and MYC on mTOR phosphorylation may occur through the MYC nuclear transition of KPNA2 (42) or via EoCRC PPI networks. Additionally, we also identified the regulation of mTOR phosphorylation by two genes, PRDX4 and GMNN, suggesting that mTOR may mediate the cell cycle regulation of the selected hub genes. Flow cytometry results revealed that knockdown cells tend to arrest in the G0 phase before progressing to apoptosis. The cell cycle has long been regarded as a pathway through which aging influences cancer cell development (47); however, this study suggests a cell cycle-targeted mechanism by which tumor risk occurs in younger individuals rather than increasing with age (48).
In summary, this study analyzed molecular and clinical data to propose distinct mechanisms in patients with EoCRC associated with cancer prognosis. The identified top 10 hub genes showed an association with initial tumor development, and their roles in cell cycle and apoptosis have been suggested. These genes may serve as potential candidates for further studies to identify possible targets for EoCRC diagnosis and treatment.
Data availability statement
The original contributions presented in the study are included in the article/Supplementary Material. Further inquiries can be directed to the corresponding authors.
Author contributions
HN: Formal Analysis, Writing – original draft, Visualization, Data curation, Methodology, Conceptualization, Writing – review & editing. M-JC: Writing – review & editing, Investigation, Conceptualization. C-YL: Data curation, Writing – review & editing. Y-CN: Data curation, Writing – review & editing. KY: Data curation, Writing – review & editing. Y-FW: Validation, Writing – review & editing. K-HL: Funding acquisition, Project administration, Writing – review & editing, Supervision, Resources.
Funding
The author(s) declare financial support was received for the research and/or publication of this article. This research was funded by Department of Medical Research, Tri-Service General Hospital, National Defense Medical University (grant numbers: TSGH_E_114295 awarded to Y.-F.W.), Chi-Mei Medical Center (grant no.: 110CM-TMU-16 to K.-H.L., 111CM-TMU-09 to K.-H.L.), the Higher Education Sprout Project by the Ministry of Education (MOE) in Taiwan (grant numbers: DP2-111-21121-01-C-01-03 and DP2-TMU-112-C-05), the Health and Welfare Surcharge of Tobacco Products of Taiwan (Hualien Tzu Chi Hospital Joint Cancer Center; grant numbers: MOHW111-TDU-B-221-014013, MOHW112-TDU-B-221-124013, and MOHW113-TDU-B-222-134013; awarded to K.-H.L.), National Science and Technology Council (grant numbers: NSTC 112-2320-B-038-058, NSTC 113-2320-B-038-013, NSTC 113-2320-B-038-042, NSTC 113-2622-B-038-003, and NSTC 114-2320-B-038-006 awarded to K.-H.L.), and Taipei Medical University Research Center of Cancer Translational Medicine (Featured Areas Research Center Program, within the framework of the Higher Education Sprout Project by the Taiwanese Ministry of Education).
Acknowledgments
This work was financially supported by the Taipei Medical University Research Center of Cancer Translational Medicine, Featured Areas Research Center Program, within the framework of the Higher Education Sprout Project by the Taiwanese Ministry of Education.
Conflict of interest
The authors declare that the research was conducted in the absence of any commercial or financial relationships that could be construed as a potential conflict of interest.
Generative AI statement
The author(s) declare that no Generative AI was used in the creation of this manuscript.
Any alternative text (alt text) provided alongside figures in this article has been generated by Frontiers with the support of artificial intelligence and reasonable efforts have been made to ensure accuracy, including review by the authors wherever possible. If you identify any issues, please contact us.
Publisher’s note
All claims expressed in this article are solely those of the authors and do not necessarily represent those of their affiliated organizations, or those of the publisher, the editors and the reviewers. Any product that may be evaluated in this article, or claim that may be made by its manufacturer, is not guaranteed or endorsed by the publisher.
Supplementary material
The Supplementary Material for this article can be found online at: https://www.frontiersin.org/articles/10.3389/fonc.2025.1655143/full#supplementary-material
Supplementary Table 1 | The top 10 Degree hub genes were identified by Cytoscape/CytoHubba package.
Supplementary Figure 1 | Protein-protein interaction (PPI) of EoCRC overexpression genes. (A) Protein-protein interaction (PPI) map of EoCRC overexpression genes analyzed by STRING. (B, C) Comparison of overall survival between AMP and No Alteration hub genes in EoCRC and CRC cohort, respectively. (D, E) Comparison of overall survival between Wildtype and Mutation hub genes in EoCRC and CRC cohort, respectively.
Supplementary Figure 2 | Hub gene function pathway prediction and comparison analysis using correlation genes in TCGA EoCRC cohort. (A–D) Ingenuity Pathway Analysis (IPA) of four selected hub genes, illustrating their predicted functional pathways. (E) Pathway comparison analysis highlighting the shared biological pathways among these hub genes.
Supplementary Figure 3 | Statistical analysis of the effect of Hub Genes on the cell proliferation and cell cycle markers of EoCRC cell line HCT116. (A–D) Cell viability comparison between control and knockdown HCT116 cell lines, assessed every 24 h after knockdown for each of the four hub genes. (E–H) Quantitative protein expression levels of cell cycle and cell death markers for each knockdown cell lines, analyzed using ImageJ software. ns: non-statistical significance; *p ≤ 0.05; **p ≤ 0.01; ***p ≤ 0.001; ****p ≤ 0.0001.
References
1. Bailey CE, Hu C-Y, You YN, Bednarski BK, Rodriguez-Bigas MA, Skibber JM, et al. Increasing disparities in the age-related incidences of colon and rectal cancers in the United States, 1975-2010. JAMA Surg. (2015) 150:17–22. doi: 10.1001/jamasurg.2014.1756
2. Mauri G, Sartore-Bianchi A, Russo AG, Marsoni S, Bardelli A, and Siena S. Early-onset colorectal cancer in young individuals. Mol Oncol. (2019) 13:109–31. doi: 10.1002/1878-0261.12417
3. Stoffel EM and Murphy CC. Epidemiology and mechanisms of the increasing incidence of colon and rectal cancers in young adults. Gastroenterology. (2020) 158:341–53. doi: 10.1053/j.gastro.2019.07.055
4. Akimoto N, Ugai T, Zhong R, Hamada T, Fujiyoshi K, Giannakis M, et al. Rising incidence of early-onset colorectal cancer—a call to action. Nat Rev Clin Oncol. (2021) 18:230–43. doi: 10.1038/s41571-020-00445-1
5. Shah RR, Millien VO, da Costa WL Jr., Oluyomi AO, Gould Suarez M, and Thrift AP. Trends in the incidence of early-onset colorectal cancer in all 50 United States from 2001 through 2017. Cancer. (2022) 128:299–310. doi: 10.1002/cncr.33916
6. Jin Z, Dixon JG, Fiskum JM, Parekh HD, Sinicrope FA, Yothers G, et al. Clinicopathological and molecular characteristics of early-onset stage III colon adenocarcinoma: an analysis of the accent database. J Natl Cancer Inst. (2021) 113:1693–704. doi: 10.1093/jnci/djab123
7. Cercek A, Chatila WK, Yaeger R, Walch H, Fernandes GDS, Krishnan A, et al. A comprehensive comparison of early-onset and average-onset colorectal cancers. J Natl Cancer Inst. (2021) 113:1683–92. doi: 10.1093/jnci/djab124
8. Golub TR, Slonim DK, Tamayo P, Huard C, Gaasenbeek M, Mesirov JP, et al. Molecular classification of cancer: class discovery and class prediction by gene expression monitoring. Science. (1999) 286:531–7. doi: 10.1126/science.286.5439.531
9. Loda M, Mucci LA, Mittelstadt ML, Van Hemelrijck M, and Cotter MB. Pathology and Epidemiology of Cancer. Cham, Switzerland: Springer International Publishing (2016).
10. Lodish H, Berk A, Zipursky SL, Matsudaira P, Baltimore D, and Darnell J. Proto-oncogenes and tumor-suppressor genes. Mol Cell Biol. (2000) 4:1121–53.
11. Marx O, Mankarious M, and Yochum G. Molecular genetics of early-onset colorectal cancer. World J Biol Chem. (2023) 14:13–27. doi: 10.4331/wjbc.v14.i2.13
12. Yan HH, Siu HC, Ho SL, Yue SS, Gao Y, Tsui WY, et al. Organoid cultures of early-onset colorectal cancers reveal distinct and rare genetic profiles. Gut. (2020) 69:2165–79. doi: 10.1136/gutjnl-2019-320019
13. Yokota K, Tanaka Y, Harada H, Kaida T, Nakamoto S, Soeno T, et al. WiNTRLINC1/ASCL2/C-myc axis characteristics of colon cancer with differentiated histology at young onset and essential for cell viability. Ann Surg Oncol. (2019) 26:4826–34. doi: 10.1245/s10434-019-07780-3
14. Watson KM, Gardner IH, Byrne RM, Ruhl RR, Lanciault CP, Dewey EN, et al. Differential expression of PEG10 contributes to aggressive disease in early versus late onset colorectal cancer. Dis Colon Rectum. (2020) 63:1610. doi: 10.1097/DCR.0000000000001774
15. Kirzin S, Marisa L, Guimbaud R, De Reynies A, Legrain M, Laurent-Puig P, et al. Sporadic early-onset colorectal cancer is a specific sub-type of cancer: A morphological, molecular and genetics study. PloS One. (2014) 9:e103159. doi: 10.1371/journal.pone.0103159
16. Chin CH, Chen SH, Wu HH, Ho CW, Ko MT, and Lin CY. Cytohubba: identifying hub objects and sub-networks from complex interactome. BMC Syst Biol. (2014) 8 Suppl 4:S11. doi: 10.1186/1752-0509-8-S4-S11
17. Krämer A, Green J, Pollard J Jr., and Tugendreich S. Causal analysis approaches in ingenuity pathway analysis. Bioinformatics. (2014) 30:523–30. doi: 10.1093/bioinformatics/btt703
18. Schneider CA, Rasband WS, and Eliceiri KW. NIH image to ImageJ: 25 years of image analysis. Nat Methods. (2012) 9:671–5. doi: 10.1038/nmeth.2089
19. Beroukhim R, Getz G, Nghiemphu L, Barretina J, Hsueh T, Linhart D, et al. Assessing the significance of chromosomal aberrations in cancer: methodology and application to glioma. Proc Natl Acad Sci U.S.A. (2007) 104:20007–12. doi: 10.1073/pnas.0710052104
20. Ritchie ME, Phipson B, Wu D, Hu Y, Law CW, Shi W, et al. Limma powers differential expression analyses for RNA-sequencing and microarray studies. Nucleic Acids Res. (2015) 43:e47. doi: 10.1093/nar/gkv007
21. Proud CG. Mtorc1 and cell cycle control. In: The Enzymes, vol. 27. New York, United States: Elsevier (2010). p. 129–46.
22. Peterse EF, Meester RG, Siegel RL, Chen JC, Dwyer A, Ahnen DJ, et al. The impact of the rising colorectal cancer incidence in young adults on the optimal age to start screening: microsimulation analysis I to inform the American cancer society colorectal cancer screening guideline. Cancer. (2018) 124:2964–73. doi: 10.1002/cncr.31543
23. Holowatyj AN, Ruterbusch JJ, Rozek LS, Cote ML, and Stoffel EM. Racial/ethnic disparities in survival among patients with young-onset colorectal cancer. J Clin Oncol. (2016) 34:2148. doi: 10.1200/JCO.2015.65.0994
24. Wang DY, Thrift AP, Zarrin-Khameh N, Wichmann A, Armstrong GN, Thompson PA, et al. Rising incidence of colorectal cancer among young hispanics in Texas. J Clin Gastroenterol. (2017) 51:34. doi: 10.1097/MCG.0000000000000563
25. Spratt DE, Chan T, Waldron L, Speers C, Feng FY, Ogunwobi OO, et al. Racial/ethnic disparities in genomic sequencing. JAMA Oncol. (2016) 2:1070–4. doi: 10.1001/jamaoncol.2016.1854
26. Wang H, Cai Y, Jin M, Huang CQ, Ning C, Niu S, et al. Identification of specific susceptibility loci for the early-onset colorectal cancer. Genome Med. (2023) 15:13. doi: 10.1186/s13073-023-01163-w
27. Eng C, Jacome AA, Agarwal R, Hayat MH, Byndloss MX, Holowatyj AN, et al. A comprehensive framework for early-onset colorectal cancer research. Lancet Oncol. (2022) 23:110–36. doi: 10.1016/S1470-2045(21)00588-X
28. Barnaba N and LaRocque JR. Targeting cell cycle regulation via the G2-M checkpoint for synthetic lethality in melanoma. Cell Cycle. (2021) 20:1041–51. doi: 10.1080/15384101.2021.1922806
29. Oshi M, Patel A, Le L, Tokumaru Y, Yan L, Matsuyama R, et al. G2M checkpoint pathway alone is associated with drug response and survival among cell proliferation-related pathways in pancreatic cancer. Am J Cancer Res. (2021) 11:3070.
30. Iwanaga R, Komori H, Ishida S, Okamura N, Nakayama K, Nakayama KI, et al. Identification of novel E2f1 target genes regulated in cell cycle-dependent and independent manners. Oncogene. (2006) 25:1786–98. doi: 10.1038/sj.onc.1209210
31. Marafie SK, Al-Mulla F, and Abubaker J. mTOR: its critical role in metabolic diseases, cancer, and the aging process. Int J Mol Sci. (2024) 25:6141. doi: 10.3390/ijms25116141
32. Zhou D, Duan Z, Li Z, Ge F, Wei R, and Kong L. The significance of glycolysis in tumor progression and its relationship with the tumor microenvironment. Front Pharmacol. (2022) 13:1091779. doi: 10.3389/fphar.2022.1091779
33. Liu S, Zeng F, Fan G, and Dong Q. Identification of hub genes and construction of a transcriptional regulatory network associated with tumor recurrence in colorectal cancer by weighted gene co-expression network analysis. Front Genet. (2021) 12:649752. doi: 10.3389/fgene.2021.649752
34. Liu Y, Gu H-Y, Zhu J, Niu Y-M, Zhang C, and Guo G-L. Identification of hub genes and key pathways associated with bipolar disorder based on weighted gene co-expression network analysis. Front Physiol. (2019) 10:1081. doi: 10.3389/fphys.2019.01081
35. Tan L, Peng D, and Cheng Y. Significant position of C-myc in colorectal cancer: A promising therapeutic target. Clin Transl Oncol. (2022) 24:2295–304. doi: 10.1007/s12094-022-02910-y
36. Gu J, Zhong K, Wang L, Ni H, Zhao Y, Wang X, et al. ENO1 contributes to 5-fluorouracil resistance in colorectal cancer cells via EMT pathway. Front Oncol. (2022) 12:1013035. doi: 10.3389/fonc.2022.1013035
37. Takada T, Tsutsumi S, Takahashi R, Ohsone K, Tatsuki H, Suto T, et al. KPNA2 over-expression is a potential marker of prognosis and therapeutic sensitivity in colorectal cancer patients. J Surg Oncol. (2016) 113:213–7. doi: 10.1002/jso.24114
38. Wang R, Hua L, Ma P, Song Y, Min J, Guo Y, et al. HSPA5 repressed ferroptosis to promote colorectal cancer development by maintaining GPX4 stability. Neoplasma. (2022) 69:1054–69. doi: 10.4149/neo_2022_220331N363
39. Jin H, Zhang C, Zwahlen M, Von Feilitzen K, Karlsson M, Shi M, et al. Systematic transcriptional analysis of human cell lines for gene expression landscape and tumor representation. Nat Commun. (2023) 14:5417. doi: 10.1038/s41467-023-41132-w
40. Lopes-Ramos CM, Paulson JN, Chen CY, Kuijjer ML, Fagny M, Platig J, et al. Regulatory network changes between cell lines and their tissues of origin. BMC Genomics. (2017) 18:723. doi: 10.1186/s12864-017-4111-x
41. Dhanasekaran R, Deutzmann A, Mahauad-Fernandez WD, Hansen AS, Gouw AM, and Felsher DW. The myc oncogene - the grand orchestrator of cancer growth and immune evasion. Nat Rev Clin Oncol. (2022) 19:23–36. doi: 10.1038/s41571-021-00549-2
42. Huang L, Zhou Y, Cao XP, Lin JX, Zhang L, Huang ST, et al. KPNA2 promotes migration and invasion in epithelial ovarian cancer cells by inducing epithelial-mesenchymal transition via Akt/GSK-3β/snail activation. J Cancer. (2018) 9:157–65. doi: 10.7150/jca.20879
43. Jia W, Chen P, and Cheng Y. PRDX4 and its roles in various cancers. Technol Cancer Res Treat. (2019) 18:1533033819864313. doi: 10.1177/1533033819864313
44. Kushwaha PP, Rapalli KC, and Kumar S. Geminin a multi task protein involved in cancer pathophysiology and developmental process: A review. Biochimie. (2016) 131:115–27. doi: 10.1016/j.biochi.2016.09.022
45. Luo C, Xiao Z, and Yang W. GNG2 inhibits brain metastases from colorectal cancer via PI3K/AKT/mTOR signaling pathway. Sci Rep. (2025) 15:1787. doi: 10.1038/s41598-025-85592-0
46. Wang CI, Chen YY, Wang CL, Yu JS, Chang YS, and Yu CJ. mTOR regulates proteasomal degradation and Dp1/E2F1- mediated transcription of KPNA2 in lung cancer cells. Oncotarget. (2016) 7:25432–42. doi: 10.18632/oncotarget.8170
47. Sedrak MS and Cohen HJ. The aging-cancer cycle: mechanisms and opportunities for intervention. J Gerontol A Biol Sci Med Sci. (2023) 78:1234–8. doi: 10.1093/gerona/glac247
Keywords: early-onset colorectal cancer, metadata, transcriptome, risk model, EoCRC cell model, cell cycle, apoptosis, EOCRC
Citation: Nguyen HD, Chen M-J, Lee C-Y, Ni Y-C, Yee KX, Wu Y-F and Lee K-H (2025) Transcriptome analyses identify 10 deregulated hub genes and essential molecular mechanisms in early-onset colorectal cancer. Front. Oncol. 15:1655143. doi: 10.3389/fonc.2025.1655143
Received: 27 June 2025; Accepted: 08 September 2025;
Published: 29 September 2025.
Edited by:
Manuel Gentiluomo, University of Pisa, ItalyReviewed by:
Sheefa Mirza, University of the Witwatersrand, South AfricaSemih Dalkilic, Firat University, Türkiye
Copyright © 2025 Nguyen, Chen, Lee, Ni, Yee, Wu and Lee. This is an open-access article distributed under the terms of the Creative Commons Attribution License (CC BY). The use, distribution or reproduction in other forums is permitted, provided the original author(s) and the copyright owner(s) are credited and that the original publication in this journal is cited, in accordance with accepted academic practice. No use, distribution or reproduction is permitted which does not comply with these terms.
*Correspondence: Yung-Fu Wu, cHJpbmNlMTEwOUBtYWlsLm5kbWN0c2doLmVkdS50dw==; Kuen-Haur Lee, a2hsZWVAdG11LmVkdS50dw==