 Weikang Wang1†
 Ling Xiao1†Mei He2†
 Ruimei Feng3
 Xiaoyin Huang1
 Qingling Su1Xiujian Xue2
 Zhijian Hu1
 Qian Zhang1
 Shanshan Du1*Hong Lin4*
 Weimin Ye1,5*
- 1Department of Epidemiology and Health Statistics, School of Public Health, Fujian Medical University, Fuzhou, Fujian, China
- 2Department of Ultrasonography, Fuqing City Hospital Affiliated to Fujian Medical University, Fuqing, Fujian, China
- 3Department of Epidemiology, School of Public Health, Shanxi Medical University, Taiyuan, Shanxi, China
- 4Department of General Surgery, Fuqing City Hospital Affiliated to Fujian Medical University, Fuqing, Fujian, China
- 5Department of Medical Epidemiology and Biostatistics, Karolinska Institutet, Stockholm, Sweden
Objective: To describe the prevalence of thyroid nodules (TNs), their ultrasonographic characteristics, and the cancer risk assessment using the Thyroid Imaging Reporting and Data System (TIRADS) in a natural population, while also exploring their association with multiple metabolic disorders. This study aims to provide insight into the disease burden of TNs in the coastal area of Southeast China.
Design: A cross-sectional study.
Setting and participants: A total of 6221 participants from the baseline survey of the Fuqing Cohort Study, an ongoing population-based study in a coastal city of Southeast China, were included.
Primary and secondary outcome measures: TNs and its detailed ultrasonographic characteristics, risk grading in TIRADS, and metabolic factors.
Results: The age- and sex-standardized prevalence of TNs was found to be 67.2%, with a higher prevalence observed in females and an increase with age. Additionally, multiple, solid, and < 10 mm TNs were common. Approximately 39.2% of participants were diagnosed with grade 3, while 2.3% were classified as grade ≥ 4a according to TIRADS. Metabolic syndrome was associated with TNs, but this association was significant only in females. The relationship between metabolic disorders and the characteristics and grade of TNs in TIRADS varied by sex.
Conclusion: The prevalence of TNs in the coastal area of Southeast China is notable, with 2.3% of the population classified as grade ≥ 4a in TIRADS, indicating a high risk of cancer and necessitating further assessment for thyroid cancer. The association between TNs and metabolic disorders varies by sex and requires further confirmation.
Introduction
Thyroid nodules (TNs), as defined by the American Thyroid Association (ATA), are discrete lesions within the thyroid gland (1), with the majority being benign, and only 5% classified as malignant (2). Similar definitions have been acknowledged by the World Health Organization (WHO) (3) and the European Thyroid Association (ETA) (4). Ultrasonography is a widely utilized tool for diagnosing TNs, where morphological characteristics such as quantity, trait, and size are integral to assessing the cancer risk according to the Thyroid Imaging Reporting and Data System (TIRADS) (5–7).
While TIRADS is not the exclusive ‘gold standard’ for TN risk stratification, it remains one of the most widely adopted and validated systems in clinical practice (2). The system categorizes TNs into five grades: grades 1–3 indicate a very low probability of malignancy, whereas grade 4a and above often signify a relatively higher risk of malignancy (8). Minor modifications to the classification systems have been implemented in various countries or regions, including the European Thyroid Association (EU-TIRADS), the Korean Society of Thyroid Radiology (K-TIRADS), and the Chinese Society of Ultrasound in Medicine and Engineering (C-TIRADS); however, the overarching principles remain consistent (9–12). Nonetheless, comprehensive descriptions of ultrasonographic morphological characteristics and their associated risk assessments in TIRADS have been less frequently reported.
The prevalence of TNs in China ranges from 36.9% in the North to 50.2% in the East (13–15), with most studies being conducted in physical examination centers (16, 17). Consequently, there is a pressing need for more screening initiatives among community residents. Fujian Province, located in the southeastern coastal region of China, is characterized by high iodine intake (18) and elevated socioeconomic levels. However, studies on the prevalence of TNs in this population are limited.
Metabolic disorders have increasingly been recognized as risk factors for TNs (19–21). The thyroid gland, which plays a crucial role in regulating metabolism, may be particularly vulnerable to changes in metabolic status. Specifically, the presence of metabolic disorders is associated with an increased risk of TN, with an odds ratio (OR) of 1.19 (95% CI: 1.11–1.28). Certain metabolic conditions, such as hypercholesterolemia (OR=1.24), high low-density lipoprotein cholesterol (OR=1.25), and hyperuricemia (OR=1.21), are independently linked to higher odds of TNs (19). However, no consistent conclusions have been reached regarding these associations (22–24). Furthermore, the specific nature of the relationship between metabolic disorders and the morphological characteristics of TNs remains undetermined.
In this context, a detailed ultrasonic thyroid screening was conducted among rural residents in a coastal city in Southeast China. The current study aims to investigate the prevalence of TNs, their ultrasonographic morphological characteristics and TIRADS grade, and to explore their associations with various metabolic disorders in the general population.
Methods
Study population
This cross-sectional study is part of the ongoing Fuqing Cohort Study (25), which aims to recruit over 50,000 native residents of Fuqing City, Fujian Province, located in the southeastern coastal area of China. Participants aged 35–75 years were recruited for the study. From July 2020 to June 2021, a total of 7,662 participants were enrolled from Gaoshan Town in Fuqing City. The exclusion criteria are outlined in the flowchart (Supplementary Figure 1). This study was conducted in accordance with the Helsinki Declaration and received approval from the ethical committee of Fujian Medical University (approval numbers: [2017-07] and [2020-58]). Prior to their participation, all study participants provided written informed consent.
Patient and public involvement
Patients and the public were not involved in the design, conduct, reporting, or dissemination plans of this research.
Data collection
A thyroid ultrasound examination was conducted using a color Doppler ultrasound system (Hitachi Aloka Medical, ProSound α7, Japan) by professional sonographers who were blinded to the clinical and laboratory data of the participants. During the examinations, participants were positioned supine, fully exposing their necks. The examination results, including the number of thyroid nodules, characteristics (cystic or solid), size, location, echogenicity, boundaries, and calcification, were recorded concurrently.
Following standardized protocols, an electronic questionnaire was utilized to collect demographic information, lifestyle factors (smoking, alcohol consumption, and physical activity), and medical history. Additionally, trained staff measured height, weight, waist circumference (WC), body mass index (BMI), and blood pressure (BP) levels. Fasting blood samples were analyzed to determine fasting blood glucose (FBG), 2-hour post-load blood glucose (2h PG), triglycerides (TG), high-density lipoprotein cholesterol (HDL-c), and glycosylated hemoglobin (HbA1c) levels (26).
Definition and diagnostic criteria
The definition of a TN encompasses any area exhibiting differing echogenicity compared to the thyroid parenchyma, as established by the ATA. Solitary thyroid nodule (S-TN) is defined as the presence of a single nodule, while multiple thyroid nodules (M-TNs) refer to more than one nodule located in any region of the thyroid. The classification of TNs is based on their composition, categorized as either solid or cystic nodules. In instances where both cystic and solid nodules are identified within the same individual, they are classified as solid TNs. Furthermore, TNs are categorized based on the diameter of the largest nodule, with a cutoff of 10 mm delineating two distinct categories. The grading of TNs is evaluated according to the cumulative scores derived from the TIRADS criteria, as detailed in Supplementary Table 1.
Obesity and Metabolic Syndrome (MetS) are defined as follows: Obesity is classified according to body mass index (BMI), categorized into under/normal weight (< 24 kg/m²), overweight (24–28 kg/m²), and obesity (≥ 28 kg/m²). MetS is defined in accordance with the diagnostic criteria set forth by the Adult Treatment Panel III (ATP III) of the National Cholesterol Education Program (27). Participants are deemed to have MetS if three or more of the following five conditions are met: 1) Abdominal obesity (males: WC ≥ 102 cm; females: WC ≥ 88 cm); 2) Hypertriglyceridemia (TG ≥ 1.70 mmol/L); 3) Low HDL-c levels (< 1.03 mmol/L in males, or < 1.29 mmol/L in females); 4) Abnormal blood pressure (the presence of any of the following three conditions): (a) Antihypertensive treatment, (b) Systolic blood pressure (SBP) ≥ 130 mmHg, (c) Diastolic blood pressure (DBP) ≥ 85 mmHg; 5) Dysglycemia (the presence of any of the following three conditions): (a) Self-reported history of diabetes or treatment for dysglycemia, (b) Newly diagnosed diabetes according to the American Diabetes Association criteria: 2h PG ≥ 11.1 mmol/L or HbA1c ≥ 6.5%, (c) FBG ≥ 5.6 mmol/L.
Statistical analysis
All analyses were conducted using SAS 9.4 statistical software and Microsoft Excel (Windows 10, 2016). A two-tailed p-value of < 0.05 was considered statistically significant. The Chi-squared test was employed to evaluate between-group differences in demographic characteristics, behavioral habits, and metabolism-related factors. The Wilcoxon test was utilized for analyzing skewed continuous variables. The age- and sex-standardized prevalence of TNs was calculated using the direct method based on the 2010 population distribution data in China. Logistic regression analysis was performed to compute the OR and 95% confidence intervals (CI) to establish associations between MetS and TNs. Model 1 was unadjusted; Model 2 was adjusted for age, sex, years of education, marital status, and occupation; Model 3 was additionally adjusted for smoking status and BMI. Subsequently, we examined potential multiplicative and additive interactions between MetS and various indicators. For multiplicative interactions, a cross-product term was incorporated into the regression model, with the p-value derived from the Wald test. To assess additive interactions, we employed the relative excess risk due to interaction (RERI), synergy index (S), and attributable proportion (AP) due to interaction, utilizing the spreadsheet developed by Andersson et al. (21). Finally, considering the sex-specific prevalence of MetS and TNs, we conducted a sex-stratified analysis.
Sensitivity analysis
In the ATP III definition of MetS, abdominal obesity was defined as a WC of ≥ 102 cm and ≥ 88 cm in male and female populations, respectively, which are the cut-offs used in the United States, Canada, and Europe (28). Therefore, we redefined abdominal obesity and MetS using the cut-points recommended for the Asian population (males: WC ≥ 90 cm; females: WC ≥ 80 cm) (28, 29) and reanalyzed the associations between MetS components and TN characteristics in the multiple-variable adjusted logistic model as described above.
Results
Prevalence of TNs and their ultrasonographic characteristics
A total of 6,221 participants were enrolled in this study, with 4,706 (75.7%) diagnosed with TNs, including 684 self-reported cases. The crude prevalence of TNs was 79.7% among females and 68.5% among males. Notably, the prevalence increased with age for both genders (Figure 1A). The age- and sex-adjusted prevalence was 67.2%, reflecting similar trends to the crude prevalence as shown in Supplementary Table 2.
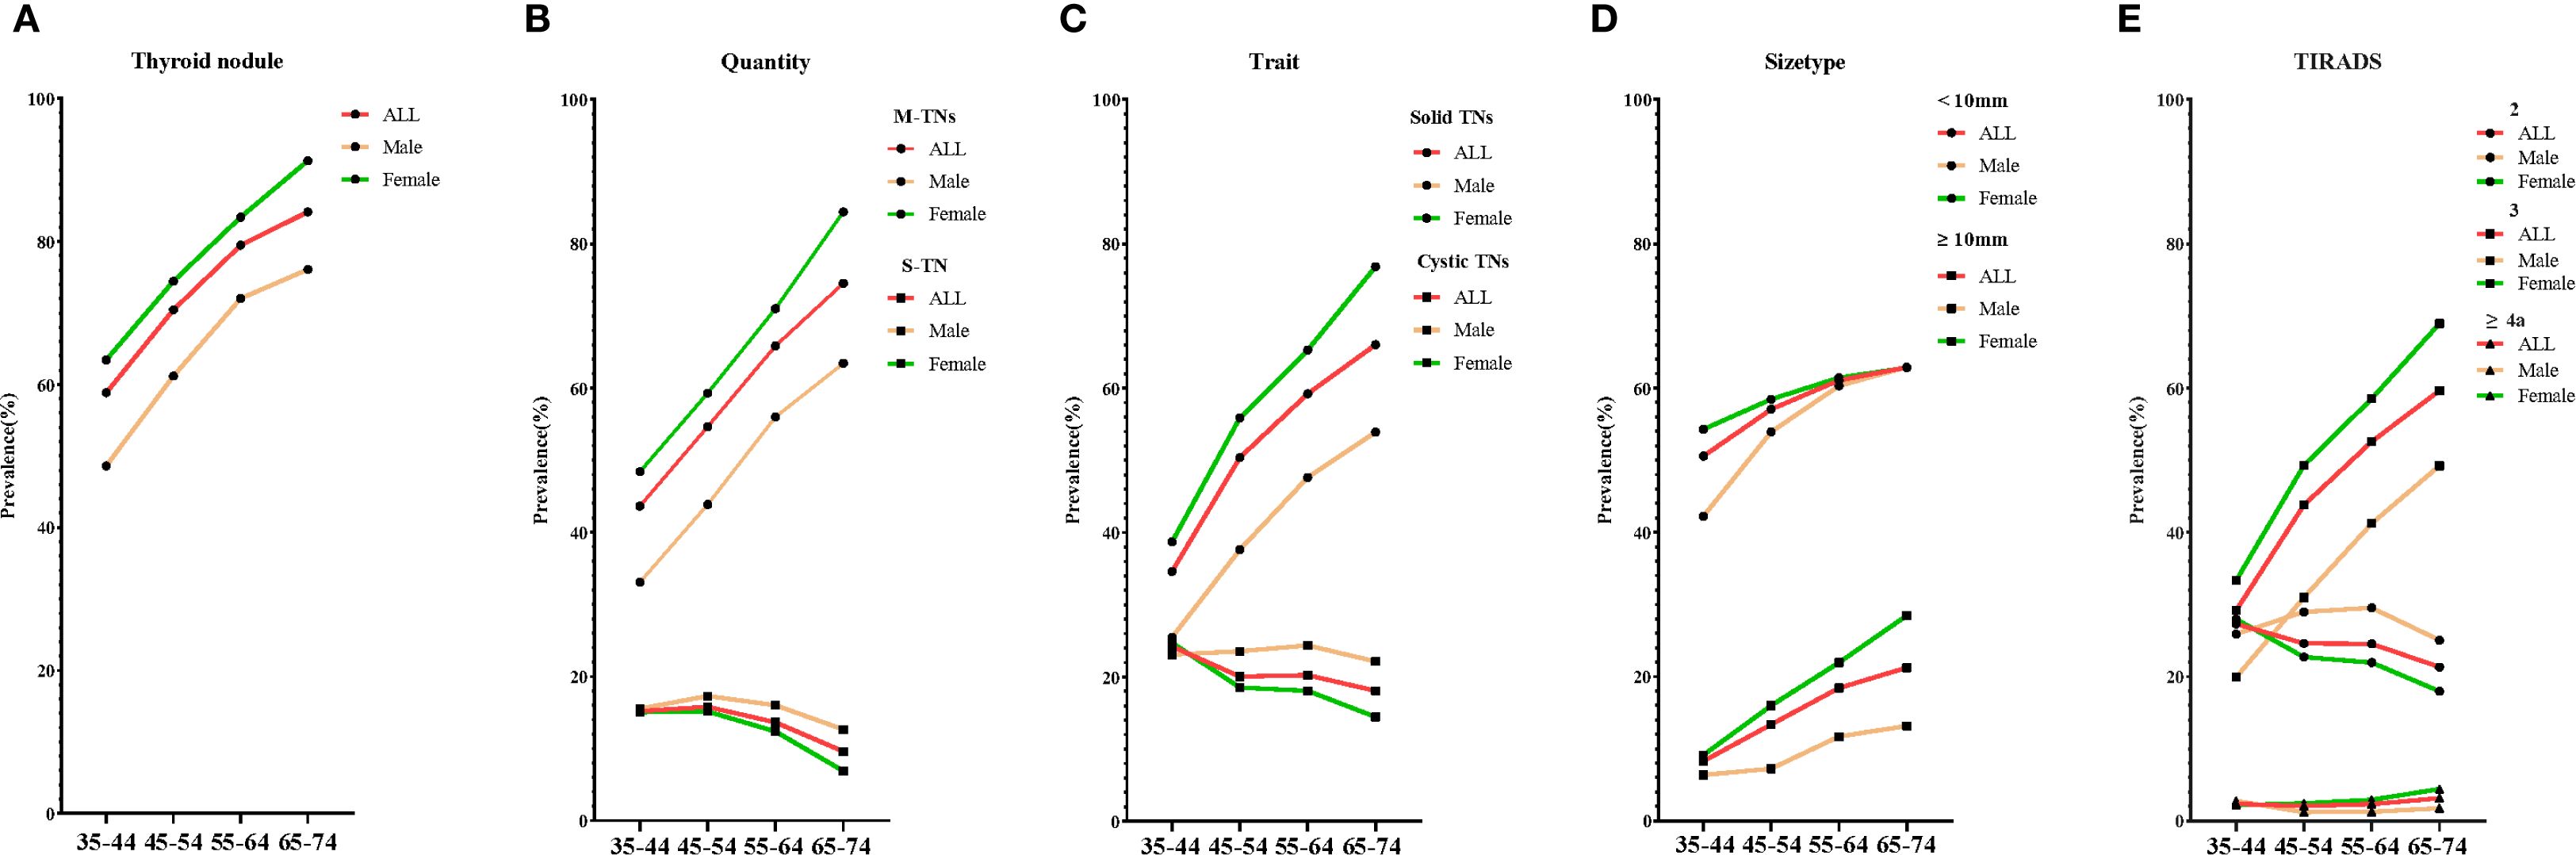
Figure 1. The crude prevalence of various types of TNs by age. Five line graphs labeled (A–E) compare the crude prevalence of various types of TNs: (A) for thyroid nodules, (B) for quantity, (C) for trait, (D) for size type, and (E) for TIRADS. S-TN, solitary thyroid nodule; M-TNs, multiple thyroid nodules; TIRADS, thyroid imaging reporting and data system.
Overall, the distribution of TNs varied significantly based on their ultrasonographic characteristics, including quantity, trait, size type, and TIRADS classification. As illustrated in Figure 1B (quantity), participants with M-TNs comprised 62.3% of the total population, with prevalence increasing with age, whereas those with S-TNs represented only 13.3%, with a decrease in prevalence as age increased. In terms of trait (Figure 1C), solid TNs exhibited a significantly higher prevalence among females compared to males and were more common in older individuals. Conversely, cystic TNs had a lower prevalence and an opposite trend. Regarding size type (Figure 1D), TNs ≥ 10 mm were diagnosed in only 19.9% of the female population and 10.6% of the male population. Figure 1E (TIRADS classification) shows that TIRADS 3 TNs were the most prevalent, accounting for 39.2% of the entire population, with prevalence increasing with age. TIRADS ≥ 4a TNs were identified in 2.3% of the population, also showing a slight increase with age. The crude and age- and sex-adjusted prevalence of TNs with these characteristics are presented in Supplementary Table 2.
Sociodemographic characteristics of populations with TNs and MetS
The median age of the entire population was 57.0 years, with 36.3% being male. TNs were more prevalent among females, older individuals, those with lower education levels, widowed individuals, and participants engaged in farming or who were unemployed. Compared to non-TNs, TN cases were more likely to be non-smokers, obese, hypertensive, and hyperglycemic (Table 1).
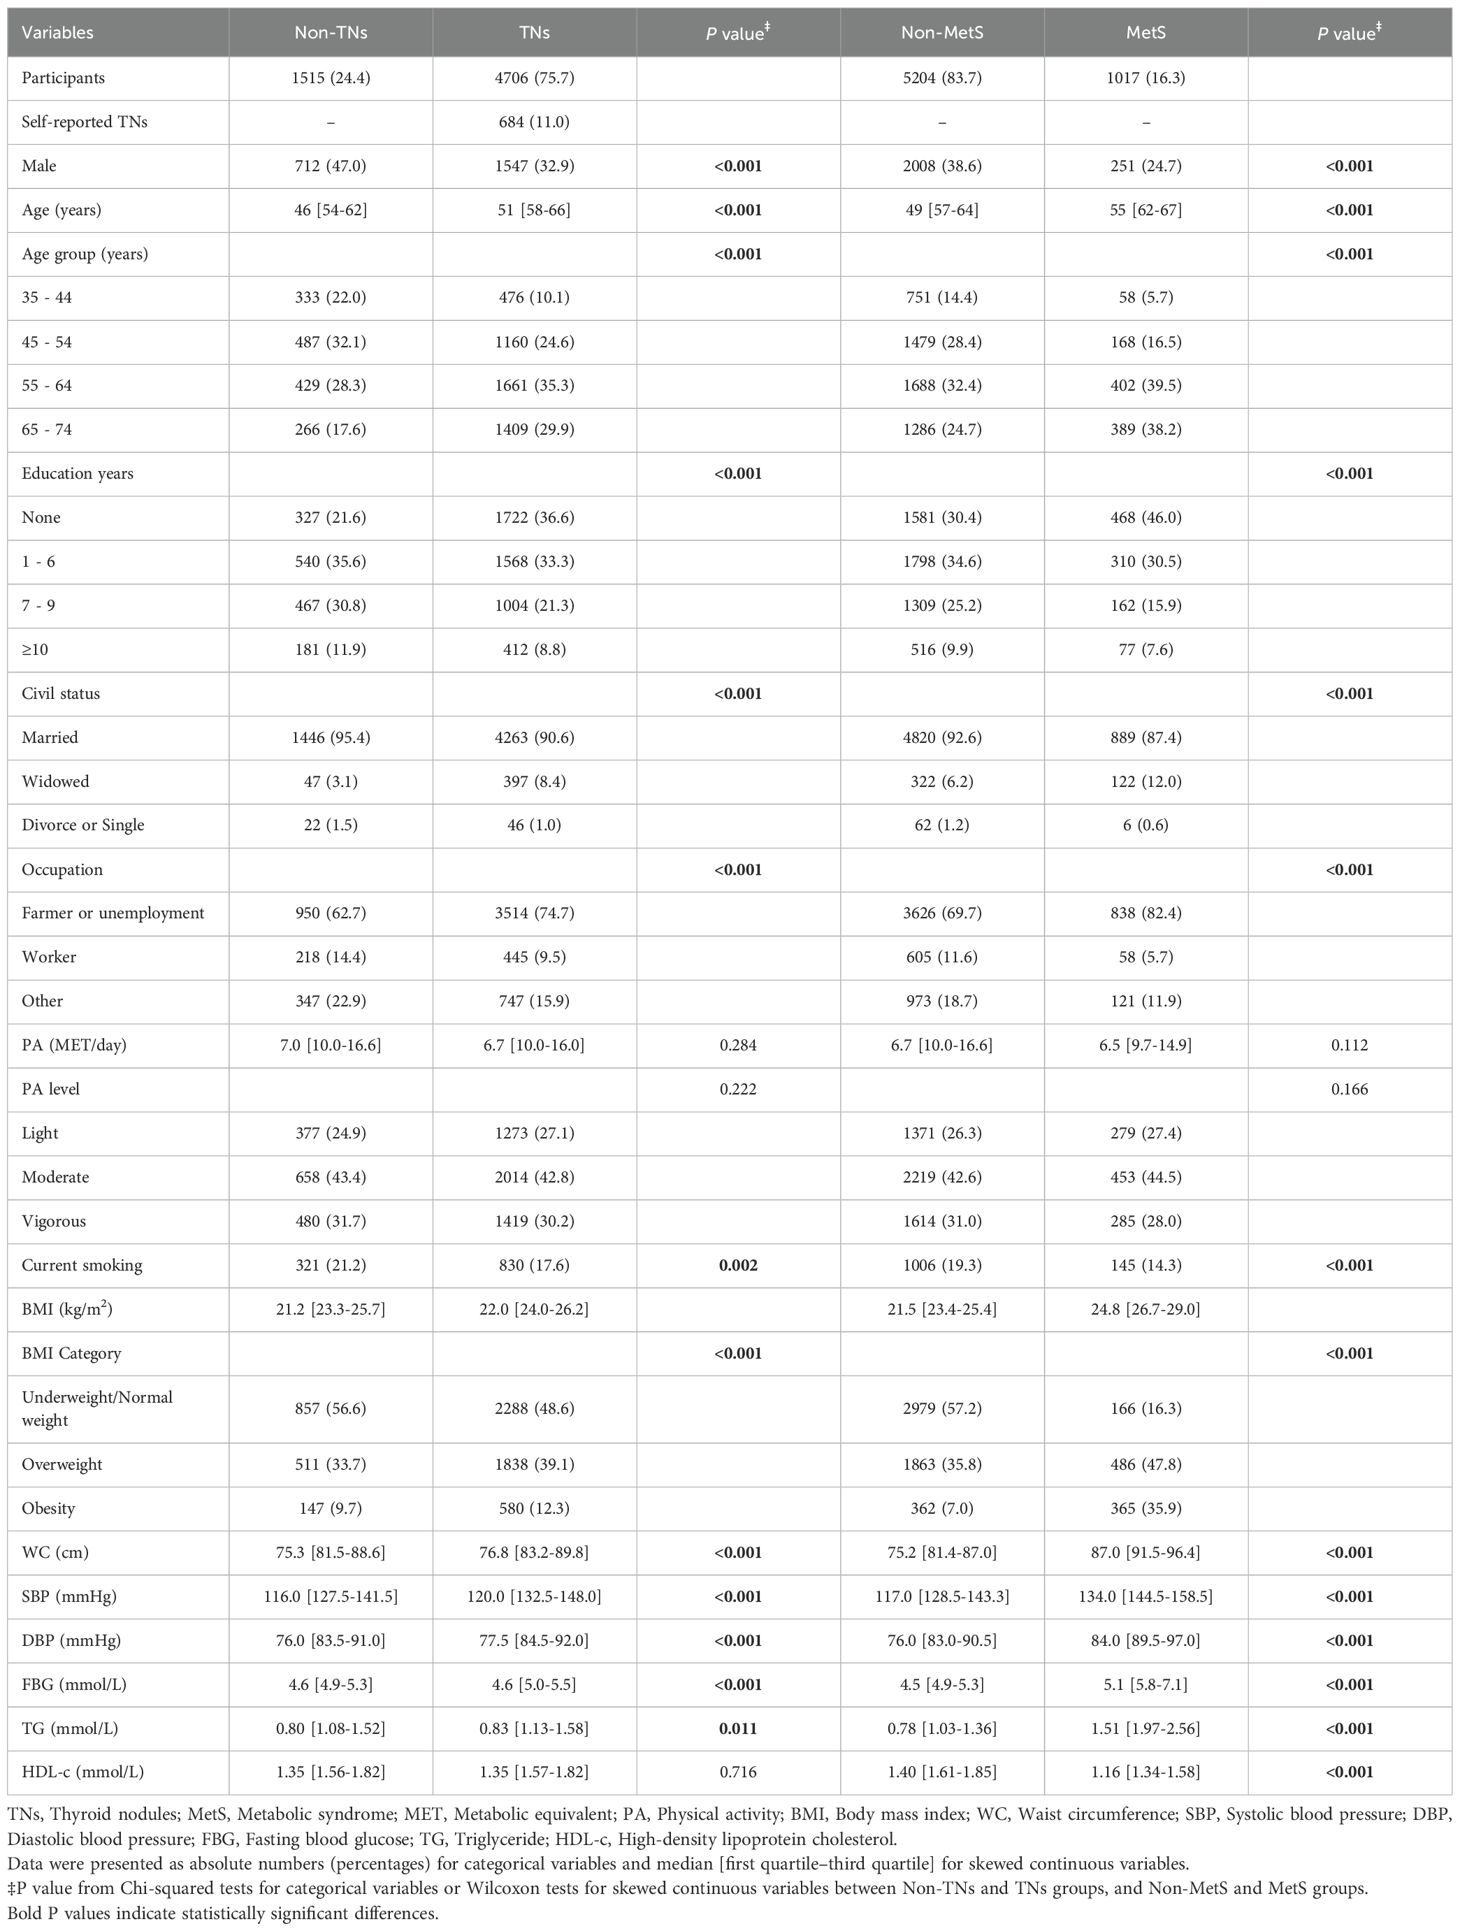
Table 1. Distribution of sociodemographic characteristics among participants with and without TNs, and with and without MetS.
Based on the ATP III criteria, 1,017 out of 6,221 participants were diagnosed with MetS, yielding a prevalence of 16.3% in the overall population. The sociodemographic characteristics of participants with MetS differed significantly from those without MetS, but were broadly comparable to those with TNs (Table 1).
Relationship between TNs and MetS and its components
The crude and adjusted prevalence of TNs among populations with and without MetS and its components was calculated (see Figure 2 and Supplementary Table 3). In the entire population, the prevalence of TNs was higher in MetS (68.8%) compared to those without MetS (66.8%). Similarly, participants in the positive component groups exhibited a higher prevalence of TNs than those in the negative groups: abdominal obesity (74.9% vs. 66.7%), abnormal blood pressure (67.6% vs. 66.7%), hypertriglyceridemia (70.1% vs. 66.2%), and low HDL-c (69.9% vs. 67.0%). This pattern was consistent among females. In males, however, the adjusted prevalence rates of TNs in the positive groups for hypertriglyceridemia and low HDL-c were lower than those in the negative groups (hypertriglyceridemia: 58.7% vs. 63.6%; low HDL-c: 60.2% vs. 63.0%).
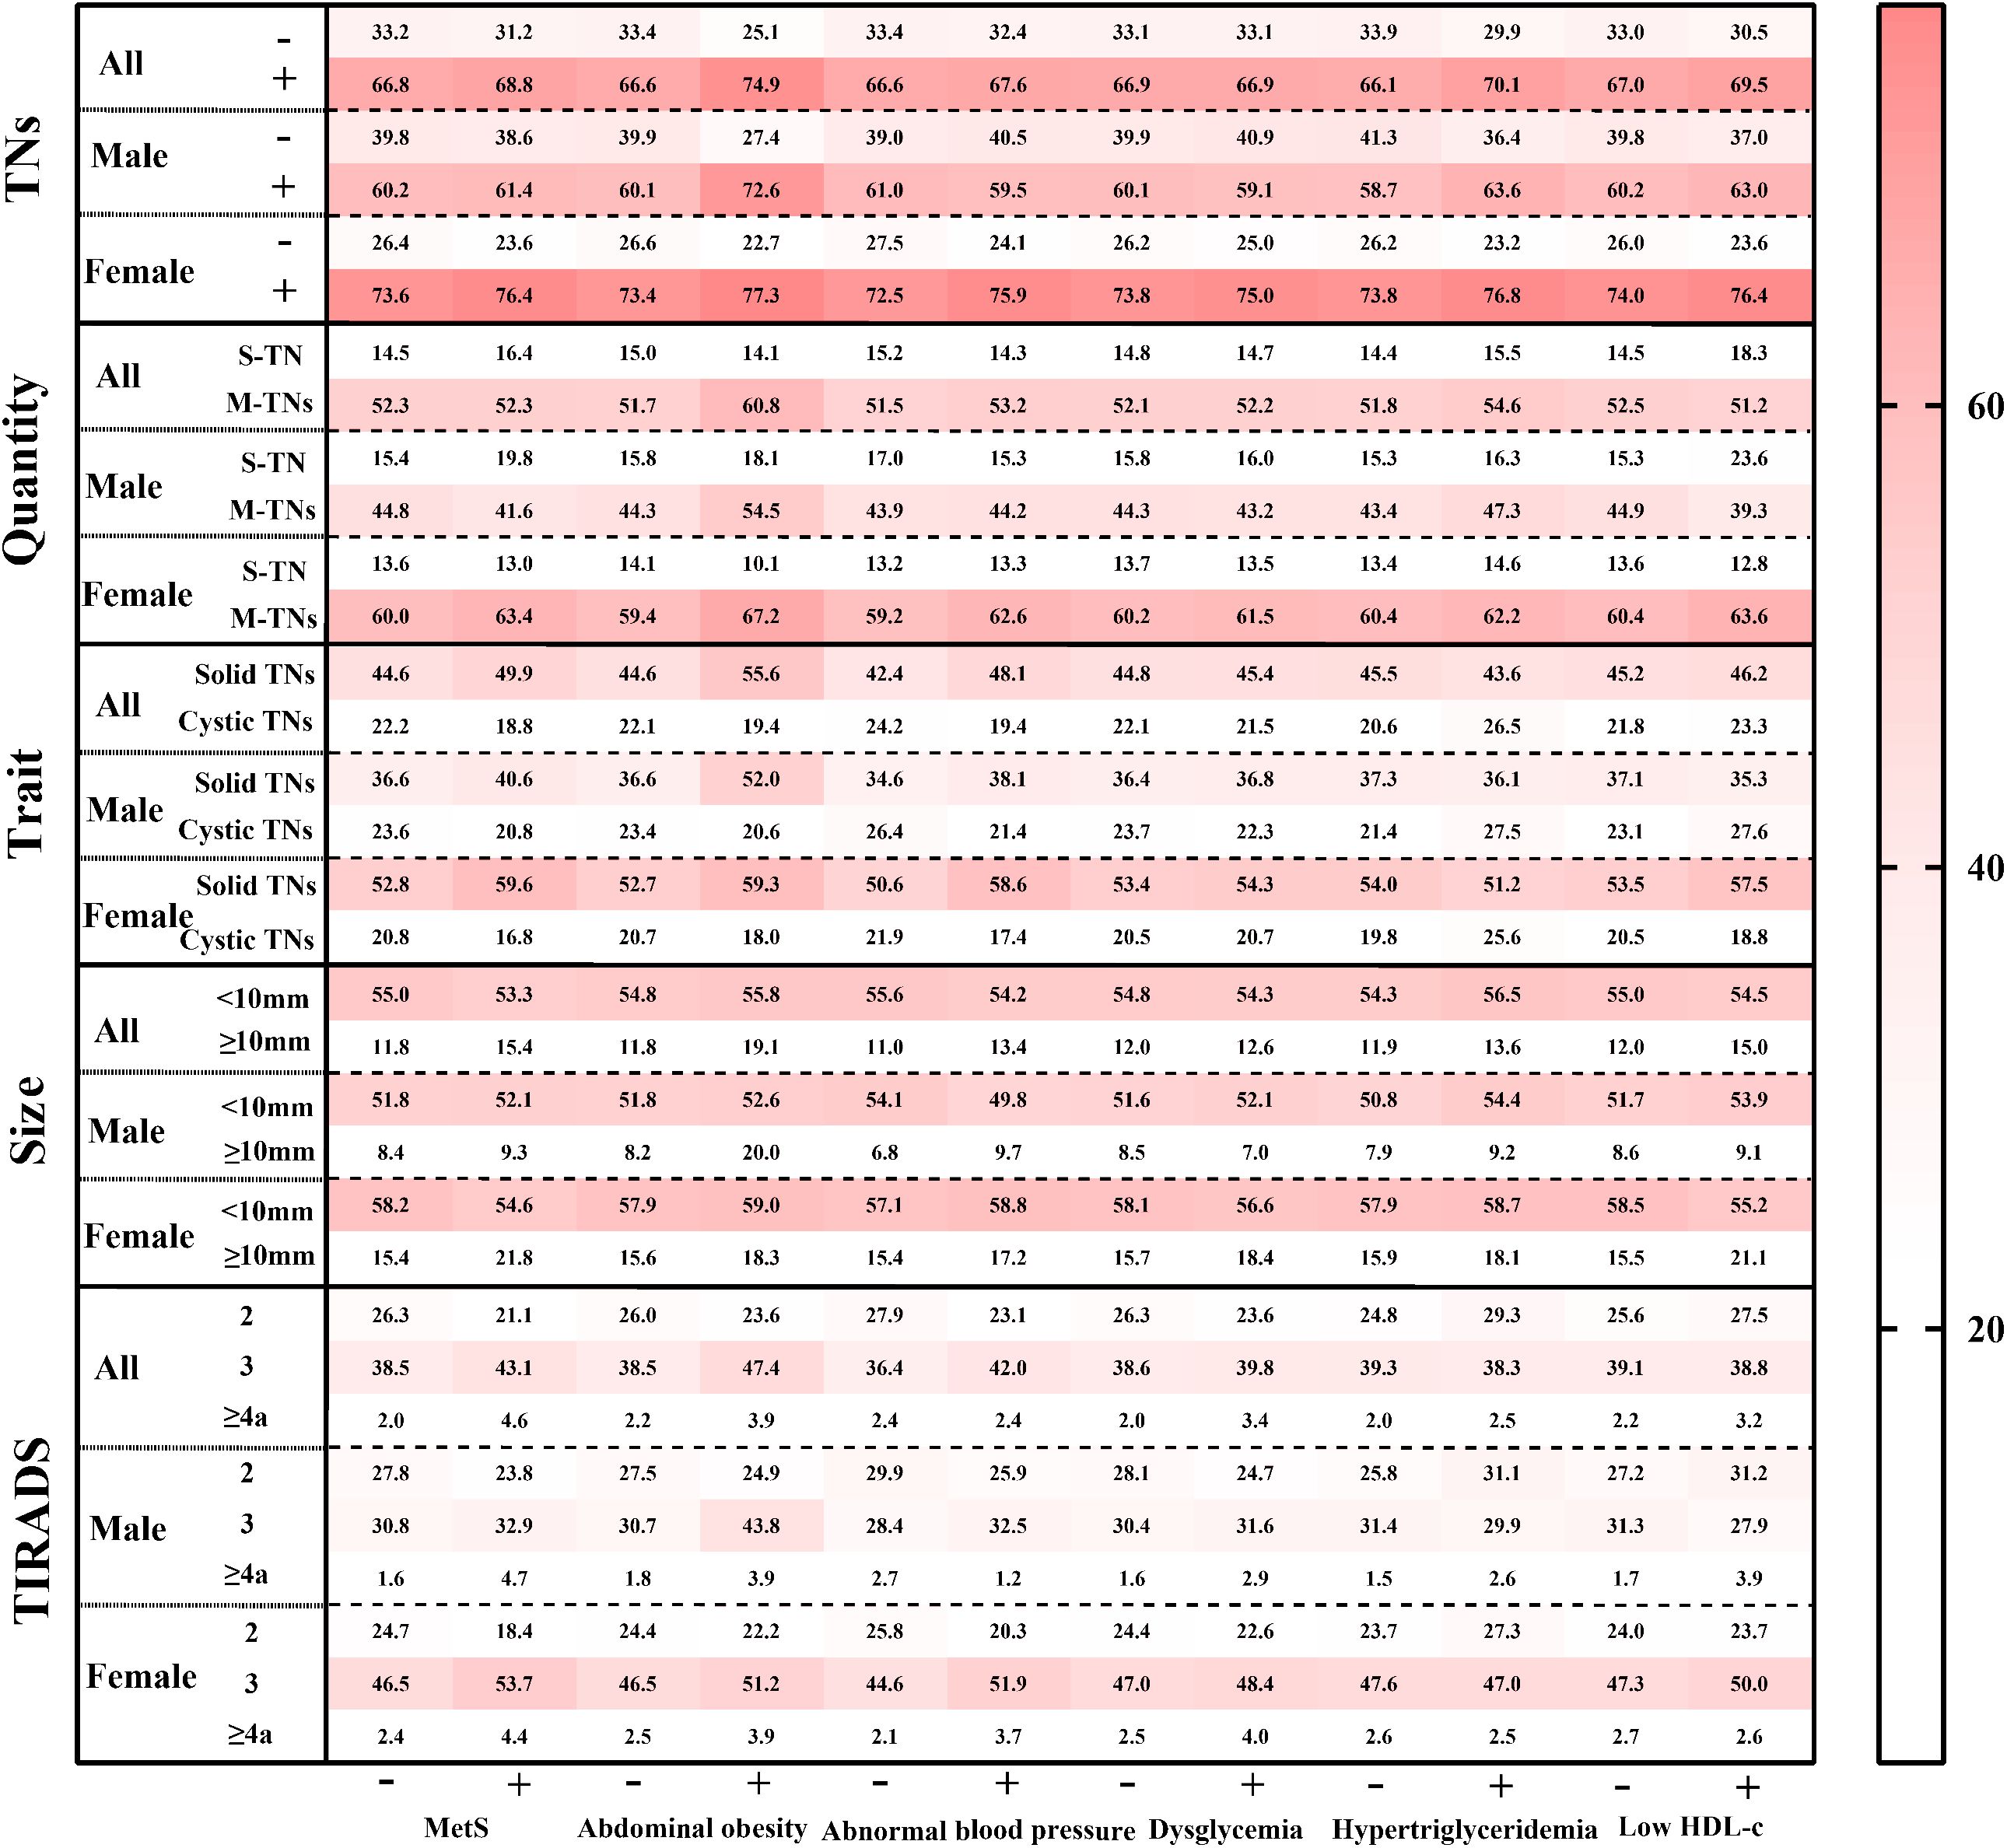
Figure 2. The standardized prevalence of ultrasonographic characteristics of TNs among populations with various metabolic status. TNs, thyroid nodules; S-TN, solitary thyroid nodule; M-TNs, multiple thyroid nodules; TIRADS, thyroid imaging reporting and data system. The prevalence in each grid was age- and sex- adjusted by the population distribution in China in 2010.
In the fully adjusted logistic regression model (see Supplementary Table 4), MetS was significantly associated with TNs, yielding an OR of 1.25 (95% CI: 1.02–1.53) when compared to participants without MetS. Among the individual components of MetS, only abdominal obesity demonstrated a significant association, with an OR of 1.37 (95% CI: 1.08–1.73) compared to participants without abdominal obesity.
Considering the potential effects of sex, smoking status, and BMI, both multiplicative and additive interactions between MetS and each of these factors were separately tested in fully adjusted logistic regression models (see Table 2). Notably, only the additive interaction between MetS and sex for TNs was significant, with RERI, AP, and S recorded at 0.88 (0.02, 1.74), 0.26 (0.06, 0.46), and 1.59 (1.05, 2.42), respectively.
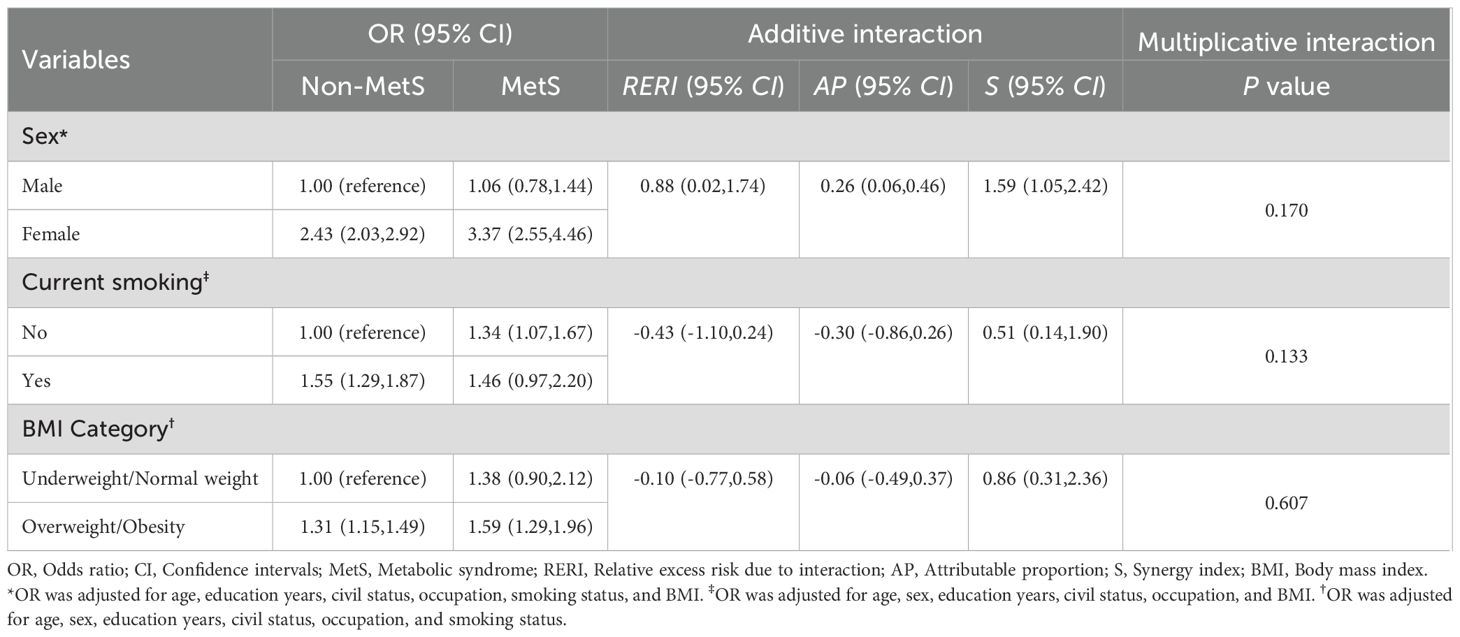
Table 2. The interaction effects between MetS and sociodemographic characteristics on TNs.
Relationships between MetS and its components and TN characteristics
In fully adjusted models (Figure 3), MetS was associated with increased risks for S-TN, M-TNs, solid TNs, TNs < 10 mm, TNs ≥ 10 mm, TIRADS 3 TNs, and TIRADS ≥ 4a TNs. Among MetS components, abdominal obesity exhibited a positive correlation with M-TNs, solid TNs, TNs < 10 mm, and TIRADS 3 TNs. Additionally, abnormal BP was significantly associated with solid TNs and TIRADS 3 TNs. Dysglycemia showed a significant association with solid TNs, TIRADS 3 TNs, and TIRADS ≥ 4a TNs, whereas hypertriglyceridemia and low HDL-c did not demonstrate significant associations with any TN ultrasonographic characteristics.
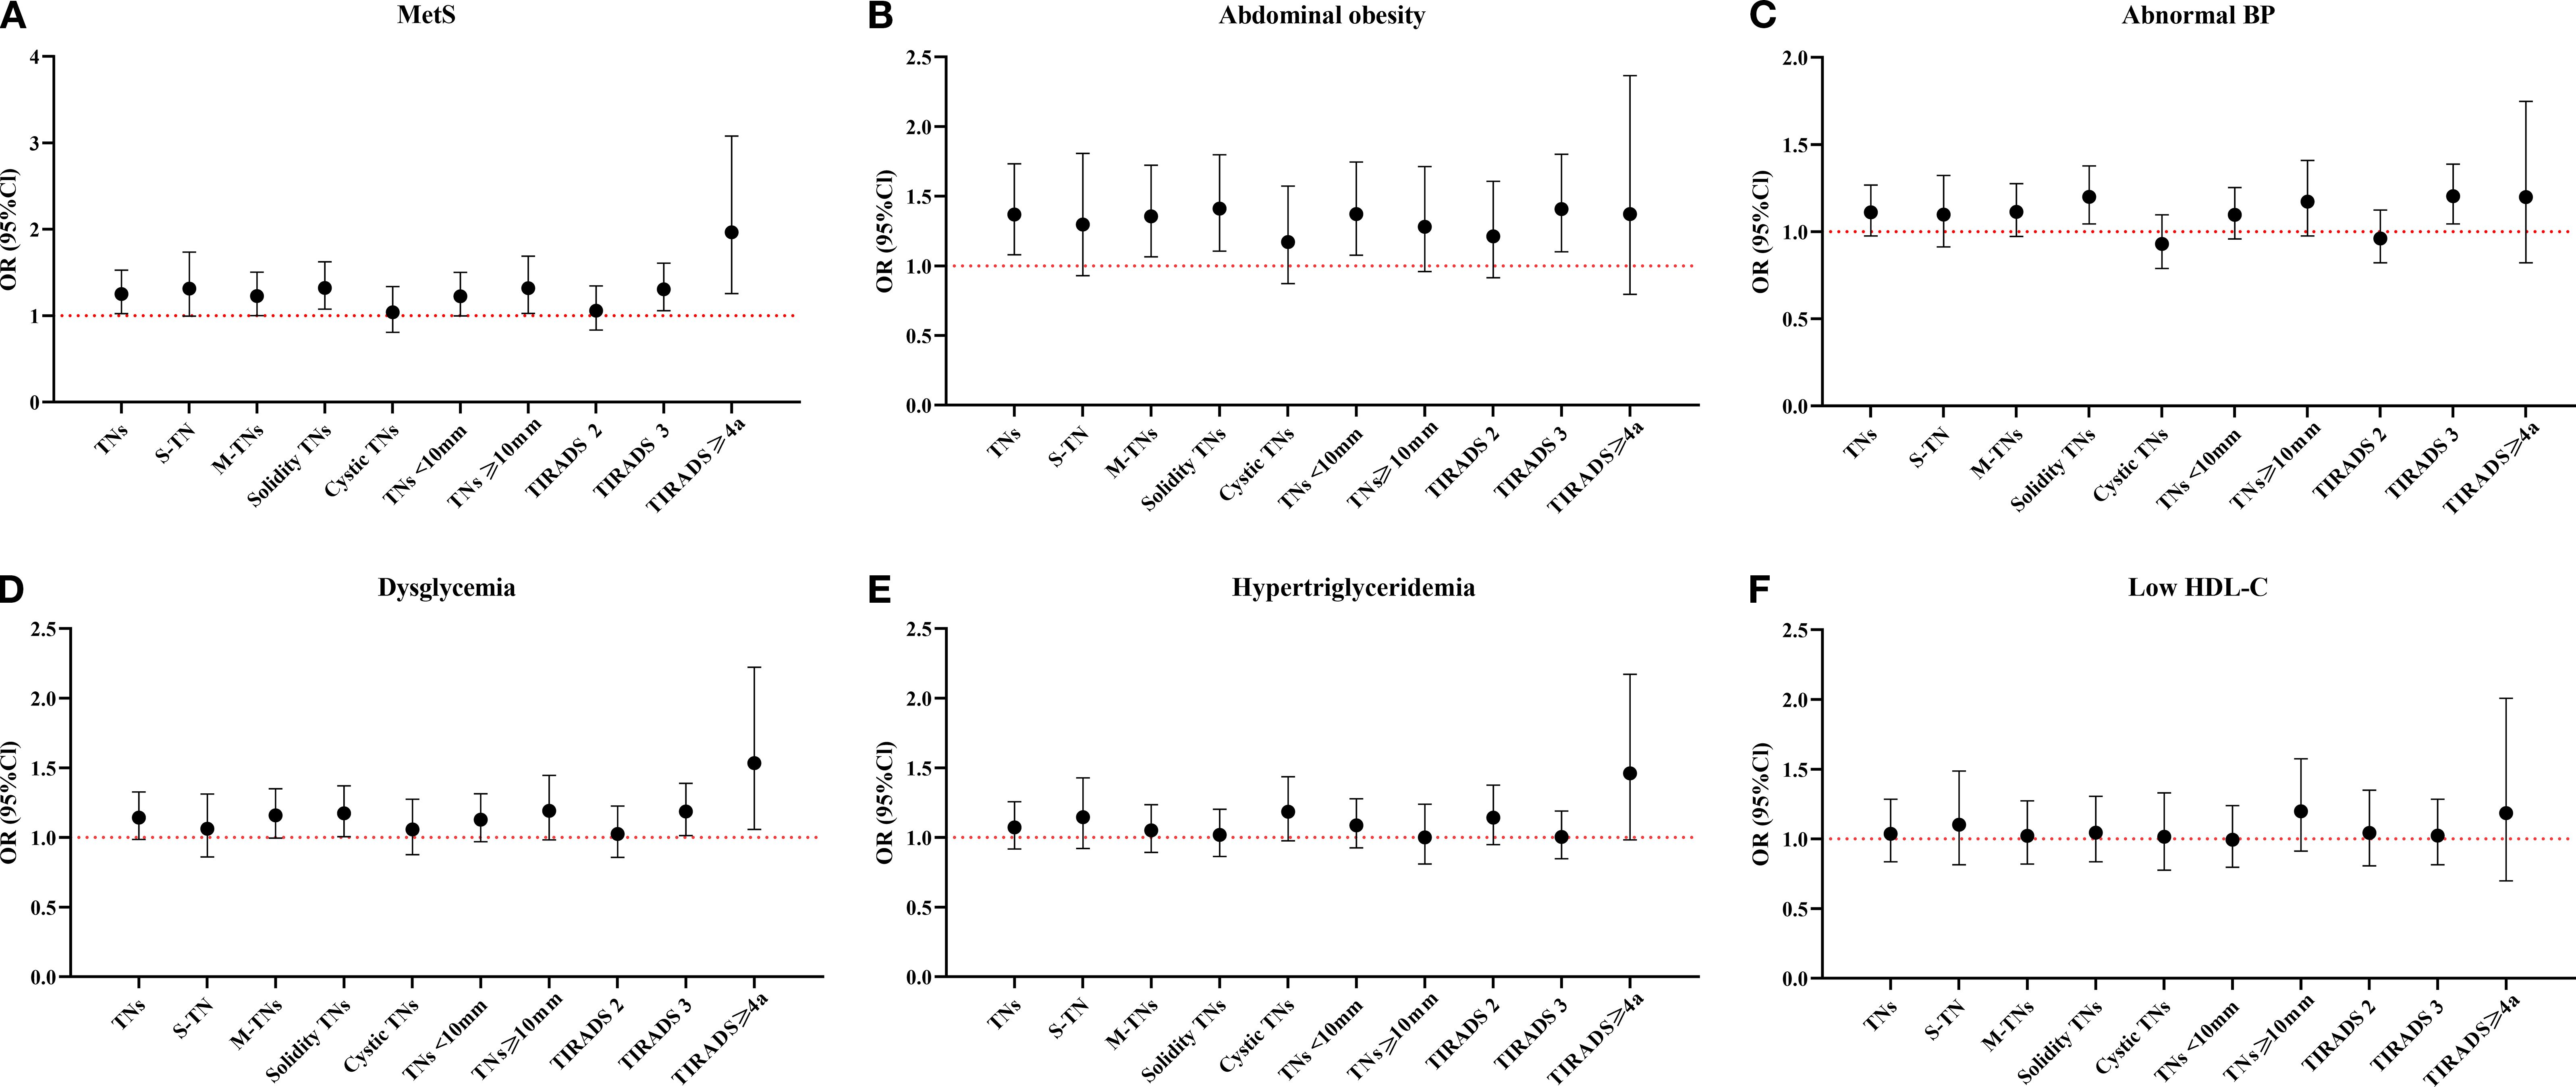
Figure 3. Relationship between MetS and its components and the ultrasonographic characteristics of TNs. MetS, Metabolic syndrome; TNs, Thyroid nodules; S-TN, Solitary thyroid nodule; M-TNs, Multiple thyroid nodules; TIRADS, Thyroid imaging reporting and data system; HDL-c, High density lipoprotein cholesterol. Six line graphs labeled (A–F) compare OR with 95%CI across MetS and its components: (A) for MetS, (B) for abdominal obesity, (C) for abnormal BP, (D) for dysglycemia, (E) for hypertriglyceridemia, and (F) for low HDL-c. The reference group of all models was Non-TN group. All models were adjusted for sex, age, education years, civil status, occupation, smoking status, and BMI.
Upon stratification by sex, in males, only abdominal obesity was linked to increased risks of TNs, M-TNs, solid TNs, TNs < 10 mm, and TIRADS 3 TNs. In females, MetS was positively correlated with TNs, M-TNs, solid TNs, TNs < 10 mm, TNs ≥ 10 mm, TIRADS 3 TNs, and TIRADS ≥ 4a TNs. Abnormal BP was associated with an increased risk of solid TNs and TIRADS 3 TNs. Other MetS components—including abdominal obesity, dysglycemia, hypertriglyceridemia, and low HDL-c—did not show significant associations with any TN ultrasonographic characteristics (Supplementary Table 5).
Sensitivity analysis
As demonstrated in Supplementary Table 6, after redefining abdominal obesity and MetS according to the criteria for the Asian population, the MetS group exhibited an increased, albeit not statistically significant, risk of total TNs, with an OR of 1.16 (95% CI: 0.98–1.36). However, when analyzing various subgroups—such as TN ultrasonographic characteristics, individual MetS components, and sex—certain associations became evident.
Among TN ultrasonographic characteristics, MetS was positively associated only with TIRADS ≥4a TNs. Regarding the individual components of MetS, abnormal BP was linked to an increased risk of solid TNs and TIRADS 3 TNs, while dysglycemia showed a significant association with solid TNs and TIRADS ≥4a TNs. The ORs for abdominal obesity and low HDL-c were not statistically significant for any ultrasonographic characteristics.
In females, MetS was positively associated with TNs, including solid TNs, TIRADS 3 TNs, and TIRADS ≥4a TNs. Abnormal BP was correlated with an increased risk of solid TNs and TIRADS 3 TNs, while hypertriglyceridemia was positively associated only with TIRADS ≥4a TNs. Notably, none of these associations were significant in males.
Discussion
In this study, the standardized prevalence of TNs was found to be 67.2%, with a higher prevalence observed in females compared to males, and an increase noted with advancing age. Multiple, solid TNs measuring less than 10 mm were more prevalent than single, cystic TNs measuring 10 mm or greater. Approximately 39% of participants were diagnosed with TIRADS 3 TNs, while 2.3% were classified as TIRADS ≥ 4a TNs, which are considered high-risk and warrant further examination according to TIRADS guidelines. Furthermore, MetS was associated with a higher prevalence of TNs and their ultrasonographic characteristics, particularly in the female population. However, the relationship between metabolic disorders and the ultrasonographic characteristics of TNs differed between male and female populations.
In China, based on a Health Examination Cohort Study, the estimated prevalence of TNs is 31.2%, with significant regional variations ranging from 23.9% to 47.6% (30). Some screening programs among adults (aged ≥ 18 years) have reported an increasing prevalence from North to South China, with rates of 36.9% in Heilongjiang province (13), 40.1% in Beijing (14), and 50.2% in the middle and lower reaches of the Yangtze River (15). In our current study, we conducted ultrasonography screening among native villagers aged 35 to 74 years in the southeast coastal area of China. The standardized prevalence of TNs was 67.2% and demonstrated a significant increasing trend with age. The higher prevalence of TNs in our study may be partly attributed to the older age of participants and the southern geographic location. Conversely, previous studies primarily focused on populations from physical examination centers, medical institutes, or community residents examined using portable ultrasound equipment (14, 16, 17). In contrast, all participants in our study were recruited from a town, and all ultrasonic parameters were measured using two identical Color Ultrasonic Scanners equipped with a color Doppler ultrasound system. The examinations were conducted by 16 professional sonographers from a single department, all of whom had completed systematic and professional training and assessment tests and had at least 5 years of experience in ultrasound examinations. These factors contributed to a robust foundation for the diagnosis of TNs.
The ultrasonographic characteristics of TNs, including their quantity, trait, and size, are essential for risk assessment in TIRADS (31). However, the distribution of these characteristics remains poorly understood. Therefore, the present study evaluated these features during ultrasound examinations. In terms of quantity, M-TNs were found to be more prevalent than S-TN, particularly among older females, consistent with previous reports (7). Throughout the development of TNs, S-TN often progresses to M-TNs with age, while S-TN has been associated with a higher risk of thyroid cancer compared to M-TNs (32). In our population, the predominant trait of TNs was solid rather than cystic. The risk of malignancy was significantly higher in solid TNs compared to cystic ones (33). The size of TNs, especially those measuring ≥ 10 mm, is a critical factor in the clinical assessment of malignancy, fine-needle aspiration, or surgical intervention. Although the risk of cancer increases with TN size in a nonlinear manner, larger TNs exhibit a lower malignancy rate (34). In summary, the majority of TNs in the current study were multiple, solid, and < 10 mm in size, and exhibited features characteristic of benign lesions.
TIRADS provides practitioners with evidence-based recommendations for the management of TNs (35). Additionally, TIRADS grading informs decisions regarding ultrasound-guided fine-needle aspiration biopsy (FNAB), which is considered the gold standard for diagnosing thyroid cancer. Nodules graded 4a or higher are recommended for FNAB. Although FNAB is highly accurate for diagnosing thyroid malignancy, it is not suitable for population-based screening due to its invasiveness, cost, and the low prevalence of clinically significant thyroid cancer in asymptomatic individuals. Consequently, current guidelines advocate for the use of ultrasonography as the initial screening tool for TNs, reserving FNAB for nodules exhibiting suspicious sonographic features (36). TIRADS grading demonstrates high sensitivity (up to 89%) and moderate specificity (~70%), effectively reducing unnecessary FNAB for benign nodules. However, its specificity for certain histologic subtypes, such as follicular and medullary thyroid cancers, remains limited (11, 37). The European Association of Nuclear Medicine also recommends utilizing TIRADS to identify high-risk nodules for FNAB, thereby helping to reduce unnecessary procedures and enhance diagnostic specificity (38).
Despite its extensive clinical use, only a limited number of studies conducted in physical examination centers have reported on the prevalence of TNs with TIRADS 4a grade or higher, ranging from 11.0% to 24.1% in the studied populations (39, 40). In contrast, current data from natural populations indicate that TIRADS 3 TNs are the most prevalent, with a prevalence of 39.2%, while TIRADS ≥ 4a TNs were observed in only 2.3% of participants, highlighting a different distribution from that reported in physical examination centers. Therefore, further natural population-based studies with detailed descriptions of ultrasonographic characteristics are essential to provide a robust basis for evaluating the disease burden of TNs.
Additionally, we explored the association between metabolic disorders and TNs. MetS, defined by the criteria proposed by ATP III, which includes abdominal obesity for populations from the United States, Canada, and Europe, was positively associated with TNs risk in the entire population. Notably, females with MetS were more likely to be associated with TNs, whereas this association was not observed in males. The associations between MetS components and TN characteristics also varied in sex-stratified analyses. Considering the ethnic-specific definitions of MetS and abdominal obesity (28, 41), we redefined MetS and abdominal obesity as suggested for Asian populations. Similarly, an increased OR of MetS for TNs was observed in females, but not in males. Although the relationship between MetS and TNs has been investigated in a few studies (22–24), and their gender-specific associations have been reported, no consistent conclusions have been reached (42, 43). Furthermore, we investigated the association between various metabolic disorders and the quantity, trait, size, and TIRADS grade of TNs, which remain largely undisclosed. Collectively, we provided a systematic and comprehensive analysis of the relationship between metabolic factors and various TNs, emphasizing the need for further exploration of these associations to identify high-risk subpopulations for TNs, including thyroid cancer.
Conclusions
In conclusion, TNs are prevalent in the general population of the Southeast coastal area of China, with an age-adjusted prevalence of 67.2% (95% CI: 64.6–69.8). The majority of TNs are multiple, small, solid nodules, and are diagnosed as benign lesions according to the TIRADS. TNs exhibit clear sex- and age-related trends. Additionally, metabolic disorders are associated with a higher risk of TNs, particularly among females, and the relationship between metabolic disorders and TN characteristics varies by sex.
Data availability statement
The raw data supporting the conclusions of this article will be made available by the authors, without undue reservation.
Ethics statement
The studies involving humans were approved by the ethical committee of Fujian Medical University. The studies were conducted in accordance with the local legislation and institutional requirements. The participants provided their written informed consent to participate in this study.
Author contributions
WW: Conceptualization, Methodology, Formal analysis, Writing – original draft, Writing – review & editing, Visualization. LX: Writing – original draft, Writing – review & editing. MH: Data curation, Writing – review & editing. RF: Formal analysis, Writing – review & editing. XH: Formal analysis, Writing – review & editing. QS: Conceptualization, Writing – review & editing. XX: Data curation, Writing – review & editing. ZH: Methodology, Writing – review & editing. QZ: Conceptualization, Writing – review & editing. SD: Conceptualization, Methodology, Writing – original draft, Writing – review & editing. HL: Data curation, Writing – review & editing. WY: Conceptualization, Methodology, Writing – review & editing.
Funding
The author(s) declare financial support was received for the research and/or publication of this article. This study was jointly supported by the General Program of the Natural Science Foundation of Fujian Province (grant numbers: 2021J01730 and 2022J01711), the Government of Fuqing City (grant number: 2019B003), Special Funds from the Fujian Provincial Finance Department (No. 2020czbz01), the Department of Science and Technology of Fujian, China (grant number: 2019Y9021), and the High-level Talents Research Start-up Project of Fujian Medical University (No. XRCZX2017035 and No. XRCZX2020034). The funders had no role in the study design, data collection, interpretation, or the decision to submit the work for publication.
Conflict of interest
The authors declare that the research was conducted in the absence of any commercial or financial relationships that could be construed as a potential conflict of interest.
The author(s) declared that they were an editorial board member of Frontiers, at the time of submission. This had no impact on the peer review process and the final decision.
Generative AI statement
The author(s) declare that no Generative AI was used in the creation of this manuscript.
Any alternative text (alt text) provided alongside figures in this article has been generated by Frontiers with the support of artificial intelligence and reasonable efforts have been made to ensure accuracy, including review by the authors wherever possible. If you identify any issues, please contact us.
Publisher’s note
All claims expressed in this article are solely those of the authors and do not necessarily represent those of their affiliated organizations, or those of the publisher, the editors and the reviewers. Any product that may be evaluated in this article, or claim that may be made by its manufacturer, is not guaranteed or endorsed by the publisher.
Supplementary material
The Supplementary Material for this article can be found online at: https://www.frontiersin.org/articles/10.3389/fonc.2025.1658717/full#supplementary-material
Abbreviations
TN, Thyroid nodule; MetS, Metabolic syndrome; OR, Odds ratio; PA, Physical activity; WC, Waist circumference; BP, Blood pressure; BMI, Body mass index; MET, Metabolic equivalent; OGTT, Oral glucose tolerance test; 2h PG, 2 hours post-load blood glucose; FBG, Fasting blood glucose; TG, Triglyceride; HDL-c, High-density lipoprotein cholesterol; HbA1c, Glycosylated hemoglobin; S-TN, Solitary TN; M-TNs, Multiple TNs; TIRADS, Thyroid imaging reporting, and data system; SBP, systolic blood pressure; DBP, diastolic blood pressure; CI, Confidence intervals; RERI, Relative excess risk due to interaction; S, Synergy index; AP, Attributable proportion.
References
1. Haugen BR, Alexander EK, Bible KC, Doherty GM, Mandel SJ, Nikiforov YE, et al. 2015 American thyroid association management guidelines for adult patients with thyroid nodules and differentiated thyroid cancer: the American thyroid association guidelines task force on thyroid nodules and differentiated thyroid cancer. Thyroid. (2016) 26:1–133. doi: 10.1089/thy.2015.0020, PMID: 26462967
2. Durante C, Grani G, Lamartina L, Filetti S, Mandel SJ, and Cooper DS. The diagnosis and management of thyroid nodules: A review. Jama. (2018) 319:914–24. doi: 10.1001/jama.2018.0898, PMID: 29509871
3. Basolo F, Macerola E, Poma AM, and Torregrossa L. The 5(th) edition of WHO classification of tumors of endocrine organs: changes in the diagnosis of follicular-derived thyroid carcinoma. Endocrine. (2023) 80:470–6. doi: 10.1007/s12020-023-03336-4, PMID: 36964880
4. Durante C, Hegedüs L, Czarniecka A, Paschke R, Russ G, Schmitt F, et al. 2023 European Thyroid Association Clinical Practice Guidelines for thyroid nodule management. Eur Thyroid J. (2023) 12(5):e230067. doi: 10.1530/etj-23-0067, PMID: 37358008
5. Zou B, Sun L, Wang X, and Chen Z. The prevalence of single and multiple thyroid nodules and its association with metabolic diseases in Chinese: A cross-sectional study. Int J Endocrinol. (2020) 2020:5381012. doi: 10.1155/2020/5381012, PMID: 32148489
6. Brito JP, Gionfriddo MR, Al Nofal A, Boehmer KR, Leppin AL, Reading C, et al. The accuracy of thyroid nodule ultrasound to predict thyroid cancer: systematic review and meta-analysis. J Clin Endocrinol Metab Apr. (2014) 99:1253–63. doi: 10.1210/jc.2013-2928, PMID: 24276450
7. Wong KS, Jo VY, Lowe AC, Faquin WC, Renshaw AA, Shah AA, et al. Malignancy risk for solitary and multiple nodules in Hürthle cell-predominant thyroid fine-needle aspirations: A multi-institutional study. Cancer Cytopathol Jan. (2020) 128:68–75. doi: 10.1002/cncy.22213, PMID: 31751003
8. Zhou J, Yin L, Wei X, Zhang S, Song Y, Luo B, et al. 2020 Chinese guidelines for ultrasound Malignancy risk stratification of thyroid nodules: the C-TIRADS. Endocrine Nov. (2020) 70:256–79. doi: 10.1007/s12020-020-02441-y, PMID: 32827126
9. Chen Q, Lin M, and Wu S. Validating and comparing C-TIRADS, K-TIRADS and ACR-TIRADS in stratifying the Malignancy risk of thyroid nodules. Front Endocrinol (Lausanne). (2022) 13:899575. doi: 10.3389/fendo.2022.899575, PMID: 35784558
10. Russ G, Trimboli P, and Buffet C. The new era of TIRADSs to stratify the risk of Malignancy of thyroid nodules: strengths, weaknesses and pitfalls. Cancers (Basel). (2021) 13(4):1253–63. doi: 10.3390/cancers13174316, PMID: 34503125
11. Kim DH, Kim SW, Basurrah MA, Lee J, and Hwang SH. Diagnostic performance of six ultrasound risk stratification systems for thyroid nodules: A systematic review and network meta-analysis. AJR Am J Roentgenol. (2023) 220:791–803. doi: 10.2214/ajr.22.28556, PMID: 36752367
12. Jin Z, Pei S, Shen H, Ouyang L, Zhang L, Mo X, et al. Comparative study of C-TIRADS, ACR-TIRADS, and EU-TIRADS for diagnosis and management of thyroid nodules. Acad Radiol. (2023) 30:2181–91. doi: 10.1016/j.acra.2023.04.013, PMID: 37230821
13. Tian C, Bu Y, Ji C, Shi M, Zhang L, Kong D, et al. Iodine nutrition and the prevalence status of thyroid nodules in the population: a cross-sectional survey in Heilongjiang province, China. Biol Trace Elem Res. (2021) 199:3181–9. doi: 10.1007/s12011-020-02442-y, PMID: 33123864
14. Jiang H, Tian Y, Yan W, Kong Y, Wang H, Wang A, et al. The prevalence of thyroid nodules and an analysis of related lifestyle factors in Beijing communities. Int J Environ Res Public Health. (2016) 13:442. doi: 10.3390/ijerph13040442, PMID: 27110805
15. Chen Y, Zhu C, Chen Y, Wang N, Li Q, Han B, et al. The association of thyroid nodules with metabolic status: A cross-sectional SPECT-China study. Int J Endocrinol. (2018) 2018:6853617. doi: 10.1155/2018/6853617, PMID: 29721016
16. Liang Y, Li X, Wang F, Yan Z, Sang Y, Yuan Y, et al. Detection of thyroid nodule prevalence and associated risk factors in southwest China: A study of 45,023 individuals undergoing physical examinations. Diabetes Metab Syndr Obes. (2023) 16:1697–707. doi: 10.2147/dmso.S412567, PMID: 37312898
17. Tran NQ, Le BH, Hoang CK, Nguyen HT, and Thai TT. Prevalence of thyroid nodules and associated clinical characteristics: findings from a large sample of people undergoing health checkups at a university hospital in Vietnam. Risk Manag Healthc Policy. (2023) 16:899–907. doi: 10.2147/rmhp.S410964, PMID: 37220482
18. Chen Z, Hu M, Lin X, Wu J, Lin S, Lin Z, et al. A survey of dietary iodine intake among residents in Fujian Province. Chin Jouranl Endemiol. (2014) 33:414–8.
19. Zhang F, Teng D, Tong N, Wang G, Li Y, Yu X, et al. Gender-specific associations between metabolic disorders and thyroid nodules: A cross-sectional population-based study from China. Thyroid. (2022) 32:571–80. doi: 10.1089/thy.2021.0686, PMID: 35317620
20. Zhang C, Gao X, Han Y, Teng W, and Shan Z. Correlation between thyroid nodules and metabolic syndrome: A systematic review and meta-analysis. Front Endocrinol (Lausanne). (2021) 12:730279. doi: 10.3389/fendo.2021.730279, PMID: 34603208
21. Andersson T, Alfredsson L, Källberg H, Zdravkovic S, and Ahlbom A. Calculating measures of biological interaction. Eur J Epidemiol. (2005) 20:575–9. doi: 10.1007/s10654-005-7835-x, PMID: 16119429
22. Ding X, Xu Y, Wang Y, Li X, Lu C, Su J, et al. Gender disparity in the relationship between prevalence of thyroid nodules and metabolic syndrome components: the SHDC-CDPC community-based study. Mediators Inflamm. (2017) 2017:8481049. doi: 10.1155/2017/8481049, PMID: 28607535
23. Guo W, Tan L, Chen W, Fan L, Chen Y, Du C, et al. Relationship between metabolic syndrome and thyroid nodules and thyroid volume in an adult population. Endocrine Aug. (2019) 65:357–64. doi: 10.1007/s12020-019-01901-4, PMID: 30919285
24. He J, Lai Y, Yang J, Yao Y, Li Y, Teng W, et al. The relationship between thyroid function and metabolic syndrome and its components: A cross-sectional study in a Chinese population. Front Endocrinol (Lausanne). (2021) 12:661160. doi: 10.3389/fendo.2021.661160, PMID: 33868183
25. Huang W, Feng R, Xu X, Ma M, Chen J, Wang J, et al. Loss of anthropometry-lipids relationship in obese adults: A cross-sectional study in southern China. Clin Epidemiol. (2023) 15:191–201. doi: 10.2147/clep.S400150, PMID: 36825208
26. Su W, Chen M, Xiao L, Du S, Xue L, Feng R, et al. Association of metabolic dysfunction-associated fatty liver disease, type 2 diabetes mellitus, and metabolic goal achievement with risk of chronic kidney disease. Front Public Health. (2022) 10:1047794. doi: 10.3389/fpubh.2022.1047794, PMID: 36420005
27. Executive Summary of The Third Report of The National Cholesterol Education Program (NCEP) Expert Panel. Executive summary of the third report of the national cholesterol education program (NCEP) expert panel on detection, evaluation, and treatment of high blood cholesterol in adults (Adult treatment panel III). Jama. (2001) 285:2486–97. doi: 10.1001/jama.285.19.2486, PMID: 11368702
28. Alberti KG, Eckel RH, Grundy SM, Zimmet PZ, Cleeman JI, Donato KA, et al. Harmonizing the metabolic syndrome: a joint interim statement of the International Diabetes Federation Task Force on Epidemiology and Prevention; National Heart, Lung, and Blood Institute; American Heart Association; World Heart Federation; International Atherosclerosis Society; and International Association for the Study of Obesity. Circulation. (2009) 120:1640–5. doi: 10.1161/circulationaha.109.192644, PMID: 19805654
29. Liu B, Chen G, Zhao R, Huang D, and Tao L. Temporal trends in the prevalence of metabolic syndrome among middle-aged and elderly adults from 2011 to 2015 in China: the China health and retirement longitudinal study (CHARLS). BMC Public Health. (2021) 21:1045. doi: 10.1186/s12889-021-11042-x, PMID: 34078325
30. Li Y, Jin C, Li J, Tong M, Wang M, Huang J, et al. Prevalence of thyroid nodules in China: A health examination cohort-based study. Front Endocrinol (Lausanne). (2021) 12:676144. doi: 10.3389/fendo.2021.676144, PMID: 34122350
31. Alexander LF, Patel NJ, Caserta MP, and Robbin ML. Thyroid ultrasound: diffuse and nodular disease. Radiol Clin North Am. (2020) 58:1041–57. doi: 10.1016/j.rcl.2020.07.003, PMID: 33040847
32. Brito JP, Yarur AJ, Prokop LJ, McIver B, Murad MH, and Montori VM. Prevalence of thyroid cancer in multinodular goiter versus single nodule: a systematic review and meta-analysis. Thyroid. (2013) 23:449–55. doi: 10.1089/thy.2012.0156, PMID: 23067375
33. Yoon JH, Lee HS, Kim EK, Moon HJ, and Kwak JY. Malignancy risk stratification of thyroid nodules: comparison between the thyroid imaging reporting and data system and the 2014 American thyroid association management guidelines. Radiology. (2016) 278:917–24. doi: 10.1148/radiol.2015150056, PMID: 26348102
34. Kamran SC, Marqusee E, Kim MI, Frates MC, Ritner J, Peters H, et al. Thyroid nodule size and prediction of cancer. J Clin Endocrinol Metab. (2013) 98:564–70. doi: 10.1210/jc.2012-2968, PMID: 23275525
35. Grant EG, Tessler FN, Hoang JK, Langer JE, Beland MD, Berland LL, et al. Thyroid ultrasound reporting lexicon: white paper of the ACR thyroid imaging, reporting and data system (TIRADS) committee. J Am Coll Radiol. (2015) 12:1272–9. doi: 10.1016/j.jacr.2015.07.011, PMID: 26419308
36. Force UPST. Screening for thyroid cancer: US preventive services task force recommendation statement. JAMA. (2017) 317:1882–7. doi: 10.1001/jama.2017.4011, PMID: 28492905
37. Li W, Wang Y, Wen J, Zhang L, and Sun Y. Diagnostic performance of American college of radiology TI-RADS: A systematic review and meta-analysis. AJR Am J Roentgenol. (2021) 216:38–47. doi: 10.2214/ajr.19.22691, PMID: 32603229
38. Avram AM, Giovanella L, Greenspan B, Lawson SA, Luster M, Nostrand Van D, et al. SNMMI procedure standard/EANM practice guideline for nuclear medicine evaluation and therapy of differentiated thyroid cancer: abbreviated version. J Nucl Med. (2022) 63:15n–35n., PMID: 35649660
39. Noto B, Eveslage M, Pixberg M, Carvalho Gonzalez JM, Schäfers M, Riemann B, et al. Prevalence of hyperfunctioning thyroid nodules among those in need of fine needle aspiration cytology according to ATA 2015, EU-TIRADS, and ACR-TIRADS. Eur J Nucl Med Mol Imaging. (2020) 47:1518–26. doi: 10.1007/s00259-020-04740-y, PMID: 32152666
40. Huang X, Qiu Y, Chen Y, Chen L, Yi J, and Luo X. Epidemiological survey of thyroid nodules in 2098 patients for routine physical examination in Fujian, China. Contrast Media Mol Imaging. (2022) 2022:2913405. doi: 10.1155/2022/2913405, PMID: 35815059
41. Eckel RH, Grundy SM, and Zimmet PZ. The metabolic syndrome. Lancet. (2005) 365:1415–28. doi: 10.1016/s0140-6736(05)66378-7, PMID: 15836891
42. Wang JY, Wang CY, Pei D, Lai CC, Chen YL, Wu CZ, et al. Association between thyroid function and metabolic syndrome in elderly subjects. J Am Geriatr Soc. (2010) 58:1613–4. doi: 10.1111/j.1532-5415.2010.02998.x, PMID: 20942887
Keywords: thyroid nodule, imaging characteristics, thyroid imaging reporting and data system, metabolic disorders, cross-sectional study
Citation: Wang W, Xiao L, He M, Feng R, Huang X, Su Q, Xue X, Hu Z, Zhang Q, Du S, Lin H and Ye W (2025) Prevalence of thyroid nodules and canceration risk assessment in TIRADS, and their relationships to obesity and dysglycemia. Front. Oncol. 15:1658717. doi: 10.3389/fonc.2025.1658717
Received: 04 July 2025; Accepted: 10 September 2025;
Published: 29 September 2025.
Edited by:
Wilmer Silva Caso, Peruvian University of Applied Sciences, PeruReviewed by:
Richard Junior Zapata Dongo, National University of San Marcos, PeruJohanna Elizabeth Martins Luna, Universidad Tecnológica del Perú, Peru
Copyright © 2025 Wang, Xiao, He, Feng, Huang, Su, Xue, Hu, Zhang, Du, Lin and Ye. This is an open-access article distributed under the terms of the Creative Commons Attribution License (CC BY). The use, distribution or reproduction in other forums is permitted, provided the original author(s) and the copyright owner(s) are credited and that the original publication in this journal is cited, in accordance with accepted academic practice. No use, distribution or reproduction is permitted which does not comply with these terms.
*Correspondence: Hong Lin, MTEyNTI4NDI4MEBxcS5jb20=; Shanshan Du, ZHVzaGFuc2hhbjEwMDdAMTYzLmNvbQ==; Weimin Ye, eXdtQGZqbXUuZWR1LmNu
†These authors have contributed equally to this work