 Jingjing Liang
 Guoxiu Lu
 Qi Peng1,2
 Guoxu Zhang
- 1Department of Nuclear Medicine, General Hospital of Northern Theatre Command, Shenyang, China
- 2Training Base for Graduate, General Hospital of Northern Theater Command, China Medical University, Shenyang, China
- 3Department of Hematology, General Hospital of Northern Theatre Command, Shenyang, China
Background: Double-expressor lymphoma (DEL) is an aggressive diffuse large B-cell lymphoma (DLBCL) subtype (20%–30% of cases) exhibiting resistance to standard immunochemotherapy regimens [R-CHOP (rituximab, cyclophosphamide, doxorubicin, vincristine, and prednisone)]. Multiple clinical studies have demonstrated that the combined use of new drugs such as Chidamide can significantly improve outcomes in DEL, underscoring the need for early identification of high-risk patients to guide therapy. In this context, baseline 18F-FDG positron emission tomography/computed tomography (PET/CT) metabolic parameters are poised to become a pivotal tool for optimizing risk stratification in DEL, owing to their unique capability to non-invasively quantify tumor metabolic heterogeneity.
Methods: We retrospectively analyzed clinical and baseline 18F-FDG PET/CT imaging data from treatment-naive patients with DLBCL at the Northern Theater Command General Hospital from January 2020 to February 2025. Patients were classified into a DEL group and a non-DEL group. PET/CT parameters were correlated with clinical–pathologic features using Spearman analysis. Optimal thresholds for maximum standardized uptake value (SUVmax), total metabolic tumor volume (TMTV), and total lesion glycolysis (TLG) were determined by receiver operating characteristic (ROC) analysis. Univariate and multivariate analyses were performed to identify independent predictors, followed by the development and validation of a combined prediction model using ROC analysis, calibration curves, and decision curve analysis (DCA).
Results: A total of 128 patients (71 men and 57 women, median age, 60 years, range, 16 to 87 years) were included in the non-DEL group (n = 82) and DEL group (n = 46). Spearman analysis revealed that PET/CT parameters significantly correlated with the International Prognostic Index (IPI), Ann Arbor stage, B symptoms, β2-MG, LDH, and non-GCB (r = 0.20–0.68, p < 0.05), but not Ki-67 (p > 0.05). TMTV demonstrated optimal DEL prediction (threshold = 510.22 cm³, AUC = 0.81, 95% CI, 0.73–0.88 p = 0.038). TMTV (>510.22 cm³, OR = 8.79, 95% CI, 3.20–24.11, p < 0.001), IPI (OR = 3.82, 95% CI, 1.44–10.11, p = 0.007), and Ki-67 (OR = 1.07, 95% CI, 1.03–1.11, p = 0.001) were identified as independent DEL predictors. The TMTV+IPI+Ki-67 combined model (AUC = 0.867, p < 0.05) showed significantly higher discriminative performance compared to dual-parameter models (TMTV+IPI, AUC = 0.798; TMTV+Ki-67, AUC = 0.844; IPI+Ki-67, AUC = 0.797, all p < 0.05). This superiority was further confirmed through calibration curves and DCA, indicating its reliable predictive accuracy and clinical utility.
Conclusions: TMTV, IPI, and Ki-67 are robust independent predictors of DEL. The integrated clinical–imaging–pathological prediction model constructed from these three parameters synergistically combines multi-dimensional information, significantly enhancing early DEL identification capability and facilitating the implementation of risk-adapted therapeutic strategies.
Introduction
Diffuse large B-cell lymphoma (DLBCL), the most common subtype of non-Hodgkin lymphoma (NHL), constitutes approximately 40% of adult NHL cases (1). Its marked clinical heterogeneity poses a major challenge for precision therapy. Molecular subtyping advances have progressively elucidated the substantial heterogeneity within DLBCL. The co-overexpression of c-Myc and Bcl-2 proteins detected by immunohistochemistry (IHC) defines double-expressor lymphoma (DEL), representing 20%–30% of newly diagnosed DLBCL cases (2, 3). DEL typically exhibits resistance to standard R-CHOP immunochemotherapy (rituximab, cyclophosphamide, doxorubicin, vincristine, and prednisone) and demonstrates strong associations with adverse prognostic features, including elevated Ki-67, increased lactate dehydrogenase (LDH) levels, and more advanced Ann Arbor stage (4–6). While novel agents (e.g., histone deacetylase inhibitors such as Chidamide) combined with R-CHOP may improve DEL outcomes (7–11), current diagnostic identification relies solely on pathological criteria—a method that is time-consuming and carries inherent risks of specimen damage during handling. Consequently, developing early-detection strategies for DEL to guide treatment intensification remains a critical unmet clinical need.
18F-FDG positron emission tomography/computed tomography (PET/CT) metabolic parameters objectively quantify tumor proliferative activity and metabolic burden, effectively evaluating disease status. This modality corrects staging in 15%–20% of patients and modifies therapeutic strategies in nearly 8% of cases, and is strongly recommended for routine use in initial staging and treatment response evaluation of DLBCL (12). Maximum standardized uptake value (SUVmax) captures peak metabolic activity within lesions, reflecting tumor glycolytic intensity. Metabolic tumor volume (MTV), as a measurable volumetric parameter, objectively quantifies the whole-body metabolic tumor burden. Total lesion glycolysis (TLG) integrates both metabolic volume and glycolytic intensity. Collectively, these parameters provide a comprehensive assessment of tumor metabolic heterogeneity (14) and demonstrate significant positive correlation with lymphoma aggressiveness, holding independent prognostic value for DLBCL risk stratification (15–18). Notably, Dong et al. (19) demonstrated that SUVmax significantly correlates with c-Myc/Bcl-2 protein expression and directly impacts DLBCL treatment efficacy. Zhao et al. (13) established a total metabolic tumor volume (TMTV)-based grading system predictive of outcomes in DEL. These findings collectively suggest that PET/CT metabolic parameters may serve as noninvasive imaging biomarkers for identifying DEL, with substantial translational significance for personalized therapy. However, systematic research on PET/CT for DEL diagnosis, prognostication, and treatment response prediction remains insufficient.
This study aims to incorporate baseline PET/CT metabolic parameters, clinical characteristics, and pathological biomarkers to comprehensively investigate the association between metabolic imaging features and DEL molecular phenotypes. We subsequently construct a multimodal early-detection model for DEL, seeking to overcome the limitations of conventional risk stratification and provide a precise clinical tool for early intervention and individualized therapy in high-risk patients.
Materials and methods
Population
We retrospectively analyzed clinical characteristics and baseline PET/CT metabolic parameters in 128 treatment-naive patients with DLBCL (71 men and 57 women, median age, 60 years, range, 16 to 87 years) evaluated at our institution from January 2020 through February 2025. Patients were stratified into a non-DEL (n = 82) group and a DEL (n = 46) group based on immunohistochemical criteria (c-Myc ≥ 40% and Bcl-2 ≥ 50%) (2).
The inclusion criteria were as follows, (i) pathologically verified DLBCL with complete IHC; (ii) baseline 18F-FDG PET/CT images (≥1 lesion with SUVmax > 2.5); and (iii) availability of complete clinical data. The following were the exclusion criteria, (i) central nervous system lymphoma (CNSL) (20) or secondary malignancies; (ii) history of prior antitumor therapy (except for diagnostic biopsies or excisional lymph node biopsies); and (iii) incomplete clinical data or poor-quality PET/CT images.
Collected data from medical records included the following, age, sex, B symptoms, International Prognostic Index (IPI) score (0–2/3–5), Ann Arbor stage (I–II/III–IV), disease site (nodal/extranodal), pathological subtype (GCB/non-GCB), expression levels of c-Myc, Bcl-2, Ki-67, LDH, and β2-microglobulin (β2-MG) (Figure 1).
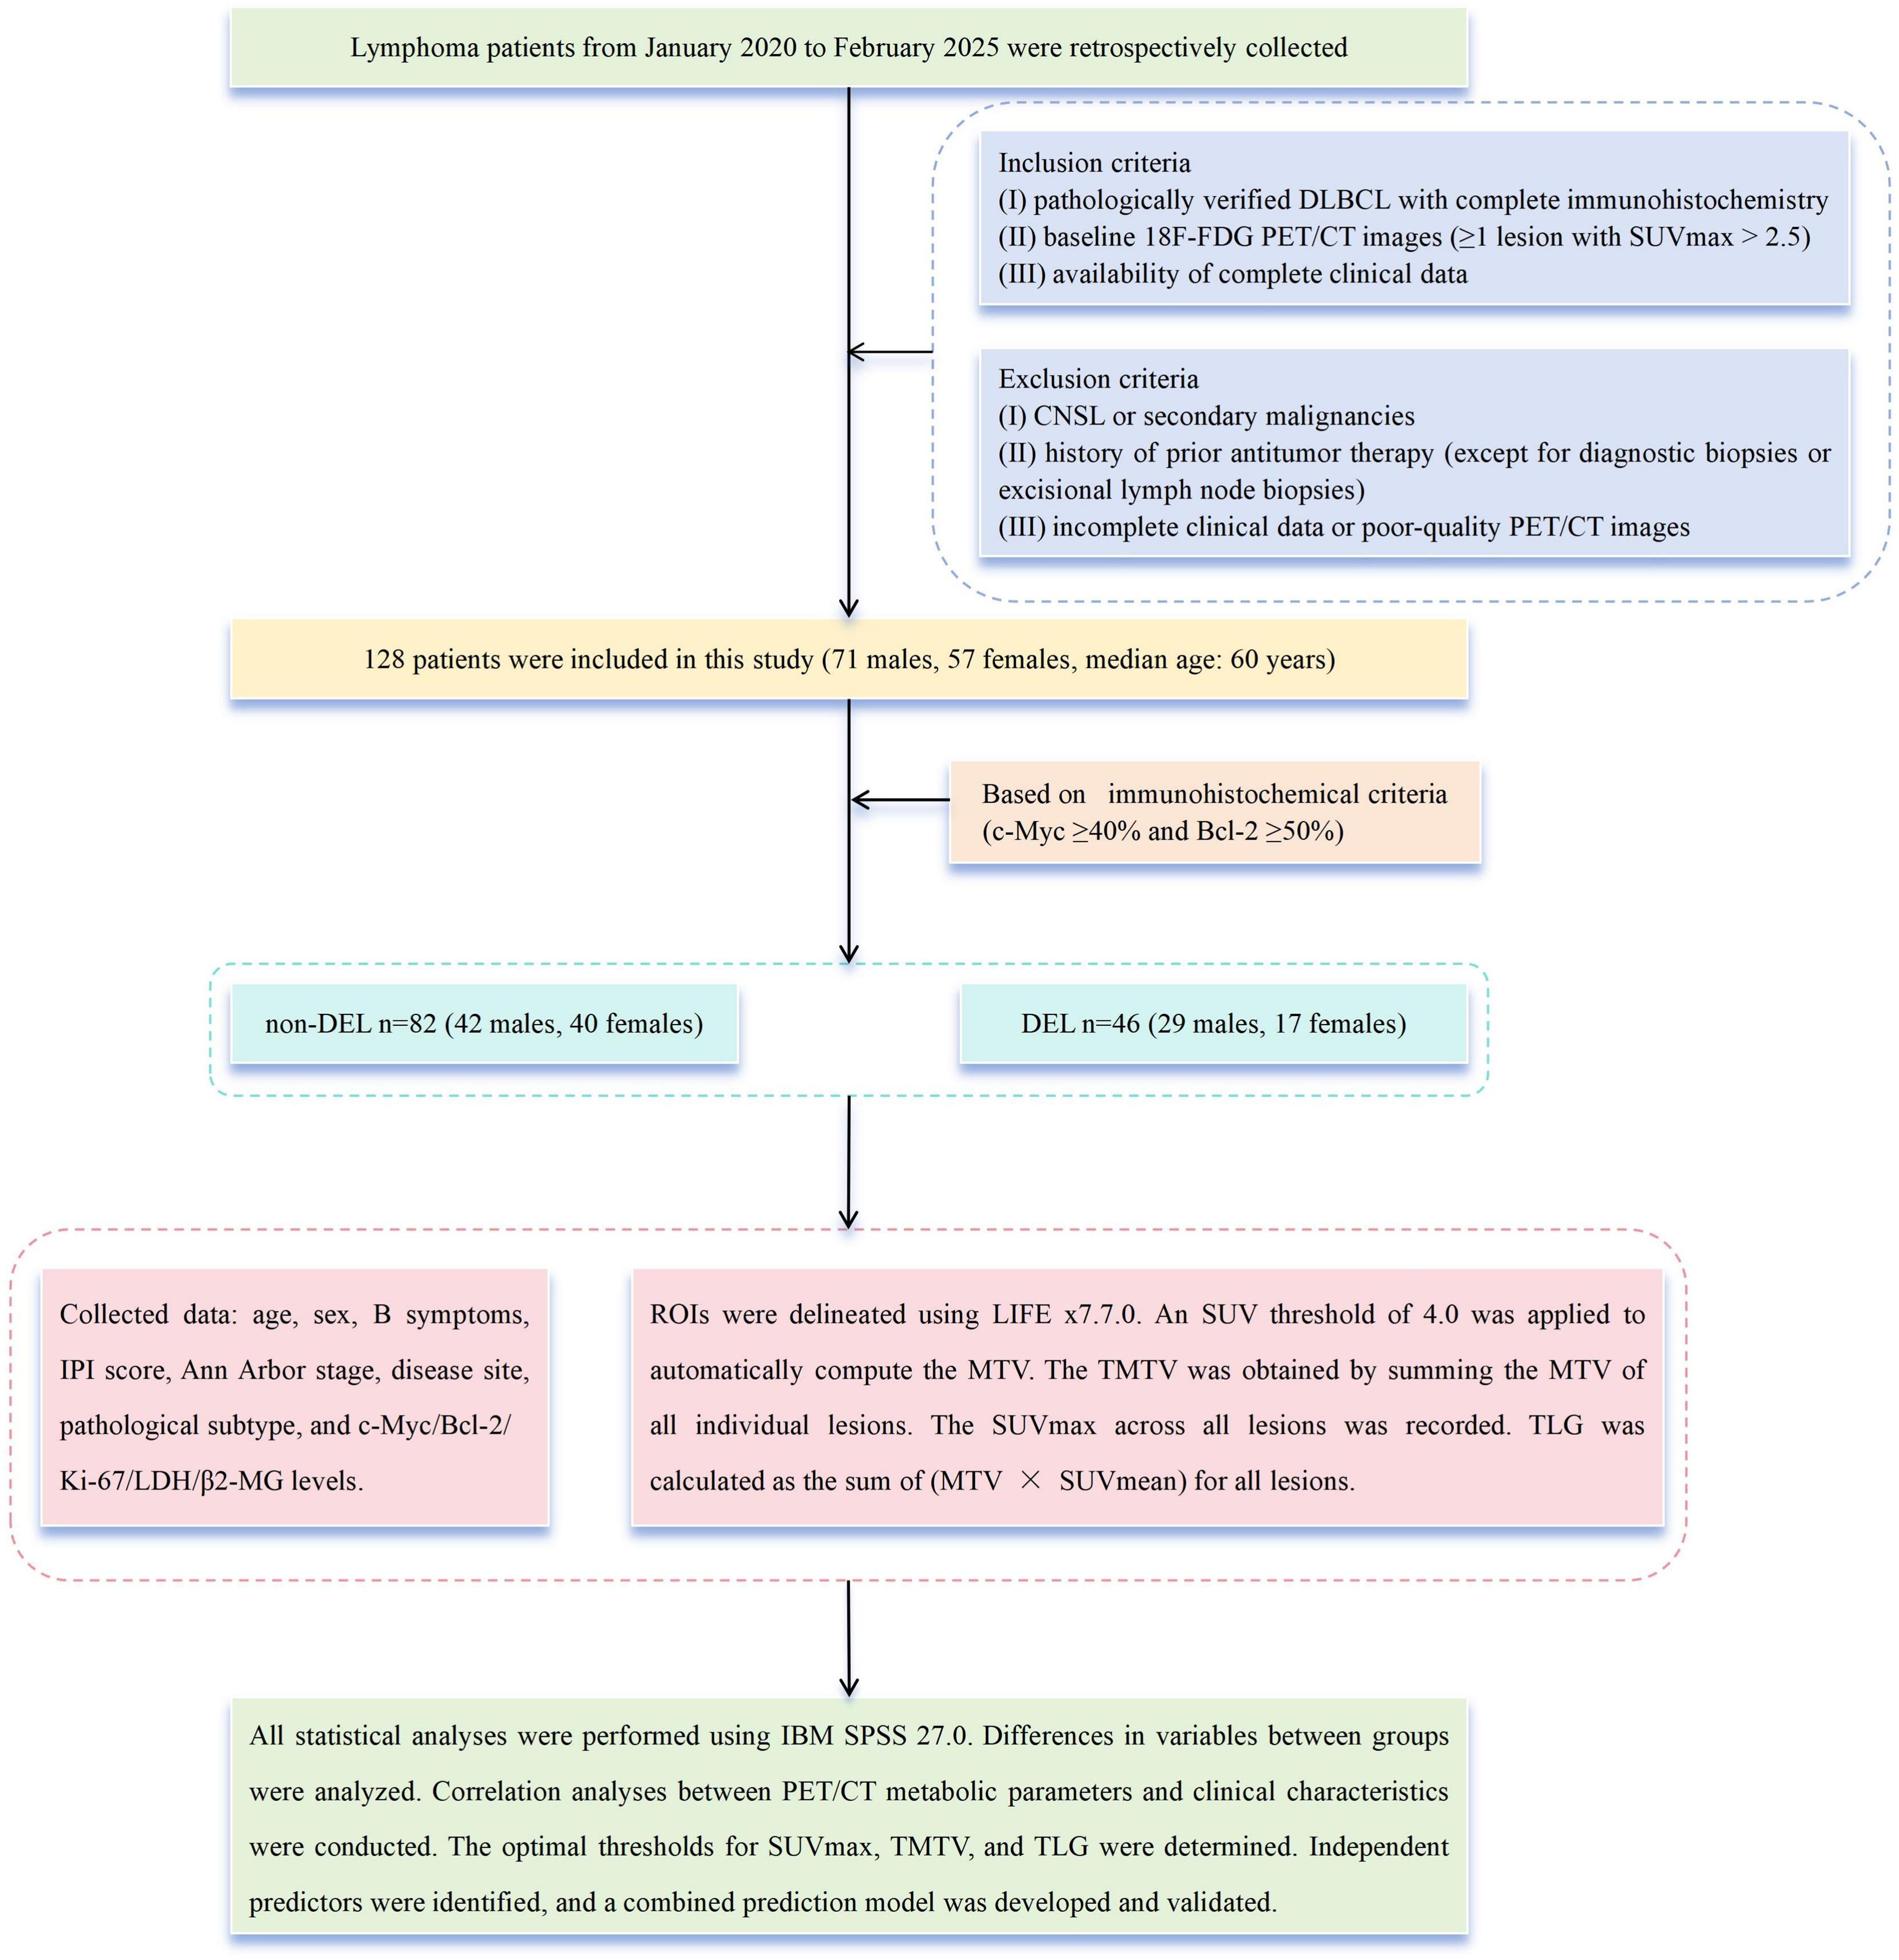
Figure 1. DLBCL patients enrollment flowchart.
The study was conducted in accordance with the Declaration of Helsinki and approved by the Ethics Committee of Northern Theater Command General Hospital (Approval No. Y[2025]187). As a retrospective study, it was exempt from the requirement of obtaining informed consent.
18F-FDG PET/CT acquisition
All scans utilized the Discovery PET/CT system (GE Healthcare). Patients fasted ≥6 h (blood glucose < 11.1 mmol/L). According to body weight, 3.70–5.18 MBq/kg of 18F-FDG (produced by a GE Healthcare medical cyclotron and synthesized via an automatic synthesis module, with radiochemical purity >98%) was intravenously injected. After a 50- to 60-min quiet rest period, scanning commenced. Routine scans were conducted from the skull base to the mid-thigh level, with additional coverage extended to the feet when necessary. CT scanning parameters included the following, tube voltage, 120 kV; tube current, 110 mA; pitch, 1.0; rotation time, 0.5 s/rotation; and slice thickness, 3.27 mm. PET scanning employed 3D acquisition with six to eight bed positions at 1.5 min per bed position. CT data were used for automated attenuation correction of PET images.
18F-FDGPET/CT image analysis
Images of regions of interest (ROIs) were delineated using LIFEx7.7.0 (21), with careful exclusion of physiological high-uptake regions such as the brain, heart, and bladder to minimize impact on results. Initially, ROI was independently performed by a junior and a senior radiologist, and discrepancies (>15% volume difference) were resolved by a senior nuclear medicine specialist. Secondly, SUV = 4.0 was applied to automatically compute the MTV (22–24). The TMTV was obtained by summing the MTV of all individual lesions. The SUVmax among all lesions was recorded. The TLG was the sum of MTV × SUVmean of all lesions (Figure 2).
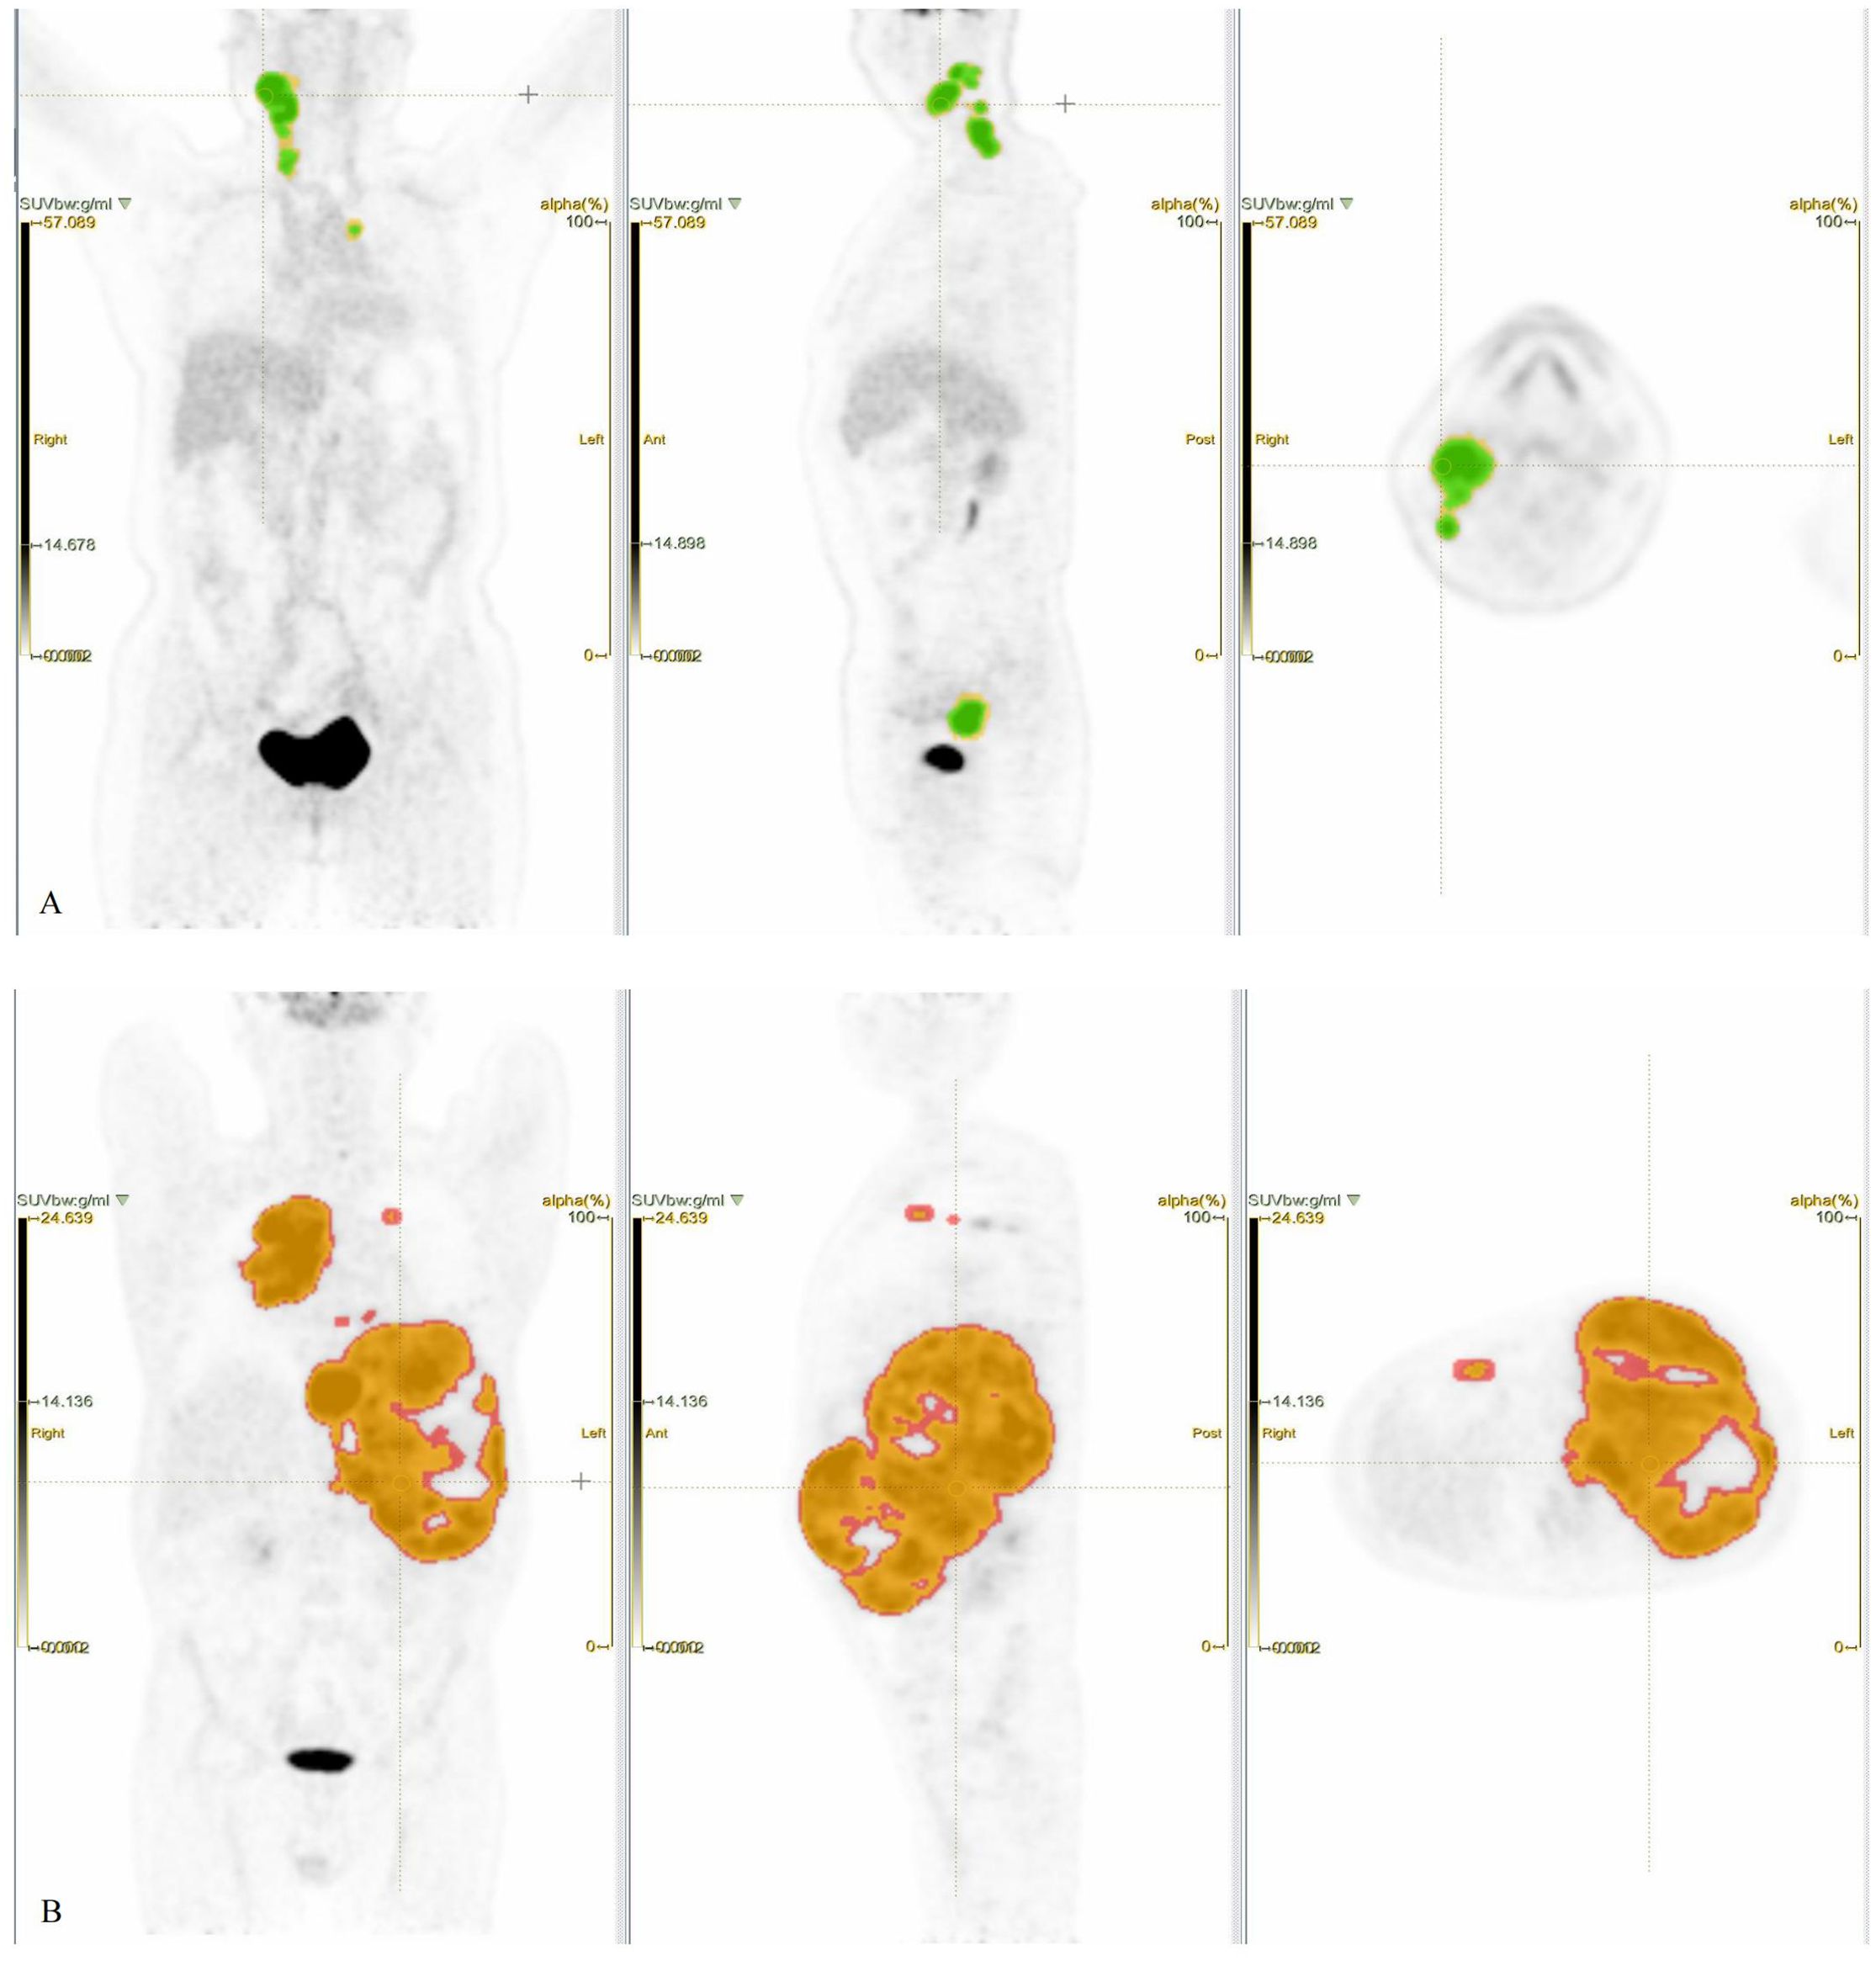
Figure 2. Patient 1, female, 59 years old, presenting with a painful, firm right cervical lymphadenopathy (4 × 4 cm) persisting for over 3 months, without fever, night sweats, or significant weight change. Laboratory findings, LDH 160 U/L, β2-MG 1.80 mg/L. Pathology, DLBCL. IHC, c-Myc 20%, Bcl-2 −, Ki-67 50%. Clinical diagnosis, DLBCL (non-GCB), stage IIA, IPI score 1 (low risk). (A) PET ROIs, where the yellow ROI denotes total tumor volume and the green overlapping ROI (SUV ≥ 4.0) was used to calculate TMTV and TLG. (Note, Not all lesion areas are displayed.) Patient 2, male, 53 years old. Intermittent abdominal pain for over 4 months without fever or night sweats, no significant weight change. Physical examination, Abdominal distension, spleen palpable 4–5 cm below the left costal margin along Schmid’s line I, 8–11 cm along Schmid’s line II, and +3 cm along Schmid’s line III. No other positive signs. Laboratory findings, LDH, 1,385 U/L, β2-MG, 6.23 mg/L. Pathology, DLBCL (DEL). IHC, c-Myc 50%, Bcl-2 90%, Ki-67 80%. Clinical diagnosis, DLBCL (non-GCB) Stage IV A, IPI score, 4 points (high risk). (B) PET ROIs, where the red ROI denotes total tumor volume and the orange overlapping ROI (SUV ≥ 4.0) was used to calculate TMTV and TLG. (Note, Not all lesion areas are displayed.).
Statistical analysis
All statistical analyses used IBM SPSS 27.0. Categorical variables were presented as frequencies (%) and analyzed using χ2 tests. Continuous variables were reported as mean ± SD or median [interquartile range (IQR)], with comparisons performed via t-tests or Mann–Whitney U tests, respectively. PET/CT parameters were correlated with clinical–pathologic features using Spearman analysis. Optimal thresholds for SUVmax, TMTV, and TLG were determined by receiver operating characteristic (ROC) curves (Youden’s index). Univariate and multivariate analyses were conducted to identify independent predictors, followed by development and validation of a combined prediction model using ROC analysis, calibration curves, and decision curve analysis (DCA). A p-value < 0.05 was considered statistically significant.
Results
General features
Table 1 summarizes the clinical characteristics of 128 enrolled patients. Compared to non-DEL patients, DEL patients exhibited significantly higher proportions of high-risk features, including B symptoms (58% vs. 32%, p = 0.005), advanced Ann Arbor stage (III–IV, 80% vs. 54%, p = 0.004), IPI ≥ 3 (76% vs. 32%, p < 0.001), and non-GCB subtype (67% vs. 48%, p = 0.042). Furthermore, DEL patients demonstrated significantly elevated median values across key metabolic and serologic biomarkers, LDH [360.50 U/L (IQR 238.25–529.75) vs. 219.50 U/L (IQR 170.75–316.75)], β2-MG [3.98 mg/L (IQR 2.84–5.03) vs. 2.84 mg/L (IQR 2.13–3.12)], Ki-67 [80.00% (IQR 70.00–86.25) vs. 80.00% (IQR 80.00–90.00)], and PET/CT parameters including SUVmax [29.07 (IQR 23.79–37.03) vs. 22.35 (IQR 16.47–34.04)], TMTV [7,761.36 cm3 (IQR 2,879.92–12,914.86) vs. 1,319.35 cm3 (IQR 310.01–4,290.68)], and TLG [763.54 g (IQR 311.48–1,221.14) vs. 151.74 g (IQR 41.09–487.90)]. The substantial IQRs underscore the marked disparities in these parameters.

Table 1. Comparative analysis of baseline characteristics and PET/CT metabolic parameters between non-DEL and DEL cohorts.
Correlations between PET/CT metabolic parameters and clinical features
In the overall cohort (Figure 3), SUVmax/TMTV/TLG exhibited significant positive correlations with IPI (r = 0.249/0.496/0.504; p ≤ 0.005), Ann Arbor stage (r = 0.205/0.472/0.477; p ≤ 0.02), B symptoms (r = 0.200/0.355/0.365; p ≤ 0.024), β2-MG (r = 0.299/0.498/0.489; p ≤ 0.001), and LDH (r = 0.251/0.687/0.686; p ≤ 0.004), but not with pathological subtype (GCB/non-GCB), lesion site (nodal/extranodal), or Ki-67 (p > 0.05). In the DEL subgroup (Figure 3), SUVmax correlated with IPI (r = 0.413, p = 0.004), Ann Arbor stage (r = 0.324, p = 0.028), and pathological type (r = 0.292, p = 0.049). TMTV correlated with Ann Arbor stage (r = 0.297, p = 0.045), LDH (r = 0.524, p < 0.001), and β2-MG (r = 0.491, p = 0.001), while TLG correlated with IPI (r = 0.294, p = 0.048), Ann Arbor stage (r = 0.349, p = 0.018), β2-MG (r = 0.573, p < 0.001), and LDH (r = 0.573, p < 0.001). No parameter correlated with B symptoms or Ki-67 (p > 0.05). In the non-DEL subgroup (Figure 3), TMTV/TLG correlated with IPI (r = 0.424/0.384; p < 0.001), Ann Arbor stage (r = 0.457/0.432; p < 0.001), B symptoms (r = 0.412/0.354; p ≤ 0.001), β2-MG (r = 0.287/0.278; p ≤ 0.011), and LDH (r = 0.597/0.586; p < 0.001), but not with lesion site, pathological type, or Ki-67 (p > 0.05). SUVmax displayed no significant associations with any clinical features (p > 0.05). Notably, metabolic parameters consistently showed no correlation with Ki-67 across all subgroups (p > 0.05).
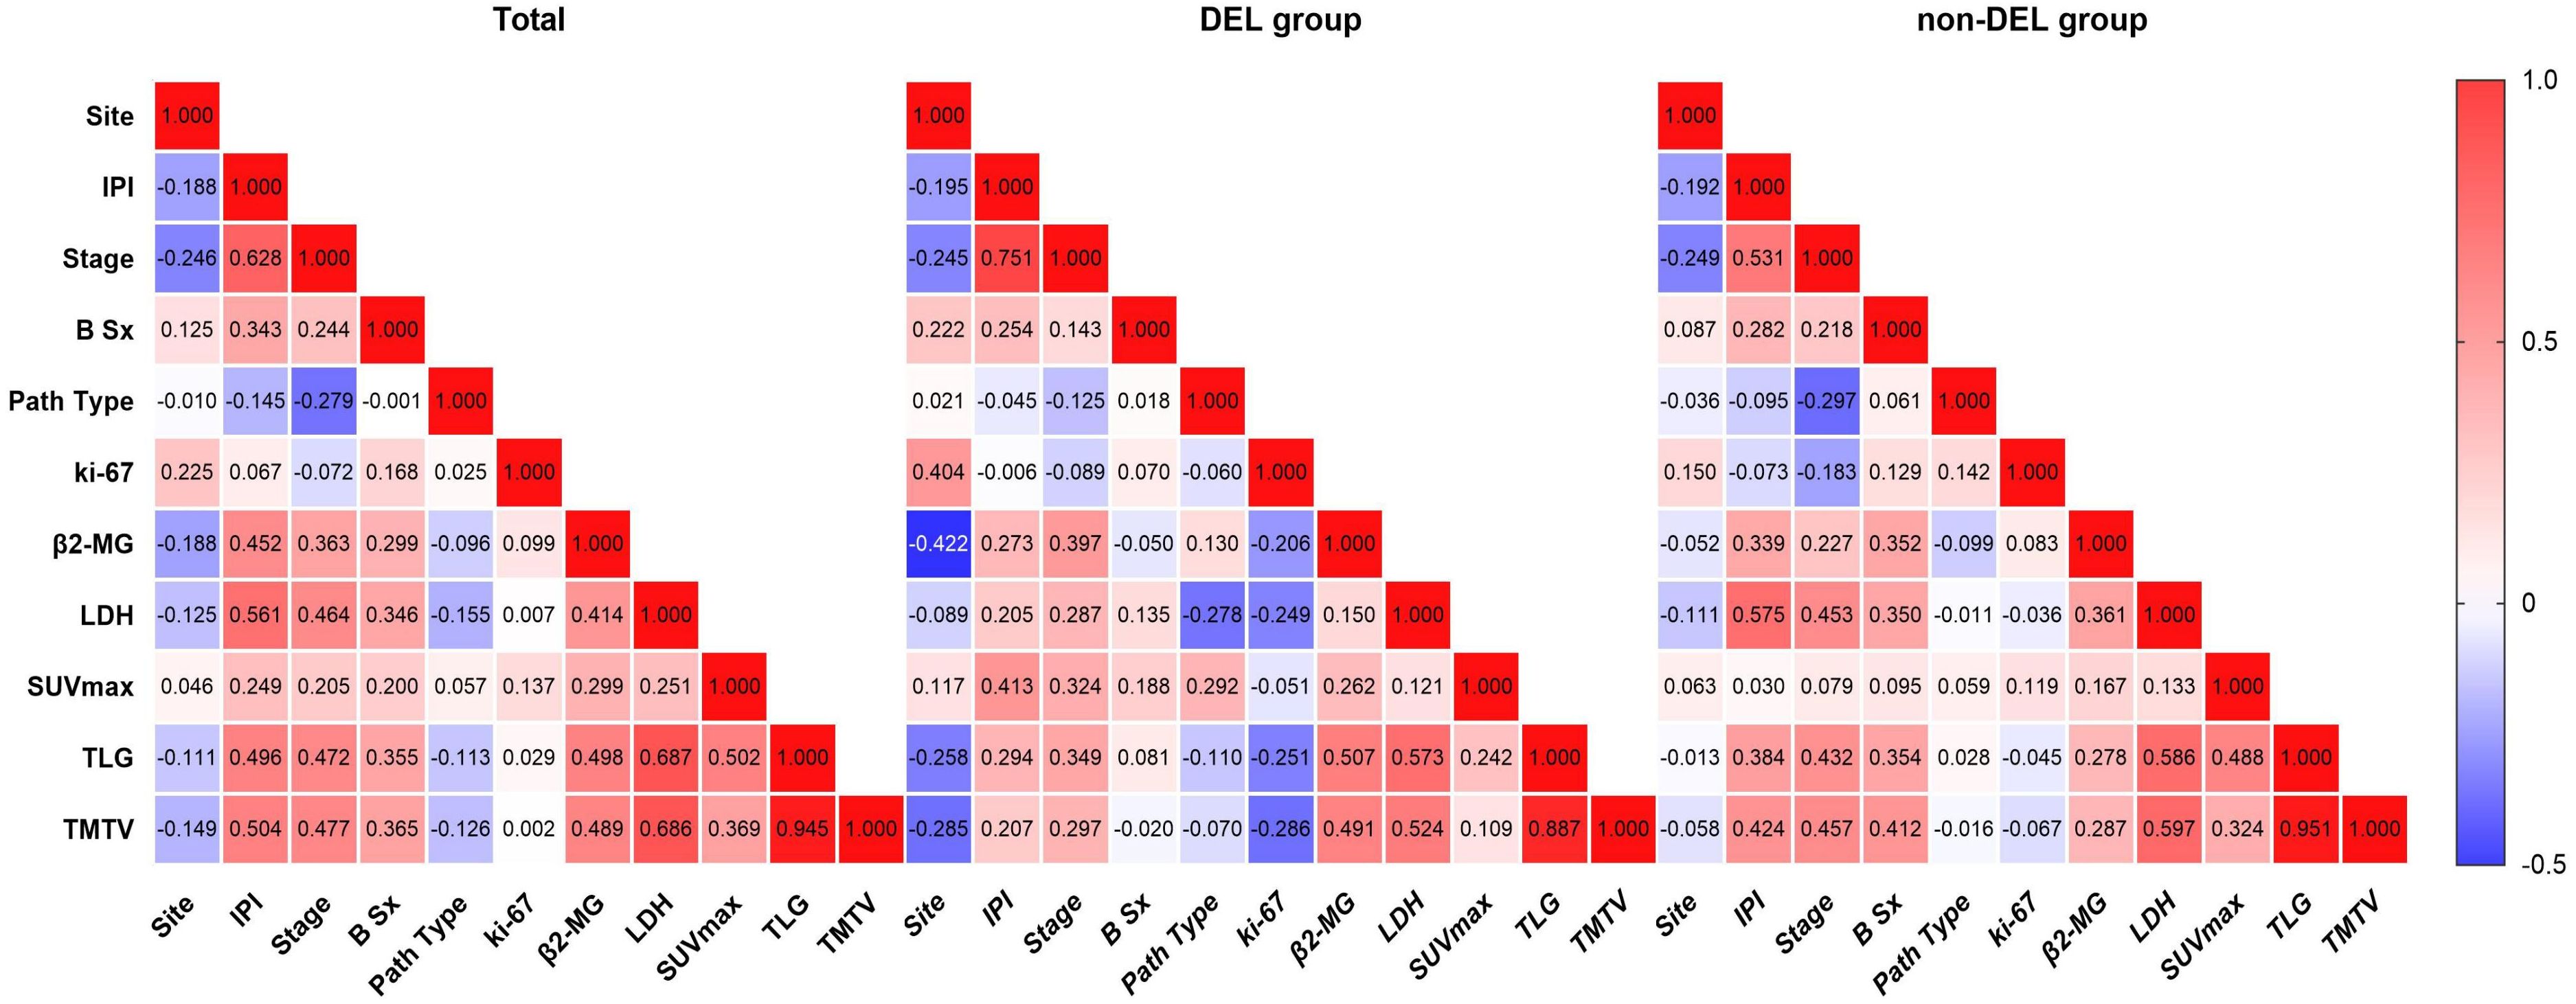
Figure 3. Correlations between PET/CT parameters and clinical features. From left to right are the overall cohort, the DEL group, and the non-DEL group, respectively. Site, Lesion location (nodal/extranodal); IPI, International Prognostic Index (0–2, low risk; 3–5, high risk); Stage, Ann Arbor stage (I–II, early stage; III–IV, advanced stage); B Sx, B symptoms; Path Type, pathological type (GCB, germinal center B-cell-like; non-GCB, non-germinal center B-cell-like subtypes); Ki-67, proliferation index; β2-MG, β2-microglobulin; LDH, lactate dehydrogenase; SUVmax, maximum standardized uptake value; TLG, total lesion glycolysis; TMTV, total metabolic tumor volume. Significance level, p < 0.05.
ROC curve analysis
ROC analysis established optimal stratification thresholds for metabolic parameters, SUVmax at 23.35 (AUC = 0.685, p = 0.047), TMTV at 510.22 cm³ (AUC = 0.808, p = 0.038), and TLG at 2,994.85 g (AUC = 0.802, p = 0.039) (Table 2). Notably, both volumetric parameters (TMTV and TLG) demonstrated superior discriminatory capacity (AUC > 0.800) compared to SUVmax. Based on these thresholds, patients were stratified into low and high metabolic parameter groups, with significant differential distribution between non-DEL and DEL cohorts detailed in Table 1.
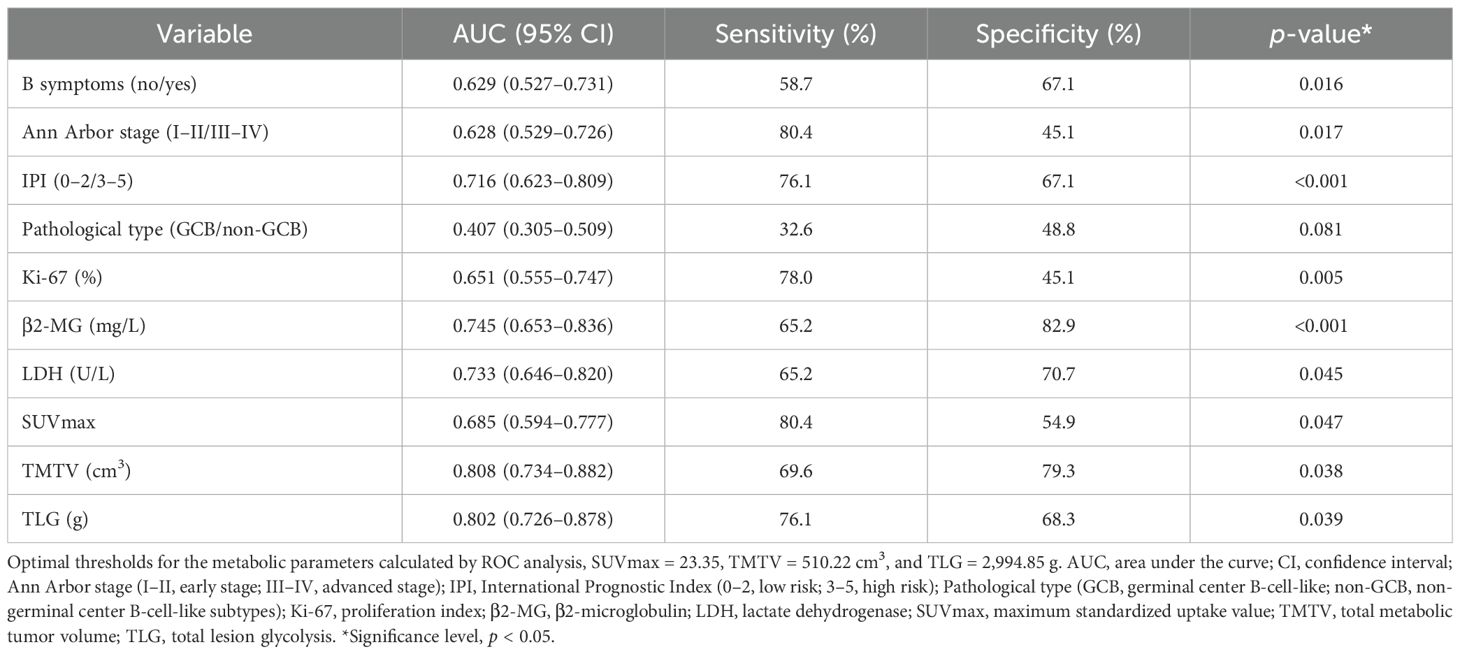
Table 2. ROC analysis for predicting DEL.
Univariate and multivariate analysis results
Univariate analysis identified IPI, Ann Arbor stage, B symptoms, LDH, β2-MG, Ki-67, SUVmax, TMTV, and TLG as predictors of DEL (all p < 0.05). Multivariate analysis identified TMTV (>510.22 cm³, OR = 8.79, 95% CI, 3.20–24.11, p < 0.001), IPI (OR = 3.82, 95% CI:1.44–10.11, p = 0.007), and Ki-67 (OR = 1.07, 95% CI, 1.03–1.11, p = 0.001) as independent predictors.
Diagnostic prediction model development and evaluation
TMTV, IPI, and Ki-67 were incorporated to develop a combined predictive model (TMTV+IPI+Ki-67). The model demonstrated significantly superior discriminative ability compared to all dual-parameter combinations (AUC, 0.867 vs. 0.790–0.844; all p < 0.05; Figure 4). Notably, TMTV emerged as the primary performance driver, dual-parameter models containing TMTV (TMTV+IPI, AUC = 0.798; TMTV+Ki-67, AUC = 0.844) outperformed the model without TMTV (IPI+Ki-67, AUC = 0.797). Visualization via nomogram (Figure 5) quantified predictor contributions, assigning relative weights of 41.6% (TMTV) and 42.6% (Ki-67), establishing both as core determinants of the model’s predictive function. Calibration validation revealed that the conventional calibration curve (Figure 6A) demonstrated good agreement within the intermediate-risk range (0.3–0.7; mean absolute error < 5%), but minor systemic miscalibration across the distribution (slope = 0.142, intercept = 0.463). The cumulative calibration curve (Figure 6B) indicated a maximum deviation <5% across the risk spectrum, with the Hosmer–Lemeshow test (χ² = 6.241, p = 0.620) confirming adequate overall calibration. This was further supported by a relatively low prediction error (Brier score = 0.158). DCA (Figure 7) further established the model’s clinical utility, yielding significantly higher net benefit (ΔNB = 3.4%–11.5%) across clinically relevant thresholds compared to alternative models.
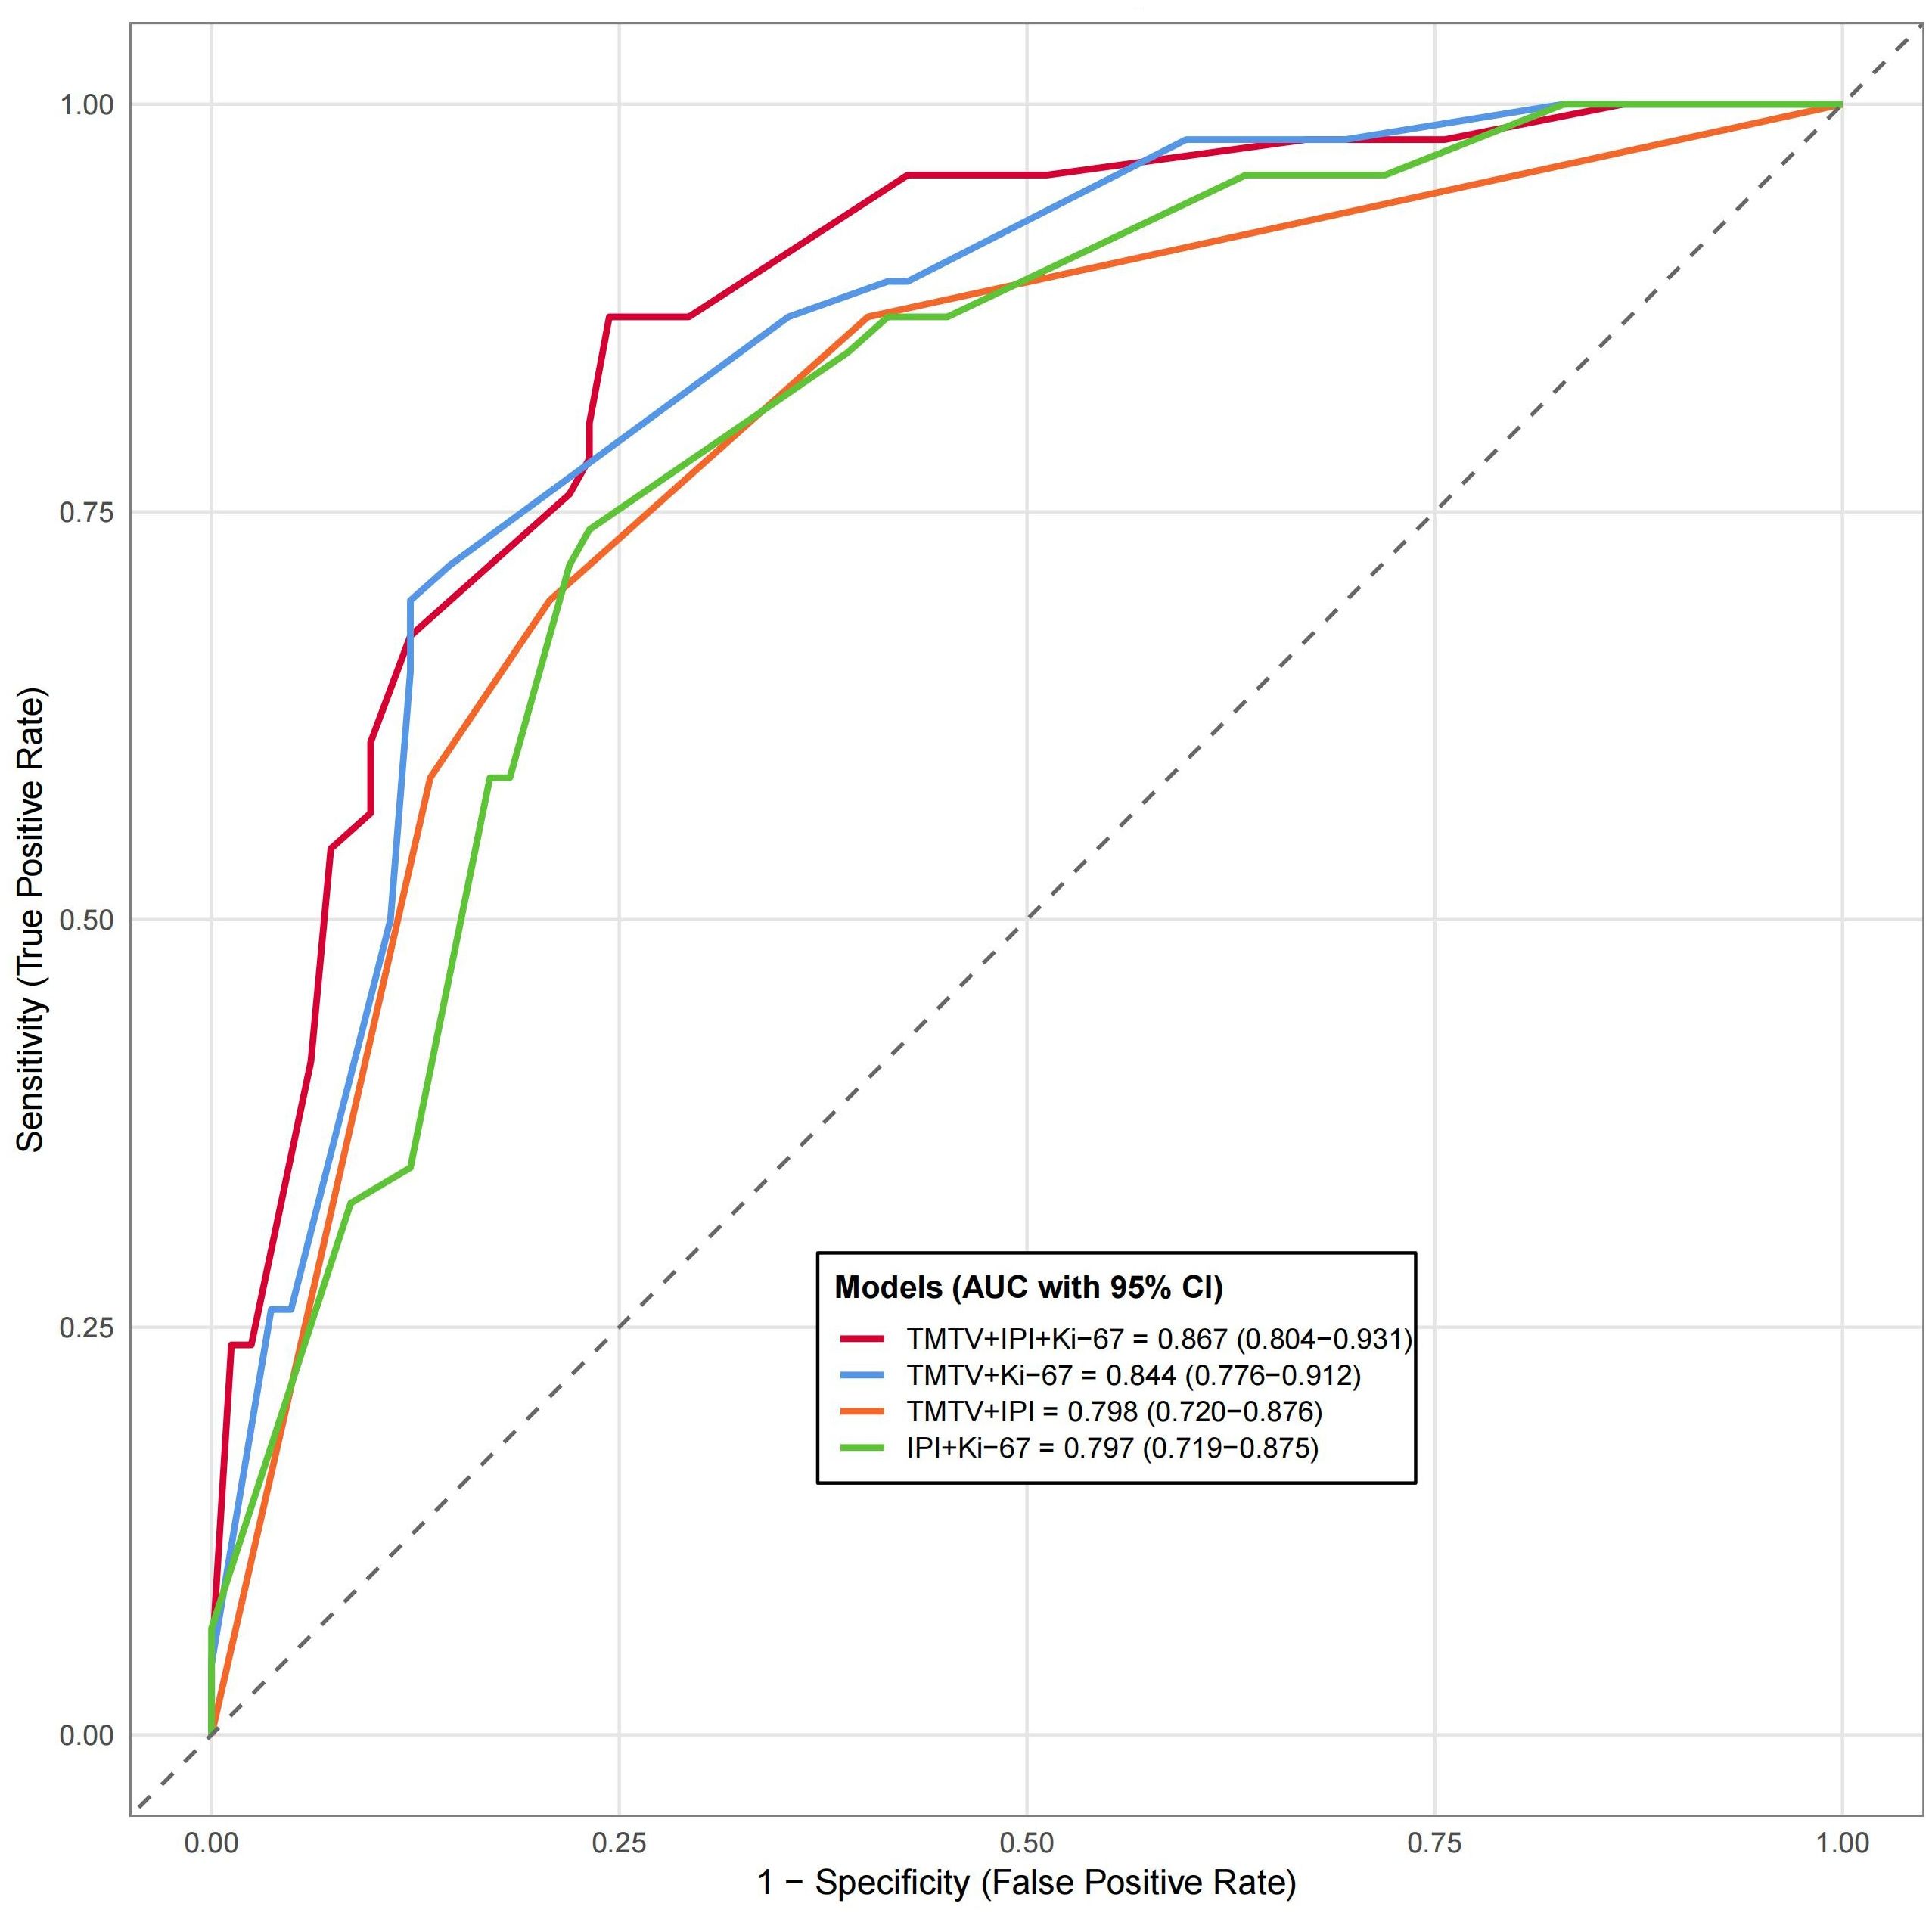
Figure 4. Compare the receiver working characteristic curve analysis of different models. AUC, area under the curve; CI, confidence interval; IPI, International Prognostic Index (0–2, low risk; 3–5, high risk); Ki-67, proliferation index; TMTV, total metabolic tumor volume. Significance level, all p < 0.001.
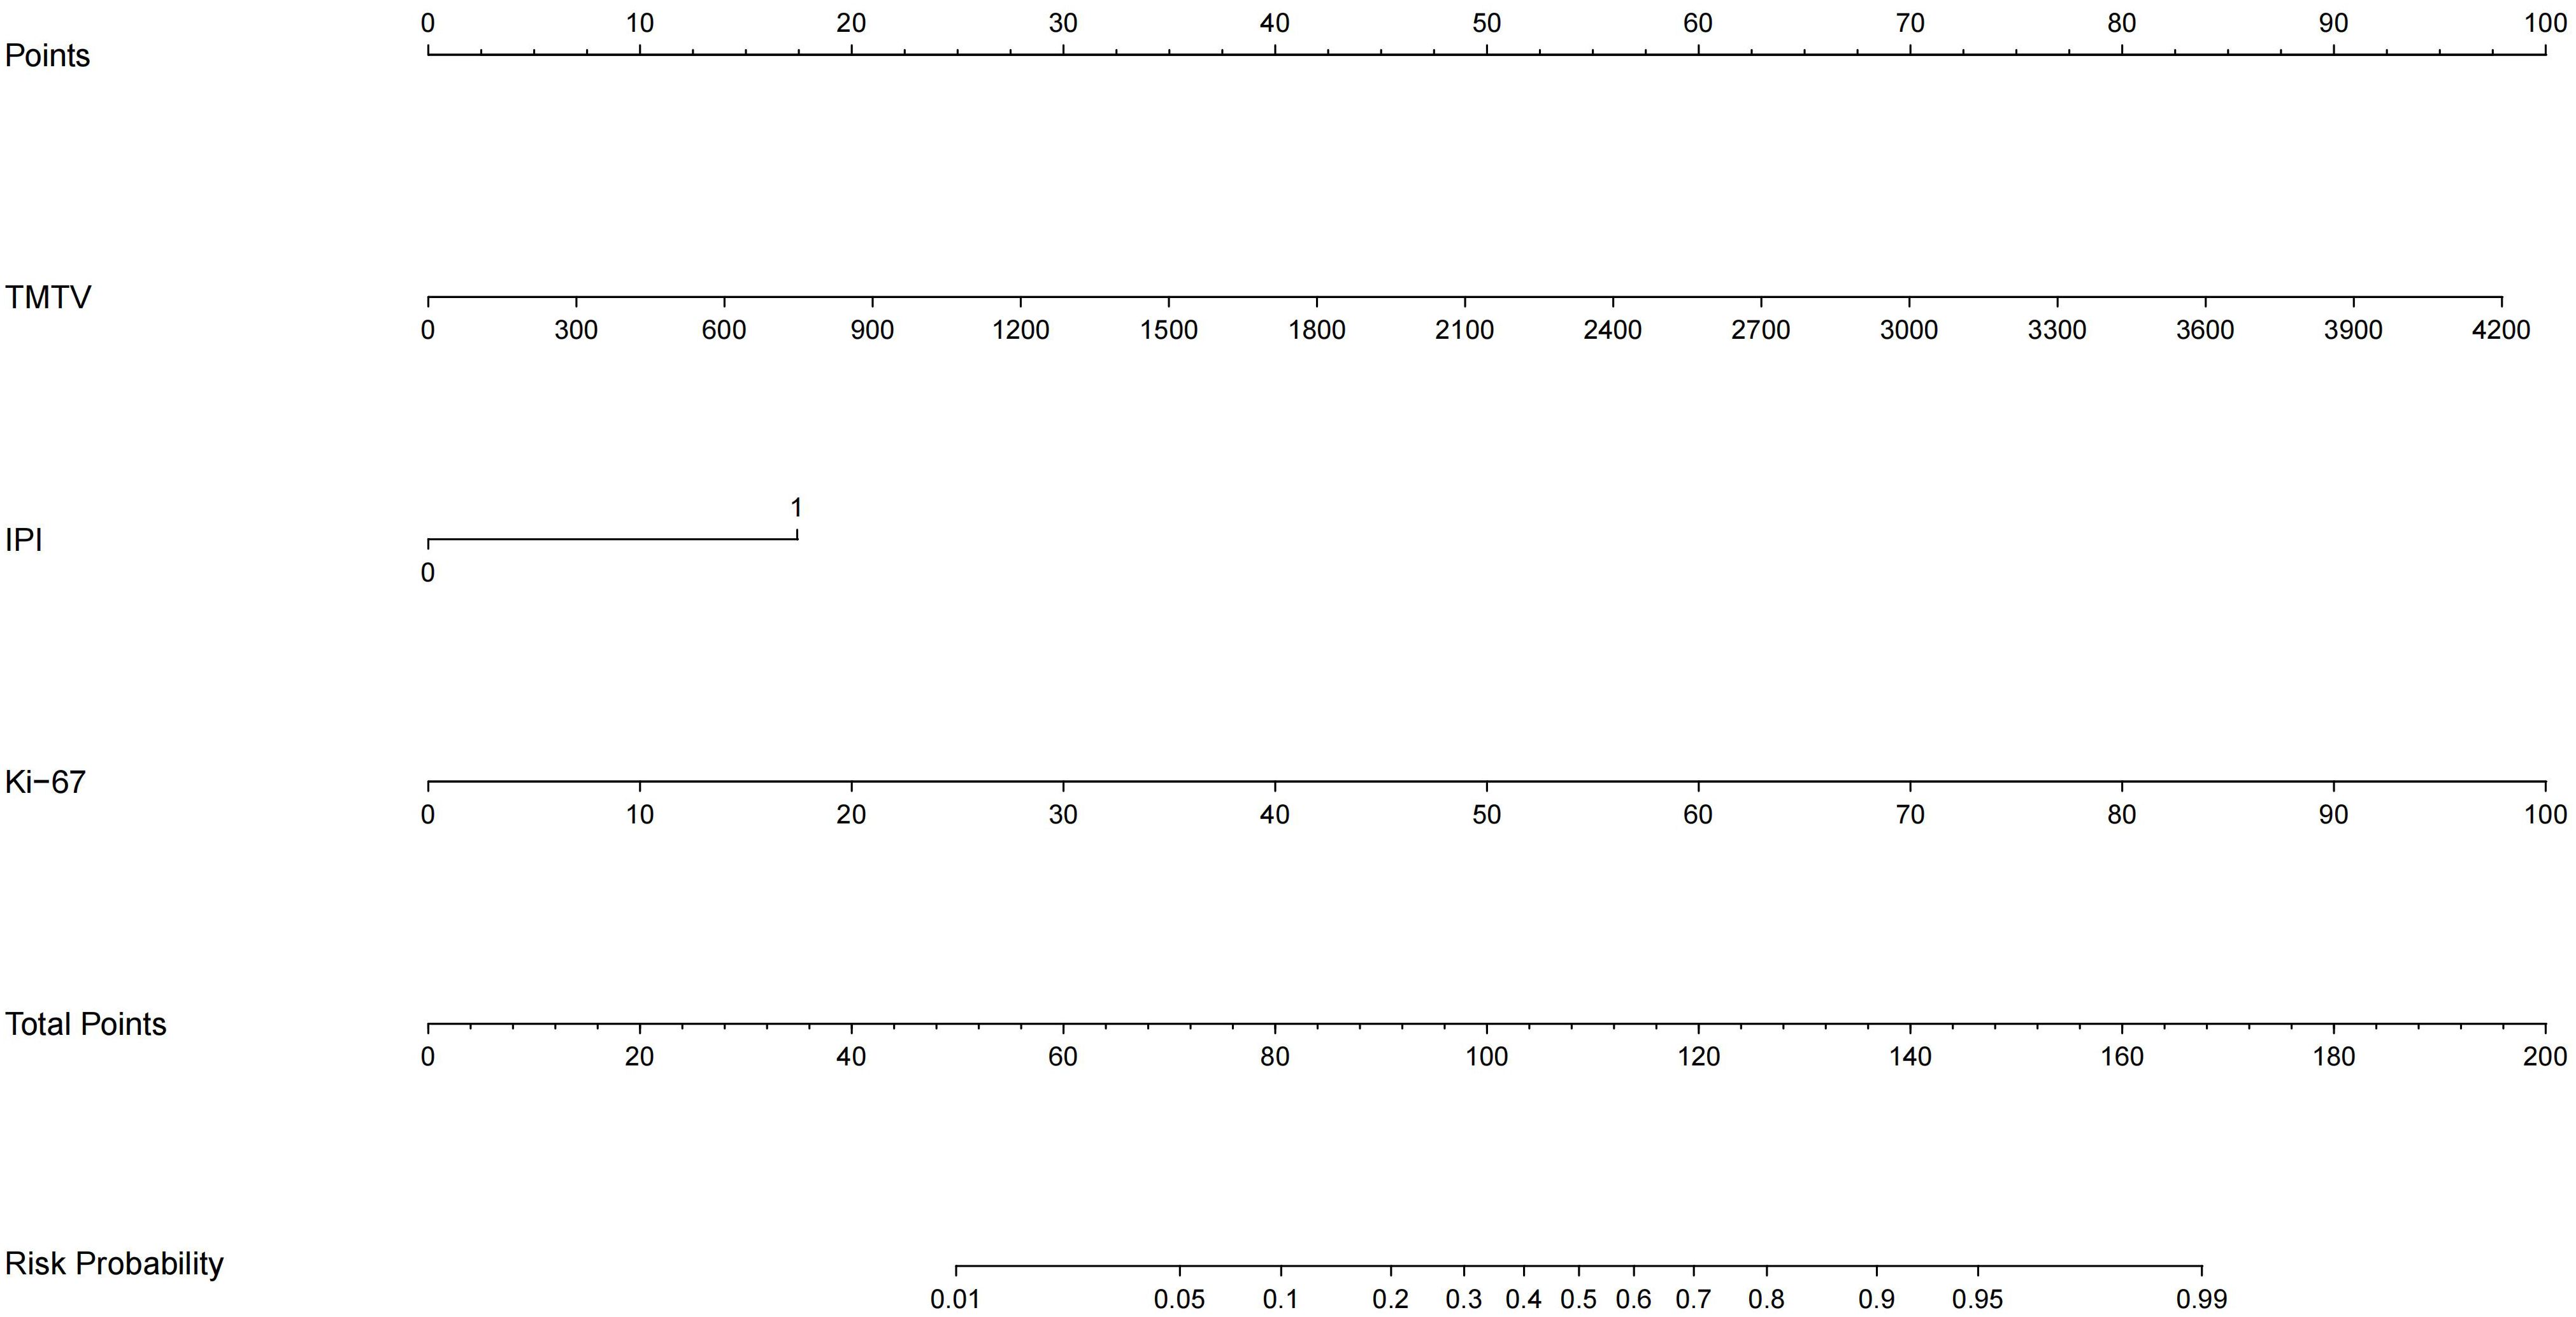
Figure 5. Nomogram of the TMTV+IPI+Ki-67 prediction model. TMTV, total metabolic tumor volume; IPI, International Prognostic Index (0–2, low risk; 3–5, high risk); Ki-67, proliferation index. The weight percentages of each variable are as follows, TMTV, 41.6%, IPI, 15.8%, Ki-67, 42.6%.
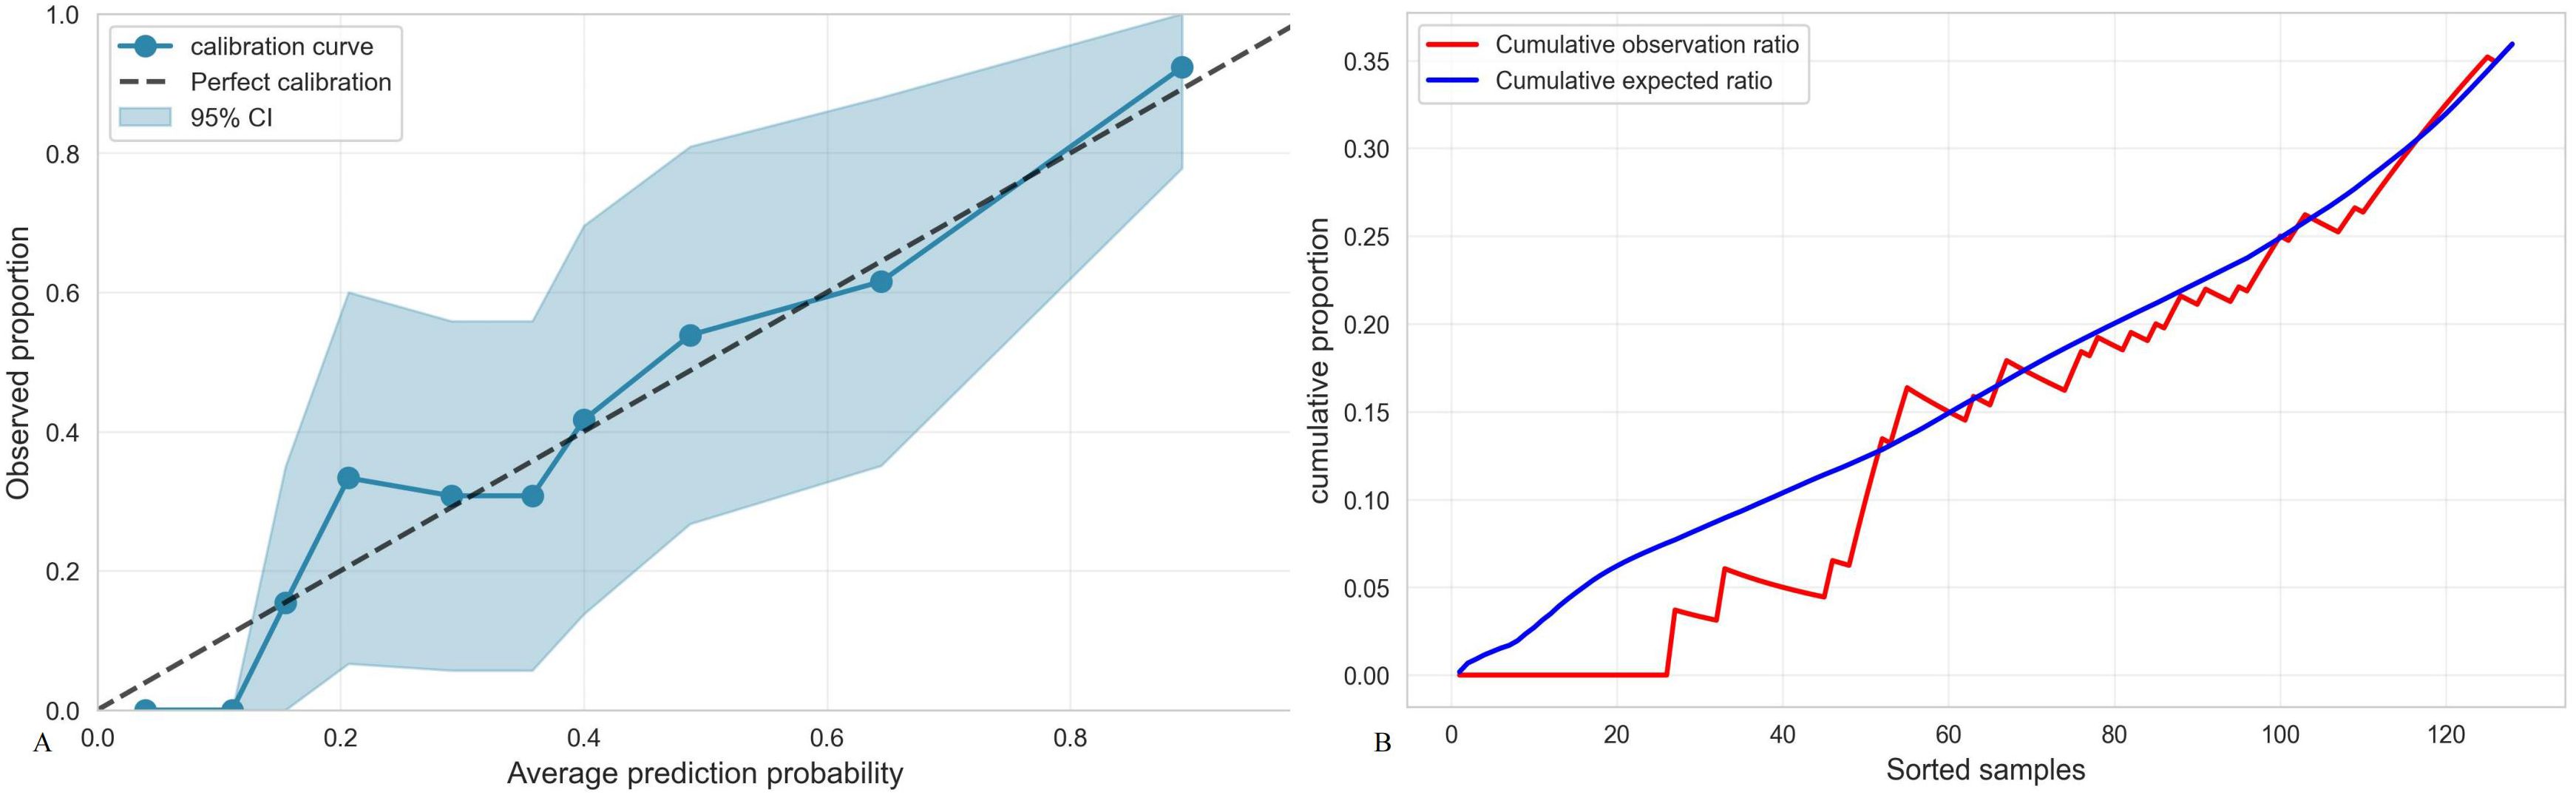
Figure 6. (A) Calibration curve of the TMTV+IPI+Ki-67 model. Brier points, 0.1585, Hosmer–Lemeshow test, 6.241, p = 0.620, Calibration slope, 0.142, Calibration intercept, 0.463, Calibration evaluation, good. (B) Accumulated calibration curve.
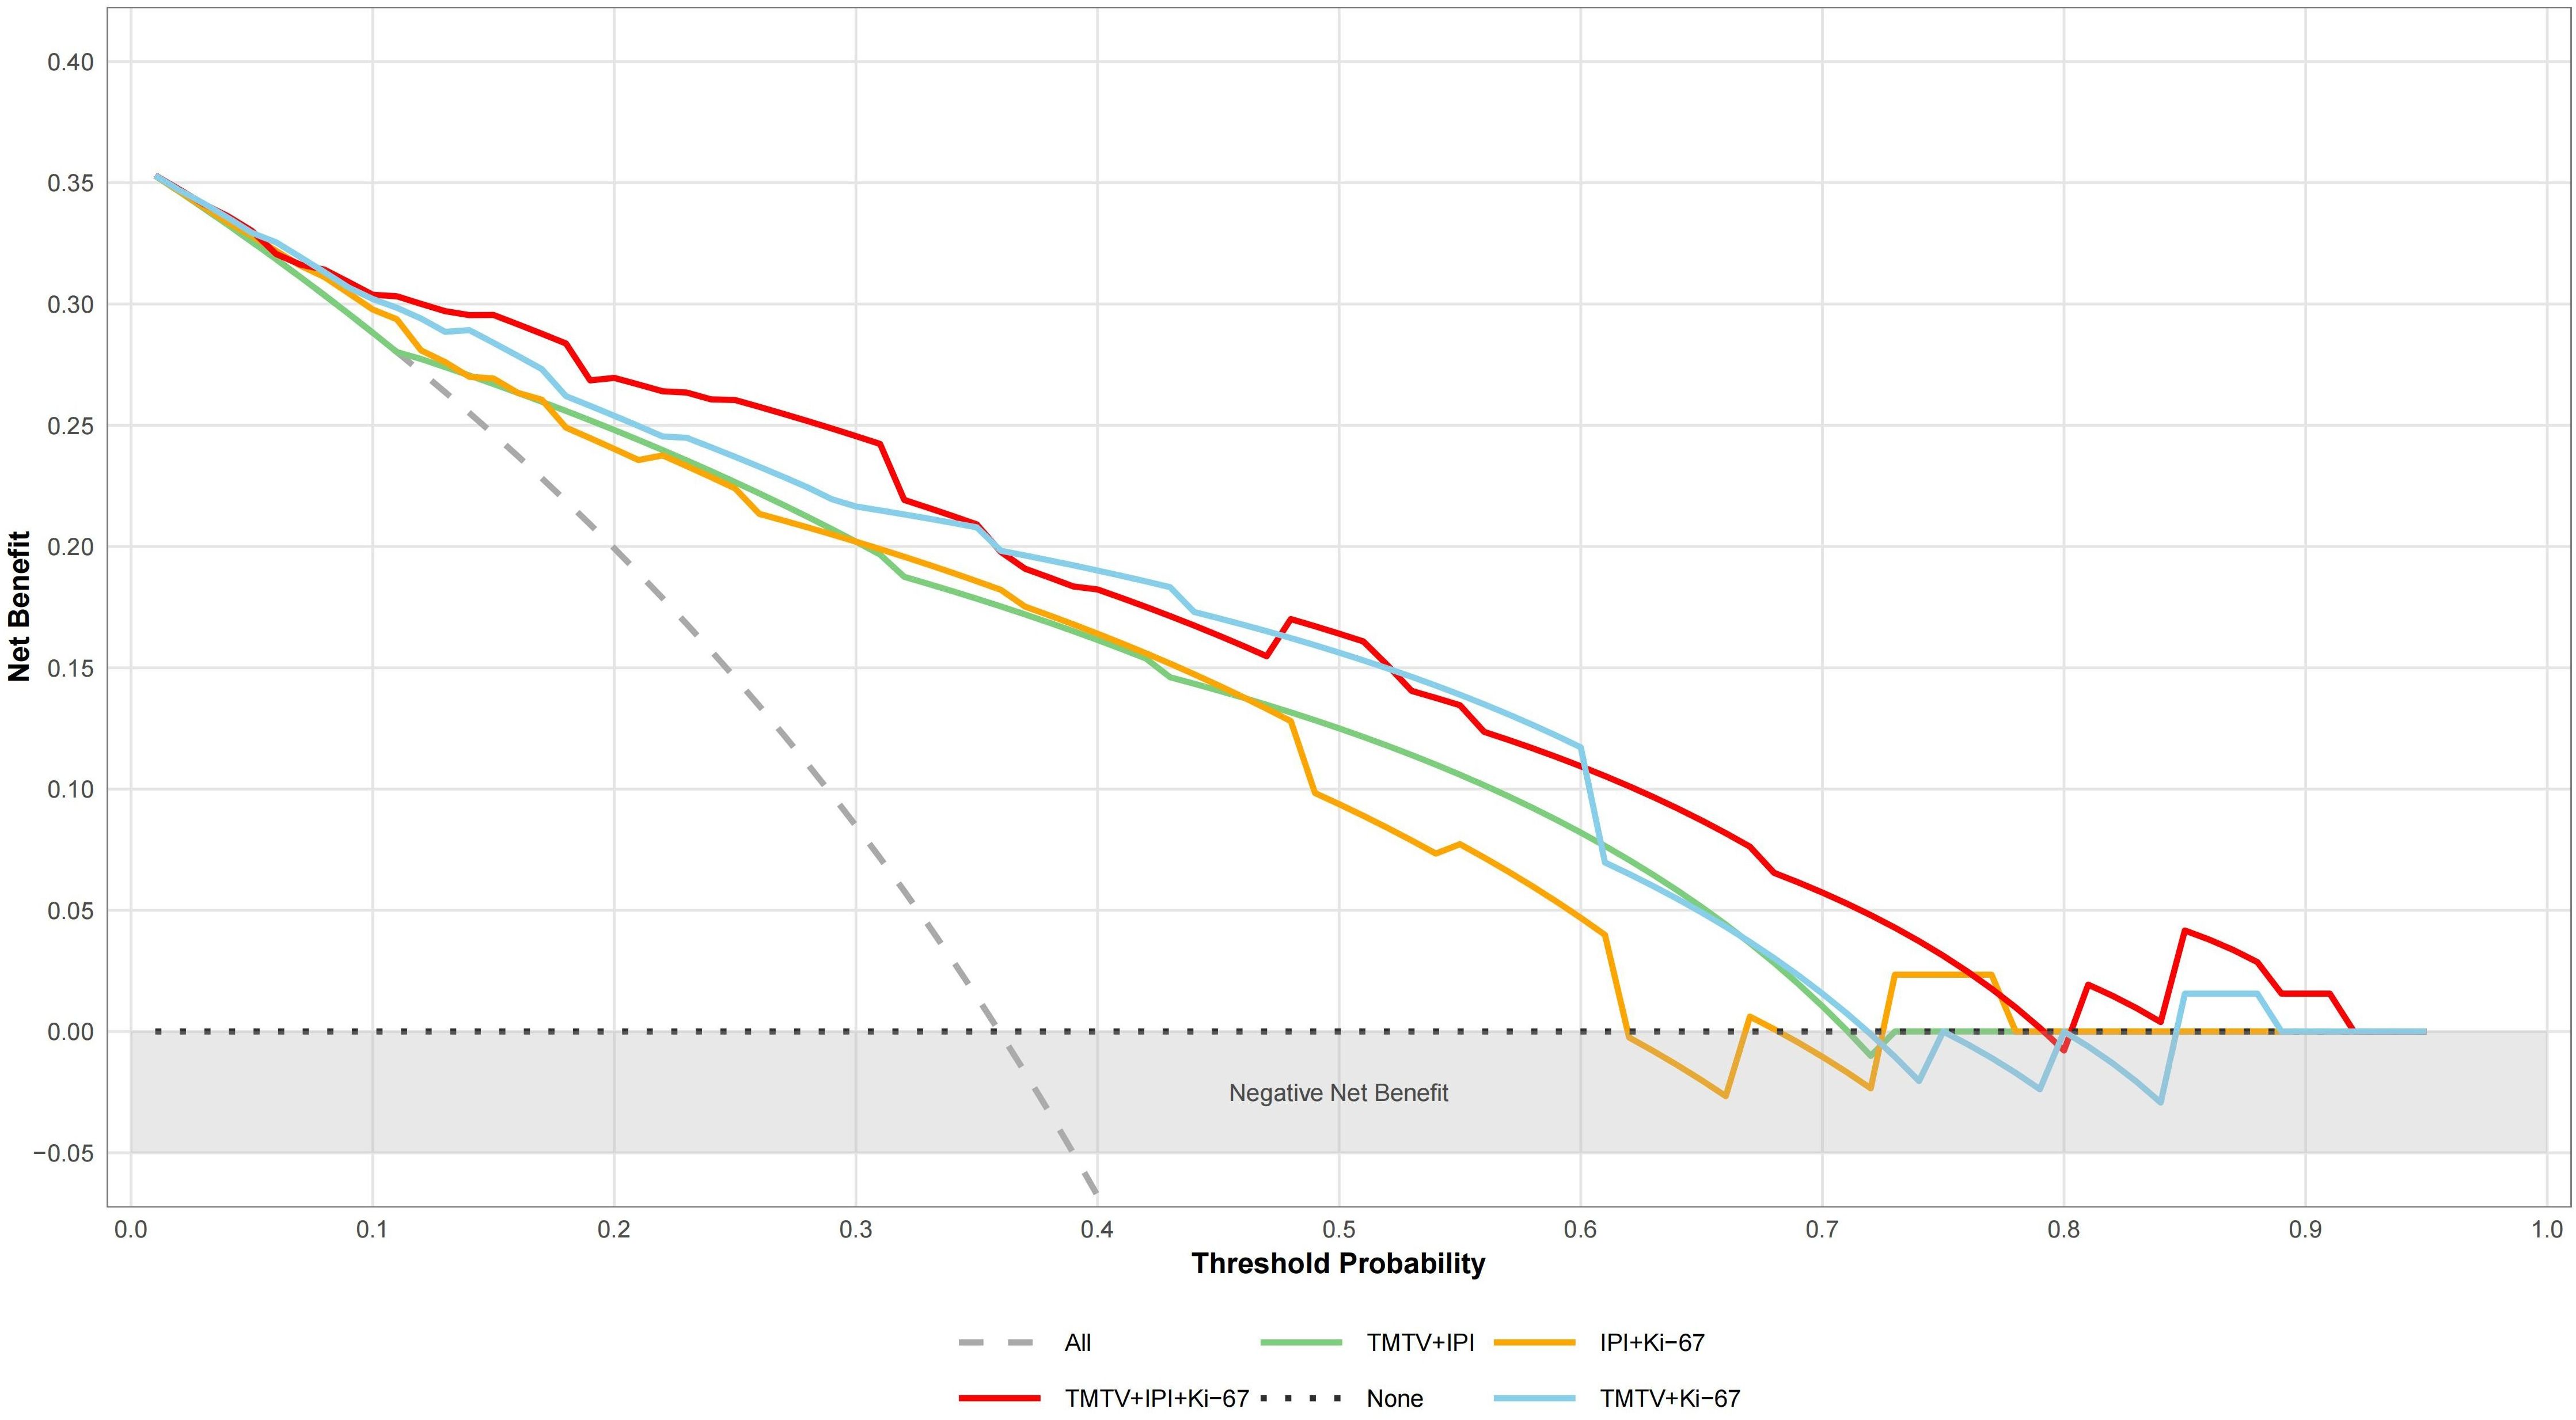
Figure 7. Analysis of decision curves of different DEL prediction models. “All” represents the assumption that treat all; “None” indicates the assumption that treat none. TMTV, total metabolic tumor volume; IPI, International Prognostic Index (0–2, low risk; 3–5, high risk); Ki-67, proliferation index.
Discussion
Currently, lines of evidence indicate that the unique c-Myc/Bcl-2 co-expression signature in DEL synergistically activates the PI3K/AKT/mTOR pathway to drive metabolic reprogramming toward glycolysis. Mechanistically, c-Myc enhances glycolytic flux through upregulation of glucose transporter proteins (GLUTs), while Bcl-2 sustains cell survival by suppressing mitochondrial apoptosis, both collectively maintaining a hypermetabolic state (25–30). Additionally, the Myc-driven Warburg effect leads to lactate accumulation, inducing the formation of an immunosuppressive microenvironment. This is accompanied by abnormal elevation of serum LDH/β2-MG levels, which is associated with therapy resistance (25). This metabolic phenotype is closely correlated with PET/CT metabolic parameters (SUVmax/TMTV/TLG), a high SUVmax indicates increased glucose uptake capacity, while enlarged TMTV/TLG represents the cumulative tumor burden and potential for aggressive dissemination. This study further revealed a strong correlation between TMTV/TLG and LDH/β2-MG in the DEL subgroup. This finding, at the metabolic imaging level, unveils the interplay between metabolic burden and tumor biological activity, providing biological validation for the relevant imaging biomarkers.
Our clinical feature analysis confirmed that DEL patients exhibit a more aggressive biological behavior. Compared to the non-DEL group, DEL patients showed a significantly higher incidence of B symptoms, a greater proportion with IPI ≥ 3, a higher percentage in advanced Ann Arbor stage (III–IV), and a significantly elevated proportion of the non-GCB subtype—consistent with previous studies (5, 6). DEL patients simultaneously exhibited higher levels of Ki-67, LDH, and β2-MG, along with significantly increased SUVmax, TMTV, and TLG. We observed significant positive correlations between metabolic parameters (SUVmax/TMTV/TLG) and IPI, Ann Arbor stage, β2-MG, and LDH, validating that DEL embodies the biological essence of both high metabolic burden and strong proliferative activity.
Ki-67, a nuclear protein involved in cell proliferation regulation, is widely utilized as a biomarker for assessing proliferative activity in lymphoma. Counterintuitively, this study observed that Ki-67 in DEL patients demonstrated a statistically significant association only with extranodal site, while showing no statistically significant correlation with the IPI or metabolic parameters (SUVmax/TMTV/TLG). However, multivariate logistic regression analysis definitively confirmed Ki-67 as an independent predictor of DEL. This phenomenon may be partially attributable to limited sample size, but the more critical underlying mechanism likely involves c-Myc/Bcl-2-driven metabolic reprogramming potentially operating partially independent of proliferation regulation pathways—meaning the tumor cells’ survival advantage may be preferentially achieved through energy metabolism pathways, where proliferative activity in specific DEL subtypes could be masked by metabolic dysregulation. Precisely because of the biological distinctiveness and complementarity between the proliferative potential reflected by Ki-67, the metabolic burden quantified by TMTV, and the clinical status assessed by IPI, these three factors contribute unique incremental value in the combined predictive model. The controversy regarding Ki-67’s correlations in lymphoma research (31–33) further highlights the limitations of traditional single indicators, strongly underscoring the necessity for multimodal predictive models.
While the IPI remains a widely used risk stratification tool for lymphoma patients (34), its reliance on static clinical parameters, such as age and disease stage, fails to capture the dynamic metabolic characteristics of DEL. Ruppert et al. (35) have proposed integrating additional molecular markers to refine risk stratification. In contrast, TMTV quantifies metabolically active tumor burden, enabling longitudinal tracking of disease progression and systemic tumor load with temporal resolution.
This study identified TMTV > 510.22 cm³ as an independent predictor of DEL. While prior studies established MTV thresholds for survival prognostication (17, 18), our work extends TMTV’s utility to DEL phenotype prediction—a distinct clinical context requiring phenotype-specific stratification. TMTV’s role as a volumetric biomarker of tumor burden conceptually aligns with its established value in DLBCL aggressiveness, operationalized here for molecular subtyping. Specifically, Eertink et al. (17) and Ceriani et al. (36) demonstrated that integration of TMTV significantly enhanced the discriminatory capacity of risk stratification models. These findings collectively support the critical role of baseline PET/CT metabolic parameters, particularly TMTV, in compensating for the deficiencies of traditional clinical indicators.
This study has the following limitations. First, as a retrospective single-center study, it may be inherently susceptible to selection bias. For example, the proportion of DEL patients in this study cohort was 35.9% (46/128), which is slightly elevated compared to the commonly reported range of 20%–30% in newly diagnosed DLBCL cases (2, 3). This discrepancy may stem from patient selection criteria or potential geographic/ethnic factors. Importantly, despite this proportional difference, the DEL group exhibited highly aggressive clinicopathological features and enhanced metabolic activity, findings that closely align with previous reports on DEL (4–6). This consistency supports the robustness of DEL subgroup identification in this cohort. Second, the limited sample size (n = 128) and reliance solely on internal evaluation without external independent cohort validation or rigorous internal cross-validation may compromise the assessment of model generalizability and reduce the statistical power of subgroup analyses. Finally, this study utilized 18F-FDG, the current standard for DLBCL metabolic imaging. Future research could explore novel tracers like 18F-FAPI for specific biological niches—particularly fibroblast-rich microenvironments or FDG-avid lesions where dual-tracer imaging may elucidate stromal contributions to treatment resistance. Such mechanistic studies would complement (rather than replace) FDG-based diagnostic paradigms (37). Future research will require prospective, multicenter, large-sample cohort studies, coupled with independent external validation, to more accurately define the epidemiological characteristics and predictive factors of DEL, and to validate the robustness and clinical applicability of this combined predictive model.
The combined predictive model developed in this study significantly enhanced the early identification of DEL in internal validation, outperforming conventional clinical stratification approaches. This multidimensional model not only provides a novel strategy for the non-invasive screening of treatment-naïve patients most likely to benefit from targeted intensified therapy, but also underscores the superior clinical utility of TMTV compared to conventional SUVmax. While calibration deviations occur and clinical applicability requires further prospective validation, the model exhibits significant potential for precise identification of high-risk DEL patients during therapeutic decision-making, thereby optimizing individualized treatment strategies. In summary, this model is readily implementable in hospitals with PET/CT capabilities and standard DLBCL diagnostic workflows. Multi-center validation (planned) will further establish generalizability.
Data availability statement
The original contributions presented in the study are included in the article/supplementary material. Further inquiries can be directed to the corresponding authors.
Ethics statement
The studies involving humans were approved by Ethics Committee of Northern Theater Command General Hospital. The studies were conducted in accordance with the local legislation and institutional requirements. Written informed consent for participation was not required from the participants or the participants’ legal guardians/next of kin in accordance with the national legislation and institutional requirements.
Author contributions
JL: Writing – original draft, Writing – review & editing, Conceptualization, Formal Analysis, Validation. GL: Writing – original draft, Writing – review & editing, Conceptualization, Formal Analysis, Validation. QP: Data curation, Writing – review & editing. JW: Supervision, Writing – review & editing. GZ: Conceptualization, Formal Analysis, Funding acquisition, Project administration, Supervision, Writing – original draft, Writing – review & editing.
Funding
The author(s) declare financial support was received for the research and/or publication of this article. This work was partially supported by grants from The Research Program of General hospital of Northern Theater Command, New Grant Number: ZZKY2024001.
Conflict of interest
The authors declare that the research was conducted in the absence of any commercial or financial relationships that could be construed as a potential conflict of interest.
Generative AI statement
The author(s) declare that no Generative AI was used in the creation of this manuscript.
Any alternative text (alt text) provided alongside figures in this article has been generated by Frontiers with the support of artificial intelligence and reasonable efforts have been made to ensure accuracy, including review by the authors wherever possible. If you identify any issues, please contact us.
Publisher’s note
All claims expressed in this article are solely those of the authors and do not necessarily represent those of their affiliated organizations, or those of the publisher, the editors and the reviewers. Any product that may be evaluated in this article, or claim that may be made by its manufacturer, is not guaranteed or endorsed by the publisher.
References
1. Shi Y, Qing Y, Chen H, Tao Y, Chen X, Xie Z, et al. Clinical practice guideline for lymphoma in China(2023 version). Chin J Clin Oncol Rehabil. (2023) 30:2–39. doi: 10.13455/j.cnki.cjcor.113494-20230118-0032
2. Swerdlow SH, Campo E, Pileri SA, Harris NL, Stein H, Siebert R, et al. The 2016 revision of the World Health Organization classification of lymphoid neoplasms. Blood. (2016) 127:2375–90. doi: 10.1182/blood-2016-01-643569
3. Campo E, Jaffe ES, Cook JR, Quintanilla-Martinez L, Swerdlow SH, Anderson KC, et al. The international consensus classification of mature lymphoid neoplasms, a report from the clinical advisory committee. Blood. (2022) 140:1229–53. doi: 10.1182/blood.2022015851
4. Kim S, Jeong H, Ahn HK, Han B, Lee K-C, Song YK, et al. Increased CCL2/CCR2 axis promotes tumor progression by increasing M2 macrophages in MYC/BCL2 double-expressor DLBCL. Blood Adv. (2024) 8:5773–88. doi: 10.1182/bloodadvances.2024013699
5. Sung H-J, Kim D, Yoon D-H, Cho H, Huh J, Suh C-W, et al. Clinicopathologic and genetic features of the starry-sky pattern in double-expressor diffuse large B-cell lymphoma. Hum Pathol. (2023) 139:106–16. doi: 10.1016/j.humpath.2023.07.008
6. Rungwittayatiwat S, Boonsakan P, Chantrathammachart P, Puavilai T, Pukiat S, Phusanti S, et al. Treatment outcomes and clinical relevance in patients with double expressor DLBCL. Mediterr J Hematol Infect Dis. (2021) 13:e2021063. doi: 10.4084/MJHID.2021.063
7. Jin J, Wang Y, Wang X, Tang Y, Zeng S, Du J, et al. Zanubrutinib combined with R-CHOP in previously untreated non-germinal center BCell (GCB) diffuse large B-cell lymphoma (DLBCL) patients with BCL2 and MYC protein co-expression, A multicenter, phase II study. BLOOD. (2023) 142:4468. doi: 10.1182/blood-2023-181529
8. Chen X, Xie L, Zhu J, Liang L, Zou B, and Zou L. Real-world efficacy of chidamide plus R-CHOP in newly diagnosed double-expressor diffuse large B-cell lymphoma. Ther Adv Hematol. (2024) 15:20406207241292446. doi: 10.1177/20406207241292446
9. Liu Y, Zhang Q, Lv F, Liu X, Ji D, Xia Z, et al. Lenalidomide combined with R-CHOP (R2-CHOP) in the treatment of newly diagnosed double-expressor diffuse large B-cell lymphoma, a prospective phase II clinical trial. Blood Cancer J. (2025) 15:24. doi: 10.1038/s41408-025-01229-5
10. Wu L-L, Shi L, Li W-J, Liu W, Feng Y, Yin S-N, et al. Efficacy and survival analysis of chidamide combined with DICE regimen in patients with relapsed/refractory diffuse large B-cell lymphoma. Zhongguo Shi Yan Xue Ye Xue Za Zhi. (2025) 33:373–8. doi: 10.19746/j.cnki.issn.1009-2137.2025.02.010
11. Shi Z-Y, Fang Y, Xu P-P, Yi H-M, Li J-F, Dong Y, et al. Molecular heterogeneity of BCL2/MYC double expressor lymphoma underlies sensitivity to histone deacetylase inhibitor. Clin Transl Med. (2024) 14:e1691. doi: 10.1002/ctm2.1691
12. Zelenetz AD, Gordon LI, Abramson JS, Advani RH, Andreadis B, Bartlett NL, et al. NCCN guidelines® Insights, B-cell lymphomas, version 6.2023, featured updates to the NCCN guidelines. J Natl Compr Canc Netw. (2023) 21:1118–31. doi: 10.6004/jnccn.2023.0057
13. Zhao J, Jiang C, Teng Y, Chen M, Ding C, and Xu J. Prognostic predictive value of metabolic parameters of baseline PET/CT in patients with double expression types of diffuse large B-cell lymphoma. Chin J Nucl Med Mol Imaging. (2024) 44:583–7. doi: 10.3760/cma.j.cn321828-20231118-00113
14. Ventura L, Scarlattei M, Gnetti L, Silini EM, Rossi M, Tiseo M, et al. Prognostic value of 18F-FDG PET/CT parameters in surgically resected primary lung adenocarcinoma, a single-center experience. Tumori J. (2020) 106:212–22. doi: 10.1177/0300891620904404
15. Vercellino L, Cottereau A-S, Casasnovas O, Tilly H, Feugier P, Chartier L, et al. High total metabolic tumor volume at baseline predicts survival independent of response to therapy. Blood. (2020) 135:1396–405. doi: 10.1182/blood.2019003526
16. Dührsen U, Müller S, Hertenstein B, Thomssen H, Kotzerke J, Mesters R, et al. Positron emission tomography-guided therapy of aggressive non-hodgkin lymphomas (PETAL), A multicenter, randomized phase III trial. J Clin Oncol. (2018) 36:2024–34. doi: 10.1200/JCO.2017.76.8093
17. Eertink JJ, van de Brug T, Wiegers SE, Zwezerijnen GJC, Pfaehler EAG, Lugtenburg PJ, et al. 18F-FDG PET baseline radiomics features improve the prediction of treatment outcome in diffuse large B-cell lymphoma. Eur J Nucl Med Mol Imaging. (2022) 49:932–42. doi: 10.1007/s00259-021-05480-3
18. Cottereau A-S, Meignan M, Nioche C, Capobianco N, Clerc J, Chartier L, et al. Risk stratification in diffuse large B-cell lymphoma using lesion dissemination and metabolic tumor burden calculated from baseline PET/CT. Ann Oncol. (2021) 32:404–11. doi: 10.1016/j.annonc.2020.11.019
19. Dong J and Sang S. Clinical prognostic value of PET/CT in diffuse large B-cell lymphoma with different B-cell lymphoma-2,B-cell lymphoma-6 and myelocytomatosis oncogene protein expression. Chin J Med Imaging. (2023) 31:833–837 + 843. doi: 10.3760/cma.j.issn.1673-4114.2020.02.005
20. Ferreri AJM, Calimeri T, Cwynarski K, Dietrich J, Grommes C, Hoang-Xuan K, et al. Primary central nervous system lymphoma. Nat Rev Dis Primer. (2023) 9:29. doi: 10.1038/s41572-023-00439-0
21. Nioche C, Orlhac F, Boughdad S, Reuzé S, Goya-Outi J, Robert C, et al. LIFEx, A freeware for radiomic feature calculation in multimodality imaging to accelerate advances in the characterization of tumor heterogeneity. Cancer Res. (2018) 78:4786–9. doi: 10.1158/0008-5472.CAN-18-0125
22. Barrington SF, Zwezerijnen BGJC, de Vet HCW, Heymans MW, Mikhaeel NG, Burggraaff CN, et al. Automated segmentation of baseline metabolic total tumor burden in diffuse large B-cell lymphoma, which method is most successful? A study on behalf of the PETRA consortium. J Nucl Med. (2021) 62:332–7. doi: 10.2967/jnumed.119.238923
23. Zwezerijnen GJC, Eertink JJ, Burggraaff CN, Wiegers SE, Shaban EAIN, Pieplenbosch S, et al. Interobserver agreement on automated metabolic tumor volume measurements of deauville score 4 and 5 lesions at interim 18F-FDG PET in diffuse large B-cell lymphoma. J Nucl Med. (2021) 62:1531–6. doi: 10.2967/jnumed.120.258673
24. Driessen J, Zwezerijnen GJC, Schöder H, Drees EEE, Kersten MJ, Moskowitz AJ, et al. The impact of semiautomatic segmentation methods on metabolic tumor volume, intensity, and dissemination radiomics in 18F-FDG PET scans of patients with classical hodgkin lymphoma. J Nucl Med. (2022) 63:1424–30. doi: 10.2967/jnumed.121.263067
25. Pi M, Kuang H, Yue C, Yang Q, Wu A, Li Y, et al. Targeting metabolism to overcome cancer drug resistance, A promising therapeutic strategy for diffuse large B cell lymphoma. Drug Resist Update. (2022) 61:100822. doi: 10.1016/j.drup.2022.100822
26. Wiese W, Barczuk J, Racinska O, Siwecka N, Rozpedek-Kaminska W, Slupianek A, et al. PI3K/akt/mTOR signaling pathway in blood Malignancies-new therapeutic possibilities. Cancers. (2023) 15:5297. doi: 10.3390/cancers15215297
27. Afonso J, Pinto T, Simoes-Sousa S, Schmitt F, Longatto-Filho A, Pinheiro C, et al. Clinical significance of metabolism-related biomarkers in non-Hodgkin lymphoma-MCT1 as potential target in diffuse large B cell lymphoma. Cell Oncol. (2019) 42:303–18. doi: 10.1007/s13402-019-00426-2
28. Xu Y, Zhou X, Zhang S, Nanding A, and Xuan Q. Expression and prognostic value of glucose transporter 3 in diffuse large B cell lymphoma. Oncotargets Ther. (2022) 15:181–91. doi: 10.2147/OTT.S338826
29. Chaba A, Fodil S, Lemiale V, Mariotte E, Valade S, Azoulay E, et al. Clinical Warburg effect in lymphoma patients admitted to intensive care unit. Ann Intensive Care. (2023) 13:97. doi: 10.1186/s13613-023-01192-z
30. Wu Y-F, Yuan Q-H, Shen H-R, Du K-X, Shang C-Y, Li Y, et al. The prognostic significance of MYC/BCL2 double expression in DLBCL in the genetic classification era. Cancer Sci. (2025) 116:257–70. doi: 10.1111/cas.16377
31. Huber F, Zwickl-Traxler E, Pecherstorfer M, and Singer J. Evaluation of ki-67 as a prognostic marker in diffuse large B-cell lymphoma-A single-center retrospective cohort study. Curr Oncol Tor Ont. (2021) 28:4521–9. doi: 10.3390/curroncol28060383
32. Zhao J and Wang H. Correlation between 18F-FDG PET/CT semiquantitative parameters and Ki-67 expression in pulmonary mucosa-associated lymphoid tissue lymphoma. J Med Imaging Radiat Oncol. (2021) 65:188–94. doi: 10.1111/1754-9485.13146
33. Hashmi AA, Iftikhar SN, Nargus G, Ahmed O, Asghar IA, Shirazi UA, et al. Ki67 proliferation index in germinal and non-germinal subtypes of diffuse large B-cell lymphoma. Cureus. (2021) 13:e13120. doi: 10.7759/cureus.13120
34. Gleeson M, Counsell N, Cunningham D, Lawrie A, Clifton-Hadley L, Hawkes E, et al. Prognostic indices in diffuse large B-cell lymphoma in the rituximab era, an analysis of the UK National Cancer Research Institute R-CHOP 14 versus 21 phase 3 trial. Br J Haematol. (2021) 192:1015–9. doi: 10.1111/bjh.16691
35. Ruppert AS, Dixon JG, Salles G, Wall A, Cunningham D, Poeschel V, et al. International prognostic indices in diffuse large B-cell lymphoma, a comparison of IPI, R-IPI, and NCCN-IPI. Blood. (2020) 135:2041–8. doi: 10.1182/blood.2019002729
36. Ceriani L, Gritti G, Cascione L, Pirosa MC, Polino A, Ruberto T, et al. SAKK38/07 study, integration of baseline metabolic heterogeneity and metabolic tumor volume in DLBCL prognostic model. Blood Adv. (2020) 4:1082–92. doi: 10.1182/bloodadvances.2019001201
Keywords: diffuse large B-cell lymphoma, double-expression lymphoma, 18F-FDG PET/CT, c-Myc, Bcl-2, predictive model
Citation: Liang J, Lu G, Peng Q, Wang J and Zhang G (2025) Baseline PET/CT metabolic parameters in the double-expressor subtype of diffuse large B-cell lymphoma: development of a clinical–radiologic–pathologic predictive model. Front. Oncol. 15:1660516. doi: 10.3389/fonc.2025.1660516
Received: 07 July 2025; Accepted: 14 November 2025; Revised: 01 October 2025;
Published: 28 November 2025.
Edited by:
Sharon R. Pine, University of Colorado Anschutz Medical Campus, United StatesReviewed by:
Edel Noriega-Álvarez, University Hospital of Guadalajara, SpainEdiz Beyhan, TC Saglik Bakanligi Sirnak Devlet Hastanesi, Türkiye
Copyright © 2025 Liang, Lu, Peng, Wang and Zhang. This is an open-access article distributed under the terms of the Creative Commons Attribution License (CC BY). The use, distribution or reproduction in other forums is permitted, provided the original author(s) and the copyright owner(s) are credited and that the original publication in this journal is cited, in accordance with accepted academic practice. No use, distribution or reproduction is permitted which does not comply with these terms.
*Correspondence: Jigang Wang, eW5qZ193QDE2My5jb20=; Guoxu Zhang, emhhbmdndW94dV81MDJAMTYzLmNvbQ==
†These authors have contributed equally to this work