 Yan qiao Wu
 Lei Yang
 Depeng Jiang
- Department of Respiratory Medicine, The Second Affiliated Hospital of Chongqing Medical University, Chongqing, China
Background: The impact of obesity on gene mutations in lung adenocarcinoma(ADC) remains unclear. This study investigates the association between Body Mass Index(BMI) and the gene mutation in ADC.
Methods: This study investigated the relationship between BMI and ADC gene mutation. Logistic regression model was used to verify the association between BMI and ADC gene mutations. Threshold effect analysis is used to distinguish between linear and nonlinear. Subgroup analyses rigorously assessed demographic variations, significantly strengthening the study’s credibility. Concurrently, the ROC curves were utilized to predict ADC gene mutation.
Results: In our study, average ages of 66.00 vs. 65.00 were observed for ADC with gene mutation and ADC without gene mutation, respectively. After adjusting for covariates, a significant negative association emerged between BMI and ADC gene mutation, revealing a linear association(OR = 0.820, 95% CI: 0.680-0.982, p = 0.030). ROC curve analysis demonstrated AUC values of 0.533(all BMI) and 0.625(Q2, 21.08 ≤ BMI < 22.86kg/m2) for predicting tumor gene mutation. Spearman’s analysis further indicated a negative correlation between tumor gene mutations and BMI(Q2, OR= -0.215, p = 0.032). Patients younger than 60 years of age, women and those without a history of smoking and drinking had a relatively high rate of ADC gene mutations.
Conclusion: This study reveals a significant association between BMI and ADC gene mutations, demonstrating that elevated BMI levels correlate negatively with mutation risk within the specific range of 21.08 to 22.86 kg/m². Furthermore, the rate of gene mutation may be relatively high in women under the age of 60 who do not smoke or drink. This study may assist clinicians in preliminarily assessing the gene mutation status of patients with ADC.
1 Introduction
Overweight and obesity constitute a major public health emergency, presenting a grave and imminent threat to global health progress. In 2021 alone, these conditions contributed to 71 million deaths and 129 million disability-adjusted life years (DALYs). Over the past two decades, the global age-standardized DALY rates linked to overweight and obesity have risen by more than 15%, making them one of the foremost risk factors and showcasing the steepest increase in disease burden attributable to any cause (1, 2).
Lung cancer is the most common malignancy worldwide, with an estimated 2.48 million new cases and 1.82 million deaths reported globally in 2022. By 2050, projections suggest that China alone will see approximately 1.12 million new cases and 960,000 deaths among males, alongside 680,000 new cases and 450,000 deaths among females (3, 4). Non-small cell lung cancer (NSCLC) accounts for roughly 85% of all lung cancers, with EGFR mutations occurring in 40% to 60% of Asian patients diagnosed with ADC (5).
Obesity is closely linked to tumor development, with cancer cases attributed to obesity projected to surpass 2 million globally by 2070, accounting for 7% of all cancer cases (6). Another study have demonstrated that the obesity-related gene ABCC8 may promote the development of hepatocellular carcinoma (HCC) (7). However, previous studies analyzing molecular data from human and mouse samples revealed that obesity-induced microenvironmental changes, rather than novel driver gene mutations, drive the progression of pancreatic ductal ADC (8). A critical discovery was the remarkable adaptation of islet cells within tumors associated with obesity. Moreover, the tumor microenvironment plays a key role in the development and progression of tumors, and its interaction with genetic mutations directly affects the invasiveness and metastatic potential of the tumor (9–11). Microenvironmental factors are universal across various types of tumors (12–14). In ADC, microenvironmental components such as immune cell infiltration, angiogenesis, and extracellular matrix remodeling often synergize with specific mutations to exacerbate the malignant phenotype of the tumor (15, 16).
However, research on the link between obesity and the gene mutation rate in ADC remains limited. The main goal of this study is to comprehensively investigate the relationship between obesity and gene mutation rate in ADC patients. To achieve this objective, genetic testing data from 404 clinically confirmed ADC cases were analyzed. The results indicate that higher BMI levels are associated with a reduced likelihood of gene mutations. This research is expected to offer new insights and potential avenues for future research into tumor gene mutations.
2 Materials and methods
2.1 Research participants
A retrospective, single-center study was conducted on patients diagnosed with ADC at the Second Affiliated Hospital of Chongqing Medical University from 2016 to 2024. The inclusion criteria required participants to be aged 18 years or older, have a pathologically confirmed ADC diagnosis, and have undergone complete tumor genomic profiling. Patients under 18 years of age or with incomplete genomic profiling results were excluded. The detailed selection process is presented in Figure 1. Relevant clinical data were systematically extracted from comprehensive electronic medical records.
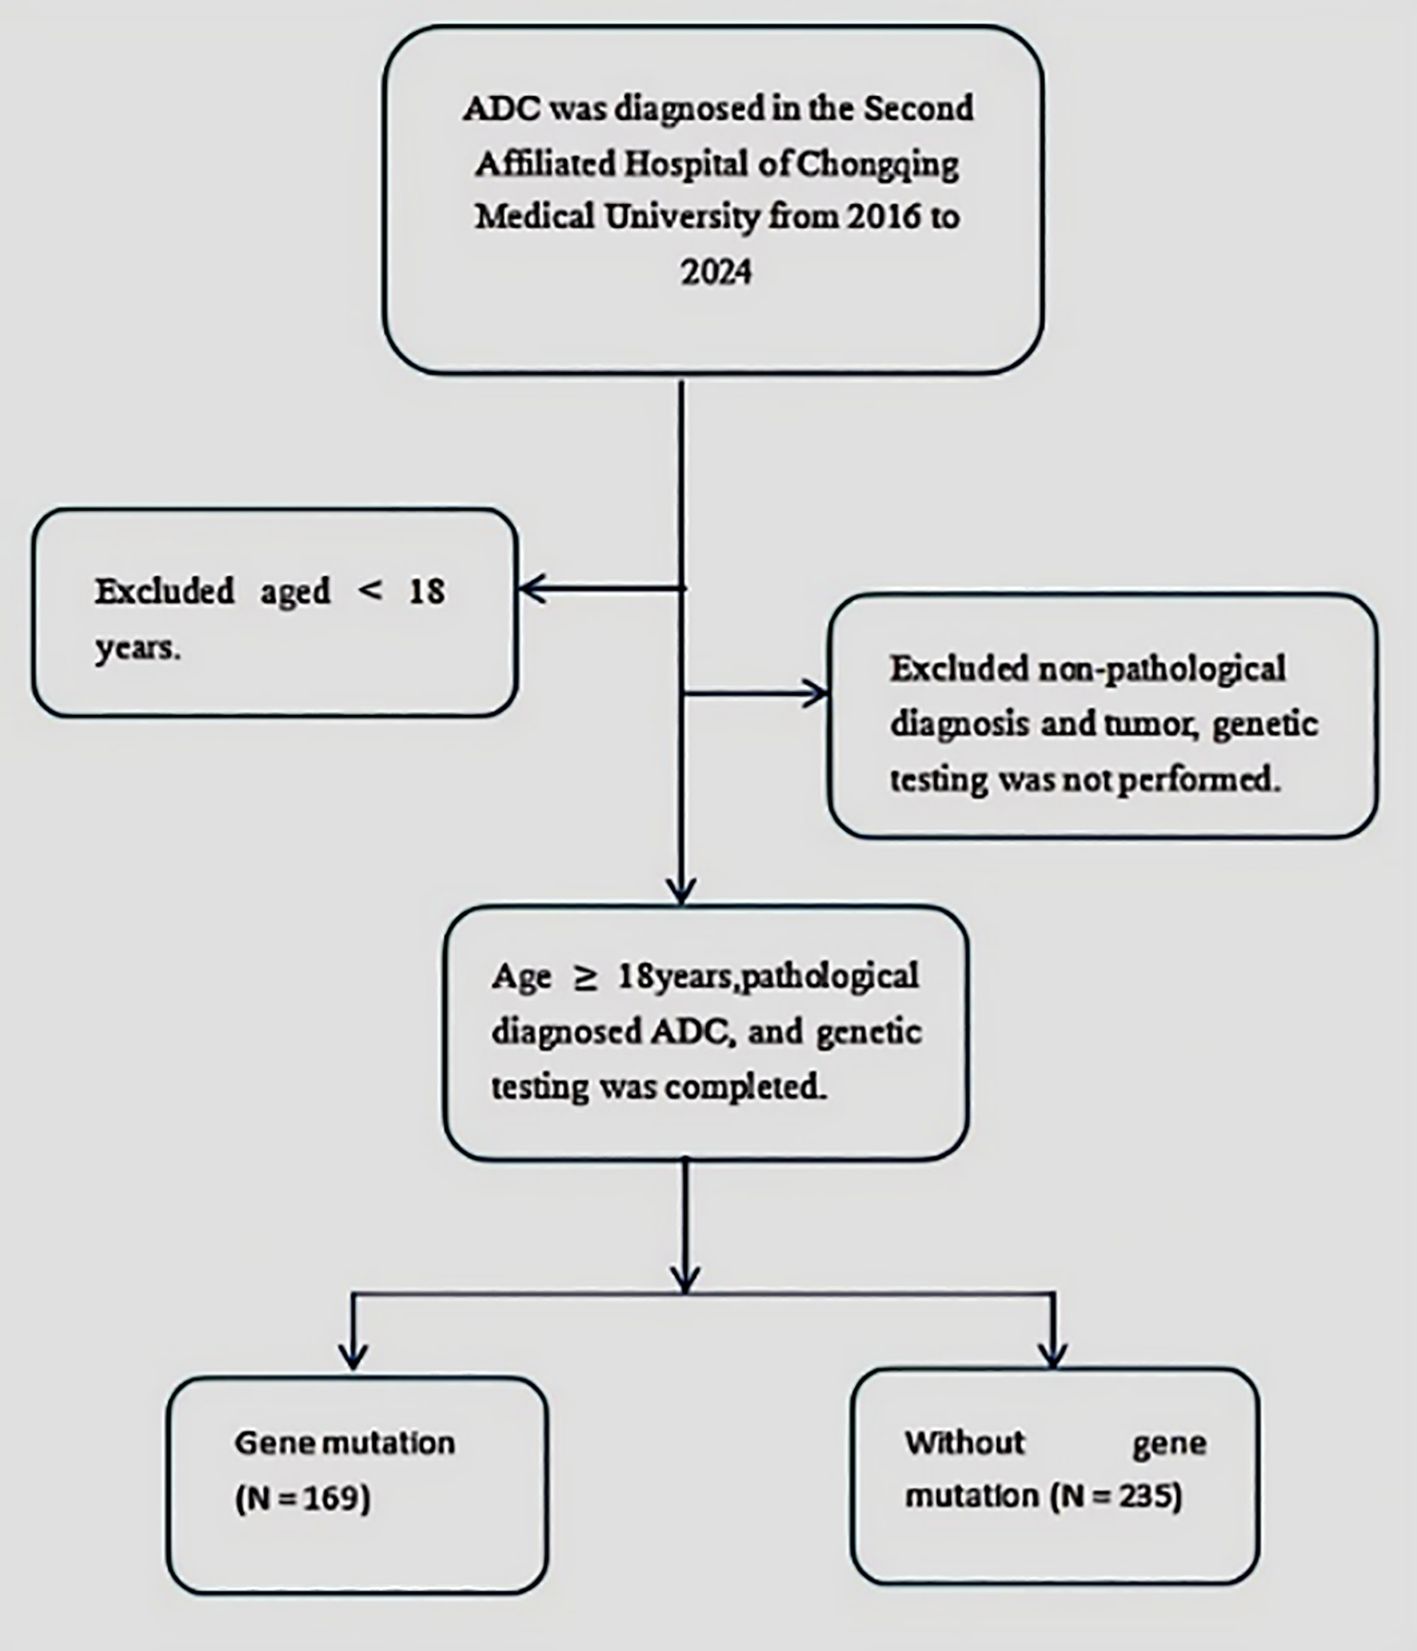
Figure 1. Flowchart illustrating the process of participant selection. ADC, Adenocarcinoma.
2.2 ADC gene testing
For tumor mutation gene detection, all participants underwent Next Generation Sequencing (NGS), with all analyses conducted in laboratories within China. Whole-exome NGS DNA libraries were prepared using the NEBNext® Ultra™ DNA Library Prep Kit in combination with the TruSeq Exome Enrichment kit, strictly following the manufacturer’s protocols. For targeted gene sequencing, a comprehensive panel covering 565 tumor-related genes was employed, utilizing TruSeq Custom Enrichment kits. Sequencing was performed on the high-throughput HiSeq X TEN platform. Raw sequencing data were processed with cutadapt to remove adapter sequences, and high-quality reads were accurately aligned to the human reference genome (hg19) using BWA (17). Somatic mutations were detected using MuTect, with high-confidence somatic SNVs identified based on stringent criteria (18). CNVs for each tumor sample were precisely assessed using ADTEx (19). Gene Ontology (GO) and Kyoto Encyclopedia of Genes and Genomes (KEGG) pathway enrichment analyses of the mutated genes were performed using KOBAS (20), with enriched terms defined as those with a False Discovery Rate (FDR) below 0.01. This study focused specifically on mutations in common genes, including Epidermal Growth Factor Receptor (EGFR), Kirsten Rat Sarcoma Viral Oncogene Homolog (KRAS), Tumor Protein p53(TP53), Anaplastic Lymphoma Kinase (ALK), Mesenchymal-Epithelial Transition factor (MET), and V-raf Murine Sarcoma Viral Oncogene Homolog B1 (BRAF).
2.3 Statistical methods
For ordinal variables, the median was used as the measure of central tendency. For non-normally distributed categorical variables, the Chi-square test or Fisher’s exact test was primarily applied, depending on the data structure. Qualitative parameters were analyzed using the Chi-square test, while quantitative data were assessed via ANOVA. To evaluate the association between BMI and ADC gene mutations, Multivariable Logit Models (I, II, III) were employed to calculate the odds ratio (OR) and 95% confidence interval (CI). Model I was unadjusted; Model II adjusted for age and sex; and Model III included additional adjustments for age, sex, smoking history, drinking history, hemoglobin, white blood cell count, platelet count, aspartate transaminase, alanine aminotransferase, creatinine, carcinoembryonic antigen, cytokeratin fragment 19, neuron-specific enolase, tumor location, and tumor type. The Spearman correlation test was used to assess the relationship between BMI and gene mutations. All statistical analyses were conducted using IBM SPSS (version 26; Armonk, NY), R 4.2.2, and Empowerstats 2.0 software, with GraphPad Prism (version 9.5.1) utilized for data visualization. Statistical significance was defined as a p-value < 0.05.
3 Results
3.1 General situation and basic characteristics
This study included 404 cases, comprising 235 with ADC gene mutations and 169 without. Notable differences between the mutated and non-mutated groups were observed for several variables: NSE levels (15.09 vs. 13.50, p = 0.024), gender distribution (69.82% vs. 48.09%, p < 0.001), smoking history (53.25% vs. 38.30%, p = 0.003), drinking history (36.69% vs. 26.38%, p = 0.027), nodule characteristics (73.37% vs. 84.26%, p = 0.009), and clinical stage (18.34% vs. 3.83%, p < 0.001). No significant differences were found for the other variables, as detailed in Table 1.
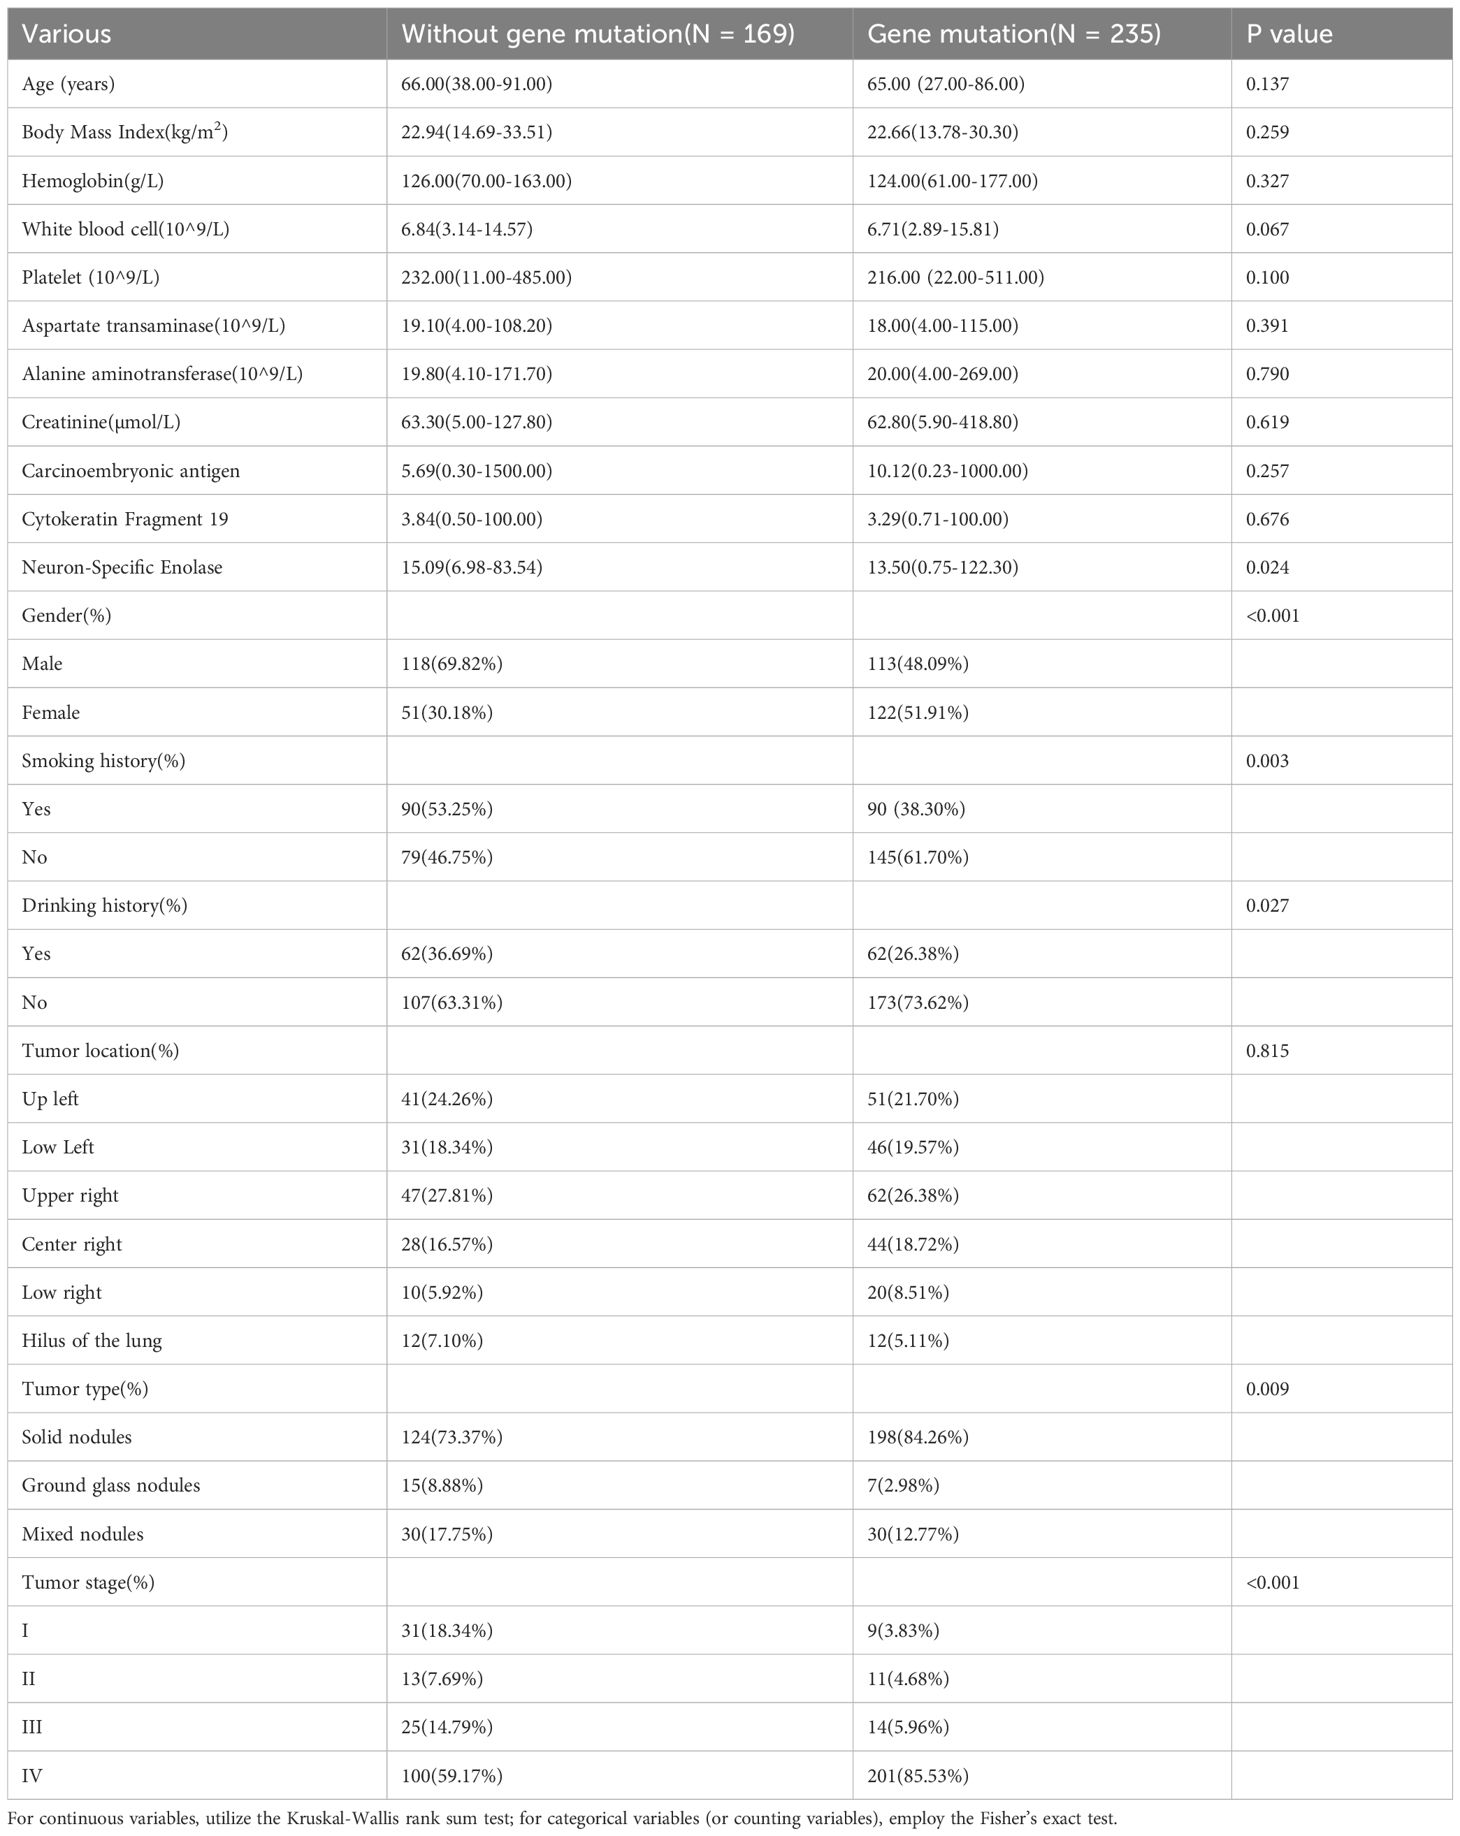
Table 1. General clinical characteristics of all participants.
3.2 Association analysis between BMI and ADC gene mutation
After a thorough analysis of all pertinent variables, each unit increase in BMI corresponded to an 18% reduction in the ADC gene mutation rate (OR = 0.82, 95% CI: 0.680-0.982, p = 0.03). This robust evidence underscores a statistically significant inverse relationship between higher BMI levels and a decreased ADC gene mutation rate. Additionally, when examining BMI quartiles, individuals in Quartile 2 demonstrated a notable 63% lower odds of developing mutations compared to those in Quartile 1(OR = 0.365, 95% CI: 0.129-1.035, p = 0.05), as outlined in Table 2.
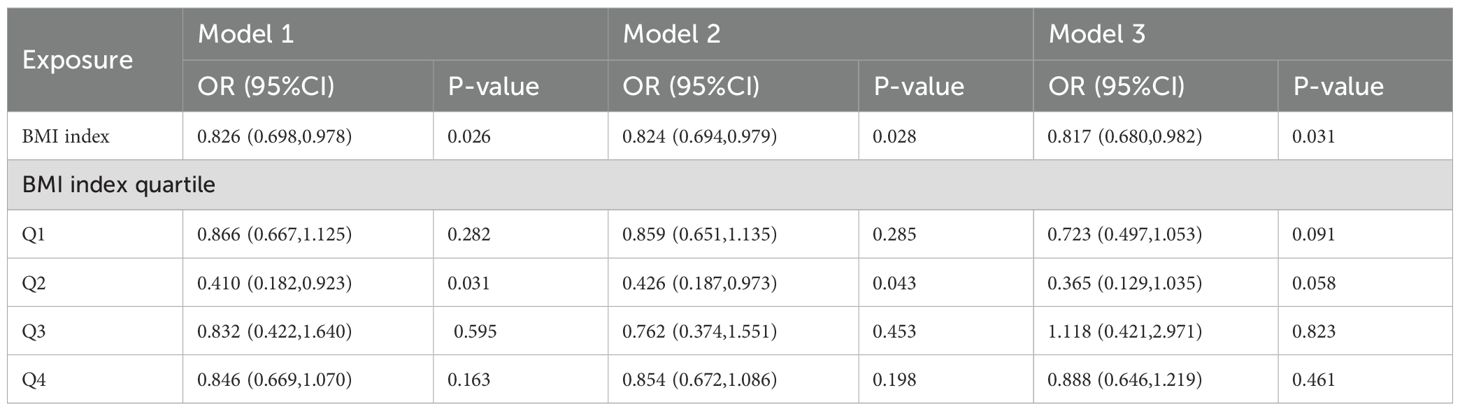
Table 2. Multivariable logistic regression models examining the correlation between BMI and ADC gene mutation.
3.3 Analysis of RCS curve and threshold effects
The RCS curve in Figure 2 vividly illustrates a notably strong linear relationship between BMI and ADC gene mutation rates. A detailed examination of the threshold effect reveals a pivotal turning point emerging at exactly 18.26 BMI units, as clearly shown in Figure 2 and detailed in Table 3.
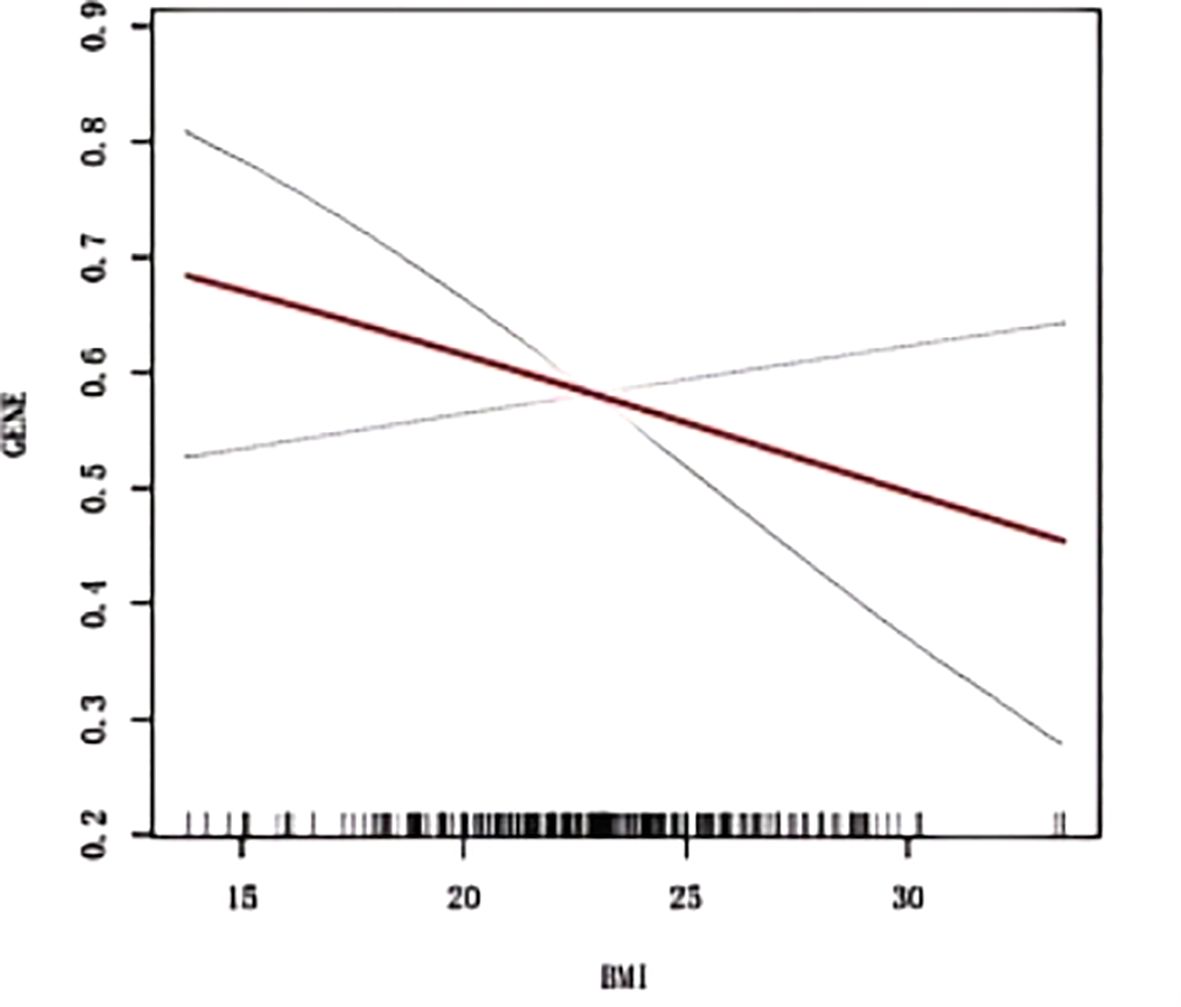
Figure 2. Smoothed curve fitting between BMI and ADC gene mutation. The blue bars show the fitted 95% confidence intervals(95% CI) and the fitted smoothed curves are shown in red. BMI, Body Mass Index; ADC, Adenocarcinoma.
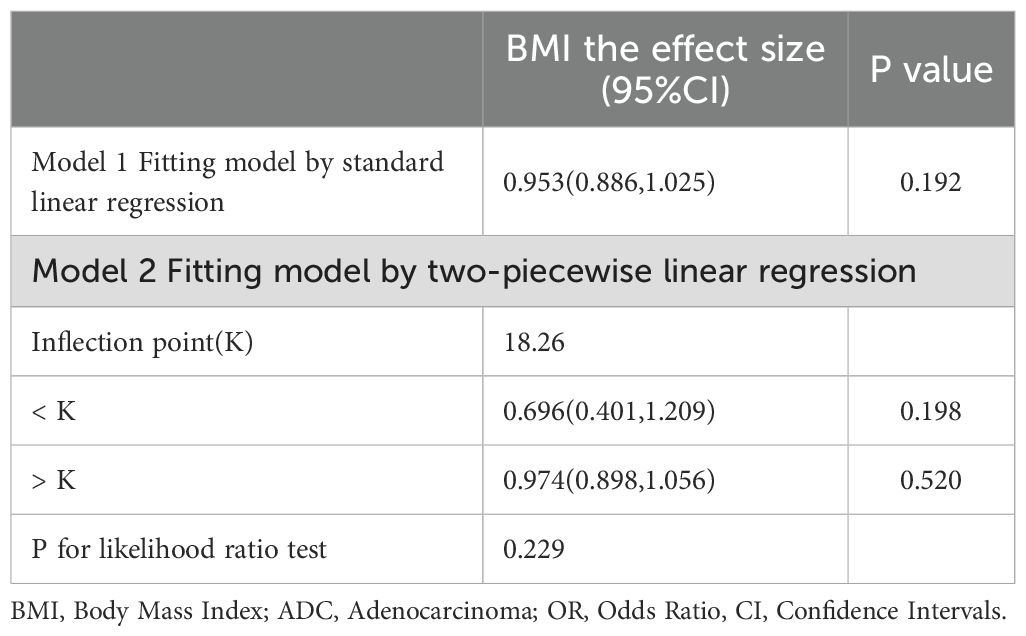
Table 3. The threshold effect analysis of BMI on ADC gene mutation.
3.4 Analysis of ADC gene mutations for age, sex, smoking, and drinking history
As depicted in Figure 3A, the ADC gene mutation rate was significantly lower in patients aged 60 years or older compared to those younger than 60 (54.4% vs. 66.9%, p = 0.019). Similarly, male patients exhibited a lower mutation rate than female patients (48.9% vs. 68.7%, p < 0.001), as depicted in Figure 3B. Furthermore, patients with a smoking history had a significantly lower mutation rate than non-smokers (50% vs. 64.7%, p = 0.003), as illustrated in Figure 3C. Likewise, the mutation rate was lower in patients with a drinking history compared to non-drinkers (50% vs. 61.8%, p = 0.027), as depicted in Figure 3D.

Figure 3. Gene mutations for age, sex, smoking and drinking. (A) Aged ≥ 60 or < 60 years; (B) Male and Female; (C) Smoking history; (D) Drinking history. ADC, Adenocarcinoma. * represent p < 0.05; ** represent p < 0.01; *** represent p < 0.001.
3.5 The ROC prediction for ADC gene mutation
ROC analysis for predicting ADC gene mutations revealed the following AUC results: 0.533 for the overall BMI cohort (Figure 4A), 0.456 for individuals with BMI < 21.08kg/m2 (Figure 4B), 0.625 for those with 21.08 ≤ BMI < 22.86 kg/m2 (Figure 4C), 0.531 for 22.86 ≤ BMI < 24.74kg/m2 (Figure 4D), and 0.578 for BMI ≥ 24.74kg/m2 (Figure 4E).

Figure 4. The ROC prediction of ADC gene mutation. (A) all BMI; (B) BMI < 21.08kg/m2; (C) 21.08 ≤ BMI < 22.86kg/m2; (D) 22.86 ≤ BMI < 24.74kg/m2; (E) BMI ≥ 24.74kg/m2. ADC, Adenocarcinoma; ROC, Receiver Operating Characteristic Curve; AUC, Area Under the Curve.
3.6 The correlation analysis for BMI and ADC gene mutation
As depicted in Figure 5A, Spearman correlation analysis validated the relationship between BMI and ADC gene mutation. Specifically, within the BMI range of 21.08 ≤ BMI < 22.86kg/m2, a significant negative correlation was observed between BMI and ADC gene mutation (R = -0.215, p = 0.032). No significant correlations were identified in the other BMI quartile intervals (Figure 5B–D, all p > 0.05), with further details provided in Supplementary Table 1.
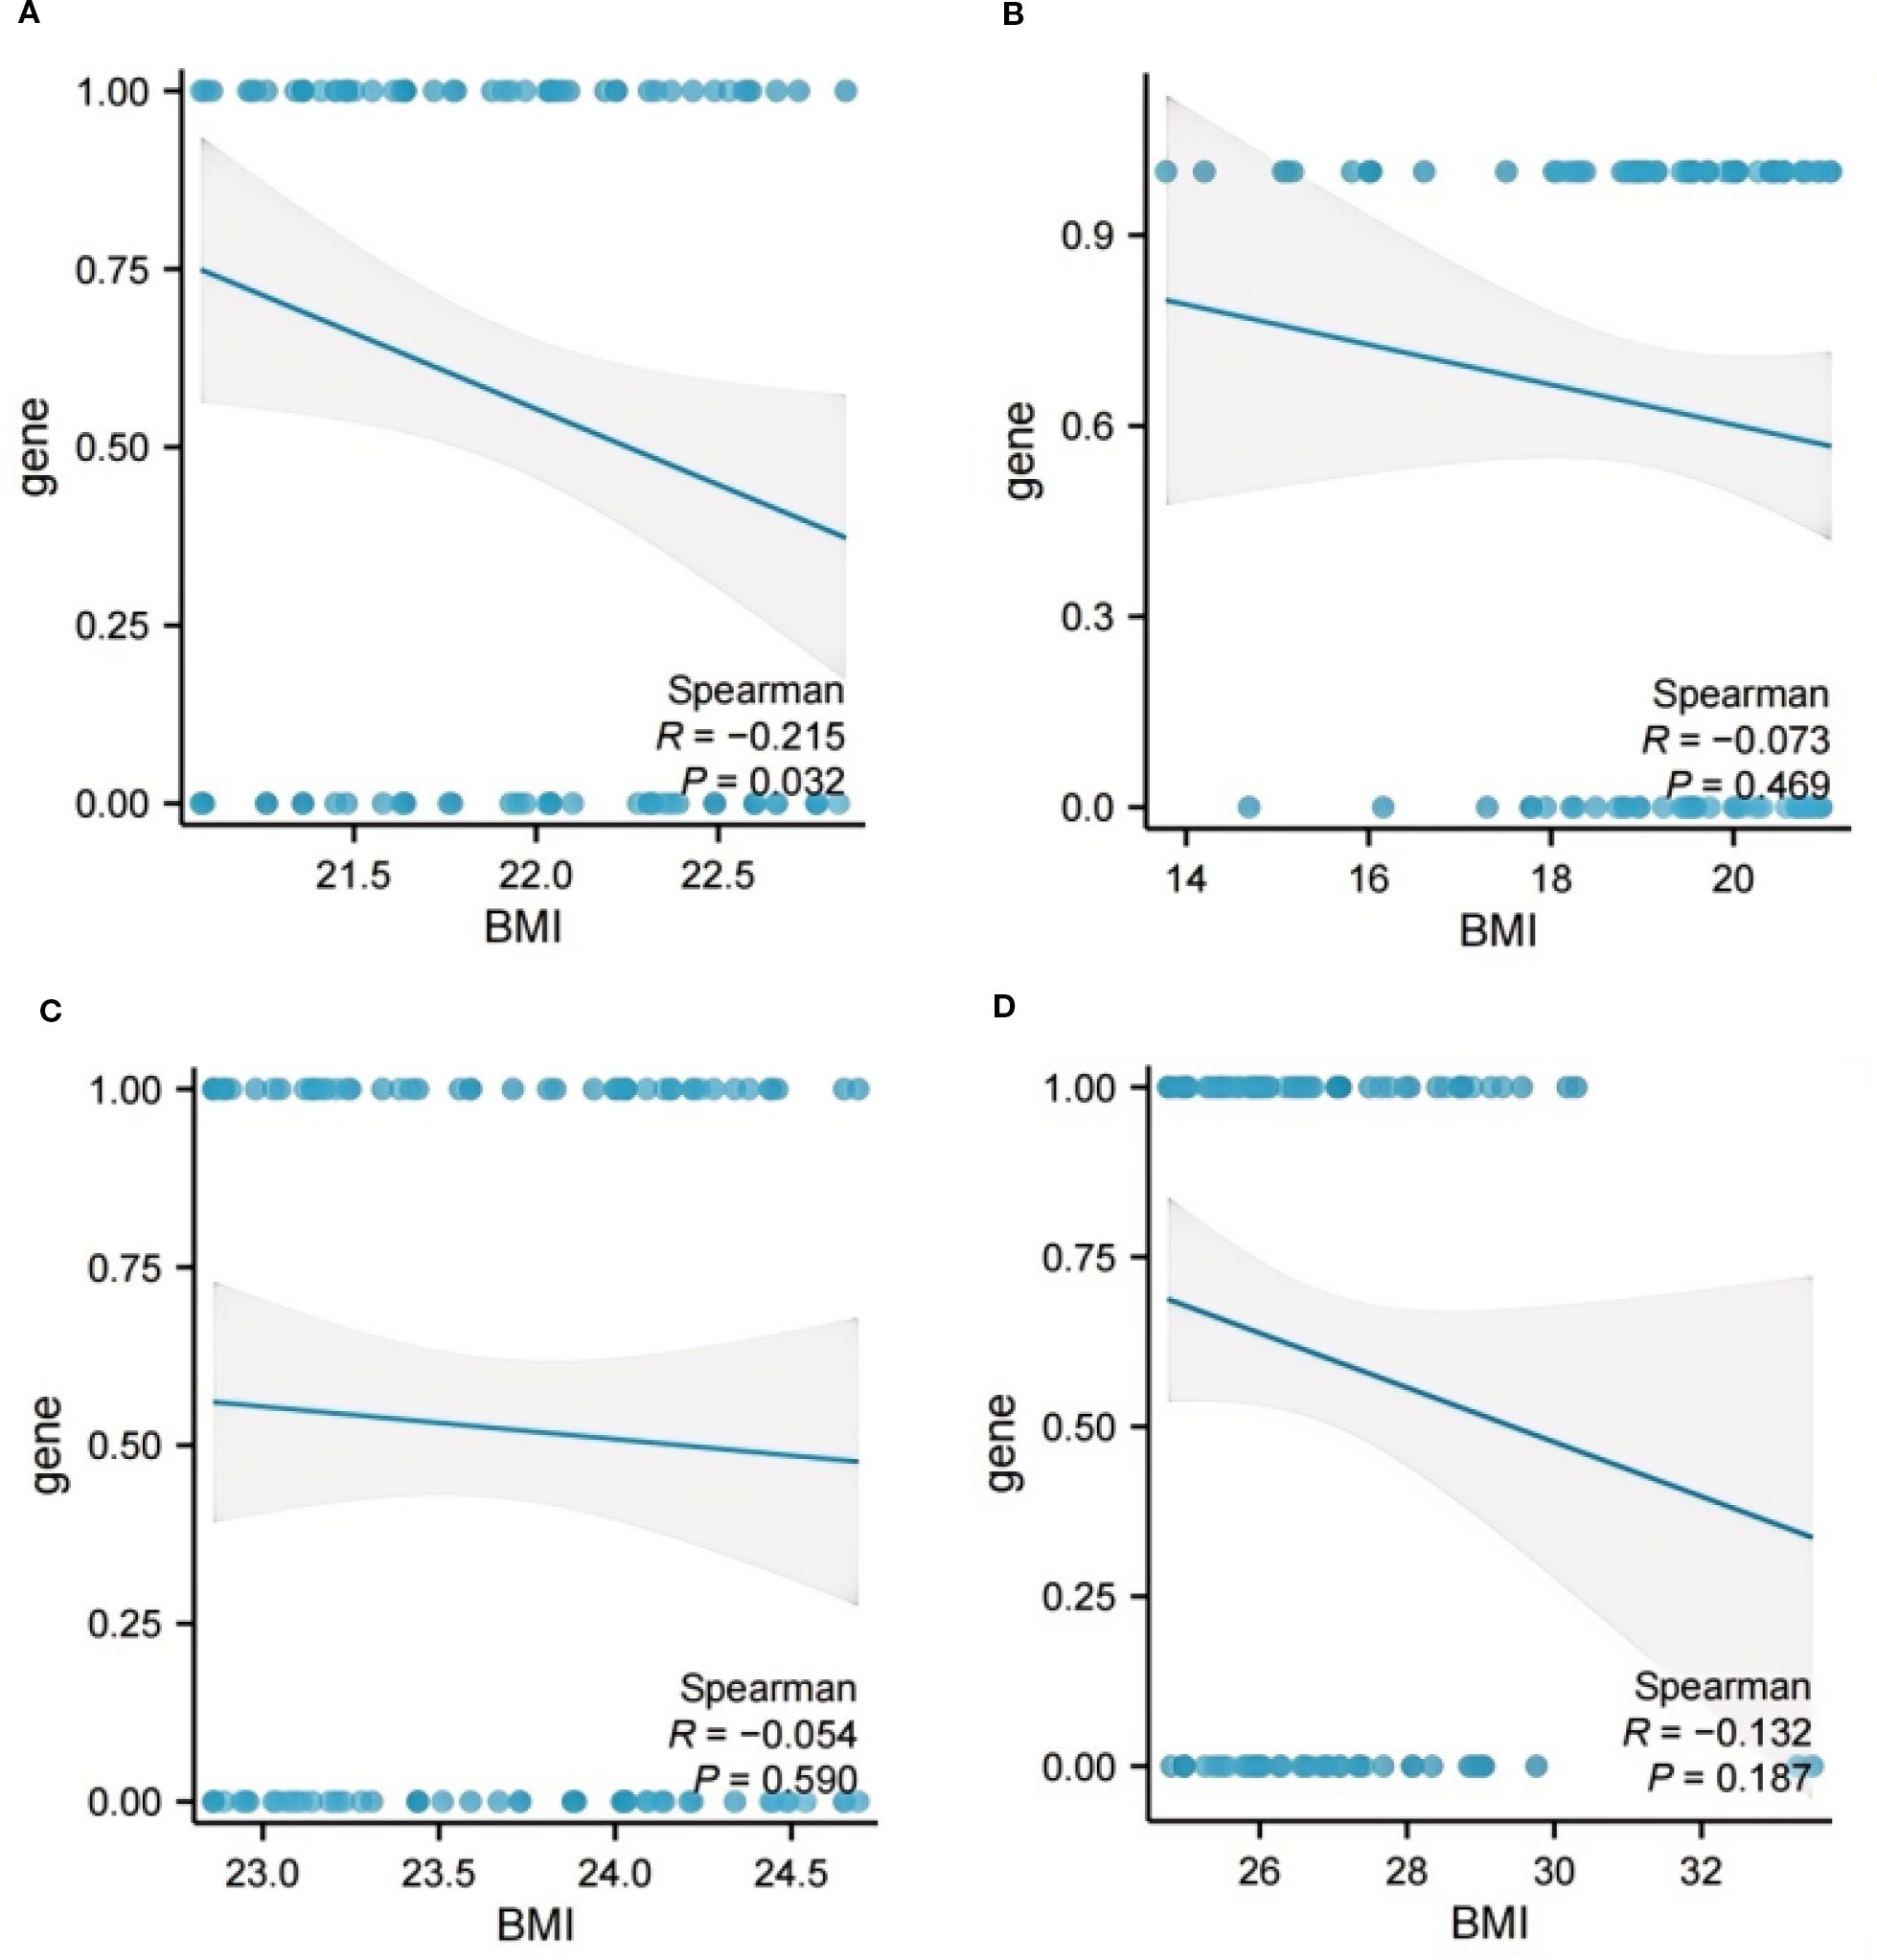
Figure 5. The correlation analysis between BMI and ADC gene mutation. (A) BMI < 21.08 kg/m2; (B) 21.08 ≤ BMI < 22.86 kg/m2; (C) 22.86 ≤ BMI < 24.74 kg/m2; (D) BMI ≥ 24.74kg/m2. ADC, Adenocarcinoma; BMI, Body Mass Index.
3.7 Stratified analysis
To comprehensively evaluate the consistency of the BMI-ADC gene mutation association and uncover potential variations across different subgroups, this study conducted extensive subgroup analyses and interaction tests, adjusting for multiple covariates, as detailed in Table 4.
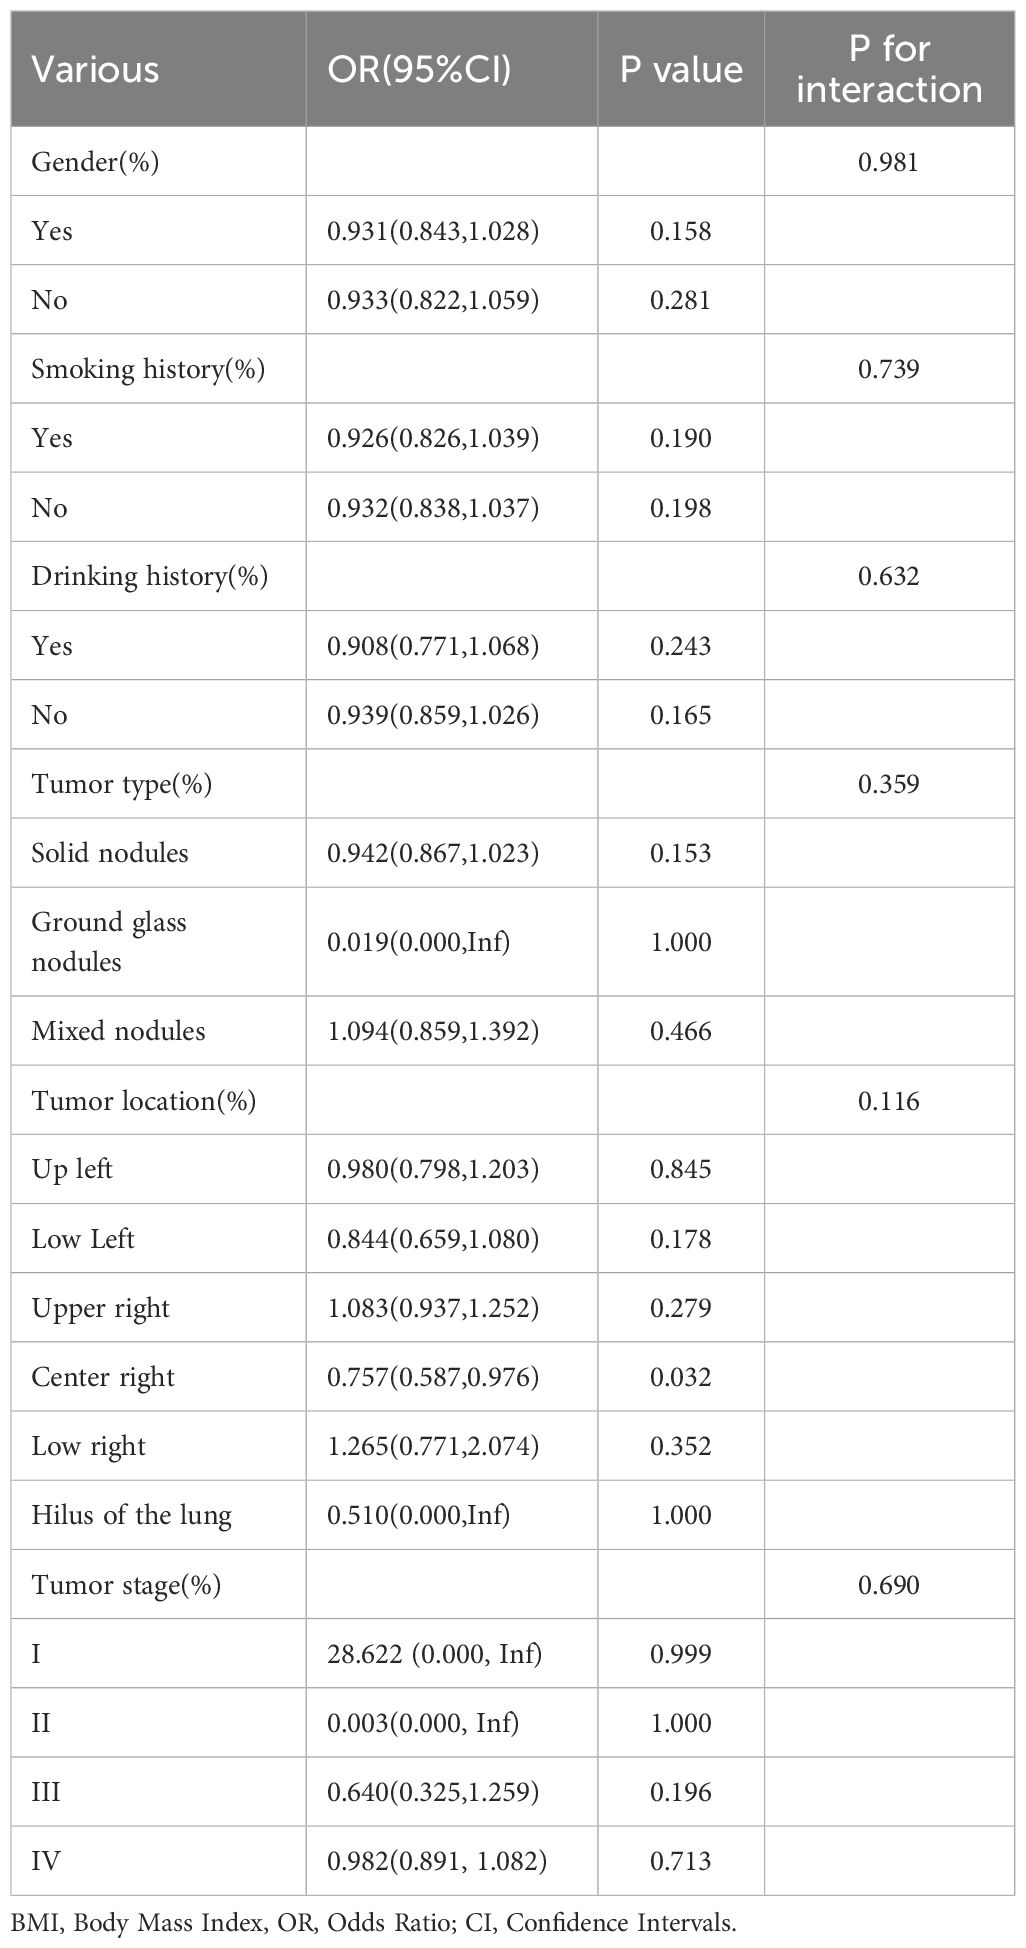
Table 4. Subgroup analysis of the association between BMI and ADC gene mutation.
4 Discussion
Our study identified a significant linear association between BMI and ADC gene mutation rates, particularly notable within the BMI range of 21.08 to 22.86kg/m2. ROC prediction models for ADC gene mutations, based on BMI, yielded AUC values of 0.533 (all BMI) and 0.625 (BMI range: 21.08-22.86 kg/m2). Spearman correlation analysis further confirmed a significant negative correlation between BMI and ADC gene mutation rate in the range of 21.08 to 22.86 kg/m². Additionally, gene mutation rates were relatively higher among patients younger than 60, women, and those without a history of smoking or drinking.
Obesity is intricately linked to tumorigenesis, with underlying mechanisms that are notably complex. In obese individuals, dysfunctional adipocytes overproduce free fatty acids (FFAs) and pro-inflammatory cytokines, such as tumor necrosis factor-α (TNF-α) and Interleukin-6 (IL-6) (21). This excessive production activates the JNK/TLR/NF-κB signaling pathway, impairing insulin receptor function. Hyperinsulinemia subsequently promotes tumor cell proliferation through the PI3K-AKT-mTOR and RAS-MAPK pathways, while simultaneously reducing insulin-like growth factor-binding proteins (IGFBPs) and increasing the bioavailability of free Insulin-like growth factor-1/2 (IGF-1/IGF-2)—key factors for sustaining tumor stem cells (22–24). CD36, a crucial fatty acid transporter, is significantly upregulated in obesity and hypercholesterolemia, enabling gastric cancer cells to aggressively absorb lipids, thereby fueling rapid tumor growth and invasion (25). Notably, CD36 serves as the only shared genetic link between obesity, hypercholesterolemia, and gastric cancer, with its expression levels strongly correlating with advanced cancer staging and poor prognosis (26). Within obese adipose tissue, macrophages form a “crown-like structure”, continuously secreting pro-inflammatory factors that induce DNA damage and impair repair mechanisms. Furthermore, adipose tissue itself generates reactive oxygen species (ROS), further elevating mutation risks. Macrophages also polarize into the M2 phenotype, releasing inhibitory factors like Interleukin-10 (IL-10) and transforming growth factor-β (TGF-β), which suppress CD8+ T cell function and help cancer cells evade immune surveillance (27, 28).
Current understanding of modifiable risk factors for EGFR/KRAS-mutant ADC remains notably scarce. Prior research indicates that obese ADC patients have higher rates of KRAS mutations, and that KRAS-mutant tumors demonstrate increased responsiveness to immune checkpoint inhibitors, which partly explains the enhanced efficacy of immunotherapy in this group. Among East Asian populations, obesity exerts a more pronounced negative effect on EGFR mutations (29). Our study further uncovers a significant inverse relationship between BMI and ADC gene mutation rates, likely attributable to the high frequency of EGFR mutations within our cohort, underscoring the pivotal role of gene-environment interactions in ADC pathogenesis. Moreover, these findings highlight the potential clinical implications of incorporating BMI evaluations into genetic screening protocols for ADC patients, especially in populations with a high prevalence of EGFR mutations. Future investigations should explore the underlying biological mechanisms, such as hormonal or metabolic pathways, that facilitate the interaction between obesity and EGFR mutation prevalence. Such insights could pave the way for personalized prevention and treatment strategies. Additionally, longitudinal studies are needed to determine whether weight management interventions can mitigate mutation-associated risks and enhance immunotherapy outcomes in this specific patient subgroup.
Previous research has revealed significant differences in the mutation profiles of NSCLC, including alterations in genes such as ALK, Rearranged during Transfection (RET), MET, EGFR, serine/threonine kinase 11(STK11), Kelch-like ECH-associated protein 1 (KEAP1), BRAF, and KRAS, as well as in Tumor Mutation Burden (TMB)-High status, between patients under 40 and those aged 40 or older (30). Our study similarly demonstrates that ADC patients aged 60 or older have a significantly lower probability of gene mutations compared to those under 60. Furthermore, our findings indicate that women exhibit a lower rate of gene mutations than men, and patients with a smoking history have a markedly reduced mutation rate compared to non-smokers, which is consistent with the majority of prior studies (31–36). These observations underscore the substantial impact of age, gender, and smoking history on the likelihood of ADC gene mutations, providing a basis for optimizing screening and treatment strategies tailored to different age, gender, and smoking status groups. Further research should delve into the biological mechanisms associated with these factors, such as changes in DNA repair capacity, immune responses, or cell proliferation rates, which may influence the accumulation of gene mutations across diverse age, gender, and smoking contexts.
Various gene mutation types in ADC are strongly associated with a notably poor clinical prognosis. Patients with EGFR-sensitive mutations, such as exon 19 deletions or L858R, who are treated with first-generation EGFR tyrosine kinase inhibitors (TKIs), typically achieve a median progression-free survival (PFS) of 9 to 18 months (37). In contrast, first-line therapy with the third-generation TKI osimertinib extends median PFS to 18.9 months and overall survival (OS) beyond 3 years. Moreover, patients with exon 19 deletions have a more favorable prognosis than those with L858R mutations, with median PFS of 14.7 months versus 9.8 months, respectively. However, the presence of concurrent TP53 mutations significantly worsens prognosis, with a hazard ratio (HR) ranging from 1.6 to 2.3 (38). In the context of ALK fusion gene-targeted therapy, median OS exceeds 7 years, marking this subtype as having the most favorable prognosis (39). For MET exon 14 skipping mutations, targeted therapy yields an objective response rate (ORR) of 68% and a median PFS of 12.4 months (40). Nevertheless, the precise mechanisms contributing to the poor prognosis associated with distinct genetic mutation types remain incompletely understood. Future research should focus on multicenter prospective studies that incorporate single-cell sequencing and functional experiments to clarify the regulatory roles of signaling pathways, such as PI3K/AKT or MAPK, in various mutant subtypes, while these studies should evaluate the impact of the tumor immune microenvironment. A comprehensive analysis of multiple factors will provide a theoretical foundation for the development of personalized treatment strategies.
This study has notable strengths and limitations. Significantly, A key strength is that it is the first to explore the association between BMI and ADC gene mutations, including EGFR, KRAS, and TP53, potentially providing clinicians with fresh insights to inform evidence-based decision-making. However, several limitations warrant consideration. Firstly, as a single-center retrospective study with a relatively small sample size, it was not feasible to conduct a longitudinal analysis of the relationship between BMI and tumor gene mutations. Secondly, our research did not differentiate among specific gene mutations but rather examined the correlation between BMI and tumor gene mutation in a general sense. Thirdly, potential selection bias in the study data may affect the accuracy of the findings. Fourthly, the study population lacked racial diversity, which may limit the generalizability of the results. Finally, errors in data collection could introduce bias into the outcomes.
In summary, this retrospective real-world study reveals a significant inverse correlation between BMI and ADC gene mutations. Specifically, within the BMI range of 21.08 to 22.86 kg/m², higher BMI levels are associated with a reduced risk of such mutations. Furthermore, the mutation frequency appears to be elevated among female patients under 60 who have no history of smoking or alcohol consumption. These findings offer clinicians preliminary insights for assessing the likelihood of ADC mutations in patients.
Data availability statement
The original contributions presented in the study are included in the article/Supplementary Material. Further inquiries can be directed to the corresponding author.
Author contributions
YW: Writing – review & editing, Writing – original draft. LY: Writing – review & editing, Writing – original draft. DJ: Writing – original draft, Writing – review & editing.
Funding
The author(s) declare financial support was received for the research and/or publication of this article. Application of single-cell biomolecular analysis in the pathogenesis of lung cancer(cstc2022yejh-bgzxm0051).
Acknowledgments
We thank the Second Affiliated Hospital of Chongqing Medical University for their support. Funding: This work is supported by Application of single-cell biomolecular analysis in the pathogenesis of lung cancer(cstc2022yejh-bgzxm0051).
Conflict of interest
The authors declare that the research was conducted in the absence of any commercial or financial relationships that could be construed as a potential conflict of interest.
Generative AI statement
The author(s) declare that no Generative AI was used in the creation of this manuscript.
Any alternative text (alt text) provided alongside figures in this article has been generated by Frontiers with the support of artificial intelligence and reasonable efforts have been made to ensure accuracy, including review by the authors wherever possible. If you identify any issues, please contact us.
Publisher’s note
All claims expressed in this article are solely those of the authors and do not necessarily represent those of their affiliated organizations, or those of the publisher, the editors and the reviewers. Any product that may be evaluated in this article, or claim that may be made by its manufacturer, is not guaranteed or endorsed by the publisher.
Supplementary material
The Supplementary Material for this article can be found online at: https://www.frontiersin.org/articles/10.3389/fonc.2025.1661143/full#supplementary-material.
References
1. Kanem N, Murray CJL, and Horton R. The lancet commission on 21st-century global health threats. Lancet. (2023) 401:10–1. doi: 10.1016/S0140-6736(22)02576-4
2. GBD 2021 Risk Factors Collaborators. Global burden and strength of evidence for 88 risk factors in 204 countries and 811 subnational locations, 1990-2021: a systematic analysis for the Global Burden of Disease Study 2021. Lancet. (2024) 403:2162–203. doi: 10.1016/S0140-6736(24)00933-4
3. He B, Zhao X, Pu Y, Sun R, Gao X, and Liu W. Trends and projection of burden on lung cancer and risk factors in China from 1990 to 2060. Thorac Cancer. (2024) 15:1688–704. doi: 10.1111/1759-7714.15332
4. Guo L, Zhu C, Cai L, Zhang X, Fang Y, Chen H, et al. Global burden of lung cancer in 2022 and projected burden in 2050. Chin Med J (Engl). (2024) 137:2577–82. doi: 10.1097/CM9.0000000000003268
5. Zhou Q, Zhao H, Lu S, Cheng Y, Liu Y, Zhao M, et al. Consensus on the lung cancer management after third-generation EGFR-TKI resistance. Lancet Reg Health West Pac. (2024) 53:101260. doi: 10.1016/j.lanwpc.2024.101260
6. Soerjomataram I and Bray F. Planning for tomorrow: global cancer incidence and the role of prevention 2020–2070. Nat Rev Clin Oncol. (2021) 18:663–72. doi: 10.1038/s41571-021-00514-z
7. Chen YY, Chen CS, Huang JF, Su WH, Li CY, Chen WS, et al. The obesity-related mutation gene on nonalcoholic fatty liver disease. Hum Genet. (2025) 144:1–14. doi: 10.1007/s00439-024-02686-x
8. Chung KM, Singh J, Lawres L, Dorans KJ, Garcia C, Burkhardt DB, et al. Endocrine-exocrine signaling drives obesity-associated pancreatic ductal adenocarcinoma. Cell. (2020) 181:832–47. doi: 10.1016/j.cell.2020.03.062
9. Park Y, Lee D, Lee JE, Park HS, Jung SS, Park D, et al. The matrix stiffness coordinates the cell proliferation and PD-L1 expression via YAP in lung adenocarcinoma. Cancers (Basel). (2024) 16:598. doi: 10.3390/cancers16030598
10. Husain A, Hu N, Sadow PM, and Nucera C. Expression of angiogenic switch, cachexia and inflammation factors at the crossroad in undifferentiated thyroid carcinoma with BRAF(V600E). Cancer Lett. (2016) 380:577–85. doi: 10.1016/j.canlet.2015.07.012
11. Guaitoli G, Zullo L, Tiseo M, Dankner M, Rose AA, and Facchinetti F. Non-small-cell lung cancer: how to manage BRAF-mutated disease. Drugs Context. (2023) 12:2022–11-3. doi: 10.7573/dic.2022-11-3
12. Sadow PM, Priolo C, Nanni S, Karreth FA, Duquette M, Martinelli R, et al. Role of BRAFV600E in the first preclinical model of multifocal infiltrating myopericytoma development and microenvironment. J Natl Cancer Inst. (2014) 106:dju182. doi: 10.1093/jnci/dju182
13. Shaik S, Nucera C, Inuzuka H, Gao D, Garnaas M, Frechette G, et al. SCF(β-TRCP) suppresses angiogenesis and thyroid cancer cell migration by promoting ubiquitination and destruction of VEGF receptor 2. J Exp Med. (2012) 209:1289–307. doi: 10.1084/jem.20112446
14. Duquette M, Sadow PM, Husain A, Sims JN, Antonello ZA, Fischer AH, et al. Metastasis-associated MCL1 and P16 copy number alterations dictate resistance to vemurafenib in a BRAFV600E patient-derived papillary thyroid carcinoma preclinical model. Oncotarget. (2015) 6:42445–67. doi: 10.18632/oncotarget.6442
15. Jin Y, Peng Y, Xu J, Yuan Y, Yang N, Zhang Z, et al. LUBAC promotes angiogenesis and lung tumorigenesis by ubiquitinating and antagonizing autophagic degradation of HIF1α. Oncogenesis. (2024) 13:6. doi: 10.1038/s41389-024-00508-3
16. Mazieres J, Cropet C, Montané L, Barlesi F, Souquet PJ, Quantin X, et al. Vemurafenib in non-small-cell lung cancer patients with BRAFV600 and BRAFnonV600 mutations. Ann Oncol. (2020) 31:289–94. doi: 10.1016/j.annonc.2019.10.022
17. Shahsiah R, DeKoning J, Samie S, Latifzadeh SZ, and Kashi ZM. Validation of a next generation sequencing panel for detection of hotspot cancer mutations in a clinical laboratory. Pathol Res Pract. (2017) 213:98–105. doi: 10.1016/j.prp.2016.11.016
18. Travis WD, Brambilla E, Nicholson AG, Yatabe Y, Austin JHM, Beasley MB, et al. The 2015 world health organization classification of lung tumors: impact of genetic, clinical and radiologic advances since the 2004 classification. J Thorac Oncol. (2015) 10:1243–60. doi: 10.1097/JTO.0000000000000630
19. Papadopoulou E, Tsoulos N, Tsirigoti A, Apessos A, Agiannitopoulos K, Metaxa-Mariatou V, et al. Determination of EGFR and KRAS mutational status in Greek non-small-cell lung cancer patients. Oncol Lett. (2015) 10:2176–84. doi: 10.3892/ol.2015.3600
20. Negru S, Papadopoulou E, Apessos A, Stanculeanu DL, Ciuleanu E, Volovat C, et al. KRAS, NRAS and BRAF mutations in Greek and Romanian patients with colorectal cancer: a cohort study. BMJ Open. (2014) 4:e004652. doi: 10.1136/bmjopen-2013-004652
21. Chew SM, Liu B, Shen S, and Iyengar NM. The role of obesity and inflammation in breast cancer recurrence. Curr Breast Cancer Rep. (2024) 16:237–50. doi: 10.1007/s12609-024-00550-5
22. Mallya S, Gangadhar V, Aldrin SE, Acharya M, Kabekkodu SP, Kolathur KK, et al. Insights into the molecular and genetic role of obesity in breast cancer pathogenesis. Cancer Biol Ther. (2025) 26:2501345. doi: 10.1080/15384047.2025.2501345
23. Zhang AMY, Wellberg EA, Kopp JL, and Johnson JD. Hyperinsulinemia in obesity, inflammation, and cancer. Diabetes Metab J. (2021) 45:285–311. doi: 10.4093/dmj.2020.0250
24. Leitner BP, Siebel S, Akingbesote ND, Zhang X, and Perry RJ. Insulin and cancer: a tangled web. Biochem J. (2022) 479:583–607. doi: 10.1042/BCJ20210134
25. Dutta P, Saha D, Giri A, Bhatnagar AR, and Chakraborty A. Decoding the CD36-centric axis in gastric cancer: insights into lipid metabolism, obesity, and hypercholesterolemia. Int J Trans Med. (2025) 5:26. doi: 10.3390/ijtm5030026
26. Puchałowicz K and Rać ME. The multifunctionality of CD36 in diabetes mellitus and its complications-update in pathogenesis, treatment and monitoring. Cells. (2020) 9:1877. doi: 10.3390/cells9081877
27. Crespo-Orta I, Ortiz C, Encarnación J, Suárez E, and Matta J. Association between DNA repair capacity and body mass index in women. Mutat Res Mol Mech Mutagen. (2023) 826:111813. doi: 10.1016/j.mrfmmm.2022.111813
28. Thornton K, Torres L, Pedone EL, Waltenbaugh JS, Swanson CM, Gonzalez E, et al. Targeting iNAMPT and NAD biosynthesis to break the obesity-associated liver cancer link. Biomedicines. (2025) 13:1533. doi: 10.3390/biomedicines13071533
29. Tang C, Castillon VJ, Waters M, Fong C, Park T, Boscenco S, et al. Obesity-dependent selection of driver mutations in cancer. Nat Genet. (2024) 56:2318–21. doi: 10.1038/s41588-024-01969-3
30. Miura K, Shukuya T, Greenstein R, Kaplan B, Wakelee H, Kurokawa K, et al. Ancestry-, sex-, and age-based differences of gene alterations in NSCLC: from the real-world data of cancer genomic profiling tests. J Natl Compr Canc Netw. (2024) 22:e247021. doi: 10.6004/jnccn.2024.7021
31. Chen YJ, Roumeliotis TI, Chang YH, Chen CT, Han CL, Lin MH, et al. Proteogenomics of non-smoking lung cancer in east asia delineates molecular signatures of pathogenesis and progression. Cell. (2020) 182:226–244.e17. doi: 10.1016/j.cell.2020.06.012
32. Tseng JS, Wang CL, Yang TY, Chen CY, Yang CT, Chen KC, et al. Divergent epidermal growth factor receptor mutation patterns between smokers and non-smokers with lung adenocarcinoma. Lung Cancer. (2015) 90:472–6. doi: 10.1016/j.lungcan.2015.09.024
33. Zhang Y, Zhang L, Li R, Chang DW, Ye Y, Minna JD, et al. Genetic variations in cancer-related significantly mutated genes and lung cancer susceptibility. Ann Oncol. (2017) 28:1625–30. doi: 10.1093/annonc/mdx161
34. Yang B, Li J, Li F, Zhou H, Shi W, Shi H, et al. Comprehensive analysis of age-related somatic mutation profiles in Chinese young lung adenocarcinoma patients. Cancer Med. (2019) 8:1350–8. doi: 10.1002/cam4.1839
35. Devarakonda S, Li Y, Martins Rodrigues F, Sankararaman S, Kadara H, Goparaju C, et al. Genomic profiling of lung adenocarcinoma in never-smokers. J Clin Oncol. (2021) 39:3747–58. doi: 10.1200/JCO.21.01691
36. Luo W, Tian P, Wang Y, Xu H, Chen L, Tang C, et al. Characteristics of genomic alterations of lung adenocarcinoma in young never-smokers. Int J Cancer. (2018) 143:1696–705. doi: 10.1002/ijc.31542
37. Mok TS, Wu Y-L, Ahn M-J, et al. Osimertinib or platinum-pemetrexed in EGFR T790M-positive lung cancer. N Engl J Med. (2017) 376:629–40. doi: 10.1056/NEJMoa1612674
38. Fujiwara T, Shien K, Matsuura M, Soh J, Yamamoto H, Takao S, et al. EGFR mutation is a prognostic factor in lung cancer patients with pleural dissemination detected during or after surgery. Ann Surg Oncol. (2023) 30:6697–702. doi: 10.1245/s10434-023-13791-y
39. Shaw AT, Bauer TM, de Marinis F, Felip E, Goto Y, Liu G, et al. First-line lorlatinib or crizotinib in advanced ALK-positive lung cancer. N Engl J Med. (2020) 383:2018–29. doi: 10.1056/NEJMoa2027187
Keywords: lung adenocarcinoma (AD), body mass index, gene mutation, restricted cubic spline curve, logistic regression
Citation: Wu Yq, Yang L and Jiang D (2025) Association between genetic mutations in lung adenocarcinoma and adult body mass index: a retrospective cohort study. Front. Oncol. 15:1661143. doi: 10.3389/fonc.2025.1661143
Received: 07 July 2025; Accepted: 29 August 2025;
Published: 22 September 2025.
Edited by:
Marica Cariello, University of Bari Aldo Moro, ItalyReviewed by:
Amjad Husain, Cancer Research Institute, IndiaXiongbin Kang, Bielefeld University, Germany
Copyright © 2025 Wu, Yang and Jiang. This is an open-access article distributed under the terms of the Creative Commons Attribution License (CC BY). The use, distribution or reproduction in other forums is permitted, provided the original author(s) and the copyright owner(s) are credited and that the original publication in this journal is cited, in accordance with accepted academic practice. No use, distribution or reproduction is permitted which does not comply with these terms.
*Correspondence: Depeng Jiang, Z2RwMTE2QGhvc3BpdGFsLmNxbXUuZWR1LmNu