 Xueqin Hou
 Zhiming Li
- Department of Abdominal Ultrasound, The First Affiliated Hospital of Xinjiang Medical University, Xinjiang Key Laboratory of Ultrasound Medicine, Urumqi, China
Objective: Benign and malignant breast tumors exhibit distinct microvascular morphological patterns and spatial distribution characteristics; however, current clinical imaging modalities cannot comprehensively assess their microvascular network architecture. Super-resolution ultrasound (SRUS) imaging addresses this critical gap by providing super-resolved visualization of microvascular topology. This study aimed to evaluate the utility of SRUS imaging in visualizing breast lesion microvasculature and establishing diagnostic models for BI-RADS 4 masses.
Methods: A total of 120 breast lesions from 117 patients with conventional ultrasound-confirmed BI-RADS 4 lesions were prospectively enrolled in this study between July 2024 and January 2025. Preoperative conventional ultrasound and SRUS examinations were performed on all included patients. Based on pathological findings, the lesions were categorized as benign (n = 85) or malignant (n = 35). The benign group was further stratified into hypovascular (n = 42) and hypervascular (n = 43) subgroups based on the SRUS enhancement levels. Univariate analysis was performed to screen SRUS parameters, and variables with P < 0.05 were incorporated into multivariate logistic regression models to construct nomogram-based predictive models and validated using ROC analysis.
Results: Max vel (OR = 1.848, 95% CI: 1.205–3.122), curvature (A/E) (OR = 2.162, 95% CI: 1.981–2.323), and complexity level (OR = 1.772, 95% CI: 1.608–1.942) independently predicted malignancy (all P < 0.05). Curvature (A/E) and complexity level were also independent markers for distinguishing malignant lesions from hypervascular benign lesions (curvature (A/E): OR = 1.808, 95% CI: 1.612–1.987; complexity level: OR = 1.952, 95% CI: 1.804–2.181; both P < 0.05). The nomogram prediction models demonstrated high diagnostic efficacy, with AUC values of 0.899 (95% CI: 0.844–0.953) (sensitivity = 94.3%, specificity = 76.5%) for benign compared to 0.816 (95% CI: 0.721–0.910 (sensitivity = 65.1%, specificity = 88.6%) for malignant differentiation. The Hosmer-Lemeshow goodness-of-fit test indicated adequate model fit (all P > 0.05). The nomogram prediction model demonstrated superior net benefit in predicting breast cancer compared to alternative strategies.
Conclusion: SRUS enables microvascular characterization of breast lesions, with validated nomograms demonstrating high diagnostic accuracy for early cancer detection.
1 Introduction
Breast cancer is the most prevalent malignancy among women worldwide, with the highest incidence and mortality rates; this trend underscores the urgent need for precise early diagnosis, a persistent challenge in modern clinical medicine (1). Ultrasonography is widely utilized for screening breast nodules due to its non-ionizing nature, user-friendly operation, and cost-effectiveness (2). However, conventional ultrasound imaging is constrained by the diffraction limit (~200 μm), which impairs the visualization of critical malignant features, such as microcalcifications and neovascularization. This limitation contributes to a diagnostic uncertainty in 10%–30% of cases (3).
Super-Resolution Ultrasound (SRUS) imaging is an advanced tracking technique that employs ultrafast plane-wave ultrasound imaging to achieve microbubble localization, tracking, and trajectory reconstruction. By transcending the spatial resolution limitations (typically > 200 μm) inherent to conventional Doppler-based hemodynamic imaging, this platform achieves microvascular flow mapping with quantified spatial precision of 25–50 μm. Such technical advancements establish SRUS as a transformative tool for both mechanistic investigations of microcirculatory pathophysiology and clinical decision-making in vasculopathic disorders, particularly for early-stage microangiopathy detection (4). The technology has been successfully applied in both preclinical animal models and clinical trials, including lymph node characterization (5), tumor evaluation in the brain and liver (6, 7), ocular vascularization analysis (8), cerebral microperfusion studies (9), testicular lesion characterization (10), and microcirculatory assessment in acute kidney injury (11). This study aimed to evaluate the clinical utility of SRUS for breast lesion characterization, offering a potential breakthrough in precision diagnostics.
2 Materials and methods
2.1 Patients
A prospective cohort of 117 patients with breast masses detected via conventional ultrasound was enrolled between July 2024 and January 2025. The patients’ ages ranged from 20 to 83 years (mean: 45.17 ± 11.75 years). A total of 120 lesions were included, with maximum diameters ranging from 3.9 to 55.9 mm (mean: 17.70 ± 11.58 mm; median: 15 mm). All lesions were classified as BI-RADS category 4 on conventional ultrasound and subsequently categorized as benign (n = 85) or malignant (n = 35) based on histopathological results. Benign lesions were further stratified into hypervascular (n = 43) and hypovascular (n = 42) subgroups. This study was approved by the ethics committee of the First Affiliated Hospital of Xinjiang Medical University (approval no.: K202310-02), and all experiments were performed in accordance with relevant guidelines and regulations. Written informed consent was obtained from all participants, and all procedures were performed in accordance with the Helsinki Declaration.
The study’s inclusion criteria were as follows: (1) Complete pre-biopsy/preoperative conventional ultrasound and SRUS imaging data; and (2) availability of definitive histopathological and clinical records. The exclusion criteria were as follows: (1) Pregnancy or lactation; (2) contraindications to ultrasound contrast agents; (3) prior tumor-related therapies; (4) history of concurrent malignancies; and (5) loss to follow-up or incomplete imaging data.
2.2 Equipment and contrast agent
Ultrasound examinations were performed using the ULTIMUS 9E (VINNO) system equipped with a U5-15 linear array transducer (6–12 MHz, breast imaging preset). SRUS imaging and conventional ultrasound parameters were standardized as follows: contrast auto-capture interval of 120 s, SRUS acquisition duration of 15 s, low contrast agent type, and acoustic power set at 9%. The contrast agent used was SonoVue® (Bracco, Milan, Italy).
2.3 Ultrasound protocol
2.3.1 Conventional ultrasound
The patients were positioned supine with both arms elevated to fully expose the breast and axilla. Grayscale imaging captured representative cross-sections, maximum diameter planes, and orthogonal views, while color Doppler flow imaging (CDFI) and super microvascular flow (SMF) modes were optimized to visualize the most vascularized cross-sections.
2.3.2 SRUS imaging
The largest diameter or most vascularized plane was selected for SRUS. A freeze-dried SonoVue® powder suspension was prepared by dissolving it in 5 mL of normal saline, forming a milky white microbubble solution. A 2.5-mL aliquot of this suspension was then injected into a peripheral vein at a constant rate, followed by a 5-mL saline flush. Following the injection of the contrast agent, a 120-second imaging sequence was immediately commenced in the real-time dual contrast-enhanced ultrasound (CEUS) mode. Once microbubbles entered the tumor, the “URM (ultra-resolution microscopy imaging) Collection” button was pressed to capture 15 s of imaging data.
2.4 Stratification of benign lesions
Due to the inherent technical limitations of CDFI and SMF in detecting low-velocity and fine vascular signals, this study classified benign lesions into hypervascular and hypovascular subgroups based on CEUS enhancement patterns. Hypervascular lesions were those exhibiting predominantly high enhancement on CEUS, characterized by marked contrast agent filling with intensity greater than that of the surrounding normal breast tissue. Hypovascular lesions showed predominantly low or iso-enhancement, where the degree of contrast agent filling was similar to or lower than that of the surrounding tissue.
2.5 Image analysis
SRUS parameters were independently measured by two senior sonographers who were blinded to the patients’ clinical history and prior ultrasound results. The final SRUS values were derived as the average of both assessments. Conventional ultrasound recorded the characteristics of the lesion, including the longest diameter, growth orientation (parallel or non-parallel to the skin), margin irregularities (presence of burrs), calcifications, and the presence of a hyperechoic halo. CDFI and SMF were then applied to assess tumor vascularization. Vascularity was classified using the Alder semi-quantitative blood flow grading method: grade 0–I (low vascularity) and grade II–III (high vascularity) (12).
SRUS image analysis was conducted using the “URM Video” mode, with the region of interest (ROI) encompassing the lesion and surrounding tissue. After defining the ROI, the “Analysis” function was activated, and measurements were performed using density analysis, DV analysis, curvature A/E, and perfusion index tools. Lesion boundaries were manually traced to extract structural parameters (vessel ratio, complexity level, density [max, min, mean], and curvature A/E), hemodynamic parameters (microvascular velocity [max, min, mean]), and comprehensive parameters (perfusion index: velocity × density).
2.6 Definition of SRUS parameters
The vessel ratio was defined as the area of vascular perfusion within the region of interest (ROI) divided by the total area of the ROI.
This parameter reflects the richness of blood supply in the region of interest and may serve as a potential indicator for differential diagnosis and evaluation of disease progression.
The complexity level serves as a metric for describing the degree of structural intricacy within an image. It quantifies complexity as the ratio of variation in graphical detail to changes in measurement scale—a higher value indicates a greater degree of complexity. Based on contrast-enhanced microvascular density maps, the fractal dimension within ROI was calculated, reflecting the morphological complexity of the vascular network in the area.
Vessel density represents the number of microbubbles passing through that point during the acquisition period (typically 10 s). A higher microbubble count corresponds to a greater density value.
Curvature (A/E) was used to describe the tortuosity of the vascular path. A higher value indicated a greater degree of vessel bending.
Vessel velocity was defined as the displacement of microbubbles per unit time within the region of interest (ROI). The perfusion index was calculated as the product of mean velocity and vessel density ratio within the ROI.
Velocity referred to the speed of blood flow, while density represented the quantity of red blood cells. Their product provided a more accurate reflection of tissue perfusion.
2.7 Statistical analysis
Data analysis was performed using R software (version 4.2.1; R Foundation for Statistical Computing, Vienna, Austria). The normality of continuous variables was assessed using the Shapiro-Wilk test. Normally distributed data were expressed as mean ± standard deviation (x ± s) and analyzed using independent-samples t-tests for two-group comparisons, one-way ANOVA for multi-group comparisons, and least significant difference (LSD) post hoc tests for pairwise analysis. Non-normally distributed data were reported as median (Q1, Q3) and analyzed using the Mann-Whitney U test (two-group comparisons) and the Kruskal-Wallis test (multi-group comparisons). Categorical variables were presented as frequencies (%) and analyzed using Pearson’s chi-square test or Fisher’s exact test, as appropriate. A two-tailed P-value <0.05 was considered statistically significant. Variables with P < 0.05 in univariate analyses were incorporated into multivariate logistic regression models, with the condition parameter set as the estimated likelihood ratio test, to construct a nomogram-based prediction model. The predictive performance of the model was assessed using the area under the receiver operating characteristic (ROC) curve (AUC). Model goodness-of-fit was evaluated through the Hosmer-Lemeshow test, with calibration curves generated to demonstrate prediction reliability. Additionally, decision curve analysis (DCA) was employed to quantify the net benefit of the model in stratifying breast cancer incidence risk across clinically relevant probability thresholds.
3 Results
3.1 Comparison of clinical characteristics and conventional ultrasound features between benign and malignant breast lesions
Compared with patients in the benign group, those in the malignant group were significantly older and had larger maximum lesion diameters. Malignant lesions predominantly exhibited marked hypoechogenicity, internal heterogeneity, spiculated or crab claw-like margins, and intralesional microcalcifications, with significantly higher vascularity (all P < 0.05). No significant differences were observed in lesion location, orientation, or growth direction between both groups (P > 0.05, Table 1).
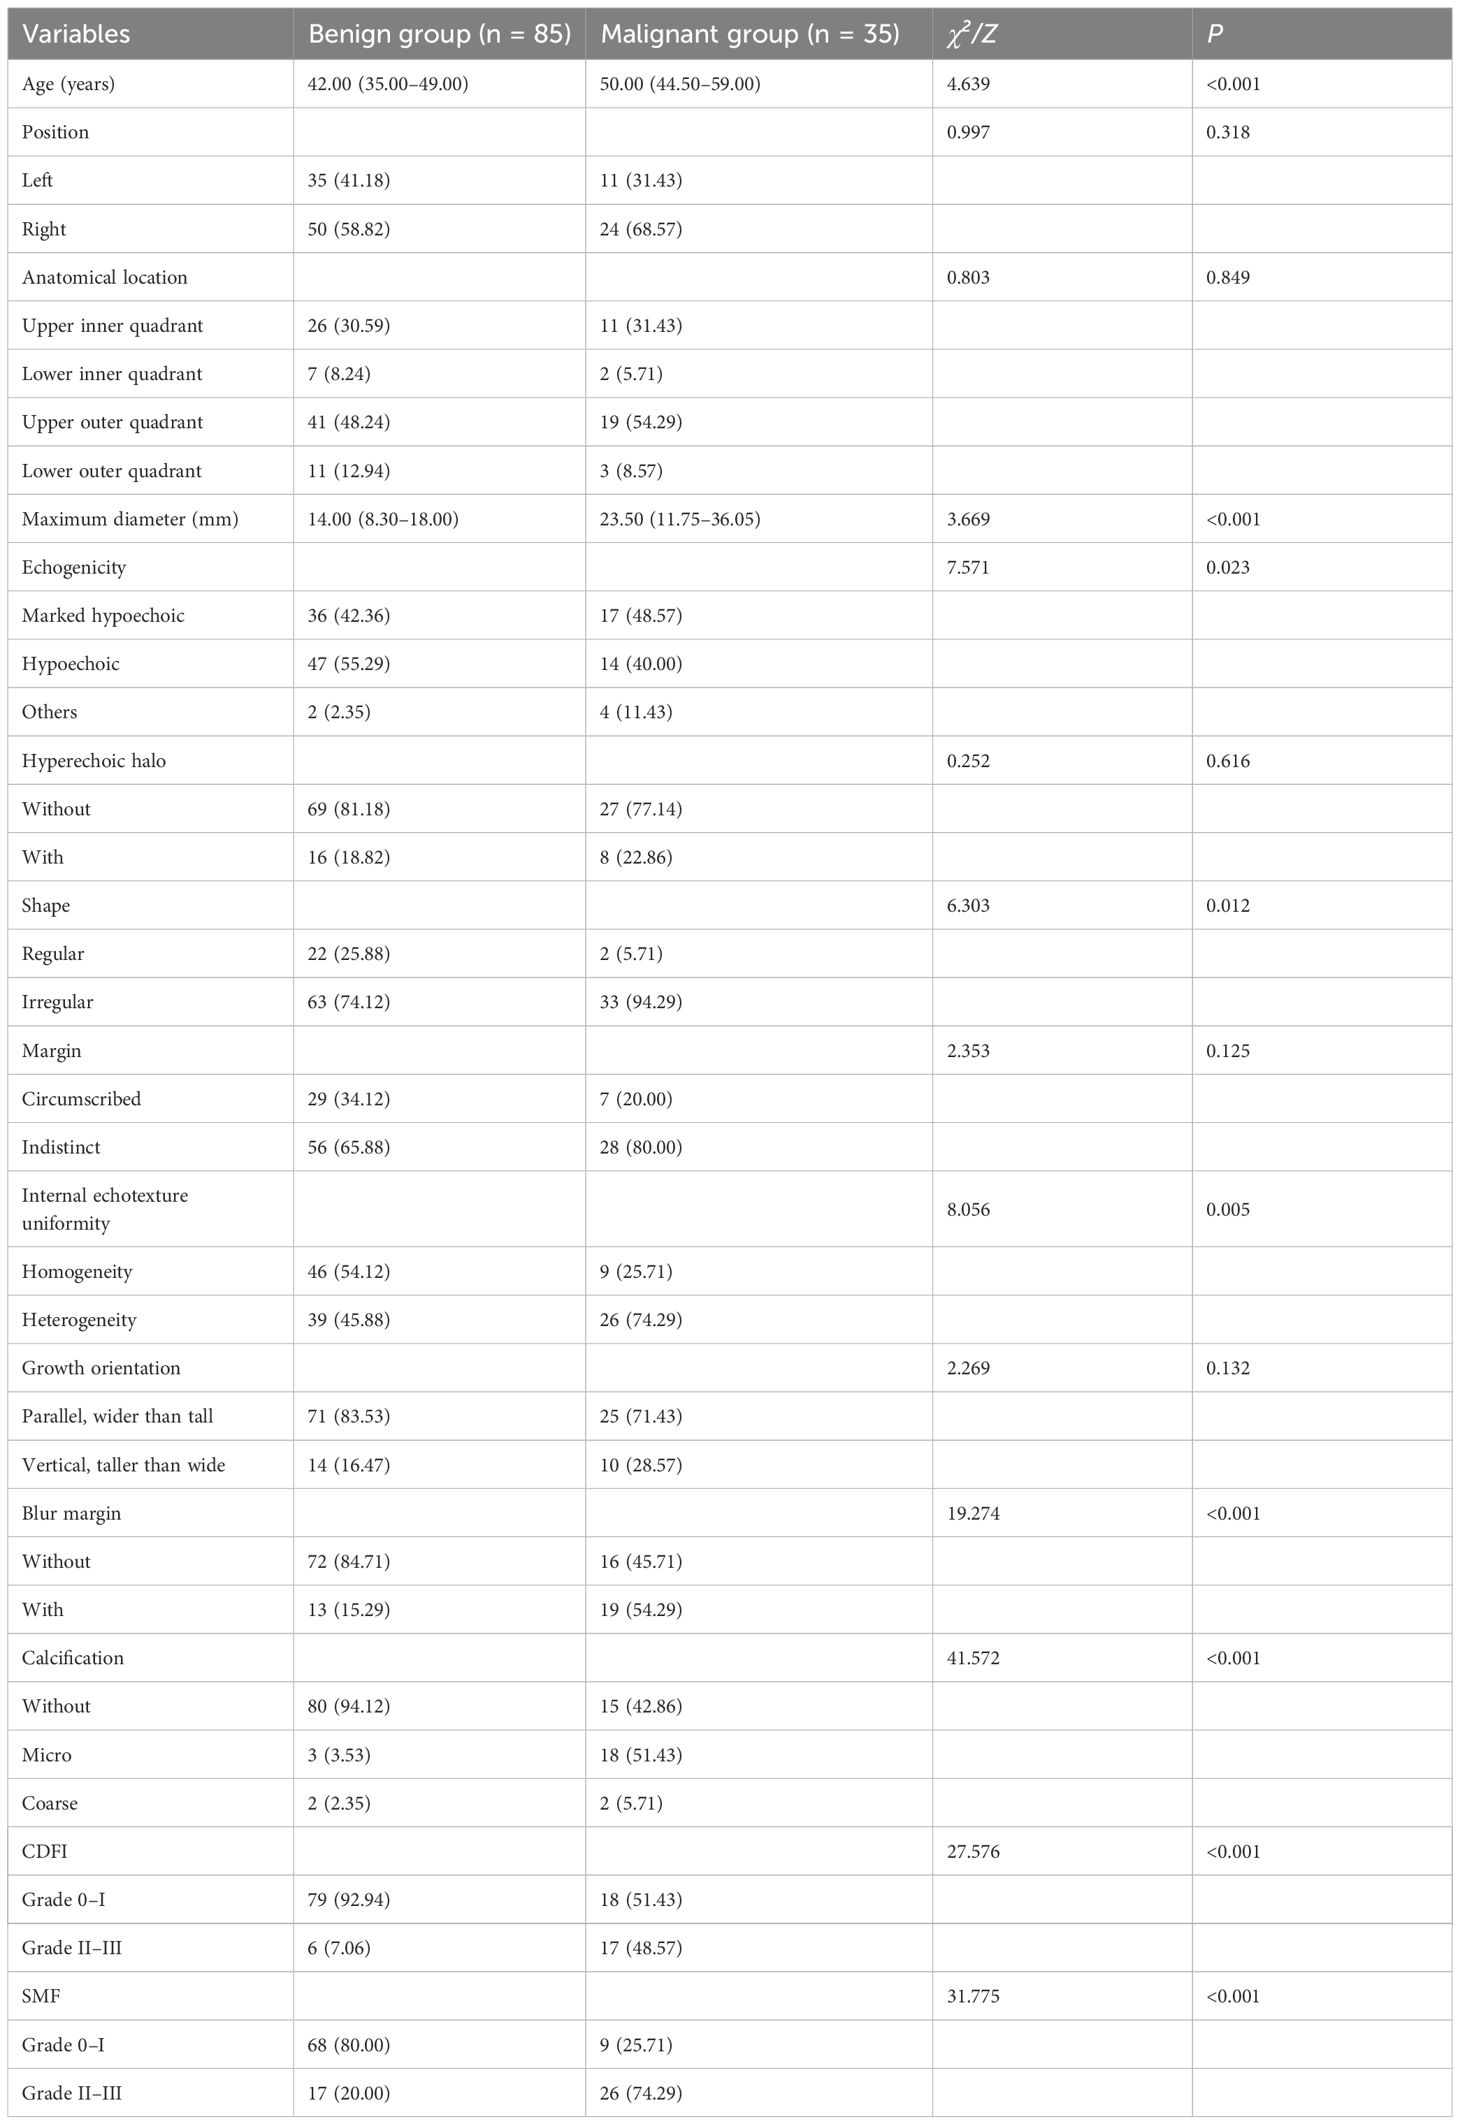
Table 1. Comparison of clinical characteristics and conventional ultrasound features between benign and malignant breast nodule groups.
3.2 Comparison of SRUS parameters between benign and malignant breast lesions
Significant differences in SRUS parameters were observed between benign and malignant lesions, including vessel ratio, complexity level, maximum/mean density, maximum/mean velocity, curvature (A/E), and perfusion index, with malignant lesions exhibiting higher values (P < 0.05). However, minimum microvascular density and velocity showed no significant intergroup differences (P > 0.05, Table 2).
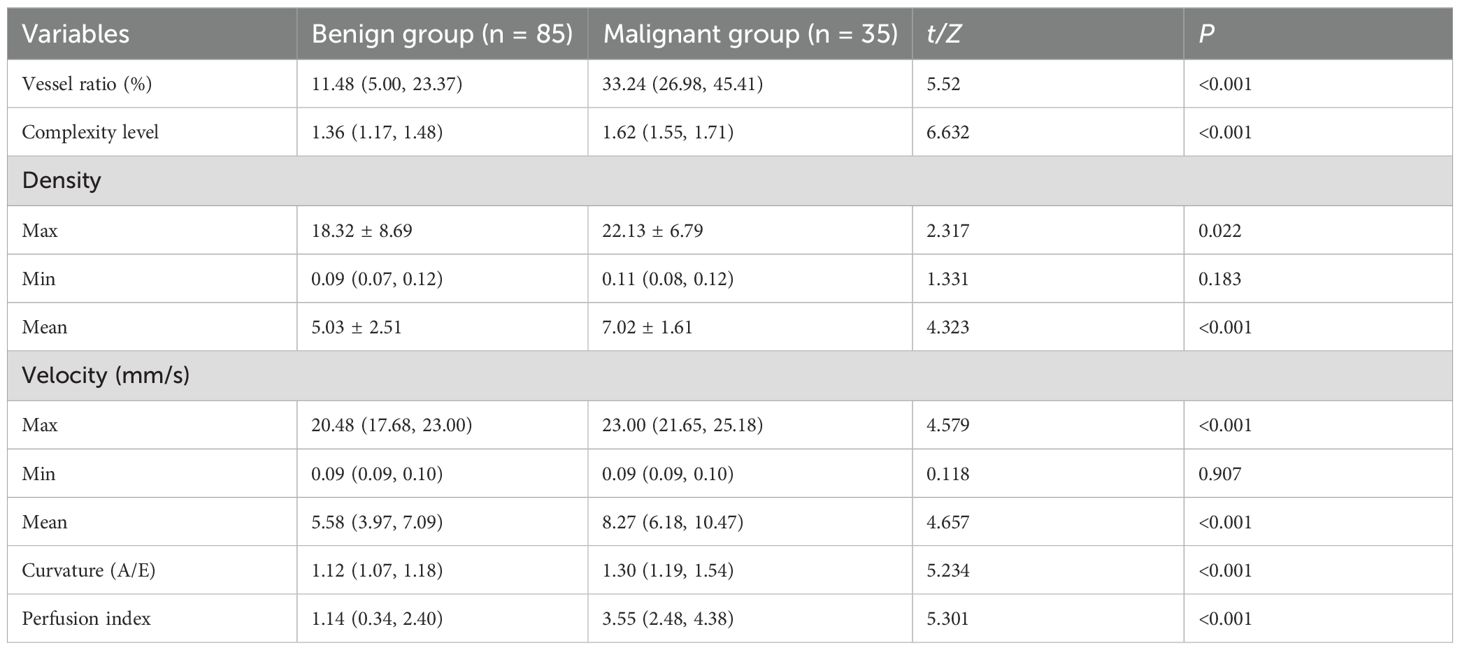
Table 2. Comparison of SRUS parameters between the benign and malignant breast nodule groups.
3.3 Comparison of SRUS parameters across three subgroups and post hoc analyses
Among the three groups (malignant, hypervascular benign, and hypovascular benign), statistically significant differences were found in vessel ratio, complexity level, maximum/minimum/mean density, maximum/mean velocity, curvature (A/E), and perfusion index (all P < 0.05). Post hoc pairwise comparisons revealed a hierarchical pattern: malignant > hypervascular benign > hypovascular benign for all significant parameters (all P < 0.05). The minimum microvascular velocity did not differ significantly among groups (P > 0.05). Furthermore, the malignant group exhibited significantly higher values than the hypervascular benign group in microvascular density ratio, vascular complexity, maximum/mean velocity, curvature (A/E), and perfusion index (all P < 0.05, Table 3, Figures 1–3).
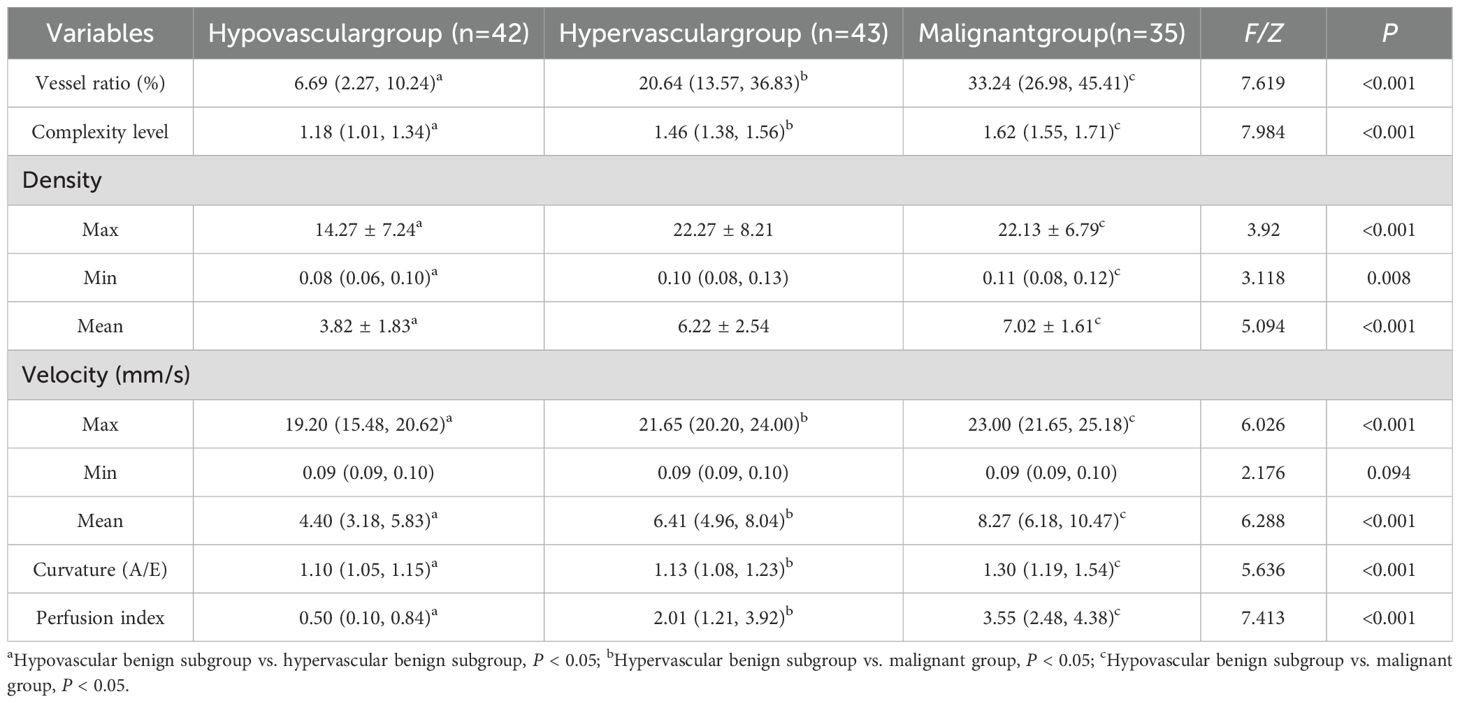
Table 3. Comparison of SRUS parameters among the three groups.
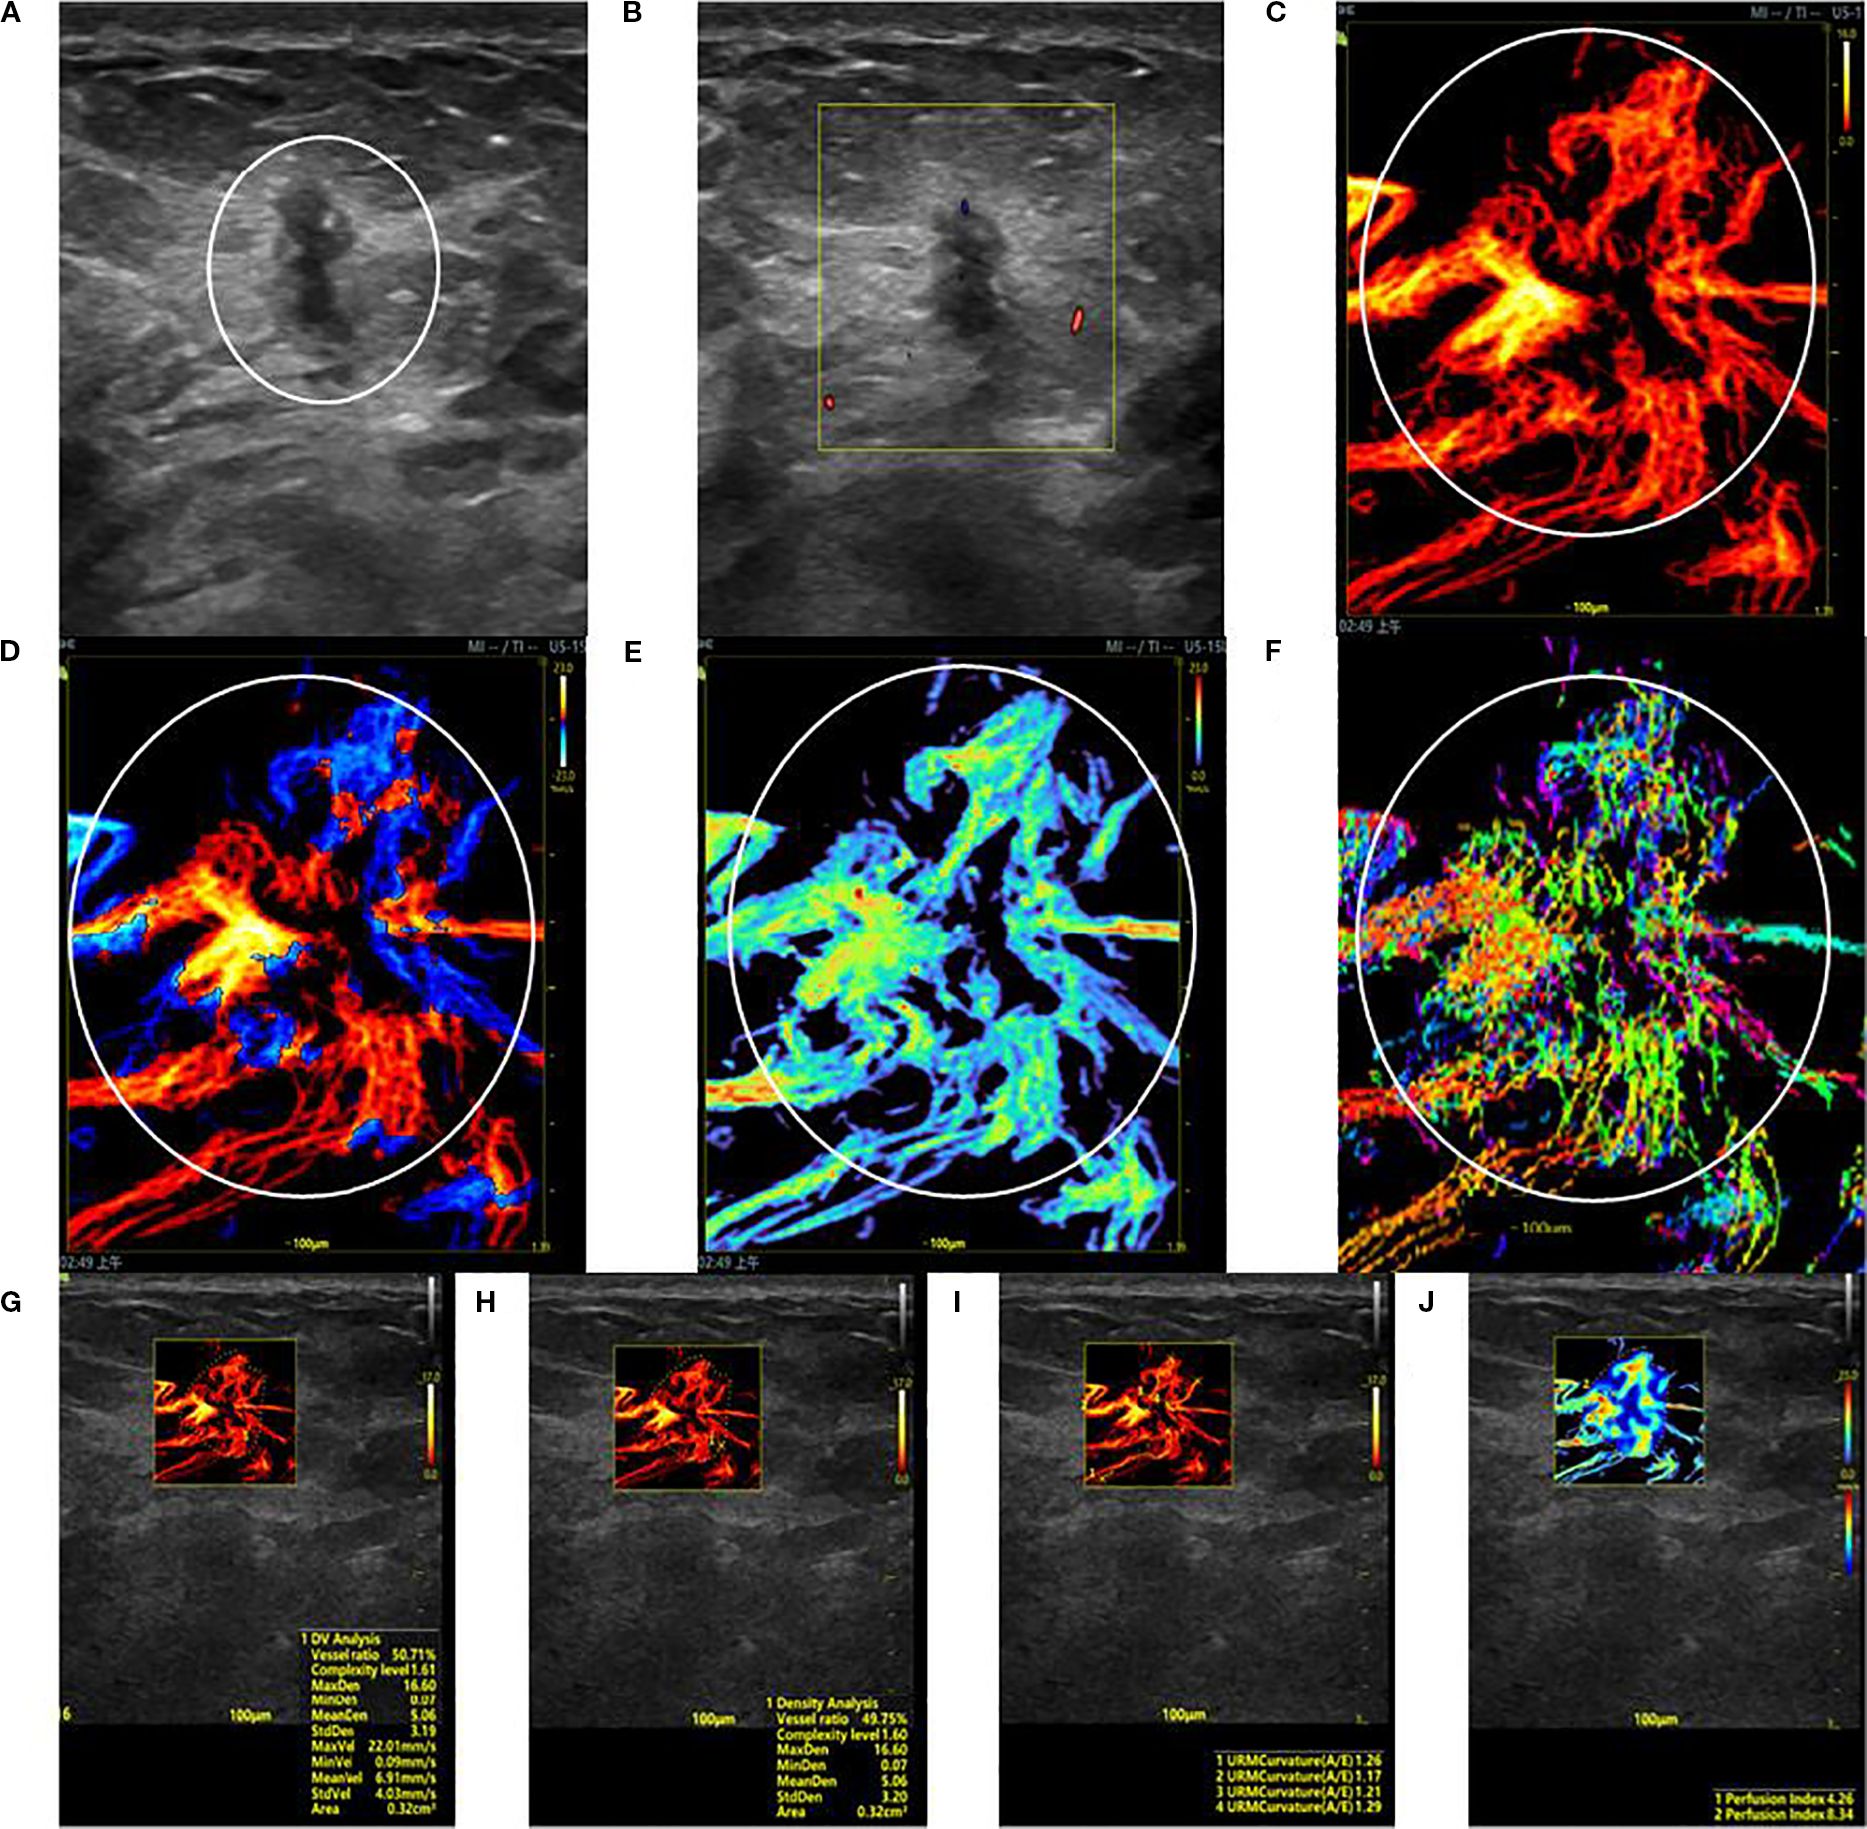
Figure 1. SRUS imaging of a malignant breast lesion: (A) Grayscale ultrasound findings suggest the presence of a hypoechoic mass (3.9 × 4.8 mm) with longitudinal orientation, ill-defined margins, irregular shape, heterogeneous internal echogenicity, angular edges, and multiple microcalcifications. (B) SMF image with Alder grade I classification. Density map (C), Orientation map (D), Velocity map (E), and Angle map (F), with the lesion region delineated by circular markers based on SRUS images and associated dynamic sequences. (G–J) SRUS parameter quantification panels: density ratio (49.75%), complexity level (1.60), maximum density (16.60), minimum density (0.07), mean density (5.06), maximum velocity (22.01 mm/s), minimum velocity (0.09 mm/s), mean velocity (6.91 mm/s), curvature A/E (1.26), and Perfusion Index (4.26).
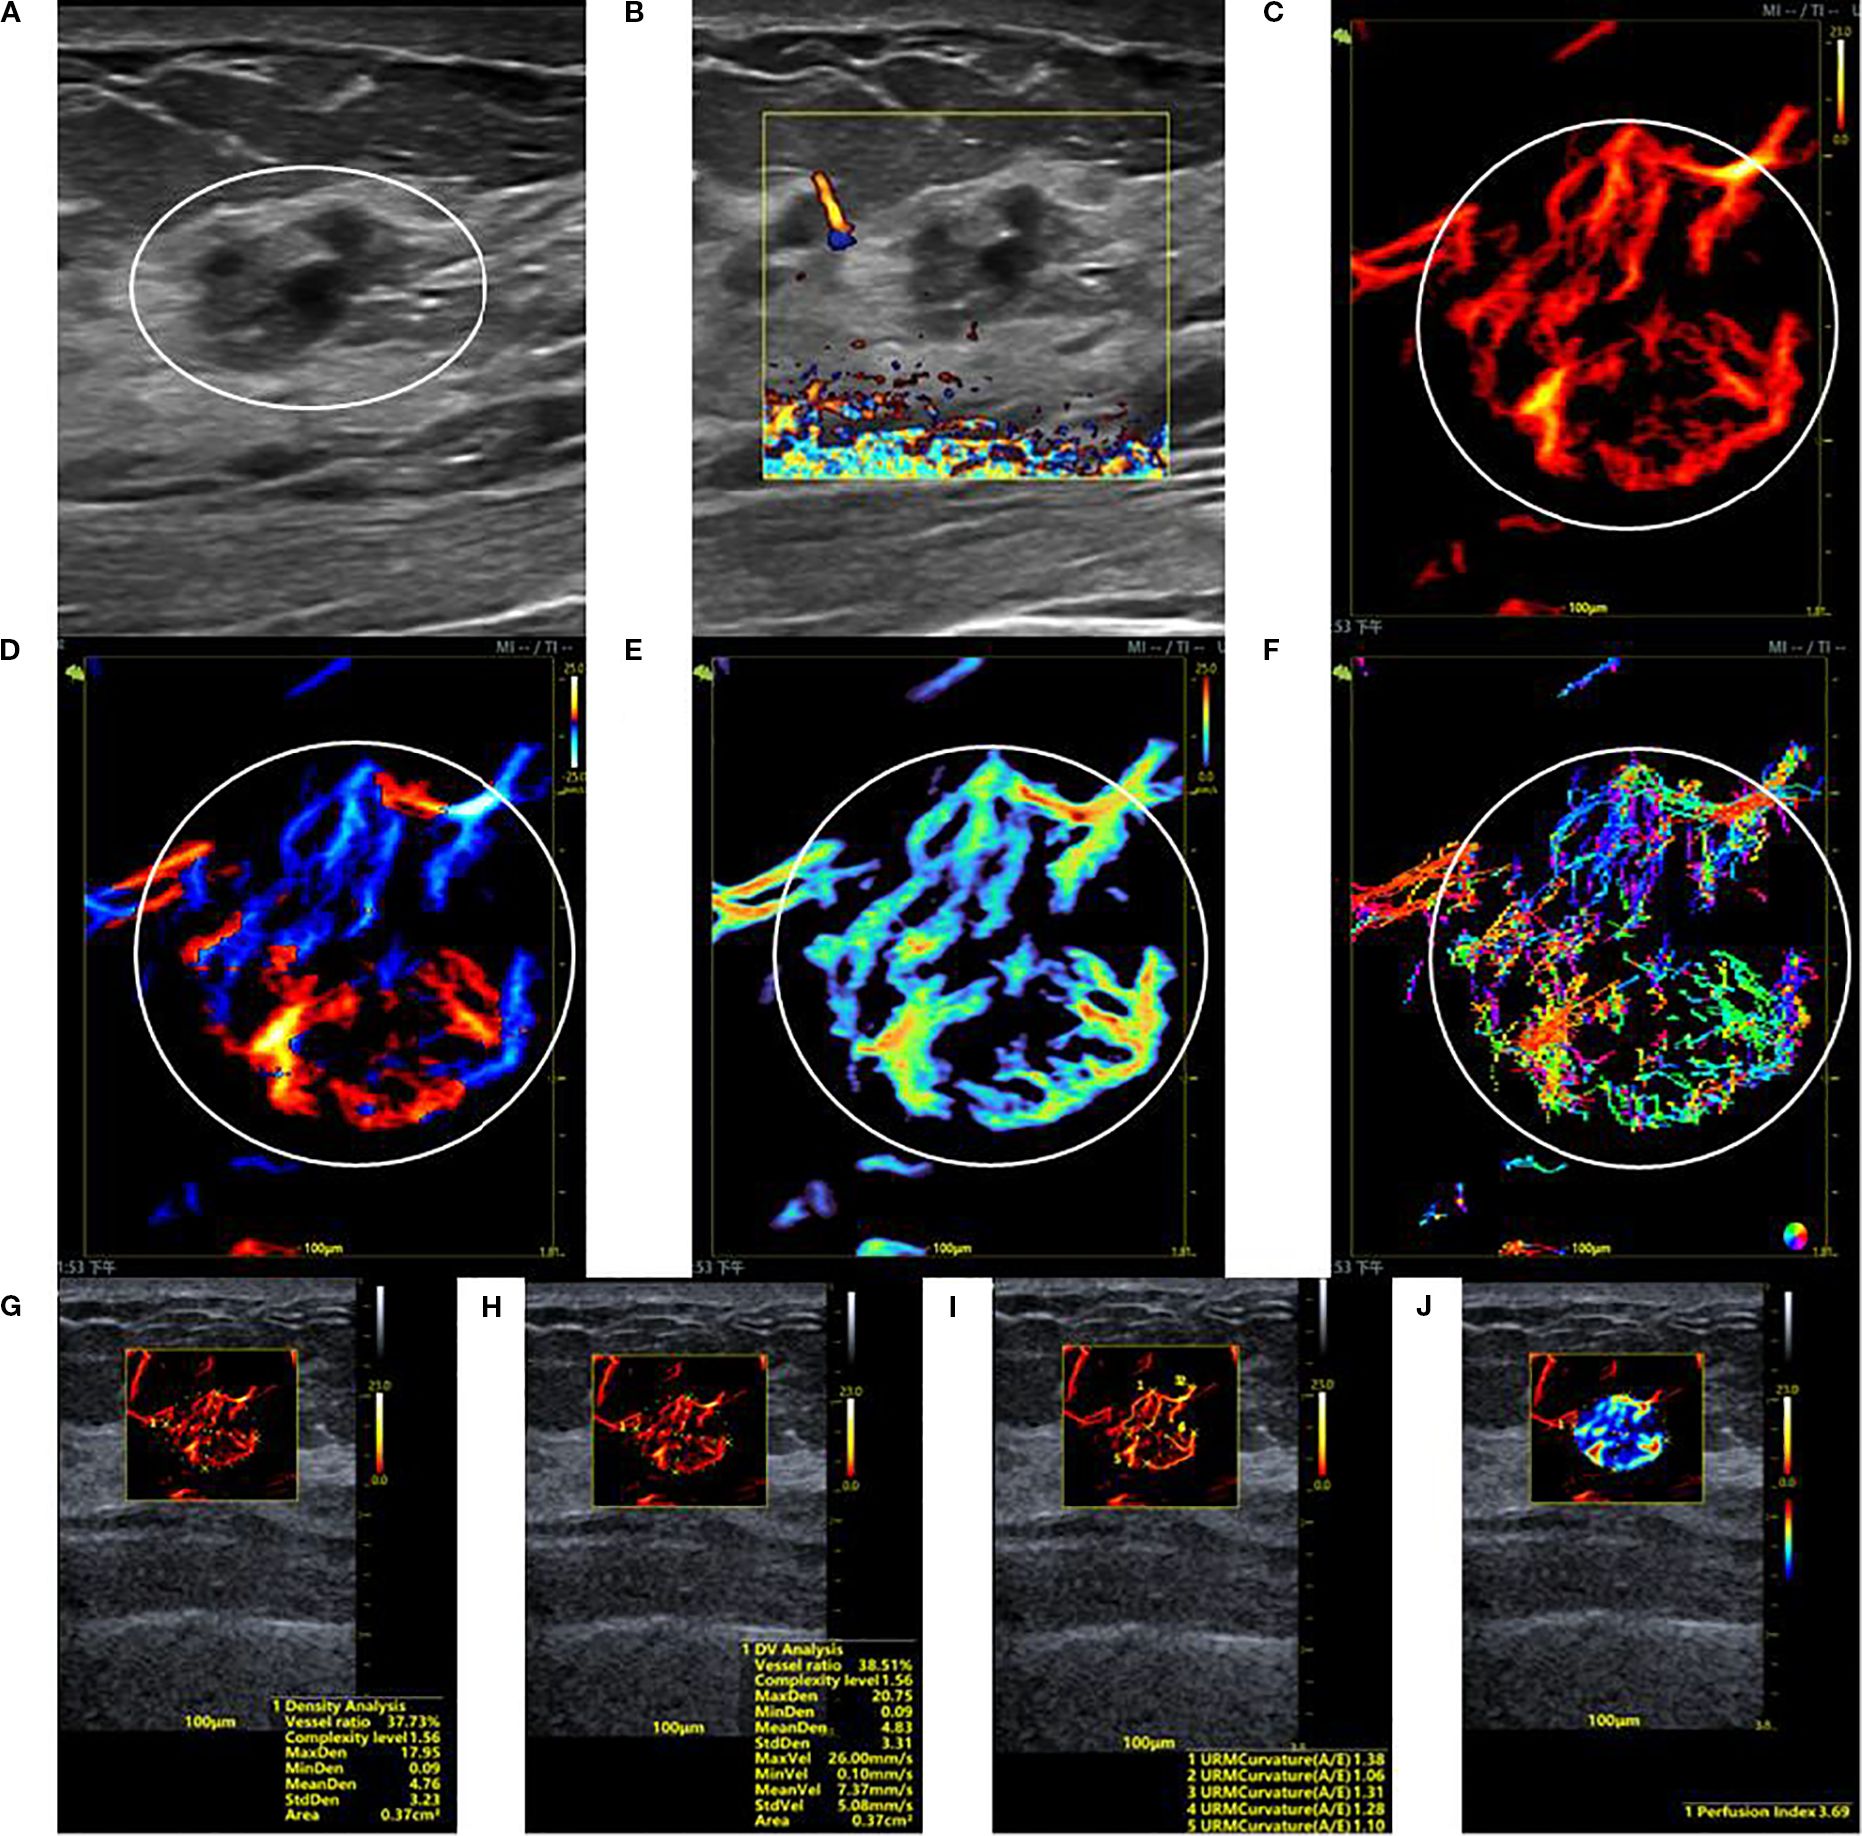
Figure 2. SRUS imaging of a hypervascular benign breast lesion: (A) Grayscale ultrasound findings suggest the presence of a hypoechoic mass (15.2 × 10.0 mm) with parallel orientation, ill-defined margins, irregular shape, and heterogeneous internal echogenicity. (B) SMF image classified as Alder grade 0. Density map (C), Orientation map (D), Velocity map (E), and Angle map (F), with the lesion region delineated by circular markers based on SRUS images and associated dynamic sequences. (G–J) SRUS parameter quantification panels: density ratio (37.73%), complexity level (1.56), maximum density (17.95), minimum density (0.09), mean density (4.76), maximum velocity (26.00 mm/s), minimum velocity (0.10 mm/s), mean velocity (7.37 mm/s), curvature A/E (1.28), and Perfusion Index (3.69).
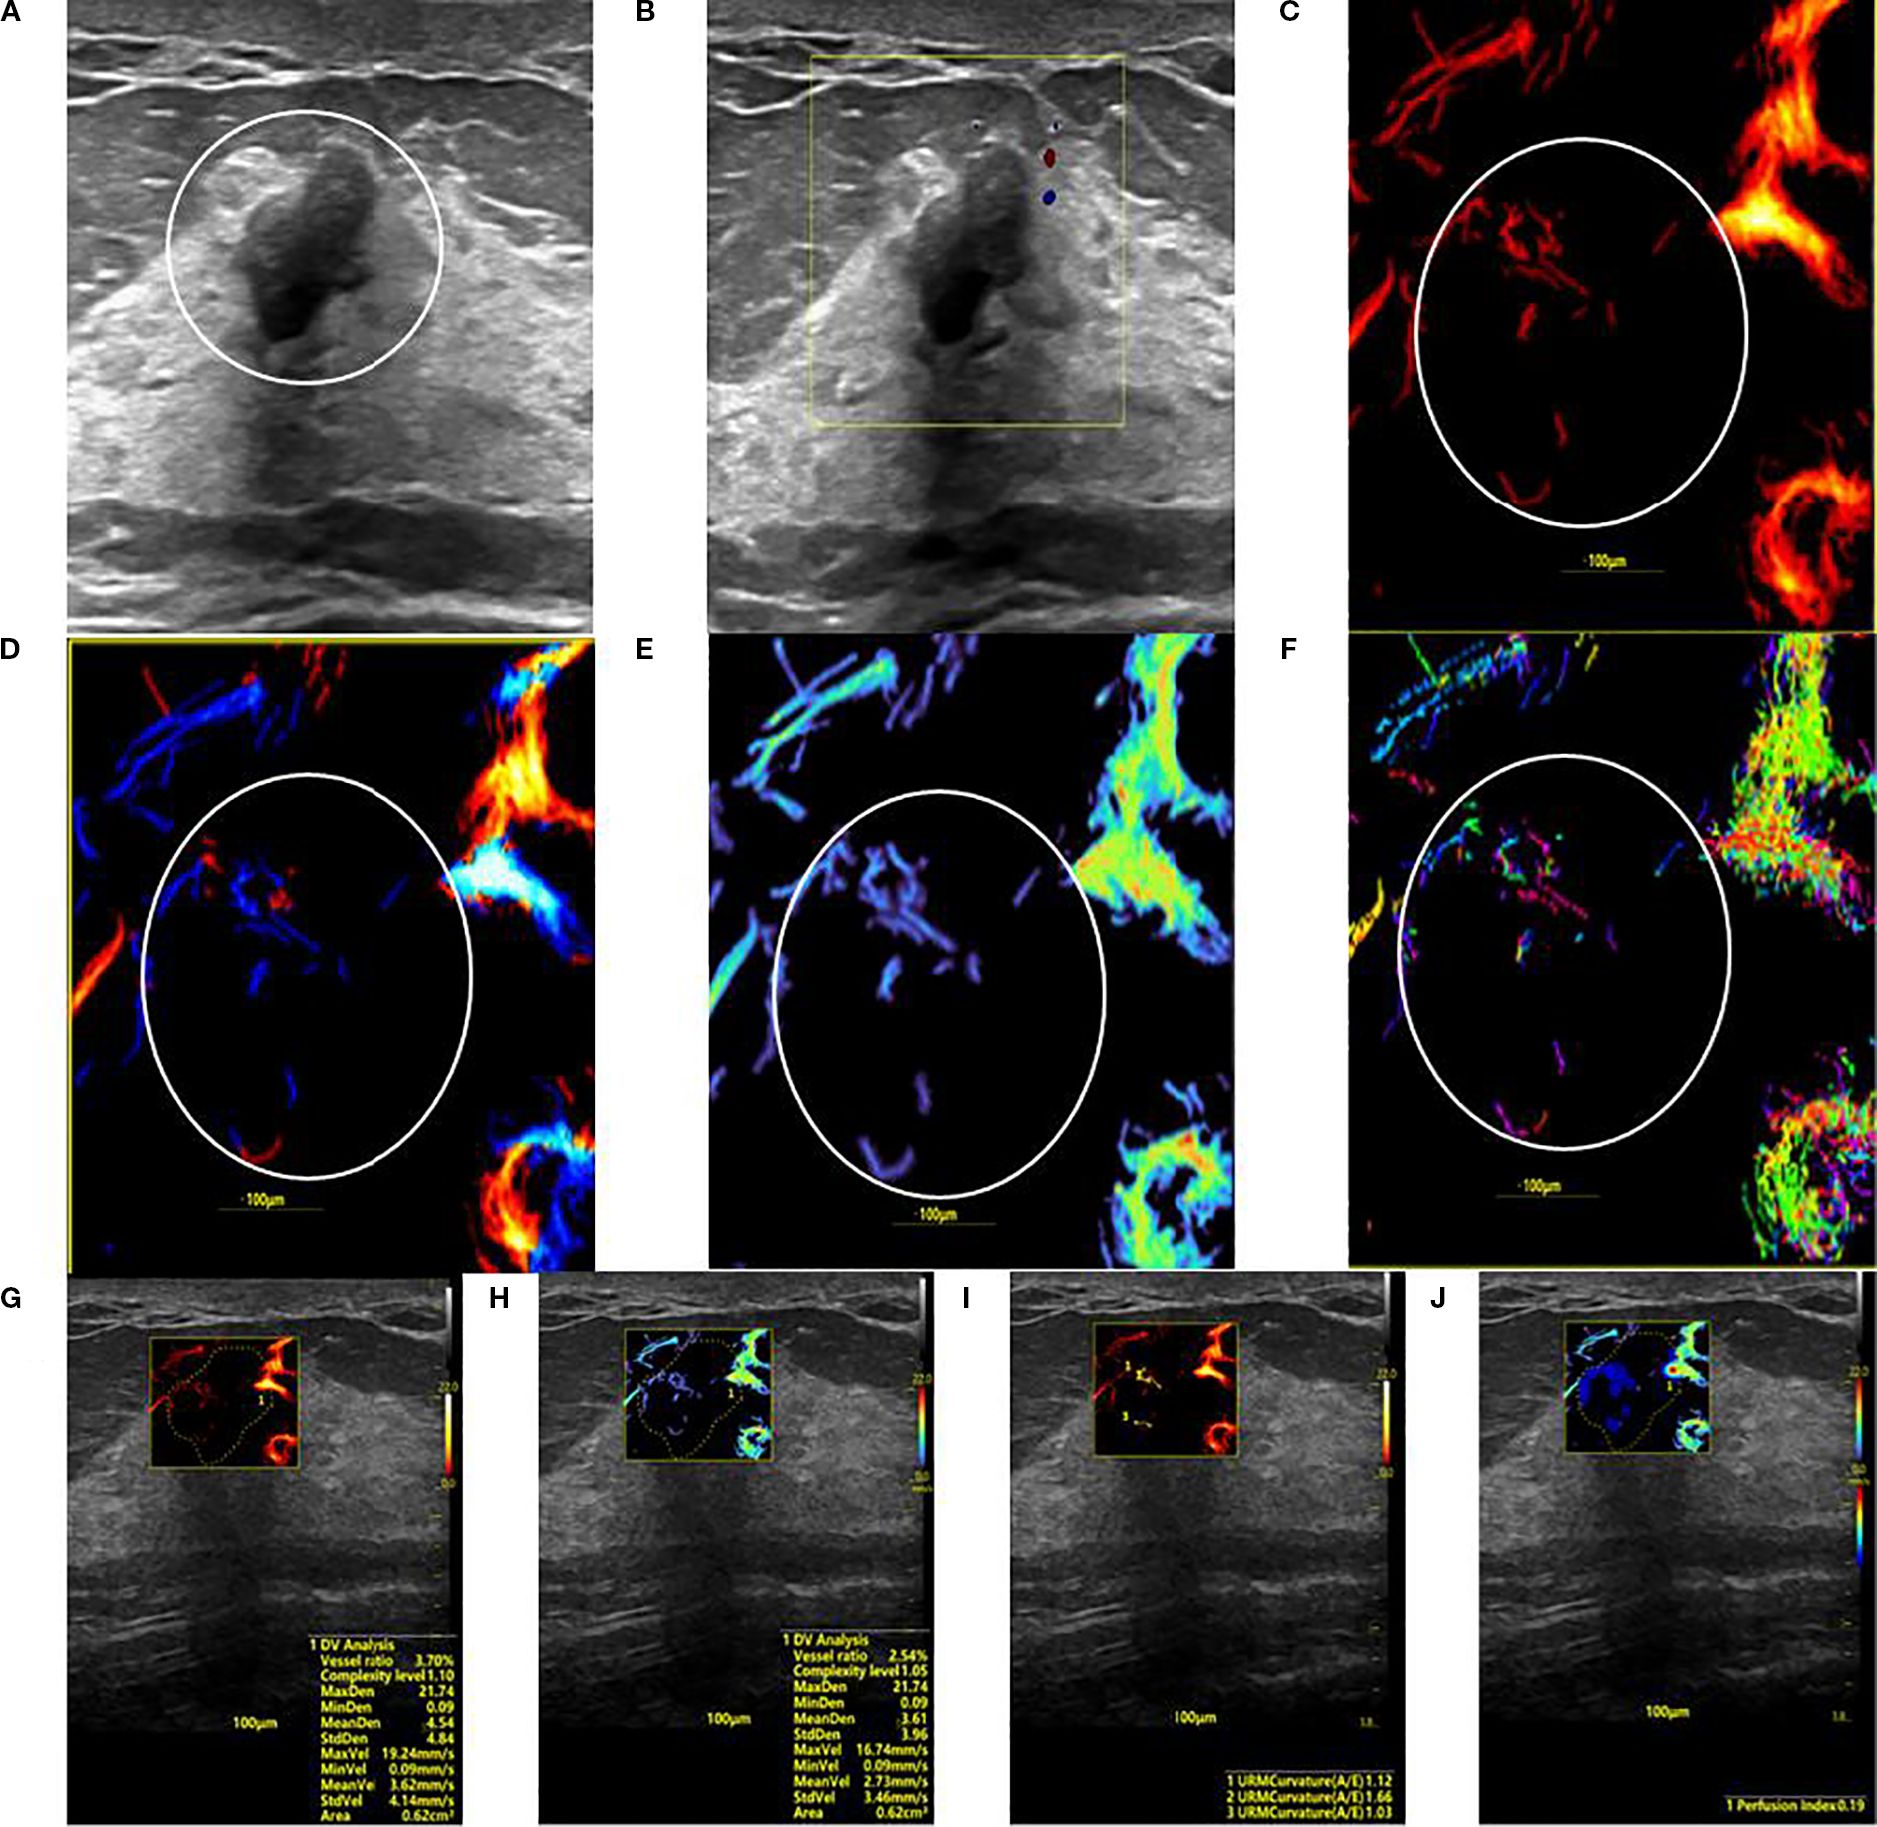
Figure 3. SRUS imaging of a hypovascular benign breast lesion: (A) Grayscale ultrasound findings suggest the presence of a hypoechoic mass (8.3 × 5.1 mm) with parallel orientation, well-defined margins, irregular shape, and heterogeneous internal echogenicity. (B) SMF image categorized as Alder grade 0. Density map (C), Orientation map (D), Velocity map (E), and Angle map (F), with the lesion region delineated by circular markers based on SRUS images and associated dynamic sequences. (G–J) SRUS parameter quantification panels: density ratio (2.79%), complexity level (1.05), maximum density (21.74), minimum density (0.09), mean density (3.61), maximum velocity (16.74 mm/s), minimum velocity (0.09 mm/s), mean velocity (2.73 mm/s), curvature A/E (1.12), and Perfusion Index (0.19).
3.4 Model construction
Multivariate logistic regression analysis incorporated variables with statistically significant differences. Max vel, curvature (A/E), and complexity level emerged as independent predictors for distinguishing benign from malignant BI-RADS category 4 lesions: OR = 1.848 (95% CI: 1.205–3.122), OR = 2.162 (95% CI: 1.981–2.323), and OR = 1.772 (95% CI: 1.608–1.942; all P < 0.05, Table 4). Additionally, curvature (A/E) and complexity level independently discriminated hypervascular benign from malignant BI-RADS 4 lesions: OR = 1.808 (95% CI: 1.612–1.987), OR = 1.952 (95% CI: 1.804–2.181; both P < 0.05, Table 5). Separate nomogram prediction models were developed based on these variables, with breast cancer occurrence as the endpoint (Figures 4, 5). The model assigned individual scores to each risk factor, and the sum of these scores corresponded to the predicted probability of breast cancer, where higher totals indicate an elevated malignancy risk.
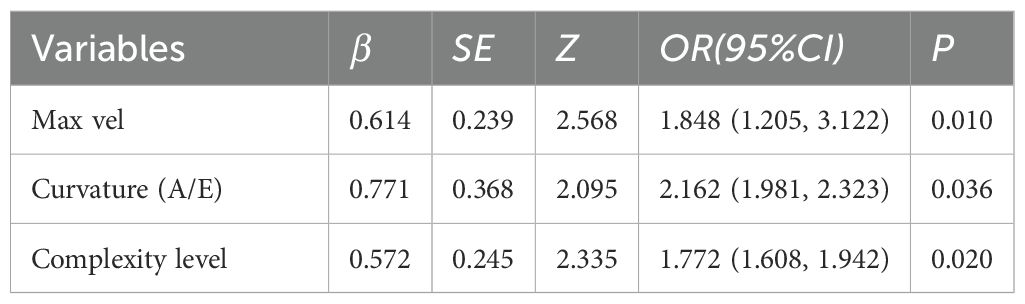
Table 4. Multivariable logistic regression analysis of SRUS parameters in differentiating benign from malignant breast nodules.
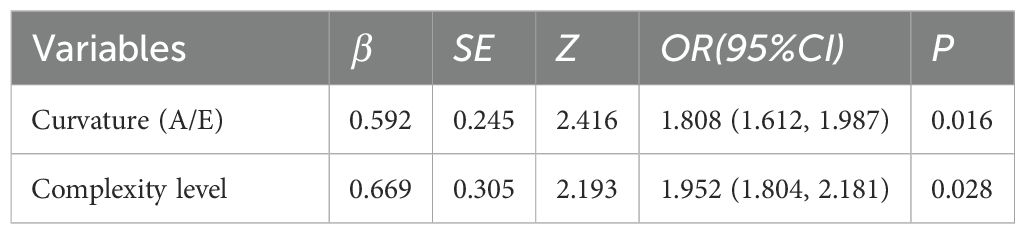
Table 5. Multivariable logistic regression analysis of SRUS parameters for differentiating hypervascular benign from malignant breast lesions.
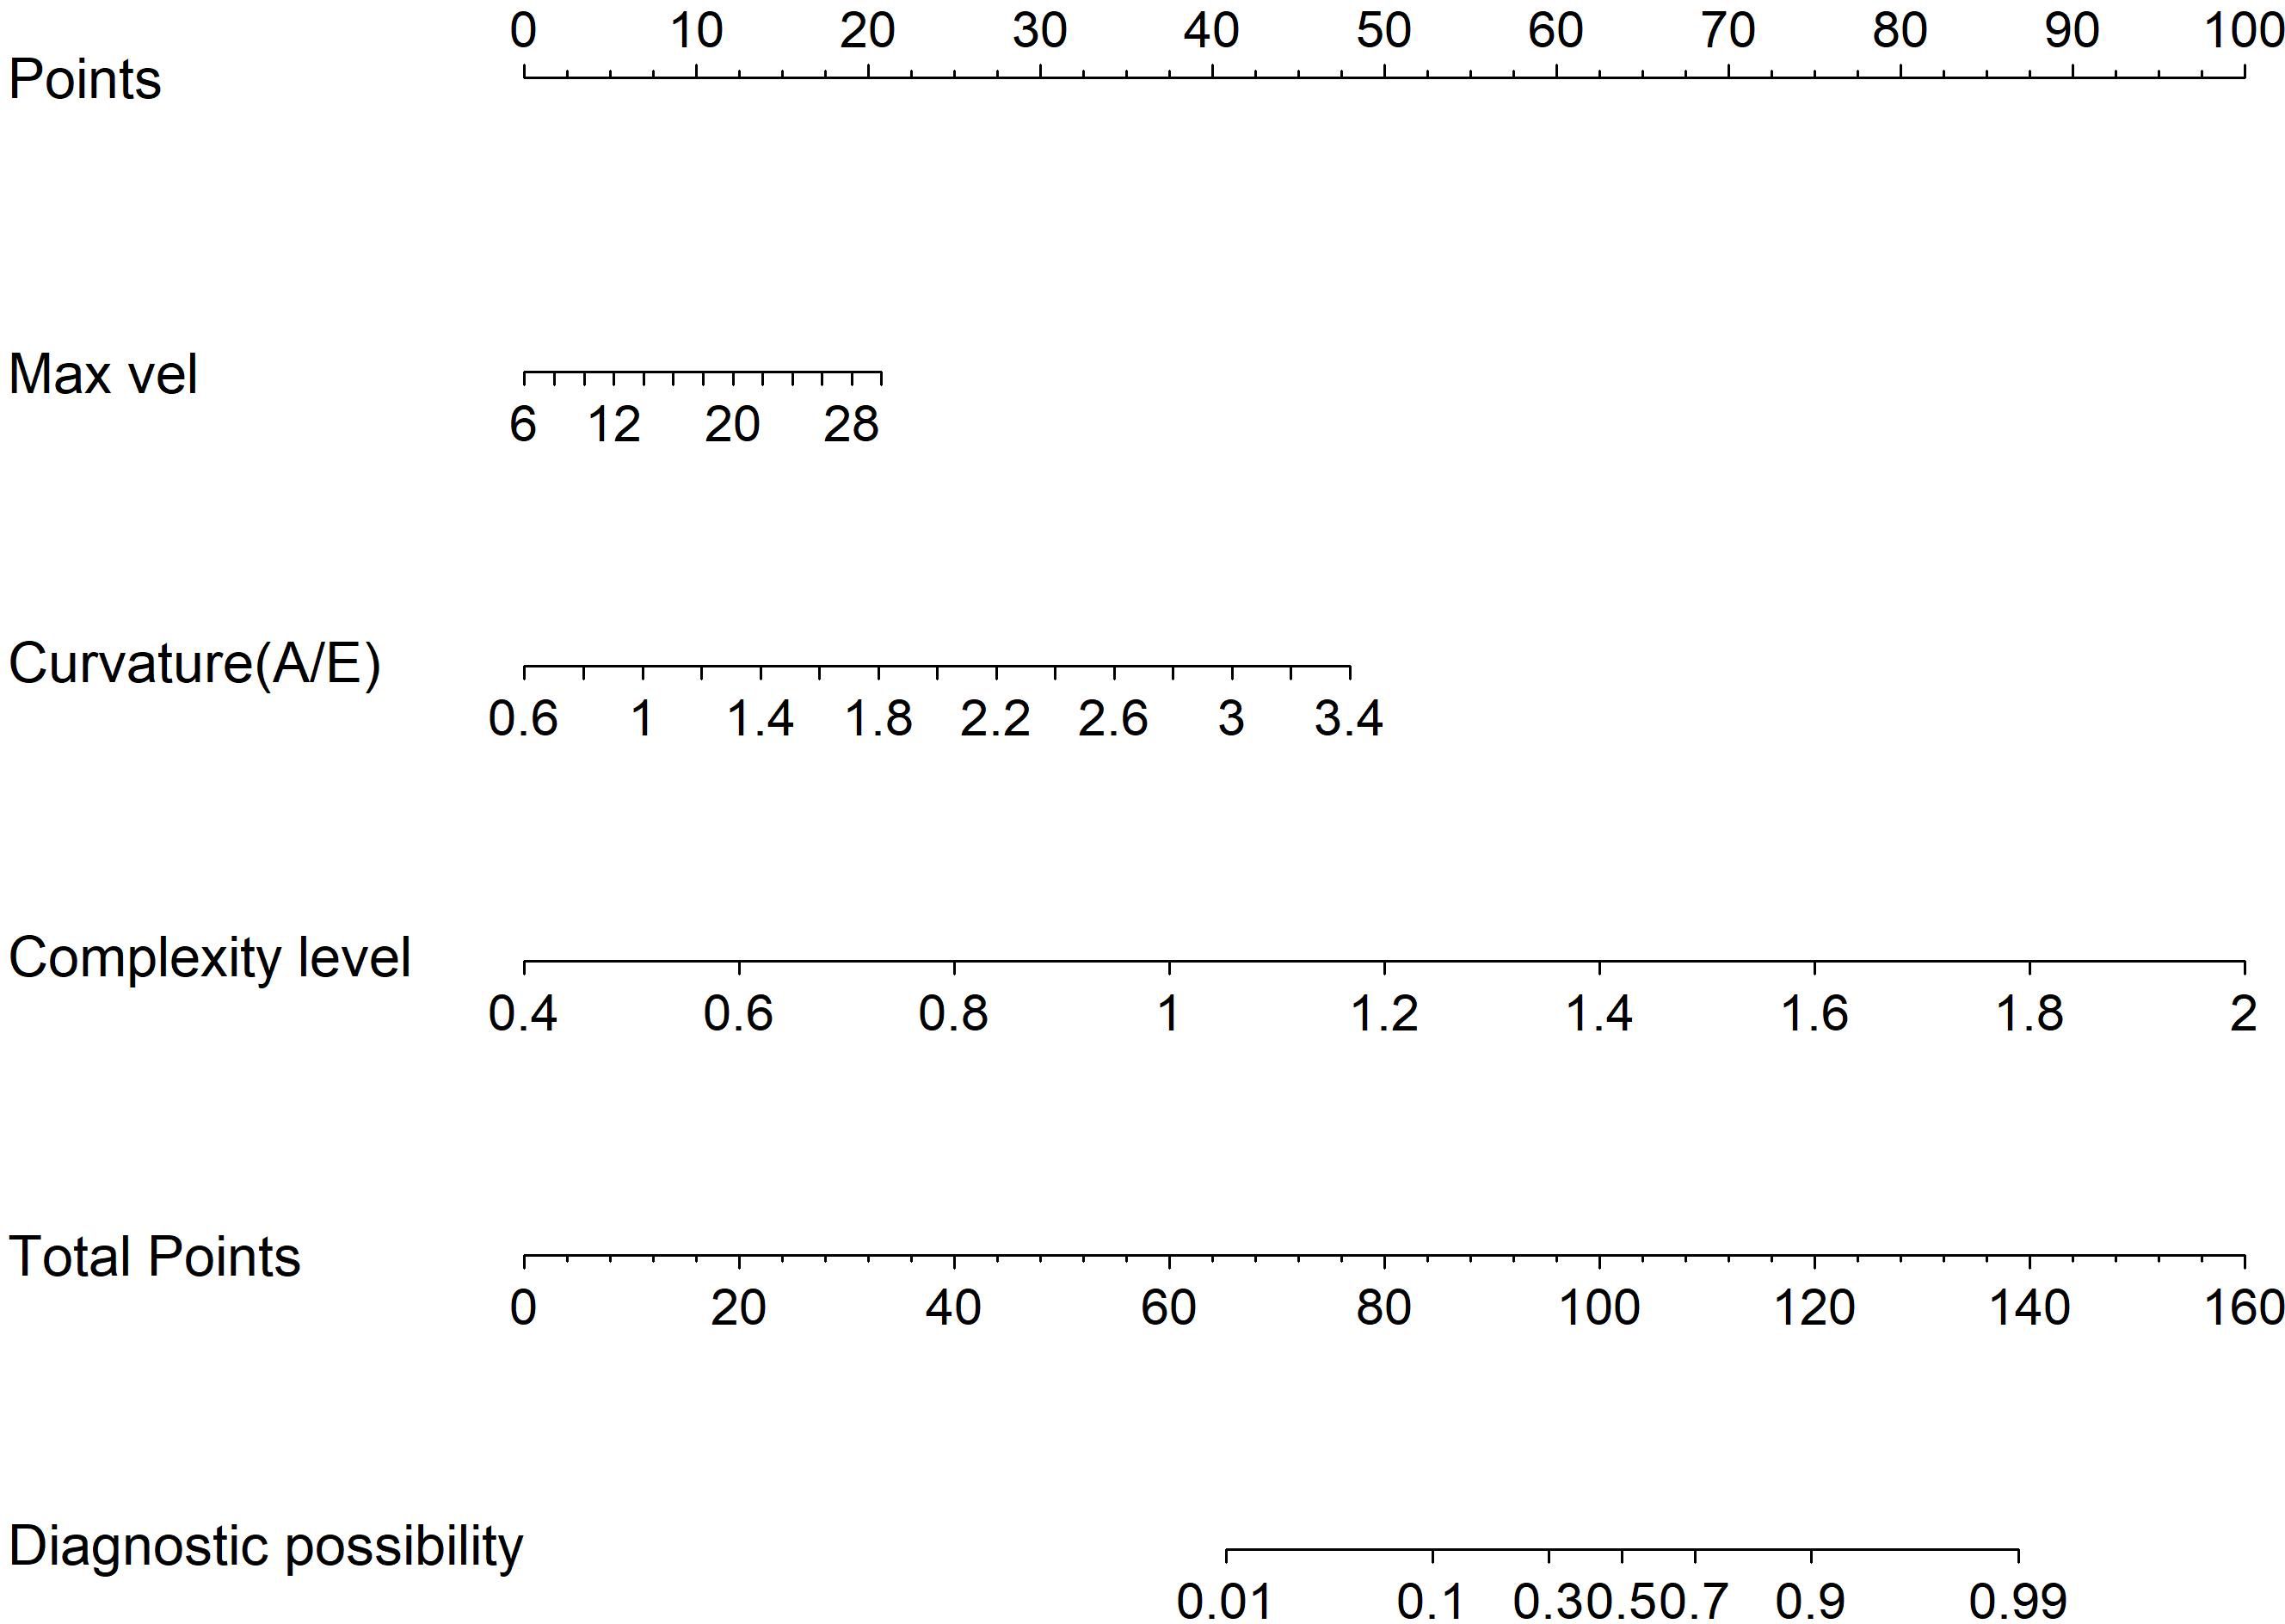
Figure 4. Model 1: Nomogram for discriminating benign from malignant BI-RADS category 4 breast lesions using URM parameters.
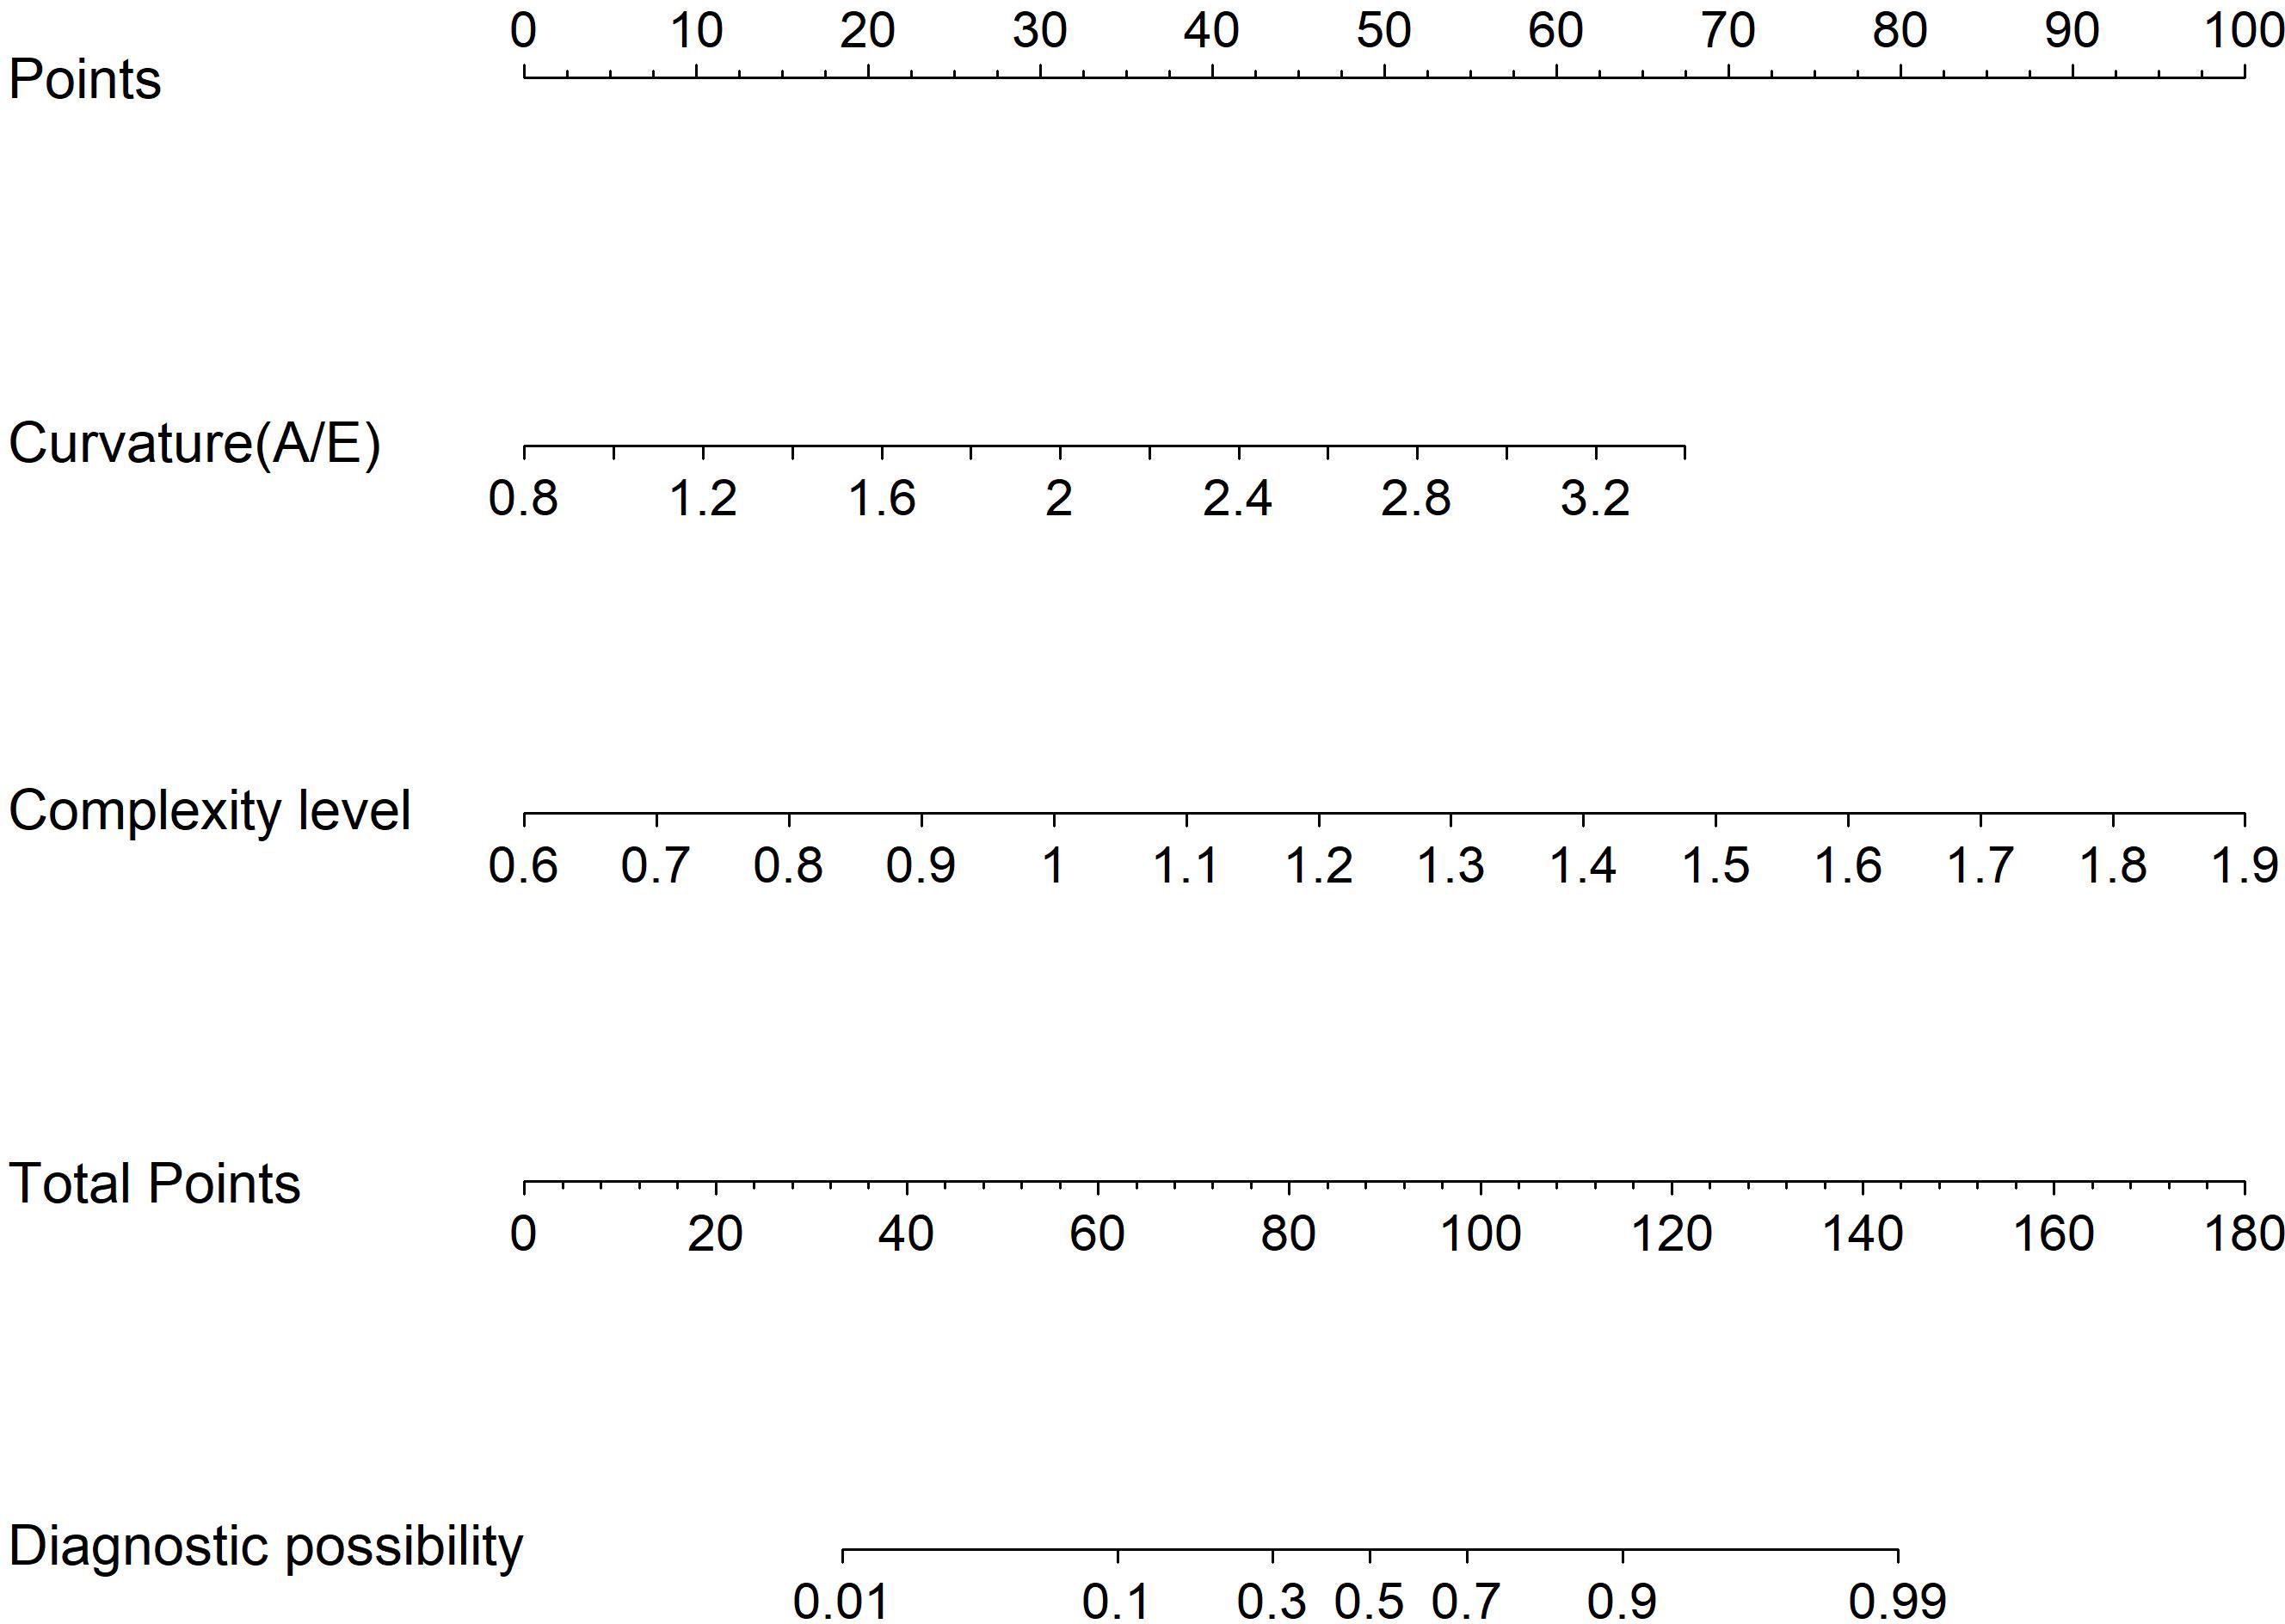
Figure 5. Model 2: Nomogram for differentiating hypervascular benign and malignant BI-RADS category 4 breast lesions based on URM parameters.
3.5 Model validation
The SRUS-based nomogram for discriminating benign from malignant lesions demonstrated an AUC of 0.899 (95% CI: 0.844–0.953), with a sensitivity of 94.3% and a specificity of 76.5% at the optimal cutoff of 0.242. By comparison, CDFI and SMF showed lower AUC values (0.707 and 0.771, respectively), with sensitivities of 68.6% and 80.0%, and specificities of 72.9% and 65.9%, respectively (Figure 6).
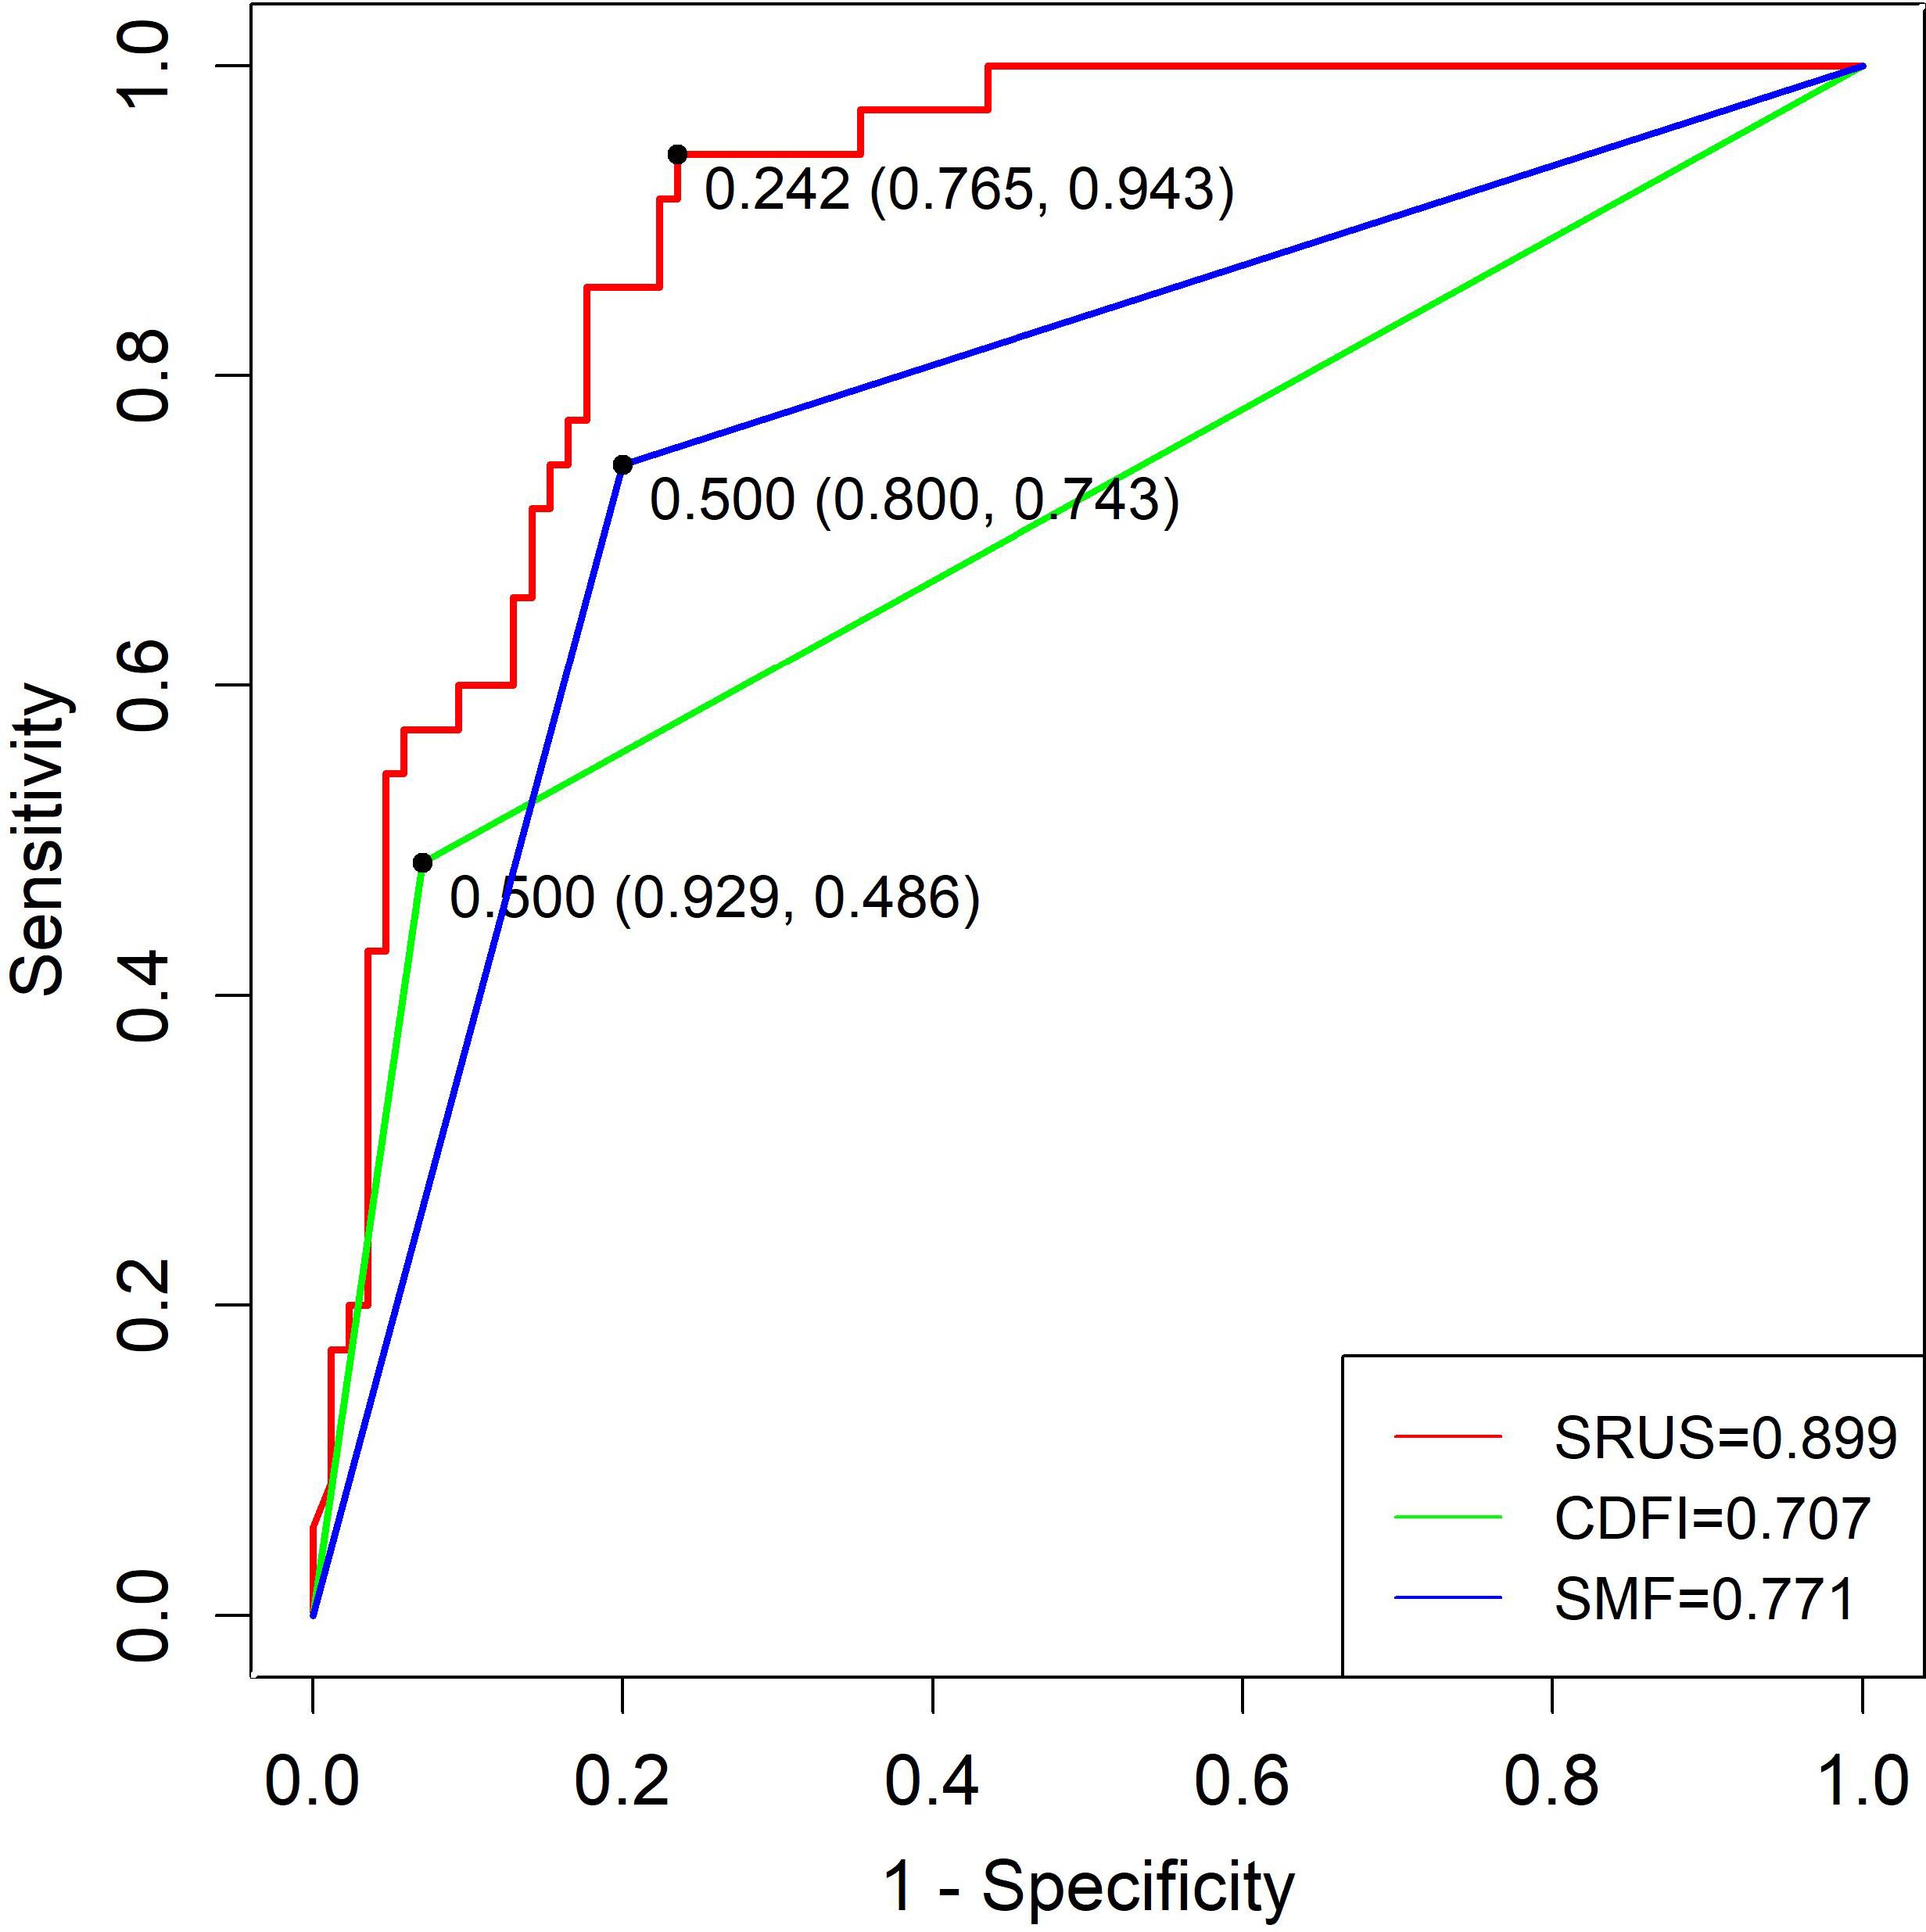
Figure 6. ROC curves of SRUS, CDFI, and SMF for the differentiation of malignant and benign breast nodules.
Regarding distinguishing malignant from hypervascular benign lesions, the SRUS model achieved an AUC of 0.816 (95% CI: 0.721–0.910), with 65.1% sensitivity and 88.6% specificity at a cutoff of 0.344. CDFI and SMF yielded AUCs of 0.708 and 0.755, with corresponding sensitivities of 74.3% and 77.1% and specificities of 62.8% and 65.1%, respectively (Figure 7).
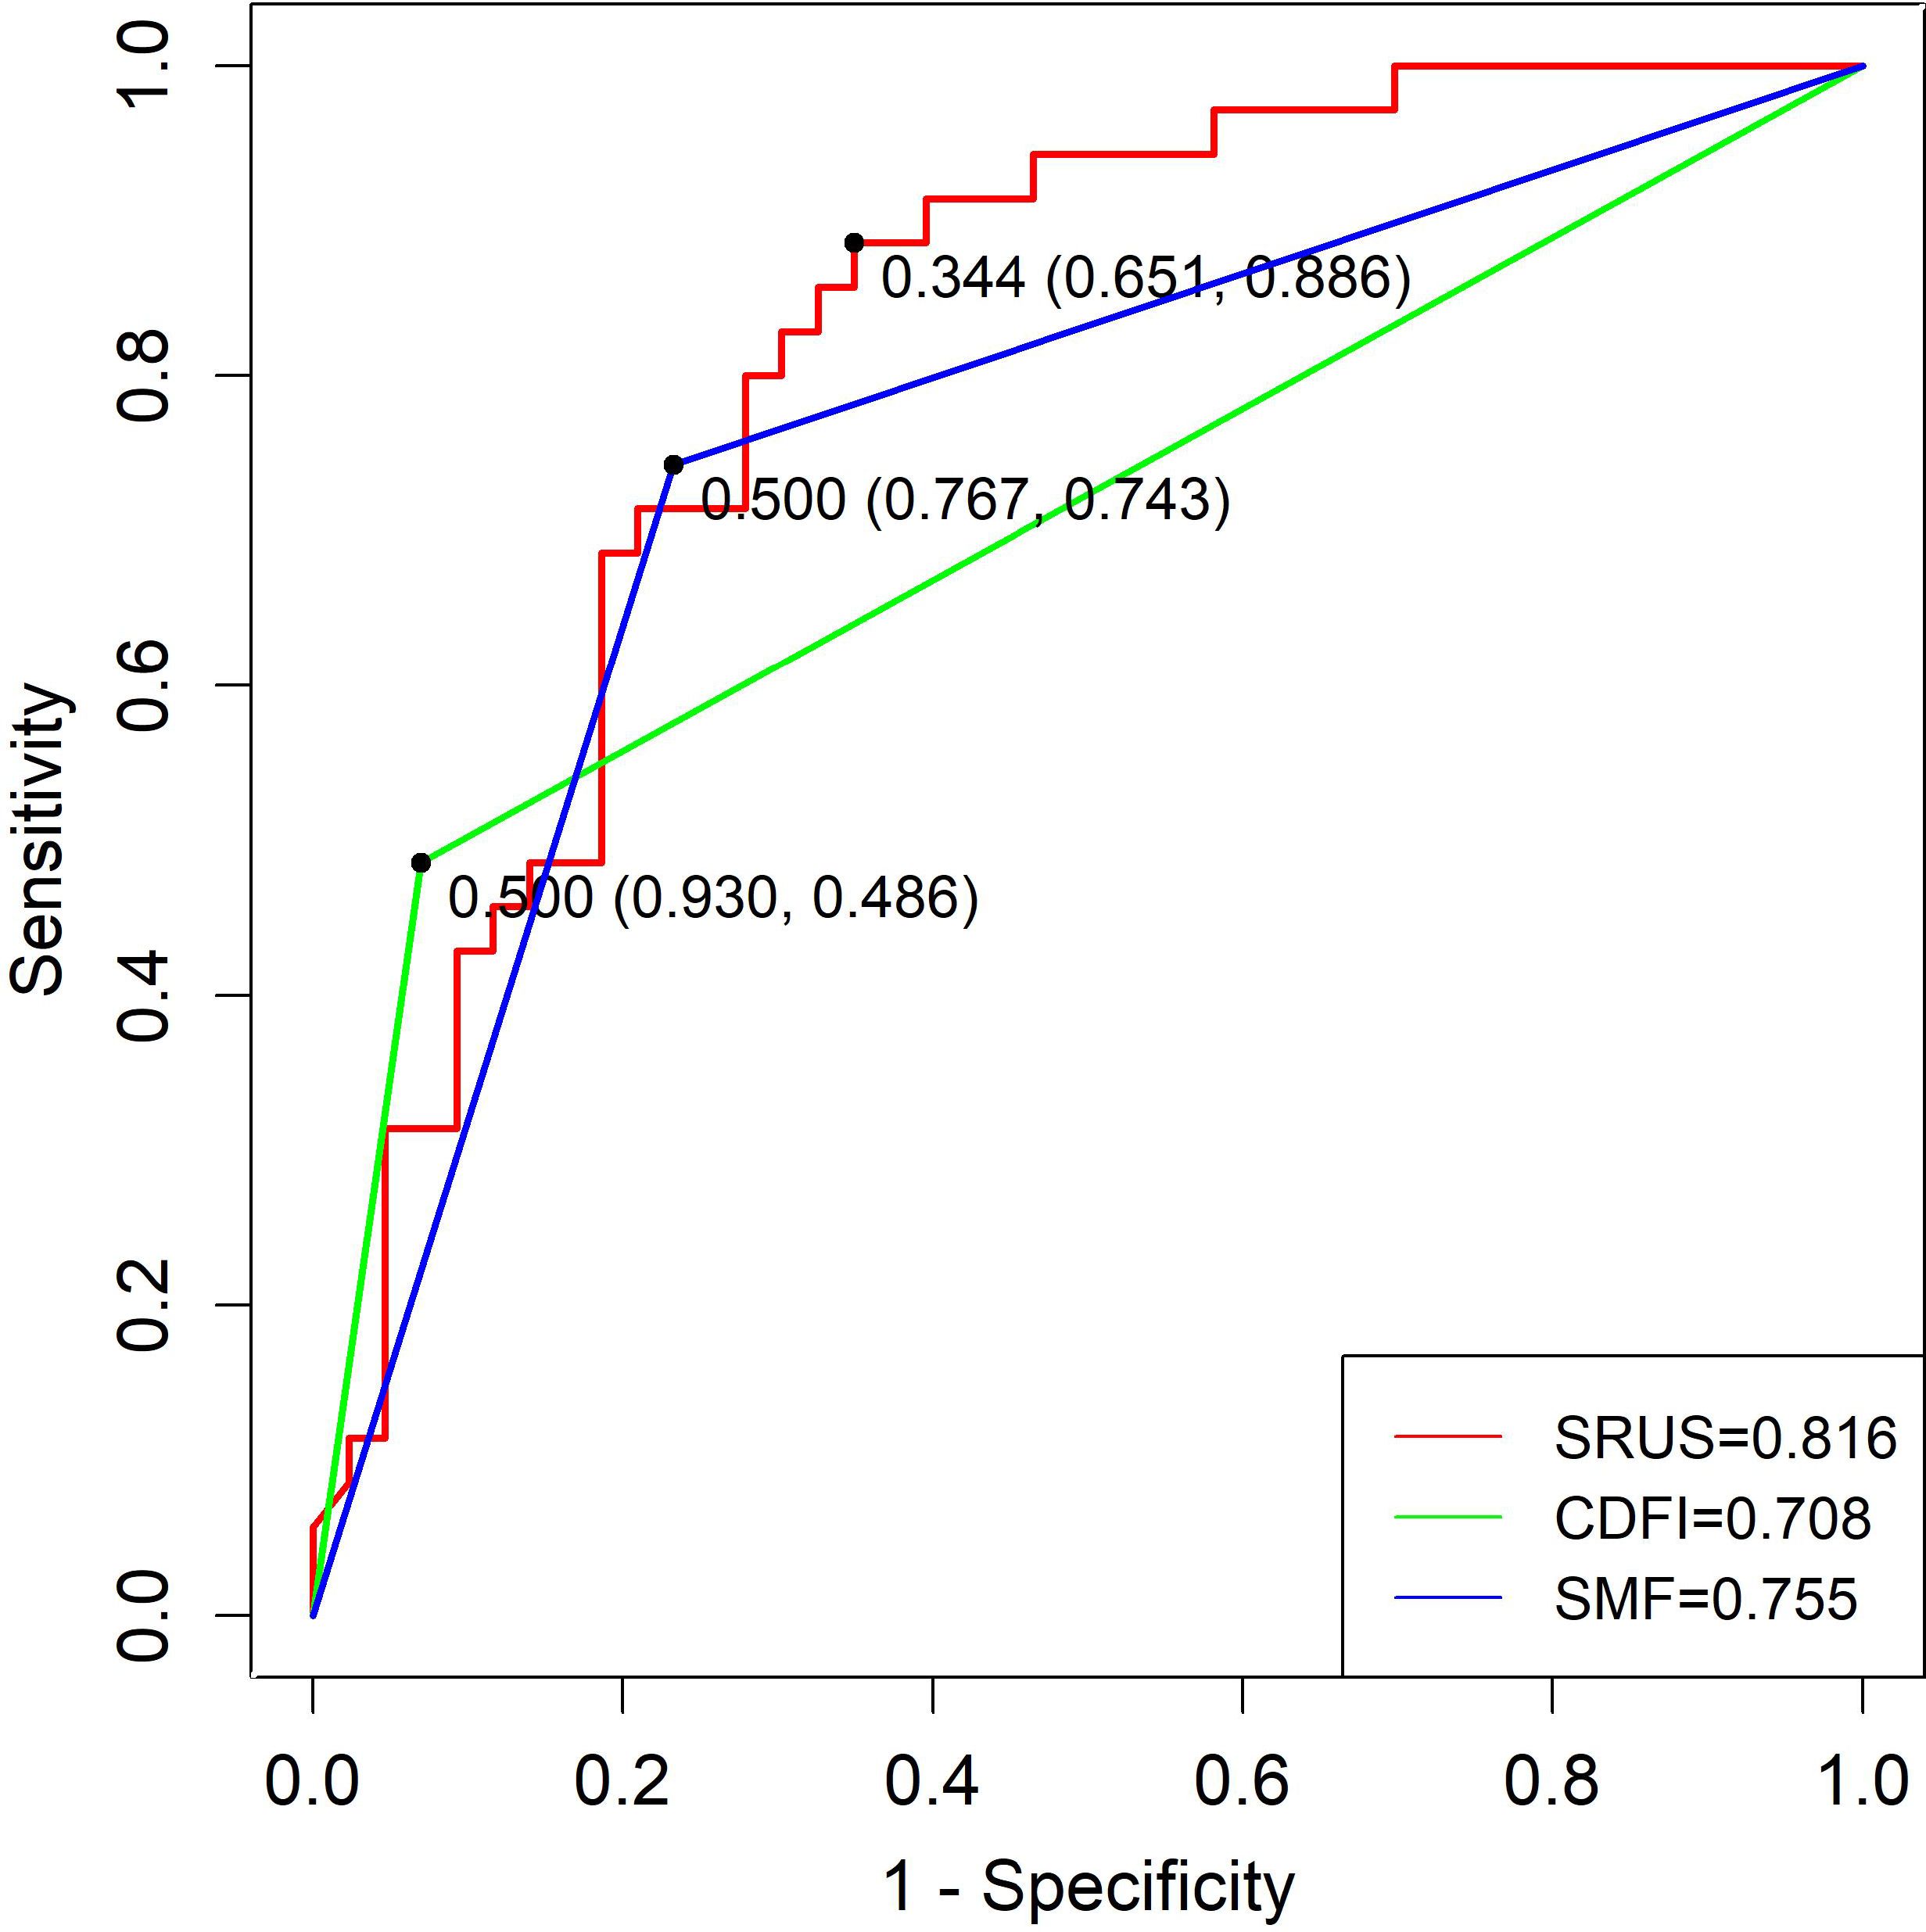
Figure 7. ROC curves of SRUS, CDFI, and SMF for the discrimination between malignant and hypervascular benign solid breast nodules.
Calibration curves demonstrated good agreement between predicted and observed outcomes, which was supported by non-significant Hosmer–Lemeshow test results (P > 0.05; Figure 8). Decision curve analysis confirmed the clinical utility of both SRUS models across threshold probabilities of 0–0.77 (malignant vs. benign) and 0–0.79 (malignant vs. hypervascular benign; Figure 9).
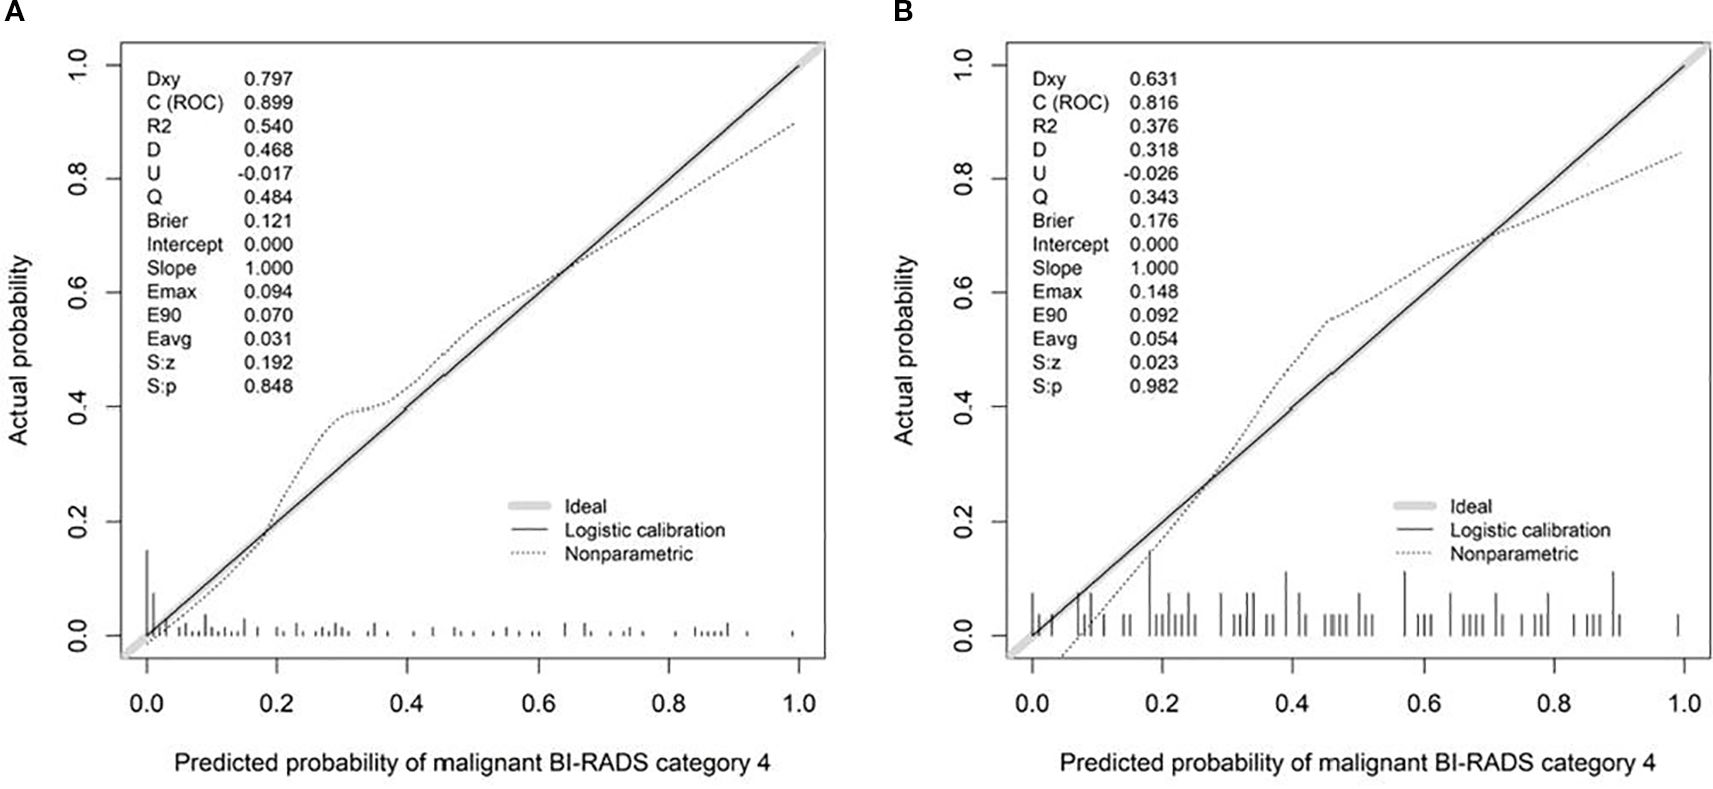
Figure 8. Calibration curves of Model 1-2 (A: Model 1, B: Model 2).
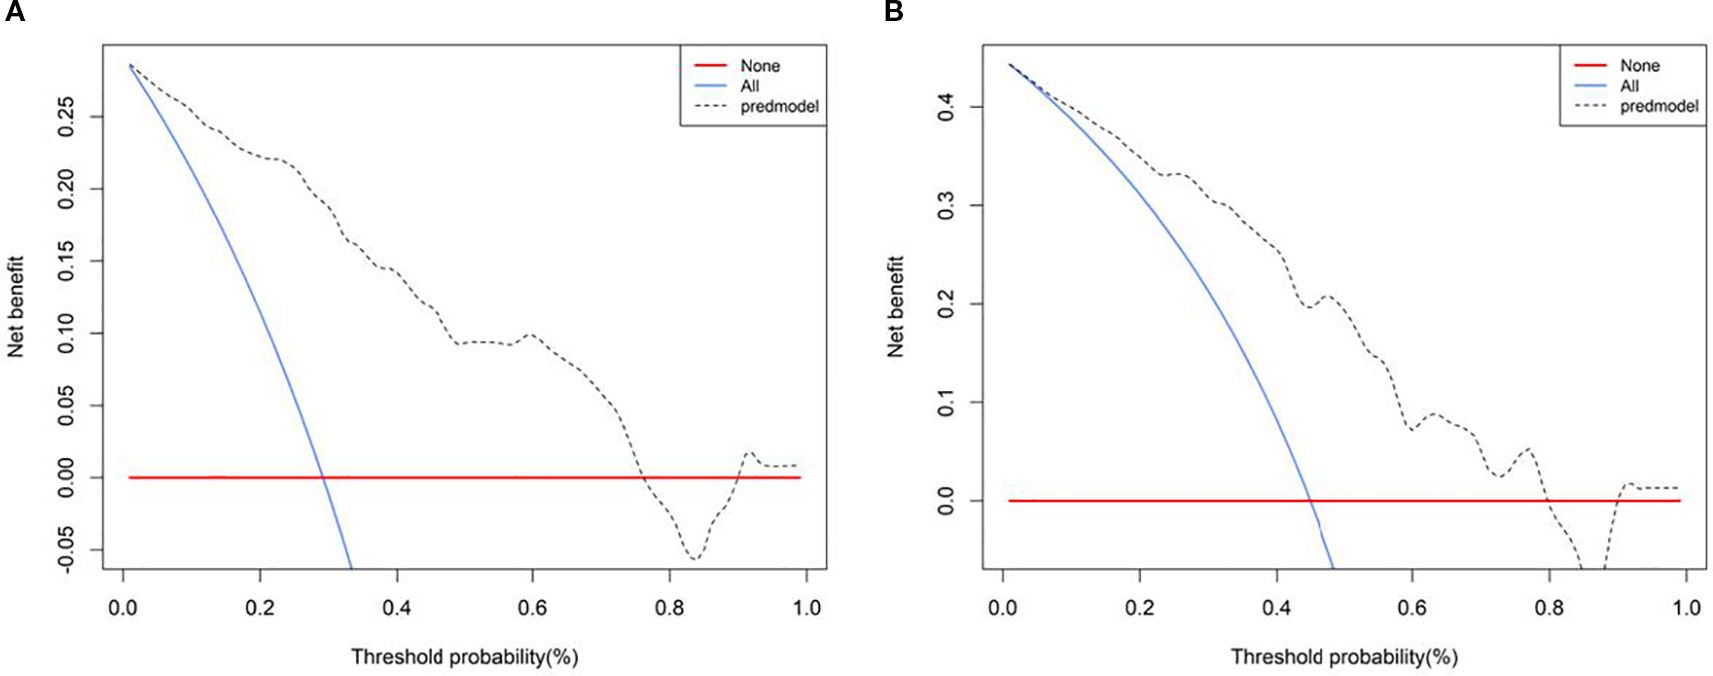
Figure 9. Decision curve of Model 1-2 (A: Model 1, B: Model 2).
4 Discussion
Neovascularization, a hallmark of cancer, plays a pivotal role in tumor progression and metastasis (13). Microvessel density (MVD), a key quantitative marker of angiogenesis in solid tumors, is not only a risk factor for breast cancer metastasis but also a predictor of poor prognosis (14). However, MVD assessment relies on postoperative immunohistochemical analysis of excised specimens, precluding real-time preoperative evaluation. Furthermore, conventional color Doppler flow imaging (CDFI) is hindered by Nyquist limit effects, exhibiting low sensitivity for microvessels <1 mm in diameter and slow blood flow (<5 cm/s). Additionally, it is affected by noise susceptibility and angle dependence (15). While CEUS improves microcirculation visualization via microbubble tracing (16), it remains restricted by the diffraction limit, impairing its ability to resolve microvascular architecture. These technical shortcomings highlight the need for advanced high-resolution vascular imaging. Currently, no non-invasive imaging modality enables real-time visualization of microvascular characteristics in clinical practice. SRUS surpasses the diffraction limit by localizing, tracking, and reconstructing microbubble trajectories, thereby achieving micrometer-scale microvascular imaging and parametric analysis. This technique enables the visualization of vessels as small as 20 μm, representing a >10-fold resolution enhancement over conventional methods and facilitating the early detection of microvascular alterations. Given its exceptional resolution, SRUS holds significant promise for investigating microvascular dynamics in breast lesions; however, its feasibility and clinical utility in breast pathology remain unexplored.
Certain hypervascular benign lesions, such as intraductal papilloma, hypervascular inflammatory lesions, adenoma, and hyperplasia, exhibit enhancement patterns on CEUS that overlap with those of malignant tumors due to their active cellular proliferation or inflammatory characteristics. This overlap also complicates accurate diagnosis (17). To address this, the present study stratified benign breast nodules into hypovascular and hypervascular subgroups. We employed SRUS to differentiate benign from malignant BI-RADS category 4 lesions and systematically evaluated its diagnostic efficacy in distinguishing malignant tumors from hypervascular benign lesions.
Felix et al. (18) quantified MVD by counting CD31(+) vessels in breast biopsy specimens, demonstrating significantly higher MVD in ductal carcinoma in situ and invasive breast cancer tissues compared to benign lesions. Additional studies (14) have corroborated that malignant breast lesions exhibit elevated microvascular density relative to benign counterparts. In this study, statistically significant differences (all P < 0.05) were observed in density (max, mean), velocity (max, mean), and perfusion index between malignant and benign groups. These parameters were further elevated in both malignant and hypervascular benign subgroups compared to hypovascular benign lesions (all P < 0.001), likely reflecting the dense vascular networks and high arteriovenous shunt rates characteristic of malignant tumors. Malignant neovascularization progresses centripetally, forming branched vascular networks that infiltrate tumor subregions and abruptly increasing regional and total blood flow. Simultaneously, structural deficiencies in malignant vasculature—including smooth muscle layer loss, impaired vasomotor function, and tumor thrombus formation—promote arteriovenous shunting, accelerating flow velocity and elevating perfusion (19). However, no statistically significant differences (P > 0.05) were detected between malignant and hypervascular benign groups, likely due to overlapping pathophysiological mechanisms. Hypervascular benign lesions, such as complex fibroadenomas, exhibit localized proliferative activity and atypical ductal hyperplasia, while inflammatory lesions undergo capillary remodeling driven by IL-8, TNF-α, and other cytokines involved in tissue repair and leukocyte infiltration (20). These shared processes contribute to similar sonographic hemodynamic patterns in hypervascular benign and malignant lesions, a key factor in imaging misdiagnoses.
The vessel ratio, which quantifies vascular abundance, showed progressively higher values from hypovascular benign to hypervascular benign to malignant subgroups, with the differences being statistically significant (P < 0.05). However, the considerable standard deviations observed, especially within the malignant and hypervascular benign groups, indicated a significant overlap in values between these two categories. This overlap precluded the establishment of a reliable discriminatory threshold for clinical diagnosis, explaining why vessel ratio was not an independent discriminator between malignant and hypervascular benign lesions in our multivariate analysis.
Prior studies (21) using murine models of human colorectal cancer (CRC) xenografts demonstrated that initial microvascular complexity was approximates 1.7, stabilizing at 1.84 due to tumor growth-induced vascular remodeling. During tumor regression, pathological vascular networks exhibit reduced complexity, reaching levels between healthy tissues and growing tumors. Consistently, our findings revealed a statistically significant progressive increase in complexity with breast lesion progression: malignant lesions (1.63 ± 0.11) > hypervascular benign (1.44 ± 0.24) > hypovascular benign (1.16 ± 0.26) (all P < 0.001). These morphological and functional vascular disparities suggest that penetrating vessels, branching patterns, and vascular disorganization may serve as malignancy indicators (22). Furthermore, our results demonstrated significantly higher curvature (A/E) in malignant lesions (1.44 ± 0.45) compared to hypovascular (1.11 ± 0.13) and hypervascular benign subgroups (1.19 ± 0.18). This phenomenon likely reflects tumor hypoxia and acidosis, driven by inadequate oxygen supply and impaired metabolic waste clearance during rapid proliferation. Hypoxia, a key driver of tumor neovascularization, fosters the development of tortuous and disorganized vascular networks.
This study identified maximum velocity, complexity level, and curvature (A/E) as independent predictors for differentiating benign from malignant BI-RADS category 4 breast lesions. Complexity level and curvature (A/E) further served as discriminators between malignant and hypervascular benign lesions. The corresponding nomogram models demonstrated strong diagnostic performance: the model for benign-malignant differentiation achieved an AUC of 0.899 with 94.3% sensitivity and 76.5% specificity, while the model for malignant versus hypervascular benign lesions attained an AUC of 0.816 with 88.6% sensitivity and 65.1% specificity. Both models exhibited excellent calibration and clinical utility in decision curve analysis, supporting SRUS as a robust tool for breast lesion characterization.
Superb Microvascular Imaging (SMI), also referred to as SMF, improves microvascular visualization compared to CDFI by preserving low-velocity flow signals while suppressing motion artifacts. In our cohort, both CDFI and SMF showed moderate efficacy in discriminating benign from malignant lesions, with AUCs of 0.707 and 0.771, respectively. SRUS significantly outperformed both, achieving an AUC of 0.899—driven by high sensitivity (94.3%) without compromising specificity (76.5%). More importantly, it is a clinically challenging task to distinguish malignant from hypervascular benign lesions, as CDFI and SMF performed poorly (AUCs: 0.708 and 0.755, respectively); however, in distinguishing between these lesions, the SRUS-based model achieved an AUC of 0.816 with high specificity (88.6%), highlighting its potential to reduce unnecessary biopsies.
A large meta-analysis reported pooled sensitivity and specificity of CEUS as 0.87 and 0.79, respectively (23). In comparison, in this study, SRUS demonstrated superior sensitivity (94.3%) with comparable specificity (76.5%). This high sensitivity is critical for reliably ruling out malignancy. By providing a quantitative assessment of microvascular architecture, SRUS enables a more objective and precise diagnostic approach. Its superior performance, particularly in challenging cases, such as hypervascular benign lesions, strongly supports its integration into clinical practice.
This study has several limitations. First, it was a single-center study with a relatively limited number of malignant lesions (n=35), which may affect the generalizability of our findings. Additionally, the maximum diameter of malignant lesions was significantly larger than that of benign ones. We acknowledge that larger tumor size could theoretically influence microvascular abundance. However, the SRUS-derived parameters of vascular complexity and curvature (A/E) were identified as independent predictors of malignancy in the multivariate logistic regression analysis that included and adjusted for lesion size. This strongly suggests that these microarchitectural features capture the intrinsic hallmarks of malignant angiogenesis beyond a mere size-effect. Nevertheless, future multicenter studies with a larger, size-matched cohort are warranted to further validate our findings and explore the diagnostic value of SRUS across different tumor sizes.
5 Conclusion
In summary, SRUS is a novel hemodynamic visualization technique that quantifies micron-level vascular parameters with high precision. This study innovatively employed SRUS to quantitatively assess the microvascular characteristics of breast tumors, offering valuable insights for noninvasive evaluation of tumor vasculature. Preliminary findings highlight the clinical significance of SRUS parameters in differentiating benign from malignant BI-RADS category 4 lesions, with complexity level and curvature (A/E) demonstrating superior discriminatory power in distinguishing malignant tumors from hypervascular benign lesions. As a pioneering exploration in ultrasound microvascular imaging, this research establishes a new technical framework for optimizing clinical decision-making in breast tumor management and provides a critical reference for advancing functional ultrasound applications.
Data availability statement
The original contributions presented in the study are included in the article/supplementary material. Further inquiries can be directed to the corresponding author.
Ethics statement
The studies involving humans were approved by Ethics Committee of the First Affiliated Hospital of Xinjiang Medical University (Ethics Approval Number: K202310-02). The studies were conducted in accordance with the local legislation and institutional requirements. Written informed consent for participation was not required from the participants or the participants’ legal guardians/next of kin in accordance with the national legislation and institutional requirements.
Author contributions
XH: Funding acquisition, Project administration, Writing – original draft, Data curation, Investigation, Writing – review & editing, Methodology. ZL: Writing – review & editing, Methodology, Data curation, Investigation. YL: Methodology, Data curation, Investigation, Writing – review & editing. JG: Methodology, Conceptualization, Writing – review & editing. TS: Formal Analysis, Conceptualization, Supervision, Writing – review & editing.
Funding
The author(s) declare financial support was received for the research and/or publication of this article. This study has received funding from by the Natural Science Foundation of Xinjiang Uygur Autonomous Region (Grant No. 2022D01C772).
Acknowledgments
This is a short text to acknowledge the contributions of specific colleagues, institutions, or agencies that aided the efforts of the authors.
Conflict of interest
The authors declare that the research was conducted in the absence of any commercial or financial relationships that could be construed as a potential conflict of interest.
Generative AI statement
The author(s) declare that no Generative AI was used in the creation of this manuscript.
Any alternative text (alt text) provided alongside figures in this article has been generated by Frontiers with the support of artificial intelligence and reasonable efforts have been made to ensure accuracy, including review by the authors wherever possible. If you identify any issues, please contact us.
Publisher’s note
All claims expressed in this article are solely those of the authors and do not necessarily represent those of their affiliated organizations, or those of the publisher, the editors and the reviewers. Any product that may be evaluated in this article, or claim that may be made by its manufacturer, is not guaranteed or endorsed by the publisher.
References
1. Sung H, Ferlay J, Siegel RL, Laversanne M, Soerjomataram I, Jemal A, et al. Global cancer statistics 2020: GLOBOCAN estimates of incidence and mortality worldwide for 36 cancers in 185 countries. CA Cancer J Clin. (2021) 71:209–49. doi: 10.3322/caac.21660
2. Dietrich CF, Nolsøe CP, Barr RG, Berzigotti A, Burns PN, and Cantisani V. Guidelines and good clinical practice recommendations for contrast-enhanced ultrasound (CEUS) in the liver-update 2020-WFUMB in cooperation with EFSUMB, AFSUMB, AIUM, and FLAUS. Ultraschall Med. (2020) 41:562–85. doi: 10.1055/a-1177-0530
3. Breast Cancer Professional Committee of China Anti-Cancer Association. Chinese guidelines for breast cancer screening and early diagnosis. China Oncol. (2022) 32:363–72. doi: 10.19401/j.cnki.1007-3639.2022.04.010
4. Huang C, Zhang W, Gong P, Lok U-W, Tang S, Yin T, et al. Super-resolution ultrasound localization microscopy based on a high frame-rate clinical ultrasound scanner: an in-human feasibility study. Phys Med Biol. (2021) 66:08NT01. doi: 10.1088/1361-6560/abef45
5. Zhu J, Zhang C, Christensen-Jeffries K, Zhang G, Harput S, Dunsby C, et al. Super-resolution ultrasound localization microscopy of microvascular structure and flow for distinguishing metastatic lymph nodes – an initial human study. Ultraschall Med. (2022) 43:592–8. doi: 10.1055/a-1917-0016
6. Liu J, Liang M, Ma J, Jiang L, Chu H, Guo C, et al. Microbubble tracking based on partial smoothing-based adaptive generalized labelled Multi-Bernoulli filter for super-resolution imaging. Ultrasonics. (2025) 145:107455. doi: 10.1016/j.ultras.2024.107455
7. Zhang W, Lowerison MR, Dong Z, Miller RJ, Keller KA, and Song P. Super-resolution ultrasound localization microscopy on a rabbit liver VX2 tumor model: an initial feasibility study. Ultrasound Med Biol. (2021) 47:2416–29. doi: 10.1016/j.ultrasmedbio.2021.04.012
8. Ul Banna H, Mitchell B, Chen S, and Palko J. Super-Resolution ultrasound localization microscopy using high-frequency ultrasound to measure ocular perfusion velocity in the rat eye. Bioengineering. (2023) 10:689. doi: 10.20944/preprints202304.0433.v1
9. Huang W, Hua C, Guo Y, Gao W, Li Y, and Zheng Y. Super resolution imaging reconstruction reveals that gold standard methods may not correctly conclude neural/brain functional recovery. Computerized Med Imaging Graphics. (2023) 105:102198. doi: 10.1016/j.compmedimag.2023.102198
10. Apfelbeck M, Loupas T, Chaloupka M, and Clevert D-A. Improved diagnostic confidence using Super Resolution CEUS imaging in testicular lesions. Clin Hemorheol Microcirc. (2024) 88:S113–25. doi: 10.3233/ch-248109
11. Huang X, Zhang Y, Zhou Q, and Deng Q. Value of ultrasound super-resolution imaging for the assessment of renal microcirculation in patients with acute kidney injury: a preliminary study. Diagnostics. (2024) 14:1192. doi: 10.3390/diagnostics14111192
12. Adler DD, Carson PL, Rubin JM, and Quinn-Reid D. Doppler ultrasound color flow imaging in the study of breast cancer: Preliminary findings. Ultrasound Med Biol. (1990) 16:553–9. doi: 10.1016/0301-5629(90)90020-d
13. Krüger K, Silwal-Pandit L, Wik E, Straume O, Stefansson IM, Borgen E, et al. Baseline microvessel density predicts response to neoadjuvant bevacizumab treatment of locally advanced breast cancer. Sci Rep. (2021) 11:3388. doi: 10.1038/s41598-021-81914-0
14. Lei YM, Liu C, Hu HM, Li N, Zhang N, Wang Q, et al. Combined use of super-resolution ultrasound imaging and shear-wave elastography for differential diagnosis of breast masses. Front Oncol. (2022) 12:1497140. doi: 10.3389/fonc.2024.1497140
15. Garcia DJ, Smith SW, and Pinton GF. Limitations of color Doppler in deep vessel imaging: a phantom study. Ultrasound Med Biol. (2021) 47:1234–45. doi: 10.1016/j.ultrasmedbio.2021.01.001
16. Sun L, Li N, Jia L, Zhang C, Wang S, Jiao R, et al. Comparison of superb microvascular imaging and conventional doppler imaging techniques for evaluating placental microcirculation: a prospective study. Med Sci Monit. (2020) 26:926215. doi: 10.12659/msm.926215
17. Jia C, Zhang Y, Li J, Wang X, and Liu H. Contrast-enhanced ultrasound in the qualitative diagnosis of benign and Malignant BI-RADS category 4 breast nodules of different sizes. Chin J Ultrasonogr. (2020) 29:343–8. doi: 10.3760/cma.j.cn131148-20191010-00609
18. Felix AS, Lenz P, Pfeiffer RM, Hewitt SM, Morris J, Patel DA, et al. Relationships between mammographic density, tissue microvessel density, and breast biopsy diagnosis. Breast Cancer Res. (2016) 18:88. doi: 10.1186/s13058-016-0746-9
19. Du R, Li J, Wang Y, Zhang L, and Wang X. Comparative study on contrast-enhanced ultrasound hemodynamics between invasive ductal carcinoma and ductal carcinoma in situ of the breast. Chin J Cancer Prev Treat. (2015) 22:129–33. doi: 10.16073/j.cnki.cjcpt.2015.02.012
20. Enny LE, Garg S MS, Mouli S, Singh K, Ramakant P, and Mishra AK. Re-evaluating if observation continues to be the best management of idiopathic granulomatous mastitis. Surgery. (2020) 167:886. doi: 10.1016/j.surg.2019.11.015
21. Gazit Y, Baish JW, Safabakhsh N, Leunig M, Baxter LT, and Jain RK. Fractal characteristics of tumor vascular architecture during tumor growth and regression. Microcirculation. (1997) 4:395–402. doi: 10.3109/10739689709146803
22. Fu Z, Zhang J, Lu Y, Wang S, Mo X, He Y, et al. Clinical applications of superb microvascular imaging in the superficial tissues and organs: a systematic review. Acad Radiol. (2021) 28:694–703. doi: 10.1016/j.acra.2020.03.032
Keywords: SRUS, BI-RADS 4 category, breast lesions, nomogram, prediction model
Citation: Hou X, Li Z, Liu Y, Gao J and Song T (2025) Diagnostic value of super-resolution ultrasound imaging in differentiating benign and malignant BI-RADS-4 breast lesions. Front. Oncol. 15:1662492. doi: 10.3389/fonc.2025.1662492
Received: 09 July 2025; Accepted: 22 September 2025;
Published: 06 October 2025.
Edited by:
Laura Curiel, University of Calgary, CanadaReviewed by:
Feixiao Long, Rensselaer Polytechnic Institute, United StatesJun Luo, Sichuan Academy of Medical Sciences and Sichuan Provincial People’s Hospital, China
Copyright © 2025 Hou, Li, Liu, Gao and Song. This is an open-access article distributed under the terms of the Creative Commons Attribution License (CC BY). The use, distribution or reproduction in other forums is permitted, provided the original author(s) and the copyright owner(s) are credited and that the original publication in this journal is cited, in accordance with accepted academic practice. No use, distribution or reproduction is permitted which does not comply with these terms.
*Correspondence: Tao Song, ZG9jdG9yc29uZ3Rhb0AxNjMuY29t