 Ahmad Alhalabi
 Theresa Abdo
 María Herrán1
- 1Department of Hematology and Oncology, Maroone Cancer Center, Cleveland Clinic Florida, Weston, FL, United States
- 2Center for Clinical Research, Cleveland Clinic Foundation, Cleveland Clinic Florida, Weston, FL, United States
Background: In Early-Stage Breast Cancer (EBC), there is no clear consensus on the ideal window for initiation of adjuvant chemotherapy from the time of definitive surgery. Furthermore, there is a paucity of data on the effectiveness of late chemotherapy. Herein, we aim to assess the effect of delays in adjuvant chemotherapy on overall survival (OS) and to investigate whether there could be a role and remaining effectiveness of late adjuvant chemotherapy compared to no chemotherapy.
Methods: A retrospective cohort study was conducted utilizing data from the National Cancer Database (NCDB), focusing on patients with EBC from 2010 to 2020. Univariate and multivariate Cox regression analyses were employed. Propensity score matching (PSM) (1:1) was performed between the late and no chemotherapy groups to balance baseline characteristics.
Results: N = 326,322 female patients, with a median age of 55 years (Range 47.0-62.0), were identified. Patients were distributed as follows in Group 1 (Adjuvant Chemo < 2 months since surgery N = 266,185, 81.6%), Group 2 (Adjuvant Chemo 2-4 months N = 55,063, 16.9%), Group 3 (Adjuvant Chemo 4-6 months n = 3,749, 1.15%), and Group 4 (Adjuvant Chemo given > 6 months N = 1,325, 0.4%). Multivariate analysis showed that patients in Groups 2,3,4 had worse OS compared to Group 1 (HR 1.28, 95% CI 1.20-1.36, p<0.0001; HR 1.53, 95% CI 1.27-1.84, p<0.0001; and HR 1.46, 95% CI 1.09-1.96, p=0.0104, respectively), indicating that the ideal period to start chemotherapy is within the first 2 months after surgery. When comparing the Late chemotherapy (Group 4) versus a Control Group of patients who declined recommended adjuvant chemotherapy, multivariate analysis indicated that patients in the control group experienced significantly worse OS compared to the late chemotherapy group (HR 1.55, 95% CI 1.13-2.14, p = 0.006).
Conclusion: Systemic adjuvant chemotherapy given within < 2 months period since definitive surgery provides an optimal survival advantage. Notably, patients receiving late adjuvant chemotherapy > 6 months can still derive some benefit compared to those without treatment, making it a viable, though suboptimal, treatment option.
1 Introduction
Breast cancer (BC) is the second most common cancer in females after skin cancer, with a lifetime risk of 13.1% (1). In the United States, BC accounts for approximately 300,000 cases each year and is responsible for over 40,000 deaths (2). Management of BC is evolving and requires cooperation among multidisciplinary fields, including surgical intervention, commonly followed by chemotherapy, endocrine therapy, radiation therapy, and/or targeted therapy (3–5). During tumor angiogenesis, the original breast tumor site undergoes vasodilation and an increase in vascular permeability (6). This mechanism is involved in the progression and metastasis of the disease and provides a rationale for subsequent post-operative “adjuvant” systemic therapies (7–10). The benefit of systemic therapy has been well-documented in Early-Stage Breast Cancer (EBC) (11). Meta-analyses by the Early Breast Cancer Trialists’ Collaborative Group (EBCTCG) showed that adjuvant chemotherapy reduces BC mortality and increases survival (12, 13), reinforcing the importance of early intervention and treatment adherence. However, with the growing complexity of health care systems, heightened insurance requirements, and specific patient factors (14), there could be delays in the initiation of systemic treatments (15, 16). Khorana et al. have reported that with each week of delayed adjuvant treatment, there is a 1.2-3.2% increase in mortality (15). Despite numerous studies investigating the optimal timing of adjuvant chemotherapy in EBC, no consensus has been clearly established (12, 17–22). Moreover, large-scale studies evaluating whether delayed initiation of chemotherapy confers survival benefits in this population are lacking.
1.1 Objectives
This analysis of the National Cancer Database (NCDB) aims to assess the optimal timing for initiating adjuvant chemotherapy for patients with EBC and investigate whether late chemotherapy (>6months after surgery) can still improve patients’ survival outcomes.
2 Methods
This retrospective analysis accessed information from the National Cancer Database (NCDB) between 2010 and 2020 for patients with stages I-III breast cancer, which we will refer to as Early Breast Cancer (EBC) during this analysis. The NCDB is a database that compiles data from over 1,500 Commission on Cancer-accredited facilities across the United States. It contains de-identified, HIPAA-compliant patient-level data and is accessible to investigators from accredited programs. Access to such data is only available via an application process and Participant User Data file (PUF) agreement. The study was conducted after obtaining approval by the Cleveland Clinic’s Institutional Review Board (IRB) as Exempt Human Subject Research (IRB #22-160). The waiver of informed consent to participate and publish the data in an online open-access publication was granted in the application due to minimal risk research involving human subjects. This study was conducted per the regulations of the ethical review committee and the guidelines of the journal.
Records from eligible patients included in this analysis were based on those diagnosed with EBC (Stages I-III) between 2010 and 2020, aged between 18 and 69, who received adjuvant chemotherapy with a known time interval documented from date of definitive surgery. Tumors with all receptor subtypes (Estrogen ER/Progesterone PR/HER2 status and their respective combinations) were included in the analysis. All breast cancer histologies (Invasive ductal, Invasive lobular, and others) were included in the analysis. After applying these inclusion criteria, data from N= 326,322 patients were included in the overall analysis, assessing the timing of chemotherapy, between 0 and more than 6 months after surgery. The following were the exclusion criteria: patients 70 years of age or older and patients younger than 18 years of age. We excluded patients with Metastatic Breast Cancer (Stage IV). We excluded patients with unknown staging, unknown treatment timing, and those who refused chemotherapy.
For the second analysis, which compared late chemotherapy (Patients who received chemotherapy more than 6 months) with controls (Patients who refused chemotherapy), we included data from patients who were offered chemotherapy but declined, forming our control group. N = 48,763 patients were included, and a 1:1 propensity score matching (PSM) was performed, yielding N = 1,466 patients.
The same inclusion-exclusion criteria used for the first analysis were employed; however, we modified them to include our controls.
For both analyses, patients with missing vital status, which indicates whether the patient is alive or deceased, were excluded from the initial data screening. Consequently, approximately 62,300 patients were excluded, resulting in a final sample size of 326,322 patients for the first analysis and 1,466 patients for the second analysis. For other variables with missing data, we conducted our analysis using only the available data; missing values were not used in the analysis.
We excluded a total of 62,300 patients (14.5%) from this study due to missing vital status information, which indicates whether the patient is alive or deceased.
Socio-demographic (age, race, ethnicity, Insurance type, facility type, facility location, urban/rural location, income, and percent of no high school degree) and clinical-pathological characteristics (Days to adjuvant chemotherapy, Charlson-Deyo comorbidity score, histology, stage, grade, estrogen receptor status, progesterone receptor status, HER2 overall summary status, radiotherapy, immunotherapy, regional lymph node status, Oncotype, type of surgery, surgical margins, number of positive nodes, tumor size, and subtype of hormone receptors) were evaluated. For the purpose of this analysis, patients were distributed by time from definitive surgery to adjuvant chemotherapy in groups as follows: Group 1 includes patients initiating chemotherapy within a window of < 2 months. The remaining groups were stratified in an additional 2-month intervals, Group 2 between 2-4 months, Group 3 between 4-6 months, and Group 4 more than 6 months, resulting in four total treatment groups. This classification was based on clinical practice and reports generally supporting the 6-8 weeks window as the ideal timing to initiate adjuvant chemotherapy. Of note, the National Comprehensive Cancer Network does not explicitly recommend a specific timeframe for initiating adjuvant chemotherapy following definitive surgery in EBC. However, guidelines from the European Society of Medical Oncology (ESMO), recommend initiating adjuvant chemotherapy, ideally within 4-6 weeks post-surgery (23). Further literature, such as Gagliato et al. and Kumar et al., supports the 60 days window for ideal survival outcomes (17, 24).
In the second analysis, the late chemotherapy group (Group 4) was compared to a control group of eligible patients who were offered adjuvant chemotherapy but declined it.
Overall survival (OS) was defined as the time in months from the date of diagnosis (time zero) to the date of death or the last known follow-up, as provided by the NCDB’s PUF_Vital_status. Since the exact surgery dates were not known, we calculated the time from surgery to chemotherapy by subtracting “days from diagnosis to surgery” from “days from diagnosis to chemotherapy” and classified them into the four previously mentioned treatment groups.
2.1 Statistical analysis
Statistical Analysis System (SAS) version 9.4 and R version 4.2.3 was used. PSM 1:1 was performed for the analysis comparing late chemotherapy with the control group. Chi-square, Fisher’s exact, independent t, and Mann-Whitney U tests were performed to evaluate the association between each categorical characteristic variable. Kaplan-Meier analyses and log-rank tests were performed on the whole dataset and the subgroup analyses. Univariate Cox regressions were performed to determine significance and inclusion into multivariate Cox regression. Cramer’s V was utilized to assess correlation and exclude variables from multivariate Cox regression if a strong association (>0.6) was found. A multivariate Cox regression model was performed using a backward elimination approach with a 0.05 cutoff.
3 Results
3.1 Sociodemographic and clinical characteristics
We identified N = 326,322 patients who had EBC and were eligible for the first analysis (chemotherapy within 6 + months of surgery). Patients were distributed into Group 1 (n = 266,185, 81.6%), Group 2 (n = 55,063, 16.9%), Group 3 (n = 3,749, 1.15%), and Group 4 (n = 1,325, 0.4%). The cohort consisted of females with a median age of 55 (IQR, 47.0-62.0). Non-Hispanic patients were predominant (88%). Additionally, most of the population had a comorbidity score of zero (84.9%). The stage breakdown was as follows: Stage I (n = 114,511, 44.3%), Stage II (n = 106,963, 41.3%), and Stage III (n = 37,232, 14.4%). These proportions were consistent across all study groups (Groups 1, 2, 3, and 4). There was a predominance of hormone-positive tumors (n = 150,477, 46.2%), followed by Triple-negative tumors (n = 50,407, 15.4%), Triple-positive tumors (n = 37,216, 11.4%) and Hormone receptor-negative, HER2 positive tumors (n = 33,187, 10.2%).
In the second analysis (late chemotherapy), data from N = 42,492 patients who had EBC and received late chemotherapy (Group 4) and Patients who refused chemotherapy (Control Group) were evaluated. After running a 1:1 PSM analysis on age, race, stage, subtypes of hormone receptors, Charlson-Deyo Comorbidity score, and grade, a total of N = 1,466 patients were included in the final analysis, with each group comprising 733 patients. The cohort consisted of females only with a median age of 57 (IQR 48.0-64.0), and a predominance of non-Hispanic patients (82.3%). In addition, most of the population had a comorbidity score of zero (82.1%). The distribution of stages was as follows: Stage 1 (n = 542, 37%), Stage 2 (n = 654, 44.6%), and Stage 3 (n = 270, 18.4%). Furthermore, for the subtypes of hormone receptors, there was a noted predominance of hormone-positive tumors (n = 784, 53.5%), followed by Triple-negative tumors (n = 264, 18%), followed by HER2 positive tumors (n = 229, 15.6%), and lastly Triple-positive tumors (n = 189, 12.9%) (Tables 1 and 2).
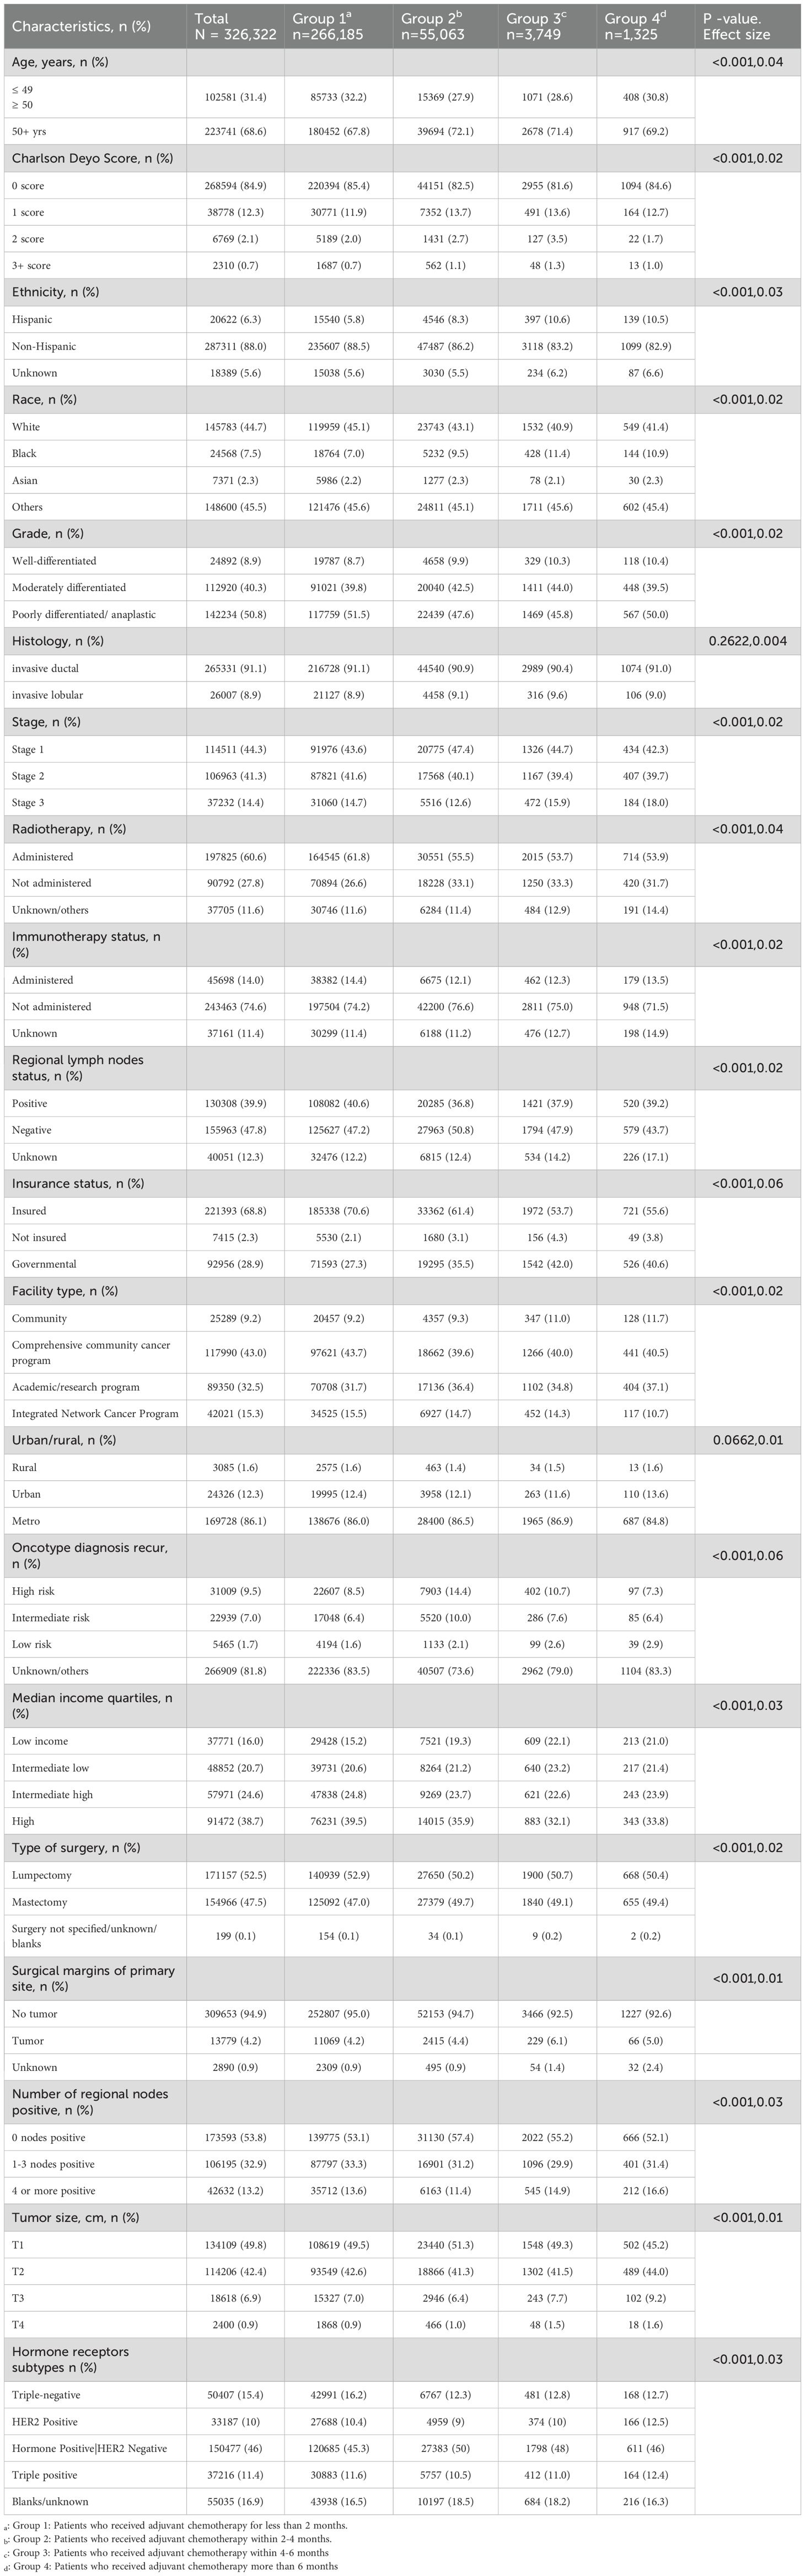
Table 1. Chi-square of baseline sociodemographic and Clinical Characteristics of patients stratified by time to adjuvant chemotherapy, Groups (1–4).
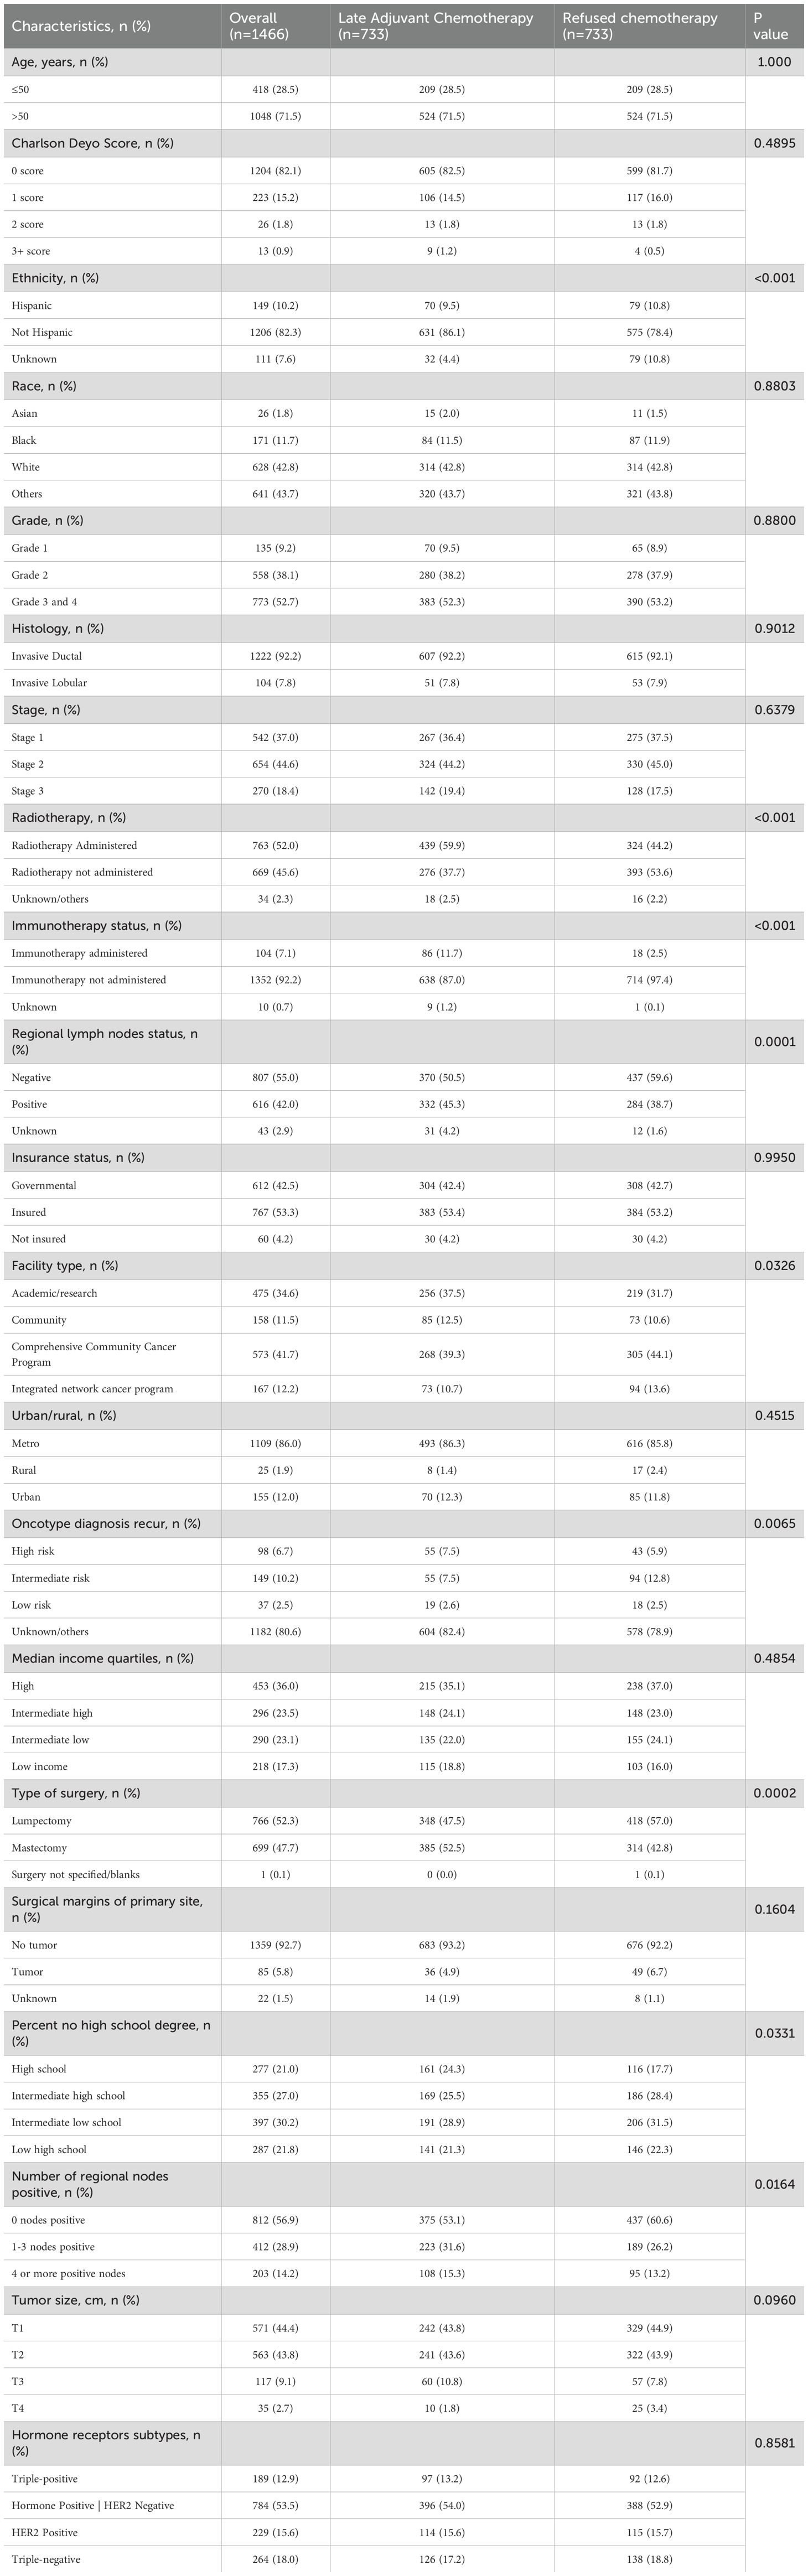
Table 2. Chi-square of baseline sociodemographic and Clinical Characteristics of patients receiving late adjuvant chemotherapy (Group 4) vs. patients who refused chemotherapy.
3.2 Overall survival analysis
Patients in Group 1 (receiving chemotherapy < 2 months since surgery) exhibited the longest OS (45.11 months, 95% CI 44.6-45.7) followed by Group 2 (37.85 months, 95% CI 36.8-38.9), followed by Group 3 (28.94 months, 95% CI 26.9-31.8), and finally Group 4 (30.59 months, 95% CI 27.8-34.3) with a log-rank p-value<0.0001, as reported in Figure 1 and Table 3.

Figure 1. Kaplan Meier Plot of Overall Survival for patients with Early-stage breast cancer stratified by time to adjuvant chemotherapy for Groups 1-4.
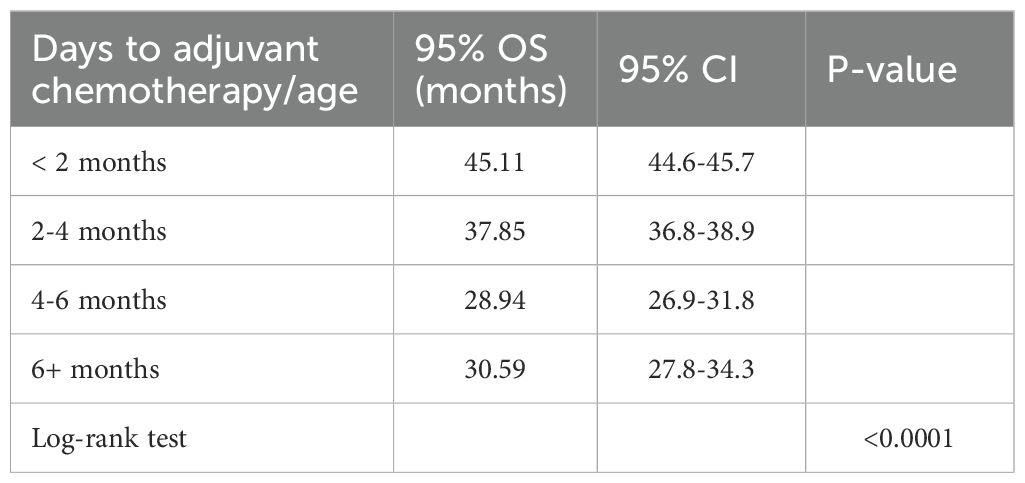
Table 3. Overall Survival comparison by time to adjuvant chemotherapy, Groups (1-4).
Table 4 shows the results of multivariable Cox regression, whereby patients in Groups 2,3,4 had an inferior OS compared to Group 1 (HR 1.28, 95% CI 1.20-1.36, p<0.0001, HR 1.53, 95% CI 1.27-1.84, p<0.0001, and HR 1.46, 95% CI 1.09-1.96, p=0.0104, respectively).
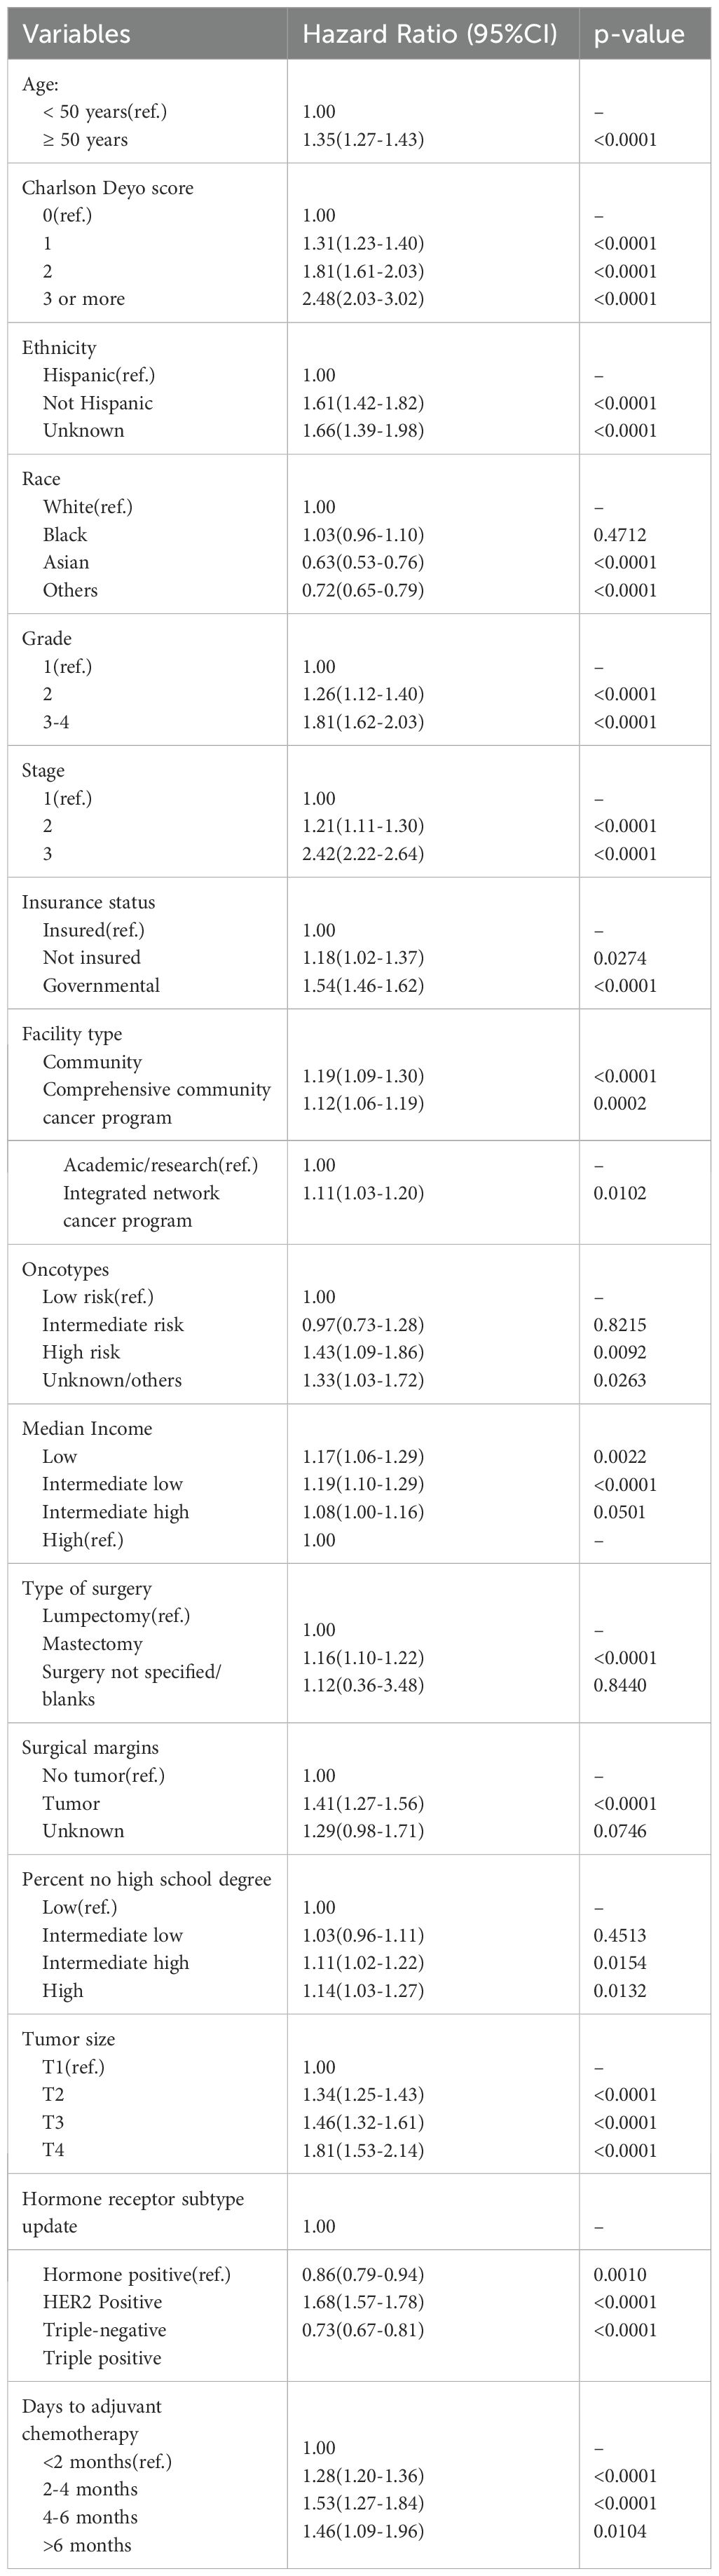
Table 4. Multivariate Cox Regression Analysis of Clinical and Demographic Predictors of Overall Survival for Groups (1-4):
3.3 Sensitivity analysis comparing overall survival for patients who received adjuvant chemotherapy < 8 weeks (Group 1) vs. ≥ 8 weeks (Group 2)
To better compare our results with existing literature, we performed a sensitivity analysis by lumping the patients’ groups into two groups. Group 1 (Patients receiving adjuvant chemotherapy within less than 2 months (< 8 weeks)) vs. Group 2 (Patients who received adjuvant chemotherapy ≥ 2 months (≥8 weeks)). Patients who received adjuvant chemotherapy ≥ 8 weeks had a statistically significant increased risk of death by 30% compared to group 1. (HR 1.3 95% CI 1.23-1.38 and P value <0.0001).
The late Chemotherapy group receiving chemotherapy > 6 months (Group 4) exhibited better OS (29.63 months, 95% CI 26.8-34.7) compared to the Control group declining chemotherapy (19.48 months, 95% CI 17.2-24.8, p-value =0.0099), as reported in Figure 2.
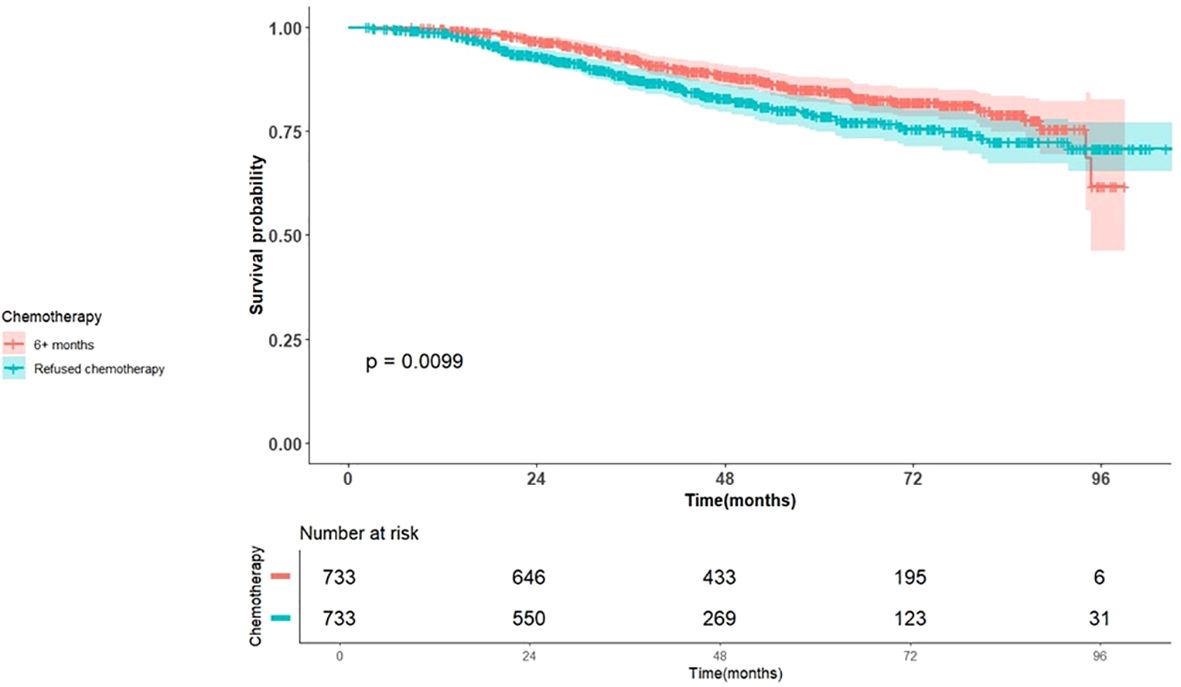
Figure 2. Kaplan Meier Plot of Overall Survival for patients with Early stage breast cancer stratified by chemotherapy, late vs. declined.
Table 5 presents the results of the multivariable Cox regression analysis. Patients in the control group had significantly worse OS compared to the late chemotherapy group (HR 1.55, 95% CI 1.13-2.14, p = 0.006). This survival difference remained consistent across all breast cancer subtypes.
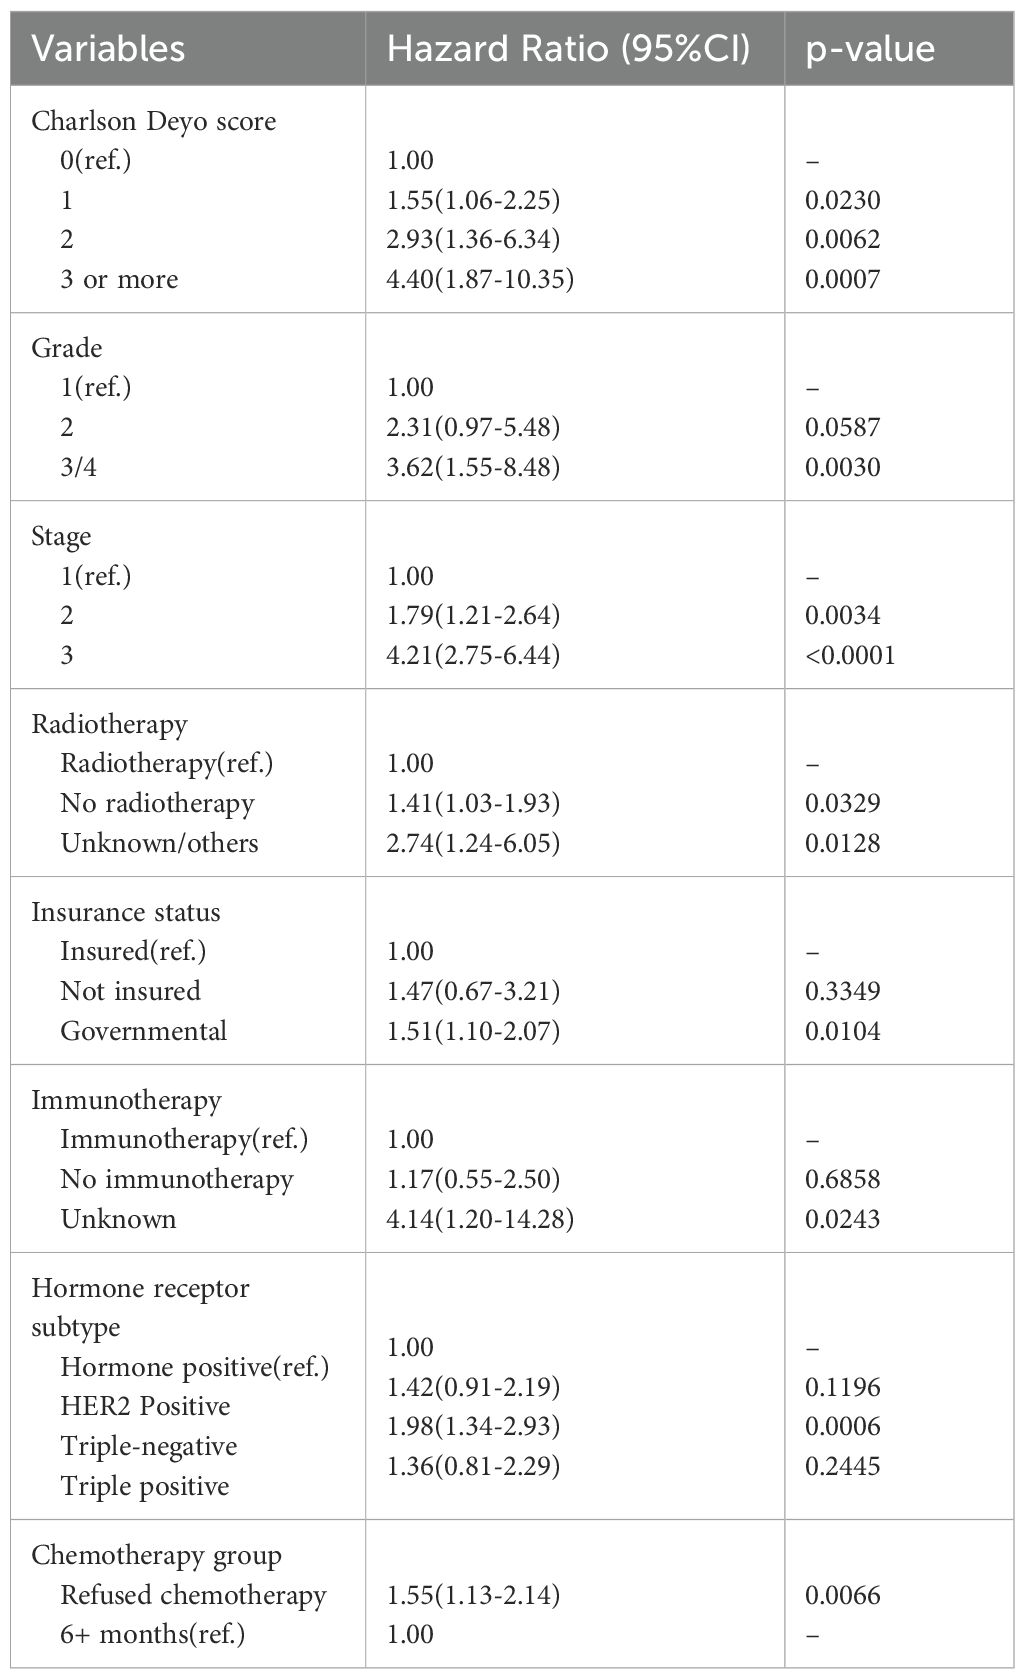
Table 5. Multivariate Cox Regression Analysis of Clinical and Demographic Predictors of Overall Survival for Late Chemotherapy vs. Control Group.
Patients in Groups (1–4) who were ≥ 50 years of age exhibited a significantly worse OS compared to patients < 50 years of age (HR 1.35, 95% CI 1.27-1.43, p < 0.0001).
In the analysis of Groups 1-4, as expected, increasing comorbidity scores and higher tumor stages were significantly associated with poorer OS compared to score zero and stage 1. The Hazard Ratio (HR) for comorbidity scores 1,2,3+ compared to score 0 were 1.31 (95% CI 1.23-1.4, p<0.0001), 1.81 (95% CI 1.61-2.03, p<0.0001), and 2.48 (95% CI 2.03-3.02, p<0.0001), respectively. In the late chemotherapy vs. Control groups, increasing comorbidity scores and higher tumor stages were significantly associated with poorer OS compared to score zero and stage 1the HRs for comorbidity scores 1,2,3+ compared to score zero were 1.55 (95% CI 1.06-2.25, p=0.0230), 2.93 (95% CI 1.36-6.34, p=0.0062), and 4.40 (95% CI 1.87-10.35, p=0.0007), respectively. Similarly, the higher tumor stages were associated with worse survival. In Groups 1-4, the HRs for stages 2 and 3 compared to stage 1 were 1.21 (95% CI, 1.11-1.30; p < 0.0001) and 2.42 (95% CI, 2.22-2.64; p < 0.0001), respectively. Furthermore, in the late chemotherapy versus control groups, the HR was 1.79 (95% CI, 1.21-2.64, p = 0.0034) for stage 2 and 4.21 (95% CI, 2.75-6.44, p < 0.0001) for stage 3.
Regarding breast cancer subtypes, within Groups 1-4, patients with HER2-positive or Triple-Positive tumors demonstrated improved survival compared to those with Hormone- receptor positive tumors (HR 0.86, 95% CI 0.79-0.94, p=0.001; and HR 0.73, 95% CI 0.67-0.81, p<0.0001, respectively). In contrast, patients with triple-negative breast cancer tumors exhibited significantly worse OS (HR 1.68, 95% CI 1.57-1.78, p<0.0001), as illustrated in Figure 3.
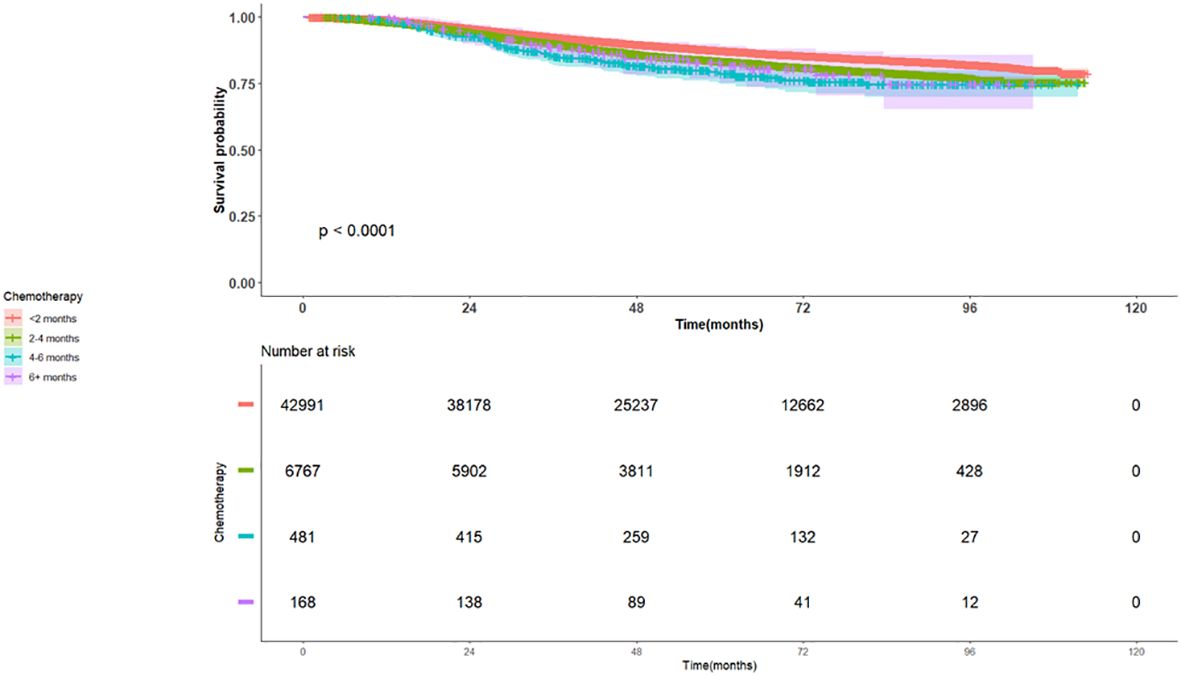
Figure 3. Kaplan Meier Plot of Overall Survival for patients with TNBC early stage breast cancer stratified by time to adjuvant chemotherapy for Groups 1-4.
3.4 Subgroup analysis for HER2-positive tumors
We have compared patients with HER2-positive tumors and examined overall survival based on the timing of adjuvant chemotherapy, categorizing them into four well-characterized groups Table 6. Patients with HER2-positive breast cancer who received adjuvant chemotherapy within groups 2,3,4 had an inferior OS compared to Group 1 (HR 1.48, 95% CI 1.22-1.79, p<0.0001, HR 1.48, 95% CI 0.76-2.88, p-value = 0.25, and HR 1.05, 95% CI 0.39-2.84, p-value= 0.9162 respectively).
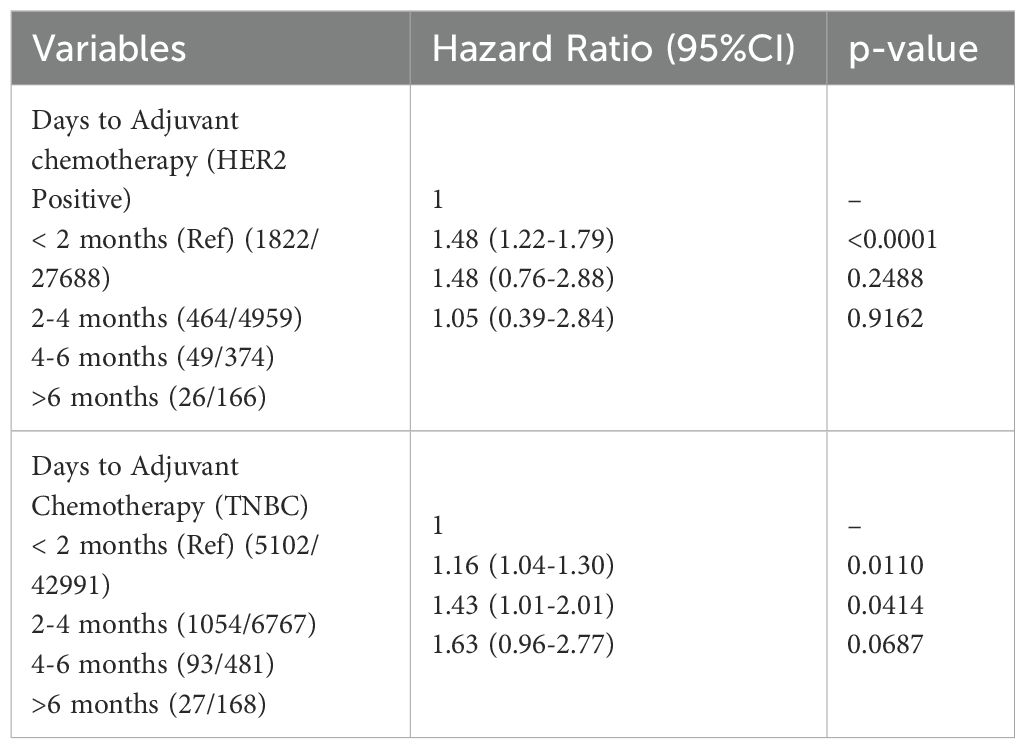
Table 6. Multivariate Cox Regression Analysis of HER2 positive and Triple Negative Breast cancer.
3.5 Subgroup analysis for triple negative tumors
Patients who received adjuvant chemotherapy within groups 2,3,4 had an inferior OS compared to Group 1 (HR 1.16, 95% CI 1.04-1.3, and a p-value 0.0110, HR 1.43, 95% CI 1.01-2.01, p-value 0.0414, and HR 1.63, 95% CI 0.96-2.77, p-value = 0.0687) Table 6.
It is important to note that the number of patients in each group for HER2-positive and triple-negative tumors decreased within each group, and as such, could be a reason for not achieving significant results.In the matched analysis, patients with triple positive tumors and patients with HER-2 positive tumors did not have a significant overall survival difference when compared to patients with Hormone Positive tumors [HR 1.36, 95% CI 0.81-2.29, p=0.2445 and HR 1.42, 95% CI 0.91-2.19, p=0.1196, respectively]. However, patients with triple-negative breast tumors exhibited significantly inferior OS compared to those with Hormone-Positive tumors (HR 1.98, 95% CI 1.34-2.93, p=0.0006).
4 Discussion
This analysis reinforces that starting adjuvant chemotherapy within <2 months (< 8 weeks) from definitive surgery provides the optimal survival advantage in EBC. Interestingly, data suggests that patients could still benefit from late chemotherapy compared to no chemotherapy when it is indicated, even if initiation occurs more than 6 months after surgery, for any possible reason. This extensive retrospective analysis exploring OS based on the timing of adjuvant chemotherapy administration as well as the role of late chemotherapy in EBC adds evidence that could contribute to more optimization of clinical practice in EBC, as there has been, thus far, no clear consensus on the optimal time to deliver adjuvant chemotherapy. In addition to that, this analysis provides more granular and in-depth data for the OS based on the time range created for these four groups. In addition, this study provides practical implications and helps answer the clinical question of “to give or not to give” systemic adjuvant chemotherapy for breast cancer patients who present many months beyond their definitive surgery. In clinical practice, around 6 weeks has been considered a generally suitable threshold to provide adjuvant chemotherapy for patients with EBC (17, 18, 23, 25–28). Our study aligns with this timeframe for delivery of adjuvant chemotherapy, as it suggests that an optimal window of <2 months is ideal for the best outcome. Further literature demonstrated that patients with breast-conserving surgery should start adjuvant chemotherapy within 30 days; however, this might not apply to patients with mastectomy (29). On the other hand, some studies recommend more flexible timing thresholds, i.e., initiating adjuvant chemotherapy up to 12 - 16 weeks would be acceptable, beyond which OS would be compromised (12, 19, 20). Also, some studies have not suggested significant survival differences between early and late initiation of adjuvant chemotherapy (30, 31). These differences in outcomes in existing literature may be due to variations in sample size, cohort characteristics, and analytic approaches across the studies.
This analysis is also consistent with other studies reporting on survival outcomes based on breast cancer subtypes. Patients with triple-negative tumors have been reported to exhibit inferior survival outcomes if chemotherapy was initiated beyond a 1-month duration, adding a stricter time frame (32–35). A study by Li S et al. concurs with this finding and adds that this is also true for patients with positive lymph node infiltration (36). Interestingly, while some reports did not clearly demonstrate a significant association with survival in patients receiving chemotherapy for operable TNBC (37), numerous articles have, in contrast, indicated the impact of chemotherapy timing on the OS of TNBC (34, 38). TNBC should be considered an aggressive tumor with an inferior prognosis compared to other subtypes, which necessitates early intervention compared to other subtypes, as it has been associated with a high relapse rate and distal metastasis (38–43). Our analysis consistently established that patients, including those with TNBC, who received adjuvant chemotherapy within less than 2 months demonstrated a clear survival advantage compared to receiving treatment at later time intervals.
Importantly, this study offers a possible option for patients who underwent surgery but, for various reasons, did not receive systemic chemotherapy within 6 months. The data analyzed suggested that adjuvant chemotherapy offers a survival benefit even if the patient receives adjuvant chemotherapy late within their treatment timeline. This is plausible since adjuvant chemotherapy targets microscopic disease systemically, although the earlier chemotherapy is administered, the better the clinical outcomes (44). This is consistent with the treatment of cancer across different solid tumors. For example, patients with pancreatic cancer and locally advanced bladder cancer can still benefit from late systemic adjuvant therapy (45, 46).
To our knowledge, this study is among the first to compare head-to-head late chemotherapy to no chemotherapy in EBC, providing evidence that even late treatment can improve survival outcomes. Furthermore, this study could offer practical implications for patient care, particularly for patients who require additional time to recover post-surgery or following surgical complications. Multiple studies have emphasized the importance of adhering to enhanced recovery after surgery (ERAS) protocol, which leads to better oncologic outcomes (47, 48). Furthermore, healthcare providers might offer comprehensive counseling to address patient hesitancy, facilitating informed decision-making regarding adjuvant chemotherapy; with proper patient education about the disease and its course, there is a significantly improved outcome in terms of quality of life, depression, side effects, and performance status (49, 50).
This study has several strengths. It is based on a large real- world Data from the NCDB, an extensive, nationally representative registry with standardized data collection. The inclusion of over 300,000 patients provides statistical power and enhances confidence in the wide applicability of the results. In the analysis, propensity score matching and multivariable regression were used to adjust for confounding and strengthen internal validity. However, limitations inherent to the retrospective nature must be acknowledged. Selection bias and unmeasured confounders are possible, as the NCDB lacks variables such as performance status, disease progression, recurrence, patient preference, reasons for treatment delay, access to healthcare, variations in treatment protocols (including chemotherapy agents and dosing), and toxicities. Also, survival metrics other than OS such as disease specific survival were not reported.The time to adjuvant chemotherapy was accurately obtained, the OS is measured from diagnosis to last follow-up or death, rather than from surgery date, introducing a slight misalignment between exposure (timing of chemotherapy) and the outcome (OS), since patients might have experienced varying intervals between diagnosis and surgery. Also, in the second analysis of late chemotherapy versus control, NCDB does not track disease progression after diagnosis; therefore, it is possible that some patients in group 4 (Chemotherapy> 6 months) may have experienced progression before undergoing systematic therapy. This could influence survival comparisons with the control group. Finally, it is essential to recognize the differences in healthcare systems and access to care, as these factors have substantial implications for overall survival, i.e., differences exist between the U.S. healthcare system, the European healthcare system, and other global models that govern these systems.
5 Conclusion
This large analysis provides real-time data on the benefit of optimal timing of systemic adjuvant chemotherapy and suggests that it is within 2 months from surgery, which appears to confer a survival advantage compared to other delayed time frames. However, patients could continue to benefit from receiving indicated adjuvant systemic therapy at any time interval since surgery, even later than 6 months. Therefore, late adjuvant chemotherapy should be considered a viable treatment option for patients with EBC who had delays for various reasons. Ultimately, the decision to administer adjuvant chemotherapy, including late chemotherapy, should be a shared decision between patients and physicians, and should include a discussion about its toxicity, side effects, and expected benefits, aligning with the patient’s needs and treatment goals.
Data availability statement
The datasets presented in this article are not readily available because the data supporting this study’s findings are available for investigators who are granted access to the National Cancer Database through an online application from the ACS website (https://www.facs.org/quality-programs/cancer-programs/national-cancer-database/puf/). The participant user files (PUF) for the Breast Cancer database were downloaded by the principal investigator associated with a Commission on Cancer (CoC) accredited institution. Requests to access the datasets should be directed to https://www.facs.org/quality-programs/cancer-programs/national-cancer-database/puf/.
Ethics statement
The studies involving humans were approved by the Cleveland Clinic Institutional Review Board (IRB #22-160). The studies were conducted in accordance with the local legislation and institutional requirements. The ethics committee/institutional review board waived the requirement of written informed consent for participation from the participants or the participants’ legal guardians/next of kin because it is considered as an Exempt Human Subject Research. A waiver of informed consent was granted due to the study’s retrospective nature. Human Ethics and Consent to Participate declarations: Approved by IRB with waiver of informed consent.
Author contributions
AA: Conceptualization, Data curation, Investigation, Project administration, Writing – original draft, Writing – review & editing. TA: Investigation, Writing – original draft, Writing – review & editing. MH: Writing – original draft, Writing – review & editing. KS: Data curation, Formal Analysis, Validation, Writing – original draft, Writing – review & editing. RT: Writing – original draft, Writing – review & editing. ZN: Conceptualization, Investigation, Supervision, Writing – original draft, Writing – review & editing.
Funding
The author(s) declare that no financial support was received for the research and/or publication of this article.
Acknowledgments
This work was supported by the Maroone Cancer Center, Cleveland Clinic Florida, Weston, FL, USA.
Conflict of interest
The authors declare that the research was conducted in the absence of any commercial or financial relationships that could be construed as a potential conflict of interest.
Generative AI statement
The author(s) declare that no Generative AI was used in the creation of this manuscript.
Any alternative text (alt text) provided alongside figures in this article has been generated by Frontiers with the support of artificial intelligence and reasonable efforts have been made to ensure accuracy, including review by the authors wherever possible. If you identify any issues, please contact us.
Publisher’s note
All claims expressed in this article are solely those of the authors and do not necessarily represent those of their affiliated organizations, or those of the publisher, the editors and the reviewers. Any product that may be evaluated in this article, or claim that may be made by its manufacturer, is not guaranteed or endorsed by the publisher.
References
1. Breast cancer facts & Figures: american cancer society; 2024-2025 . Available online at: https://www.cancer.org/content/dam/cancer-org/research/cancer-facts-and-statistics/breast-cancer-facts-and-figures/2024/breast-cancer-facts-and-figures-2024.pdf (Accessed August 26, 2025).
2. Cancer facts and figures 2025: american cancer society (2025). Available online at: https://www.cancer.org/cancer/types/breast-cancer/about/how-common-is-breast-cancer.html:~:text=About%20310%2C720%20new%20cases%20of%20invasive%20breast%20cancer%20will%20be%20diagnosed%20in%20women (Accessed August 26, 2025).
3. Chew HK. Adjuvant therapy for breast cancer: who should get what? West J Med. (2001) 174:284–7. doi: 10.1136/ewjm.174.4.284
4. Ben-Dror J, Shalamov M, and Sonnenblick A. The history of early breast cancer treatment. Genes (Basel). (2022) 13. doi: 10.3390/genes13060960
5. Wang J and Wu SG. Breast cancer: an overview of current therapeutic strategies, challenge, and perspectives. Breast Cancer (Dove Med Press). (2023) 15:721–30. doi: 10.2147/BCTT.S432526
6. Gunduz N, Fisher B, and Saffer EA. Effect of surgical removal on the growth and kinetics of residual tumor. Cancer Res. (1979) 39:3861–5.
7. Madu CO, Wang S, Madu CO, and Lu Y. Angiogenesis in breast cancer progression, diagnosis, and treatment. J Cancer. (2020) 11:4474–94. doi: 10.7150/jca.44313
8. Zarychta E and Ruszkowska-Ciastek B. Cooperation between angiogenesis, vasculogenesis, chemotaxis, and coagulation in breast cancer metastases development: pathophysiological point of view. Biomedicines. (2022) 10. doi: 10.3390/biomedicines10020300
9. Ayoub NM, Jaradat SK, Al-Shami KM, and Alkhalifa AE. Targeting angiogenesis in breast cancer: current evidence and future perspectives of novel anti-angiogenic approaches. Front Pharmacol. (2022) 13:838133. doi: 10.3389/fphar.2022.838133
10. Boudreau N and Myers C. Breast cancer-induced angiogenesis: multiple mechanisms and the role of the microenvironment. Breast Cancer Res. (2003) 5:140–6. doi: 10.1186/bcr589
11. Asselain B, Barlow W, Bartlett J, Bergh J, Bergsten-Nordström E, Bliss J, et al. Long-term outcomes for neoadjuvant versus adjuvant chemotherapy in early breast cancer: meta-analysis of individual patient data from ten randomised trials. Lancet Oncol. (2018) 19:27–39. doi: 10.1016/S1470-2045(17)30777-5
12. Lohrisch C, Paltiel C, Gelmon K, Speers C, Taylor S, Barnett J, et al. Impact on survival of time from definitive surgery to initiation of adjuvant chemotherapy for early-stage breast cancer. J Clin Oncol. (2006) 24:4888–94. doi: 10.1200/JCO.2005.01.6089
13. EBCTCG. Effects of chemotherapy and hormonal therapy for early breast cancer on recurrence and 15-year survival: an overview of the randomised trials. Lancet. (2005) 365:1687–717. doi: 10.1016/S0140-6736(05)66544-0
14. Losk K, Vaz-Luis I, Camuso K, Batista R, Lloyd M, Tukenmez M, et al. Factors associated with delays in chemotherapy initiation among patients with breast cancer at a comprehensive cancer center. J Natl Compr Canc Netw. (2016) 14:1519–26. doi: 10.6004/jnccn.2016.0163
15. Khorana AA, Tullio K, Elson P, Pennell NA, Grobmyer SR, Kalady MF, et al. Time to initial cancer treatment in the United States and association with survival over time: An observational study. PloS One. (2019) 14:e0213209. doi: 10.1371/journal.pone.0213209
16. Smith KT, Monti D, Mir N, Peters E, Tipirneni R, and Politi MC. Access is necessary but not sufficient: factors influencing delay and avoidance of health care services. MDM Policy Pract. (2018) 3:2381468318760298. doi: 10.1177/2381468318760298
17. Ashok Kumar P, Paulraj S, Wang D, Huang D, and Sivapiragasam A. Associated factors and outcomes of delaying adjuvant chemotherapy in breast cancer by biologic subtypes: a National Cancer Database study. J Cancer Res Clin Oncol. (2021) 147:2447–58. doi: 10.1007/s00432-021-03525-6
18. Yu KD, Huang S, Zhang JX, Liu GY, and Shao ZM. Association between delayed initiation of adjuvant CMF or anthracycline-based chemotherapy and survival in breast cancer: a systematic review and meta-analysis. BMC Cancer. (2013) 13:240. doi: 10.1186/1471-2407-13-240
19. Chavez-MacGregor M, Clarke CA, Lichtensztajn DY, and Giordano SH. Delayed initiation of adjuvant chemotherapy among patients with breast cancer. JAMA Oncol. (2016) 2:322–9. doi: 10.1001/jamaoncol.2015.3856
20. Chen SY, Tang Y, Wang SL, Song YW, Fang H, Wang JY, et al. Timing of chemotherapy and radiotherapy following breast-conserving surgery for early-stage breast cancer: A retrospective analysis. Front Oncol. (2020) 10:571390. doi: 10.3389/fonc.2020.571390
21. Colleoni M, Bonetti M, Coates AS, Castiglione-Gertsch M, Gelber RD, Price K, et al. Early start of adjuvant chemotherapy may improve treatment outcome for premenopausal breast cancer patients with tumors not expressing estrogen receptors. Int Breast Cancer Study Group J Clin Oncol. (2000) 18:584–90. doi: 10.1200/JCO.2000.18.3.584
22. Jara Sánchez C, Ruiz A, Martín M, Antón A, Munárriz B, Plazaola A, et al. Influence of timing of initiation of adjuvant chemotherapy over survival in breast cancer: a negative outcome study by the Spanish Breast Cancer Research Group (GEICAM). Breast Cancer Res Treat. (2007) 101:215–23. doi: 10.1007/s10549-006-9282-0
23. Loibl S, André F, Bachelot T, Barrios CH, Bergh J, Burstein HJ, et al. Early breast cancer: ESMO Clinical Practice Guideline for diagnosis, treatment and follow-up. Ann Oncol. (2024) 35:159–82. doi: 10.1016/j.annonc.2023.11.016
24. Gagliato Dde M, Gonzalez-Angulo AM, Lei X, Theriault RL, Giordano SH, Valero V, et al. Clinical impact of delaying initiation of adjuvant chemotherapy in patients with breast cancer. J Clin Oncol. (2014) 32:735–44. doi: 10.1200/JCO.2013.49.7693
25. Raphael MJ, Biagi JJ, Kong W, Mates M, Booth CM, and Mackillop WJ. The relationship between time to initiation of adjuvant chemotherapy and survival in breast cancer: a systematic review and meta-analysis. Breast Cancer Res Treat. (2016) 160:17–28. doi: 10.1007/s10549-016-3960-3
26. Hanna TP, King WD, Thibodeau S, Jalink M, Paulin GA, Harvey-Jones E, et al. Mortality due to cancer treatment delay: systematic review and meta-analysis. Bmj. (2020) 371:m4087. doi: 10.1136/bmj.m4087
27. Abdel-Rahman O. Impact of timeliness of adjuvant chemotherapy and radiotherapy on the outcomes of breast cancer; a pooled analysis of three clinical trials. Breast. (2018) 38:175–80. doi: 10.1016/j.breast.2018.01.010
28. Farolfi A, Scarpi E, Rocca A, Mangia A, Biglia N, Gianni L, et al. Time to initiation of adjuvant chemotherapy in patients with rapidly proliferating early breast cancer. Eur J Cancer. (2015) 51:1874–81. doi: 10.1016/j.ejca.2015.07.003
29. Heeg E, Marang-van de Mheen PJ, Van Maaren MC, Schreuder K, Tollenaar R, Siesling S, et al. Association between initiation of adjuvant chemotherapy beyond 30 days after surgery and overall survival among patients with triple-negative breast cancer. Int J Cancer. (2020) 147:152–9. doi: 10.1002/ijc.32788
30. Shannon C, Ashley S, and Smith IE. Does timing of adjuvant chemotherapy for early breast cancer influence survival? J Clin Oncol. (2003) 21:3792–7. doi: 10.1200/JCO.2003.01.073
31. Cold S, Düring M, Ewertz M, Knoop A, and Møller S. Does timing of adjuvant chemotherapy influence the prognosis after early breast cancer? Results of the Danish Breast Cancer Cooperative Group (DBCG). Br J Cancer. (2005) 93:627–32. doi: 10.1038/sj.bjc.6602734
32. Okines AFC, Kipps E, Irfan T, Coakley M, Angelis V, Asare B, et al. Impact of timing of adjuvant chemothapy for early breast cancer: the Royal Marsden Hospital experience. Br J Cancer. (2021) 125:299–304. doi: 10.1038/s41416-021-01428-4
33. Bowcock SJ, Shee CD, Rassam SM, and Harper PG. Chemotherapy for cancer patients who present late. Bmj. (2004) 328:1430–2. doi: 10.1136/bmj.328.7453.1430
34. Hatzipanagiotou ME, Pigerl M, Gerken M, Räpple S, Zeltner V, Hetterich M, et al. Clinical impact of delaying initiation of adjuvant chemotherapy in patients with early triple negative breast cancer. Breast Cancer Res Treat. (2024) 204:607–15. doi: 10.1007/s10549-023-07207-4
35. Zhan QH, Fu JQ, Fu FM, Zhang J, and Wang C. Survival and time to initiation of adjuvant chemotherapy among breast cancer patients: a systematic review and meta-analysis. Oncotarget. (2018) 9:2739–51. doi: 10.18632/oncotarget.23086
36. Li S, Ma D, Shi HH, Yu KD, and Zhang Q. The effect of delayed adjuvant chemotherapy on relapse of triple-negative breast cancer. J Thorac Dis. (2018) 10:2837–41. doi: 10.21037/jtd.2018.04.94
37. Pomponio MK, Keele LJ, Fox KR, Clark AS, Matro JM, Shulman LN, et al. Does time to adjuvant chemotherapy (TTC) affect outcomes in patients with triple-negative breast cancer? Breast Cancer Res Treat. (2019) 177:137–43. doi: 10.1007/s10549-019-05282-0
38. Li X, Yang J, Peng L, Sahin AA, Huo L, Ward KC, et al. Triple-negative breast cancer has worse overall survival and cause-specific survival than non-triple-negative breast cancer. Breast Cancer Res Treat. (2017) 161:279–87. doi: 10.1007/s10549-016-4059-6
39. Waks AG and Winer EP. Breast cancer treatment: A review. Jama. (2019) 321:288–300. doi: 10.1001/jama.2018.19323
40. Obidiro O, Battogtokh G, and Akala EO. Triple negative breast cancer treatment options and limitations: future outlook. Pharmaceutics. (2023) 15. doi: 10.3390/pharmaceutics15071796
41. Lee J. Current treatment landscape for early triple-negative breast cancer (TNBC). J Clin Med. (2023) 12. doi: 10.3390/jcm12041524
42. Chaudhuri A, Kumar DN, Dehari D, Patil R, Singh S, Kumar D, et al. Endorsement of TNBC biomarkers in precision therapy by nanotechnology. Cancers (Basel). (2023) 15. doi: 10.3390/cancers15092661
43. Dass SA, Tan KL, Selva Rajan R, Mokhtar NF, Mohd Adzmi ER, Wan Abdul Rahman WF, et al. Triple negative breast cancer: A review of present and future diagnostic modalities. Medicina (Kaunas). (2021) 57. doi: 10.3390/medicina57010062
44. Shien T and Iwata H. Adjuvant and neoadjuvant therapy for breast cancer. Jpn J Clin Oncol. (2020) 50:225–9. doi: 10.1093/jjco/hyz213
45. Mirkin KA, Greenleaf EK, Hollenbeak CS, and Wong J. Time to the initiation of adjuvant chemotherapy does not impact survival in patients with resected pancreatic cancer. Cancer. (2016) 122:2979–87. doi: 10.1002/cncr.30163
46. Corbett CJ, Xia L, Mamtani R, Malkowicz SB, and Guzzo TJ. Survival benefit persists with delayed initiation of adjuvant chemotherapy following radical cystectomy for locally advanced bladder cancer. Urology. (2019) 132:143–9. doi: 10.1016/j.urology.2019.05.038
47. Pang Q, Duan L, Jiang Y, and Liu H. Oncologic and long-term outcomes of enhanced recovery after surgery in cancer surgeries - a systematic review. World J Surg Oncol. (2021) 19:191. doi: 10.1186/s12957-021-02306-2
48. Patient-Reported Outcomes -. and return to intended oncologic therapy after. Ann Surg Open. (2023) 4:0000000000000267. doi: 10.1097/AS9.0000000000000267
49. Tian J, Jia LN, and Cheng ZC. Relationships between patient knowledge and the severity of side effects, daily nutrient intake, psychological status, and performance status in lung cancer patients. Curr Oncol. (2015) 22:e254–8. doi: 10.3747/co.22.2366
Keywords: breast cancer, adjuvant chemotherapy, late start, overall survival, ideal window, real world data
Citation: Alhalabi A, Abdo T, Herrán M, Sarna K, Tfayli R and Nahleh Z (2025) Impact of adjuvant chemotherapy delay on overall survival in early-stage breast cancer: a retrospective analysis. Front. Oncol. 15:1666673. doi: 10.3389/fonc.2025.1666673
Received: 15 July 2025; Accepted: 26 August 2025;
Published: 19 September 2025.
Edited by:
Matteo Ghilli, Pisana University Hospital, ItalyReviewed by:
Kinan Mokbel, University of Exeter, United KingdomGiulia Ferrarazzo, Ospedale Villa Scassi, Italy
Copyright © 2025 Alhalabi, Abdo, Herrán, Sarna, Tfayli and Nahleh. This is an open-access article distributed under the terms of the Creative Commons Attribution License (CC BY). The use, distribution or reproduction in other forums is permitted, provided the original author(s) and the copyright owner(s) are credited and that the original publication in this journal is cited, in accordance with accepted academic practice. No use, distribution or reproduction is permitted which does not comply with these terms.
*Correspondence: Ahmad Alhalabi, YWxoYWxhYTJAY2NmLm9yZw==