 Liang-liang Yan
 Jing Li
 Jin-rong Qu
 Hong-kai Zhang1
- 1Department of Radiology, Affiliated Cancer Hospital of Zhengzhou University & Henan Cancer Hospital, Zhengzhou, China
- 2Department of Pathology, Affiliated Cancer Hospital of Zhengzhou University & Henan Cancer Hospital, Zhengzhou, China
- 3Department of Gastric Surgery, Affiliated Cancer Hospital of Zhengzhou University & Henan Cancer Hospital, Zhengzhou, China
Purpose: To explore the differences in apparent diffusion coefficient (ADC) values based on the primary tumor and sentinel lymph node (SLN) for predicting N stages of gastric cancer (GC).
Methods: One hundred and sixty histopathologically confirmed GC patients between April 2021 and October 2024 were prospectively recruited. Preoperative DW-MRI was performed, and ADC values from primary tumors (ADCT) and SLNs (ADCLN), along with their relative ratios (rADCT, rADCLN), were measured. Differences in these parameters across N stages were analyzed using the Kruskal-Wallis test. Receiver operating characteristic analysis was used to evaluate their diagnostic performances for predicting N0 vs. N1–3 stages, N0 + 1 vs. N2 + 3 stages, and N0 + 1 + 2 vs. N3 stages.
Results: Significant differences were observed in ADCT, rADCT, ADCLN, and rADCLN values across N stages (all p < 0.001). The AUC values of ADCT, rADCT, ADCLN, and rADCLN for predicting N0 vs. N1 + 2 + 3 stages were 0.753, 0.727, 0.782, 0.792, respectively. The AUC values of ADCT, rADCT, ADCLN, and rADCLN for predicting N0 + 1 vs. N2 + 3 stages were 0.776, 0.767, 0.844, 0.837, respectively. The AUC values of ADCT, rADCT, ADCLN, and rADCLN for predicting N0 + 1 + 2 vs. N3 stages were 0.797, 0.792, 0.857, 0.848, respectively.
Conclusions: Both primary tumor- and SLN-derived ADC values can effectively differentiate N stages among patients with GC. SLN-based ADC parameters exhibit superior diagnostic performance compared to primary tumor-based measurements in stratifying N-stage progression.
Introduction
Gastric cancer (GC) has ranked fifth globally in both incidence and mortality as of 2022 (1). The TNM staging system serves as the cornerstone for GC assessment and treatment decisions in clinical practice (2). Importantly, N staging directly determines the extent of intraoperative lymph node dissection (3). Sentinel lymph nodes (SLNs), defined as the first nodes receiving tumor lymphatic drainage and serving as the initial metastatic site, may be crucial for N staging evaluation (4). Anatomically, SLNs typically reside in perigastric stations No. 1-6, and radiological criteria identify them as nodes with the largest short-axis diameter (5). The metastatic cascade involves tumor cell detachment from the primary lesion, invasion through high endothelial venules, and subsequent lymphatic dissemination (6). Given this mechanism, the status of SLNs may theoretically provide a more reliable indicator for N-stage evaluation than the primary tumor itself.
The apparent diffusion coefficient (ADC), derived from diffusion-weighted magnetic resonance imaging (DW-MRI), is one of the most robust quantitative parameters in functional imaging. ADC has demonstrated significant value in quantitatively assessing the N-stage of GC (7–13). Previous studies primarily focused on ADC values obtained from primary tumor regions for N-stage evaluation (8–13). Given the aforementioned metastatic cascade, ADC values obtained from SLNs might enable more accurate N-stage assessment. However, our comprehensive PubMed search identified no prior studies investigating the potential of SLN ADC values for N-staging. Thus, this study aims to determine whether ADC values from SLNs differ significantly from those of primary tumors in predicting the N-stage of GC.
Materials and methods
Patients
This prospective study was approved by the Institutional Review Committee of Affiliated Cancer Hospital, Zhengzhou University (IRB No. [2021]023). We recruited patients who underwent gastric DW-MRI at our institution between April 2021 and October 2024, and all participants provided informed consent. The inclusion criteria were: 1. Endoscopically biopsy-confirmed gastric adenocarcinoma; 2. Patients underwent gastric MRI including T1-weighted, T2-weighted, and DWI sequences. The exclusion criteria were: 1. Surgery was performed more than two weeks after the MRI examination; 2. SLNs (stations No. 1-6) with short-axis diameter <3 mm; 3. Discordance in size or spatial distribution between DWI findings and surgical pathology records; 4. Mucinous adenocarcinoma subtype; 5. Poor image quality or severe artifacts compromising accurate analysis.
MRI technique
All MRI scans were performed using a 3.0T MR scanner (MAGNETOM Skyra, Siemens, Erlangen, Germany) with built-in 18-channel body and 32-channel spine coils. All patients were positioned supine in the head-first position. Patients fasted for 6–8 hours before MRI. Approximately 10 minutes prior to scanning, 10 mg anisodamine was administered intramuscularly. Patients were instructed to drink 800–1000 mL of water 1–2 minutes before the scan.
Scanning was performed according to standard MRI protocols, with specific sequence scan parameters as follows: 1. T1WI: TR/TE = 4.34 ms/2.68 ms, slice thickness = 3 mm, FOV = 380 mm × 380 mm; 2. T2WI: TR/TE = 4000–8000 ms/96 ms, slice thickness = 3 mm, FOV = 380 mm × 380 mm; 3. DWI: TR/TE = 2600 ms/51 ms, slice thickness = 3 mm, FOV = 340 mm × 340 mm, b = 50, 800 s/mm2(A low b-value of 50 s/mm² helps to mitigate T2 shine-through effects, enabling better differentiation of true diffusion restriction from T2-prolongation); 4. DCE: TR/TE = 3.87 ms/1.82 ms; section thickness = 2.5 mm; FOV = 380; flip angle = 12°.
Image interpretation
The DW-MRI data were transferred to the SyngoVia post-processing workstation. All data were independently analyzed by two radiologists with 7 and 11 years of work experience without knowing the pathological N staging results. First, the primary tumor and SLN (stations No. 1-6) were identified using T2WI, DWI, and DCE images. For each case, only the SLN with the largest short-axis diameter was selected for analysis. The ADC values of primary tumor (ADCT) and SLN (ADCLN) were measured on the corresponding ADC maps by manually drawing a freehand ROI covering the solid component of tumor with necrotic areas avoided. Reference ADC (rADCT and rADCLN) values were obtained from ADCT value/normal gastric wall ADC value of the same axial section, ADCLN value/left erector spinae muscle ADC value of the same axial section, respectively (Figures 1, 2).
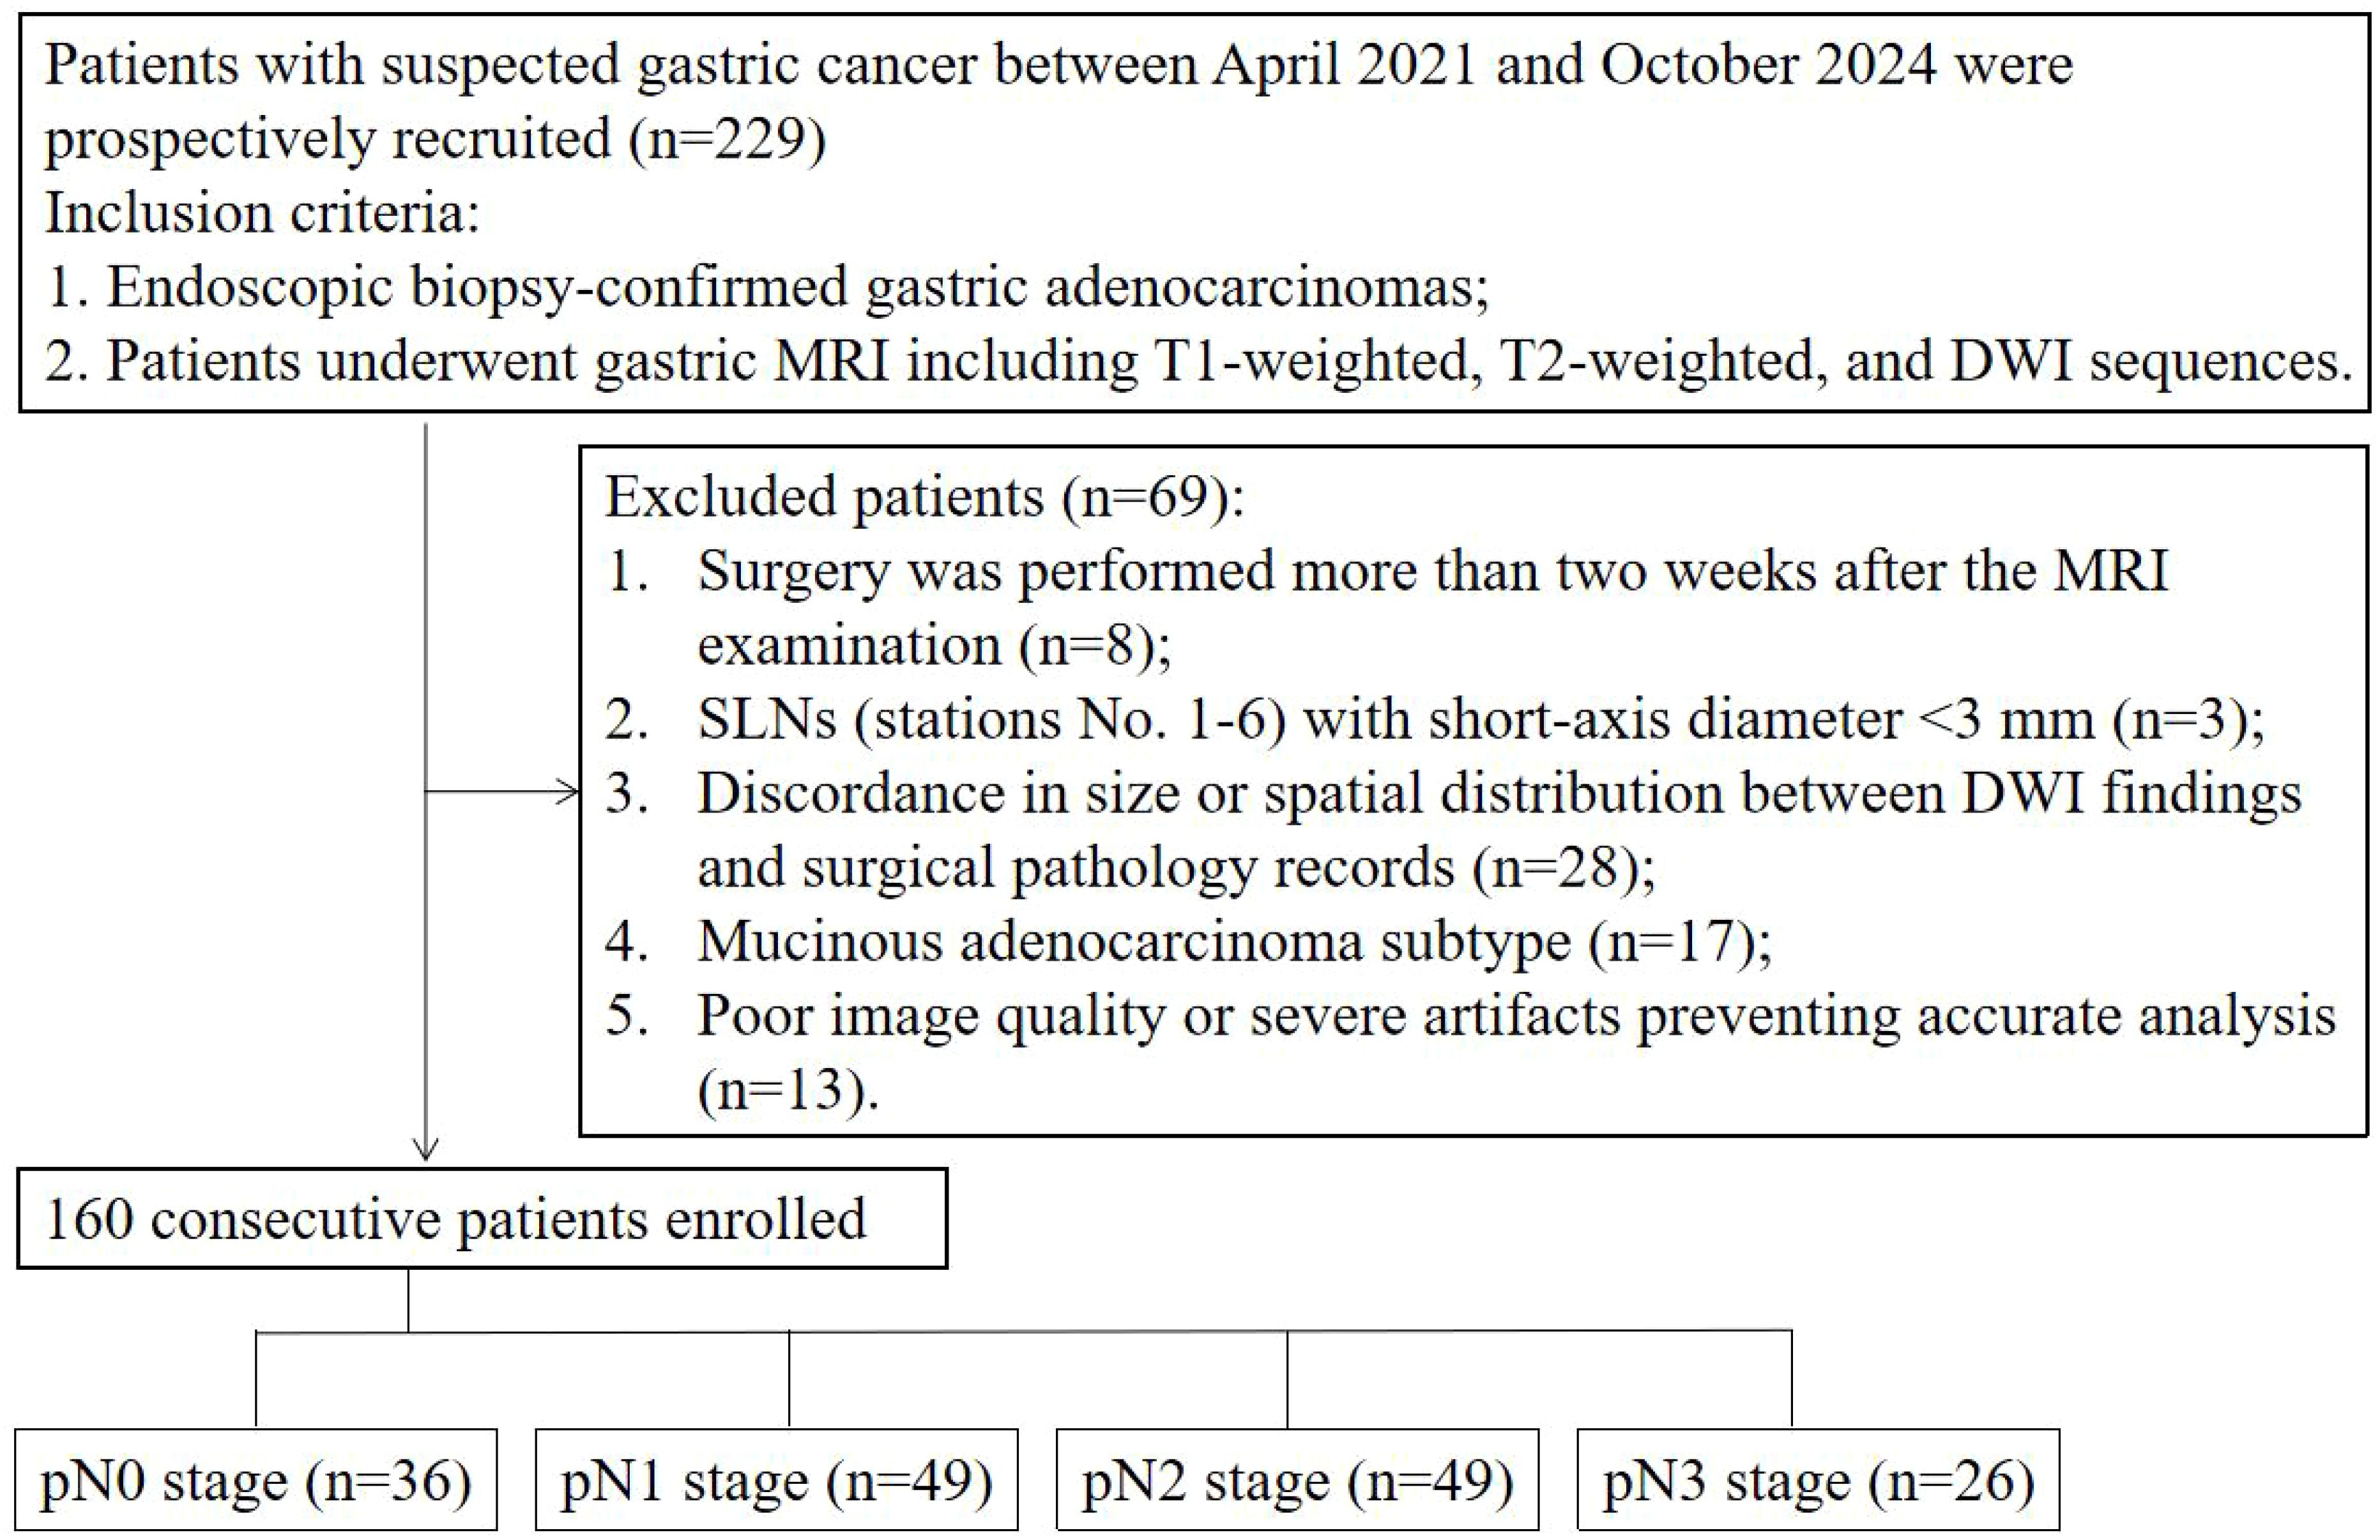
Figure 1. Flow diagram of the study patients. SLN, sentinel lymph node.
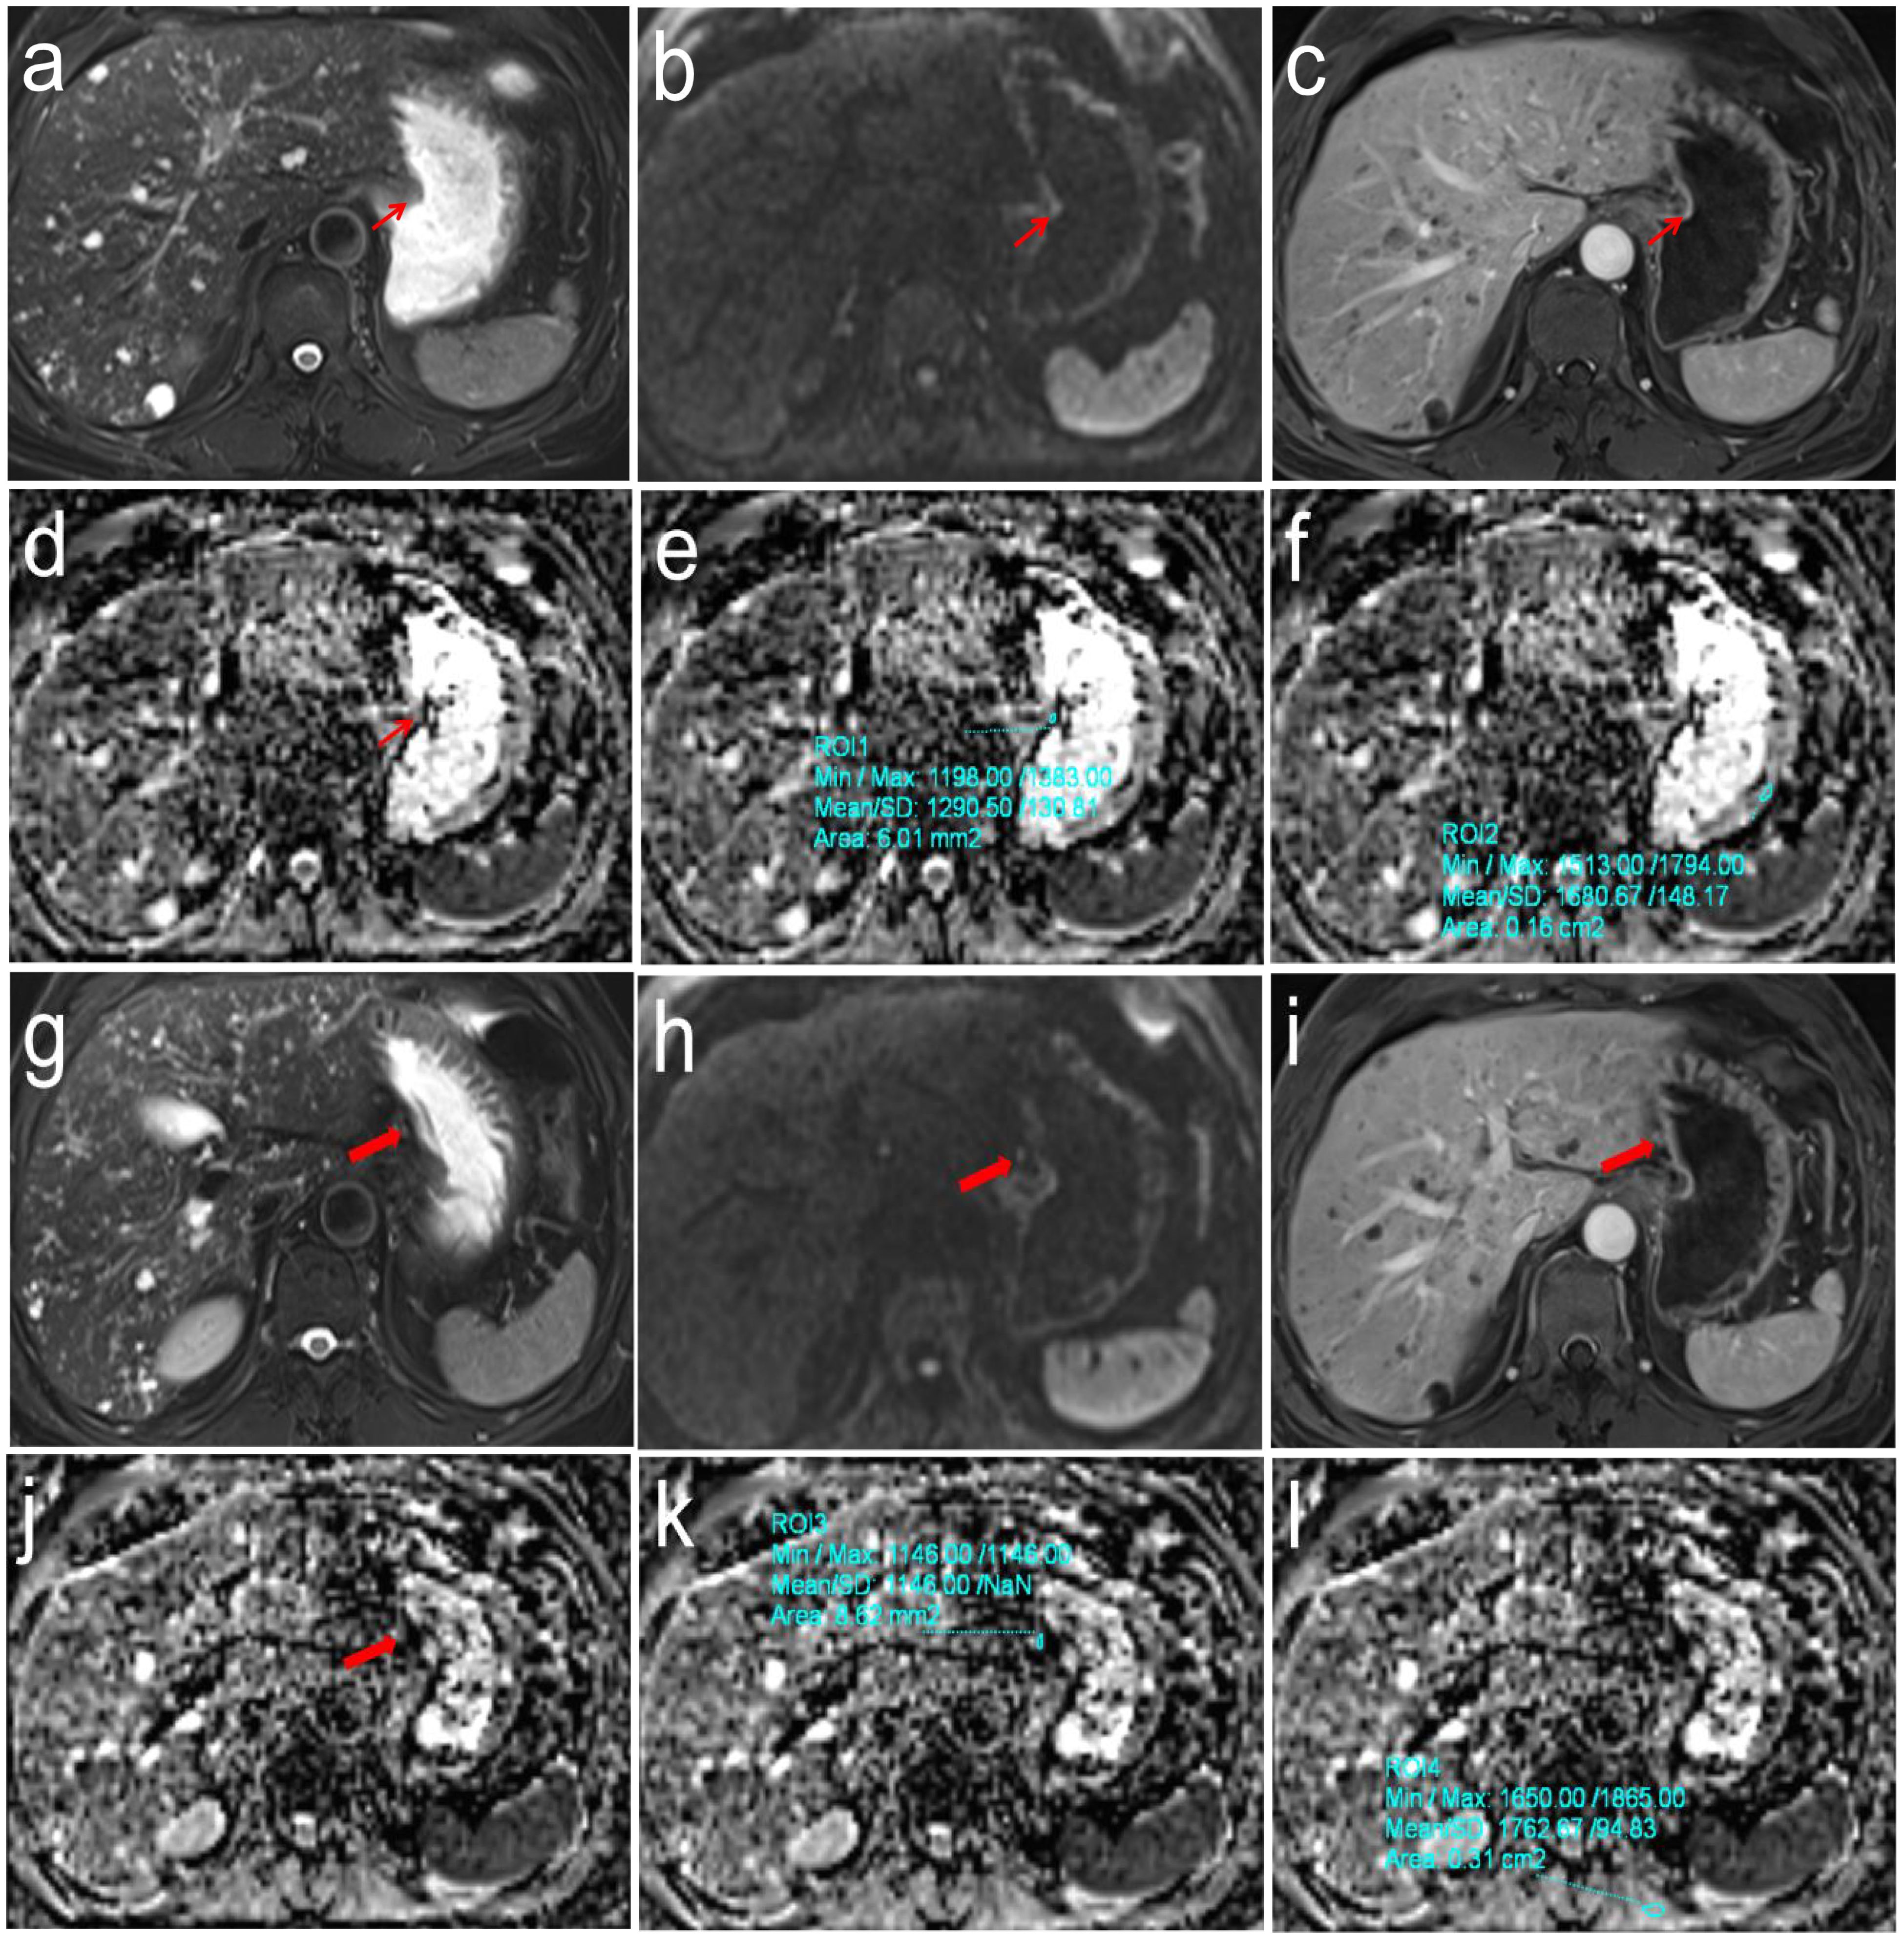
Figure 2. Pathologically confirmed gastric corpus adenocarcinoma (pT1N0M0) in a 62-year-old male. (a-f) T2WI, DWI and DCE images showed the location of primary tumor (Thin red arrow). The ADC values of primary tumor and normal gastric wall of the same axial section were 1.291 × 10⁻³mm2/s and 1.681 × 10⁻³mm2/s, respectively, the correspond rADCT value were 0.768; (g-l) T2WI, DWI and DCE images showed the location of perigastric sentinel lymph nodes (No. 3) (Thick red arrow). The short-axis diameter was about 3.2mm. The ADC values of target sentinel lymph nodes and the left vertical spinal muscle at the same axial section were 1.146 × 10⁻³ mm2/s and 1.763 × 10⁻³ mm2/s, respectively, the correspond rADCLN value were 0.650.
Determination of pathologic N stage
All resected specimens, including both gastric primary tumors and SLNs, were systematically grouped, labeled with their respective anatomical locations and sizes, and subsequently submitted to the pathology department for standard formalin fixation, paraffin embedding, sectioning, and HE staining. The pathological evaluation was conducted using the American Joint Committee on Cancer/Union for International Cancer Control (AJCC/UICC) 8th edition as the evaluation criteria. The criteria for determining SLN metastasis were lymph node short-axis diameter greater than 10mm or microscopically determined cancer cell infiltration. The evaluation criteria of N stage were: N0 stage, no regional lymph node metastasis; N1 stage, 1–2 regional lymph node metastases; N2 stage, 3–6 regional lymph node metastases; N3 stage, more than 7 regional lymph node metastases.
Statistical analysis
All statistical analysis were performed using the SPSS 22.0 (IBM Corp., Armonk, NY, USA) and MedCalc 20.218 (MedCalc Software Ltd, Ostend, Belgium). The measured ADCT, rADCT, ADCLN, and rADCLN values were expressed as mean ± standard deviation. Intraclass correlation coefficient (ICC) test was performed to determine the consistency of ADCT, rADCT, ADCLN, and rADCLN values measured by two radiologists using Bland-Altman analysis. The ICC between 0.00 and 0.20 was defined as poor correlation; 0.21-0.40 as fair correlation; 0.41–0.60 as moderate correlation; 0.61–0.80 as good correlation; and 0.81–1.00 as excellent correlation. The Kruskal Wallis test was used to compare differences in ADCT, rADCT, ADCLN, and rADCLN values between different N stages of GC. Receiver operating characteristic (ROC) curves were used to determine the diagnostic performance for predicting N0 vs. N1 + 2 + 3 stages, N0 + 1 vs. N2 + 3 stages, and N0 + 1 + 2 vs. N3 stages. The area under the curve (AUC) value of 0.85–1 was defined as good diagnostic performance, 0.70-0.84 as moderate diagnostic performance, and 0.50-0.69 as poor diagnostic performance. Pairwise comparisons between different AUCs were performed using the DeLong test. p < 0.05 was considered statistically significant.
Results
Study population
A total of 229 cases were initially collected. Among these, 8 cases were excluded because surgery was performed more than two weeks after the MRI examination; 3 cases were excluded due to SLNs (stations No. 1–6) with a short-axis diameter <3 mm; 28 cases were excluded because of discordant SLN findings between DWI and surgical pathology (anatomical station mismatch or >5 mm short-axis diameter discrepancy); 17 cases were mucinous adenocarcinoma; and 13 cases had poor image quality or severe artifacts that precluded accurate analysis. Ultimately, 160 cases (mean age 60.9 ± 9.7 years; 128 men) were included in this study. The flowchart of the included cases is shown in Figure 3.
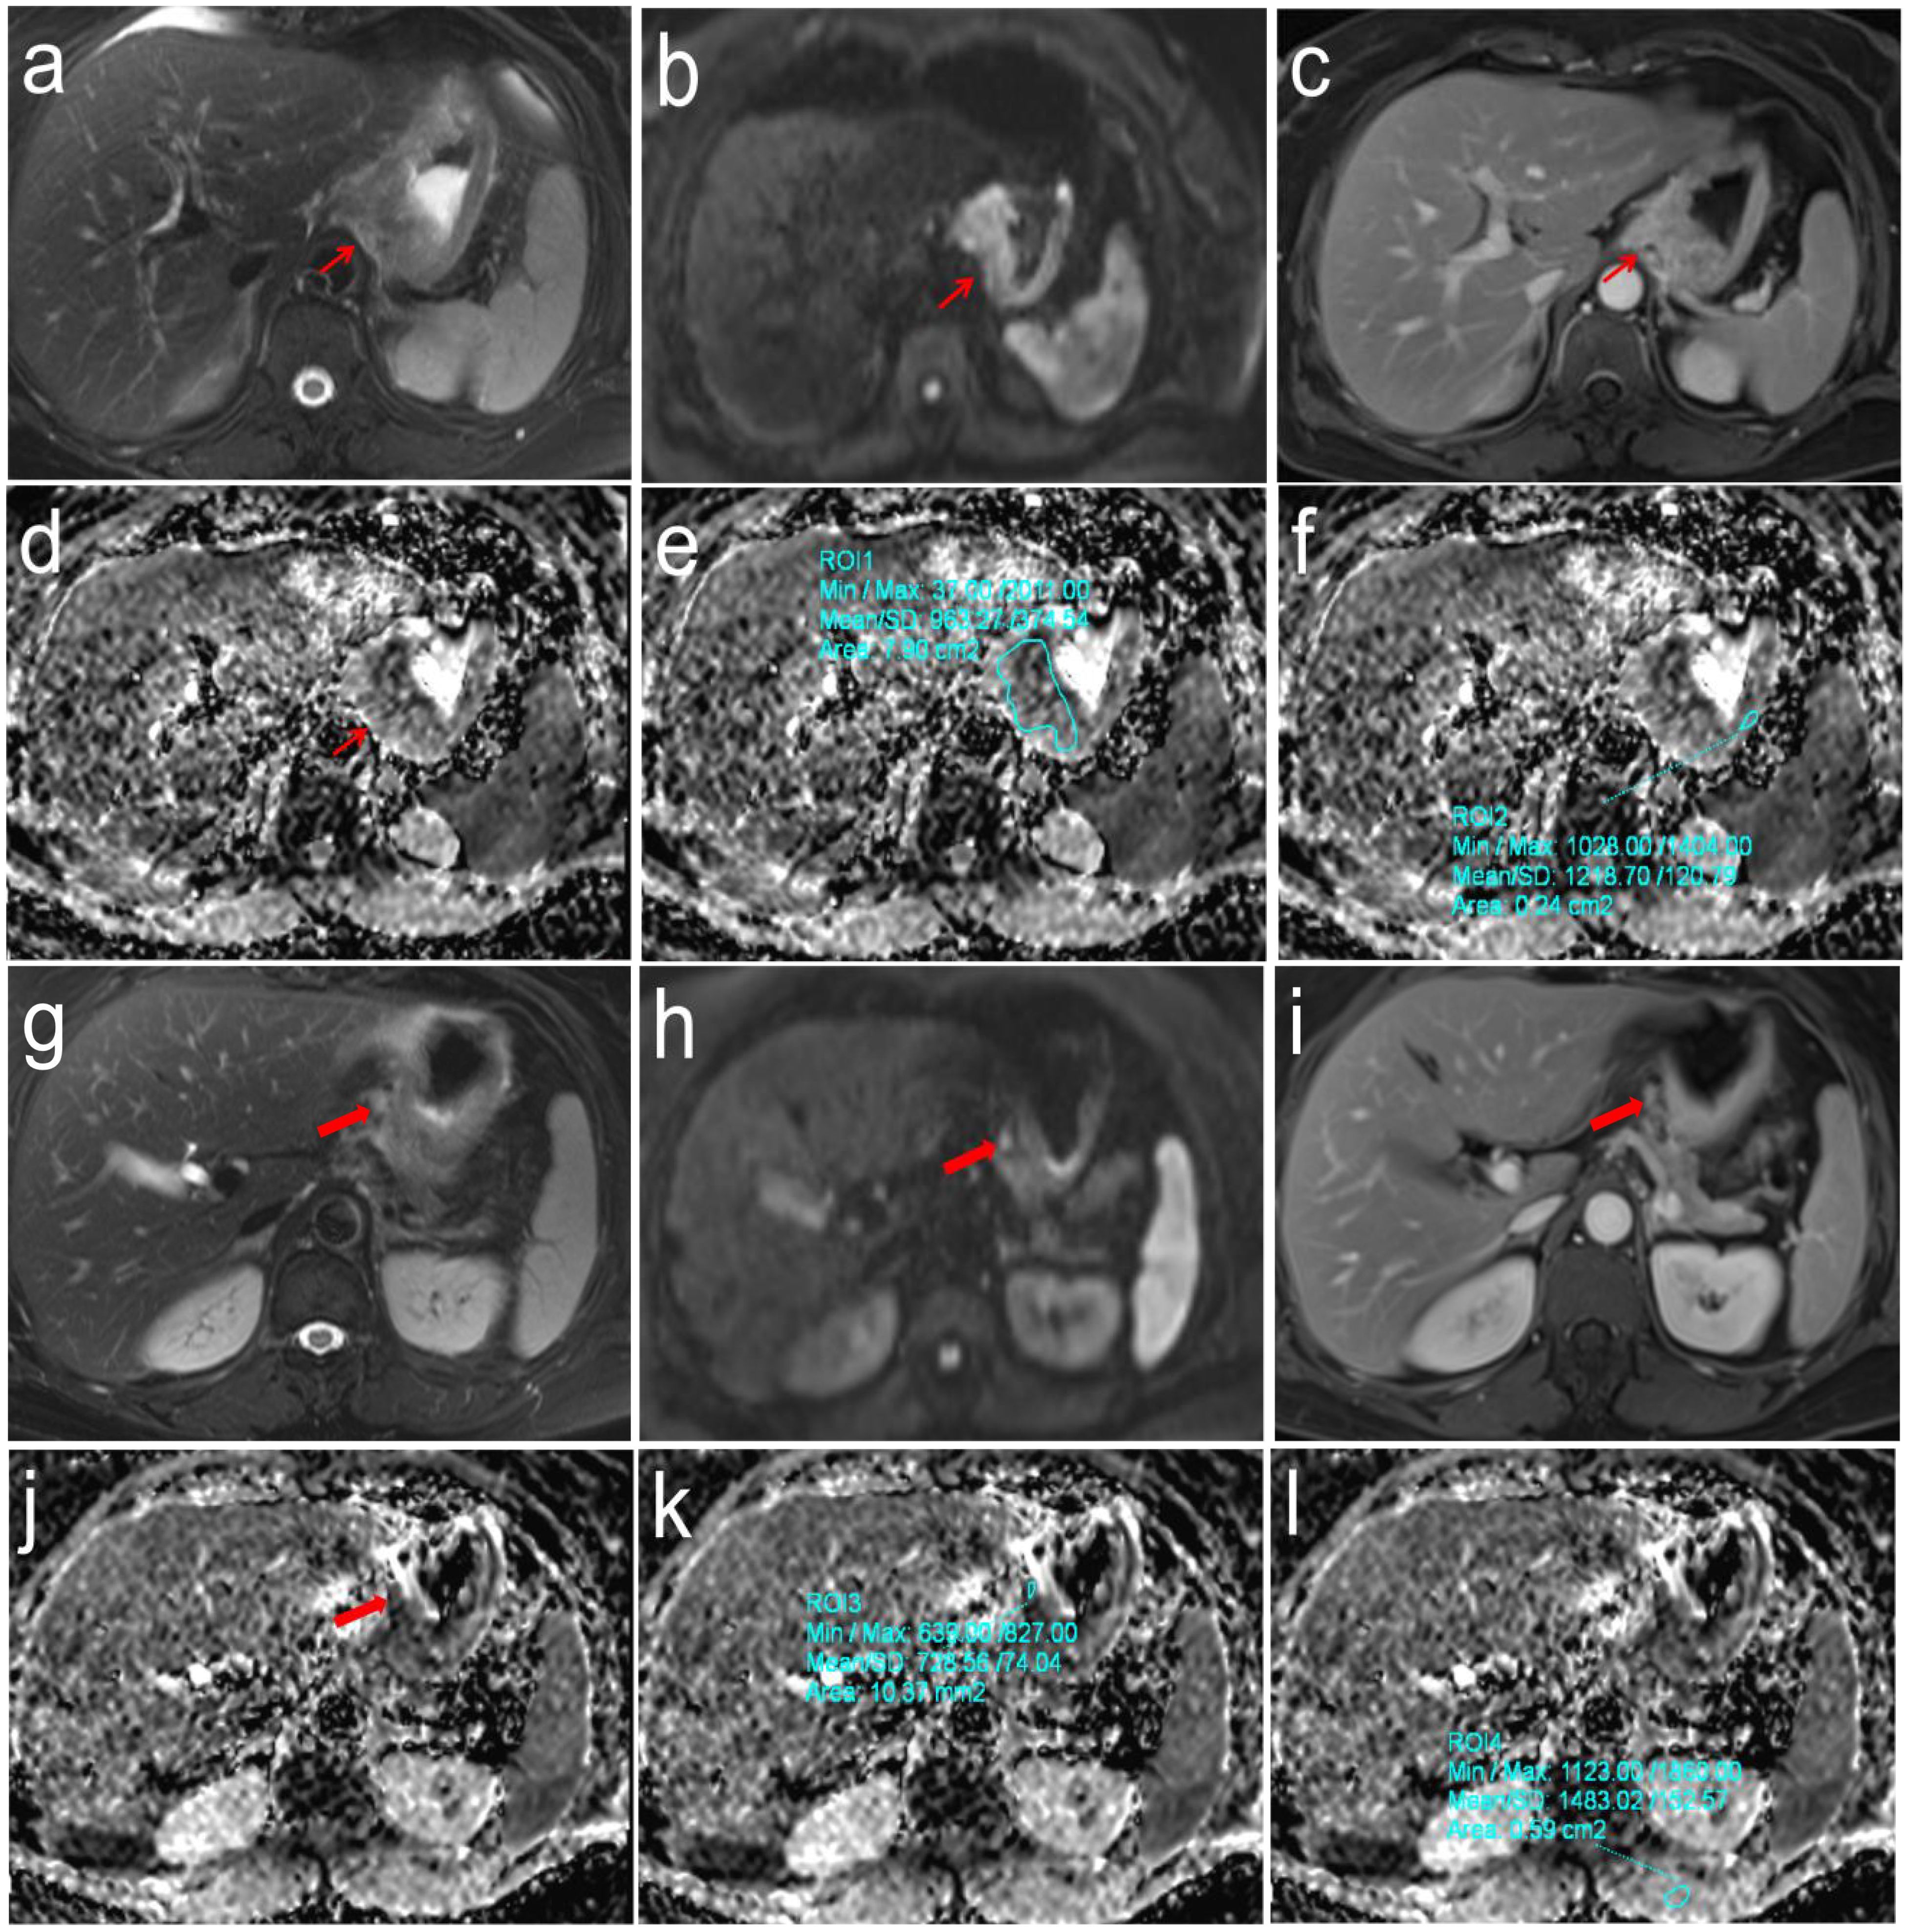
Figure 3. Pathologically confirmed gastric cardia adenocarcinoma (pT3N2M0) in a 57-year-old female. (a-f) T2WI, DWI and DCE images showed the location of primary tumor (Thin red arrow). The ADC values of primary tumor and normal gastric wall of the same axial section were 0.963 × 10⁻³mm2/s and 1.219 × 10⁻³mm2/s, respectively, the correspond rADCT value were 0.790; (g-l) T2WI, DWI and DCE images showed the location of perigastric sentinel lymph nodes (No. 2) (Thick red arrow). The short-axis diameter was about 6.2mm. The ADC values of target sentinel lymph nodes and the left vertical spinal muscle at the same axial section were 0.729 × 10⁻³ mm2/s and 1.483 × 10⁻³ mm2/s, respectively, the correspond rADCLN value were 0.492.
The clinical pathological characteristics of this study are shown in Table 1. Age, gender, tumor location, tumor thickness, short-axis diameter of selected gastric lymph nodes, pathological TNM staging, the number of selected gastric lymph nodes, and lymph node dissection were recorded. Among them, tumor thickness, short-axis diameter of selected gastric lymph nodes, pathological T stage, pathological TNM staging, lymph node dissection demonstrated statistically significant differences in distinguishing the four N-stage groups (all p < 0.01).
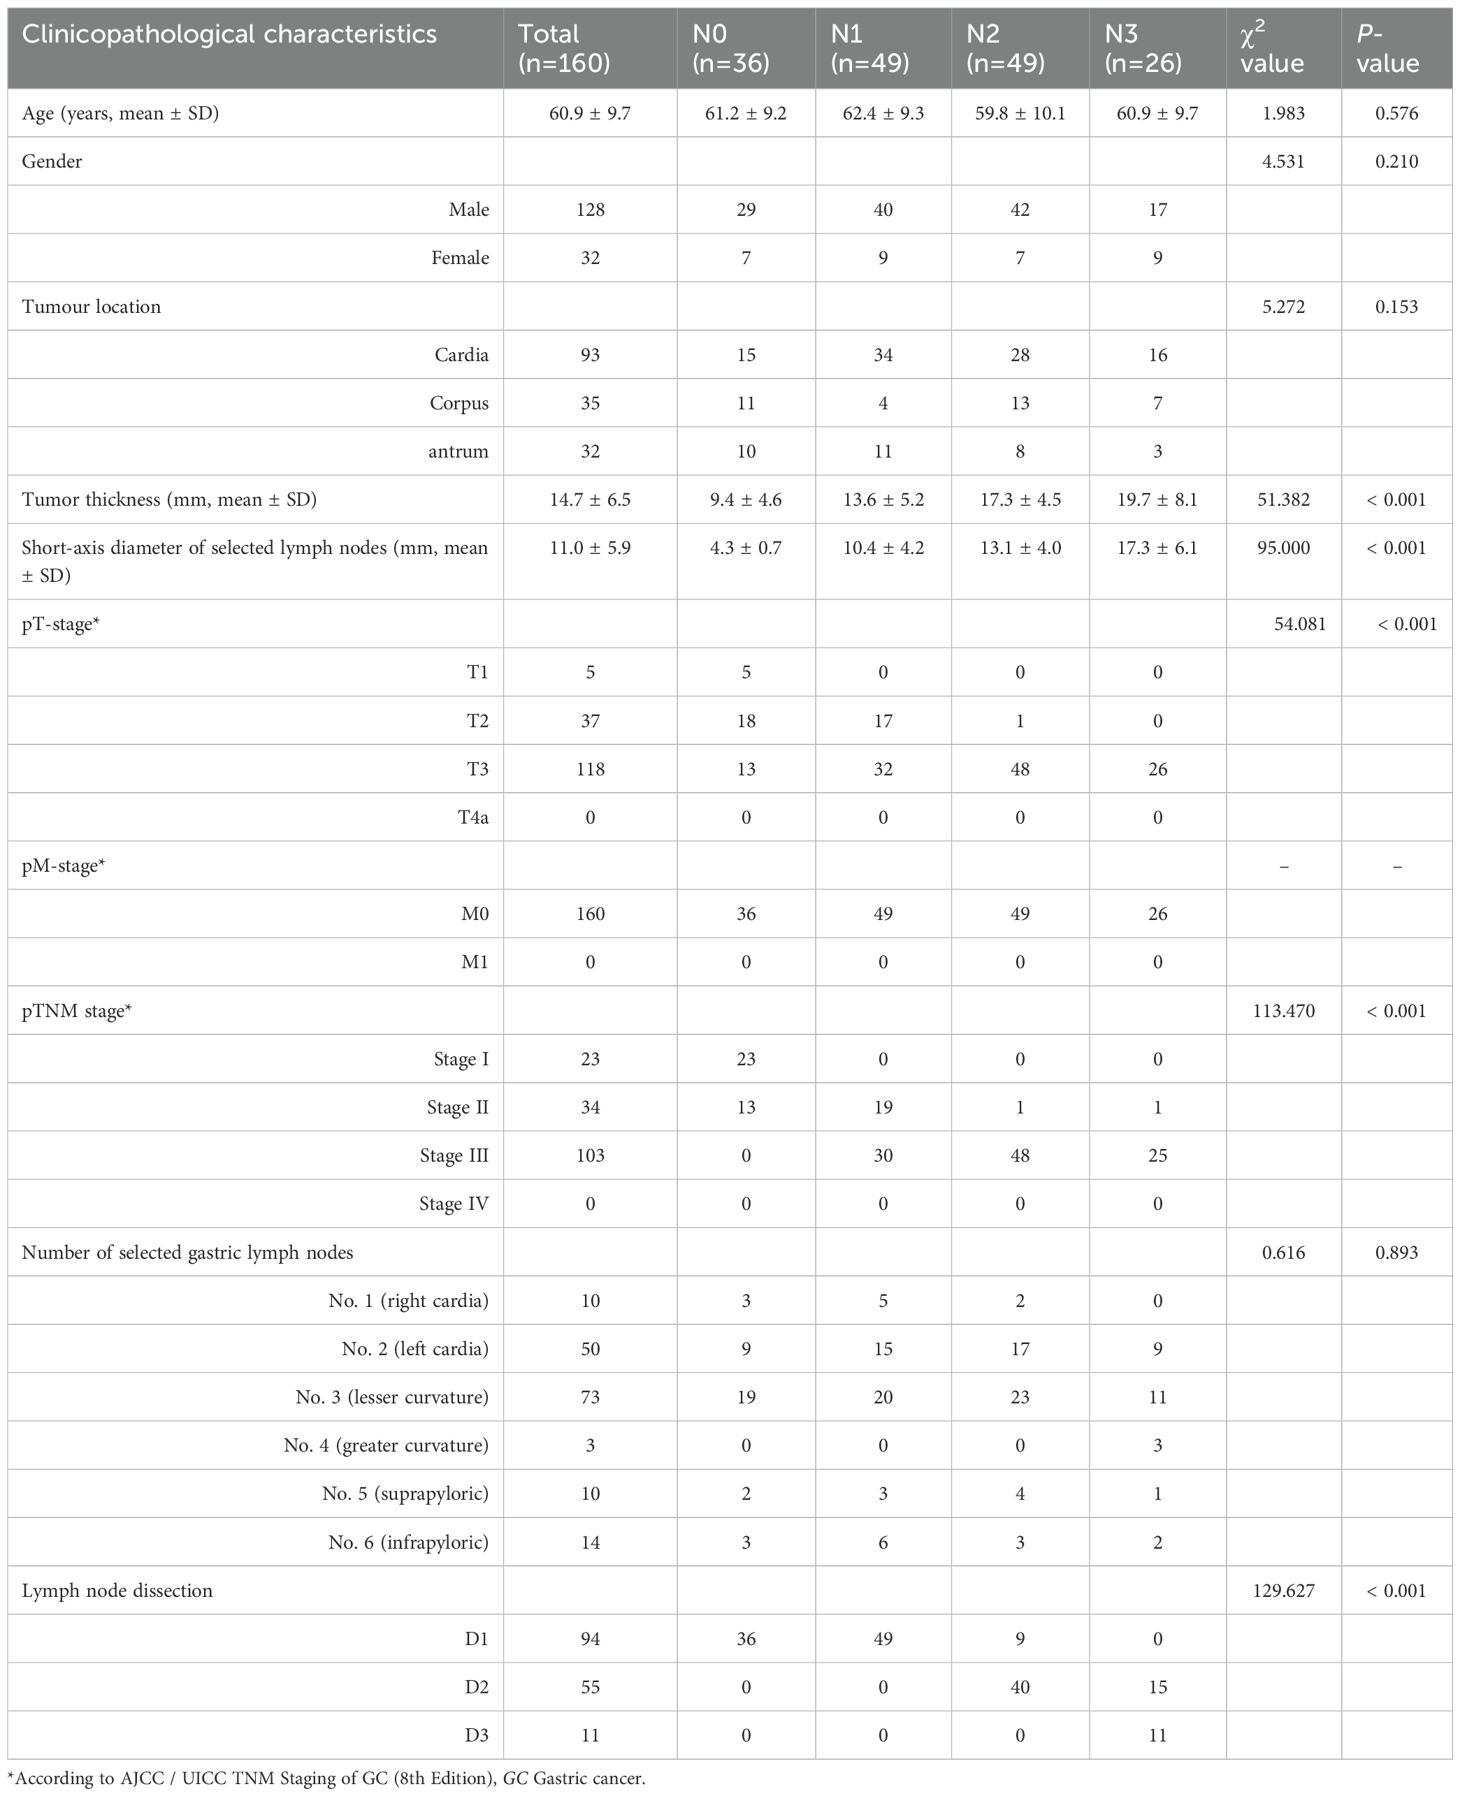
Table 1. The clinicopathological characteristics of GC.
Interobserver agreement
The consistency analysis of ADCT, rADCT, ADCLN, and rADCLN values measured by two radiologists is shown in Appendix Table 1; Figure 4. The ICC values ranged 0.813-0.890, indicating an excellent correlation.
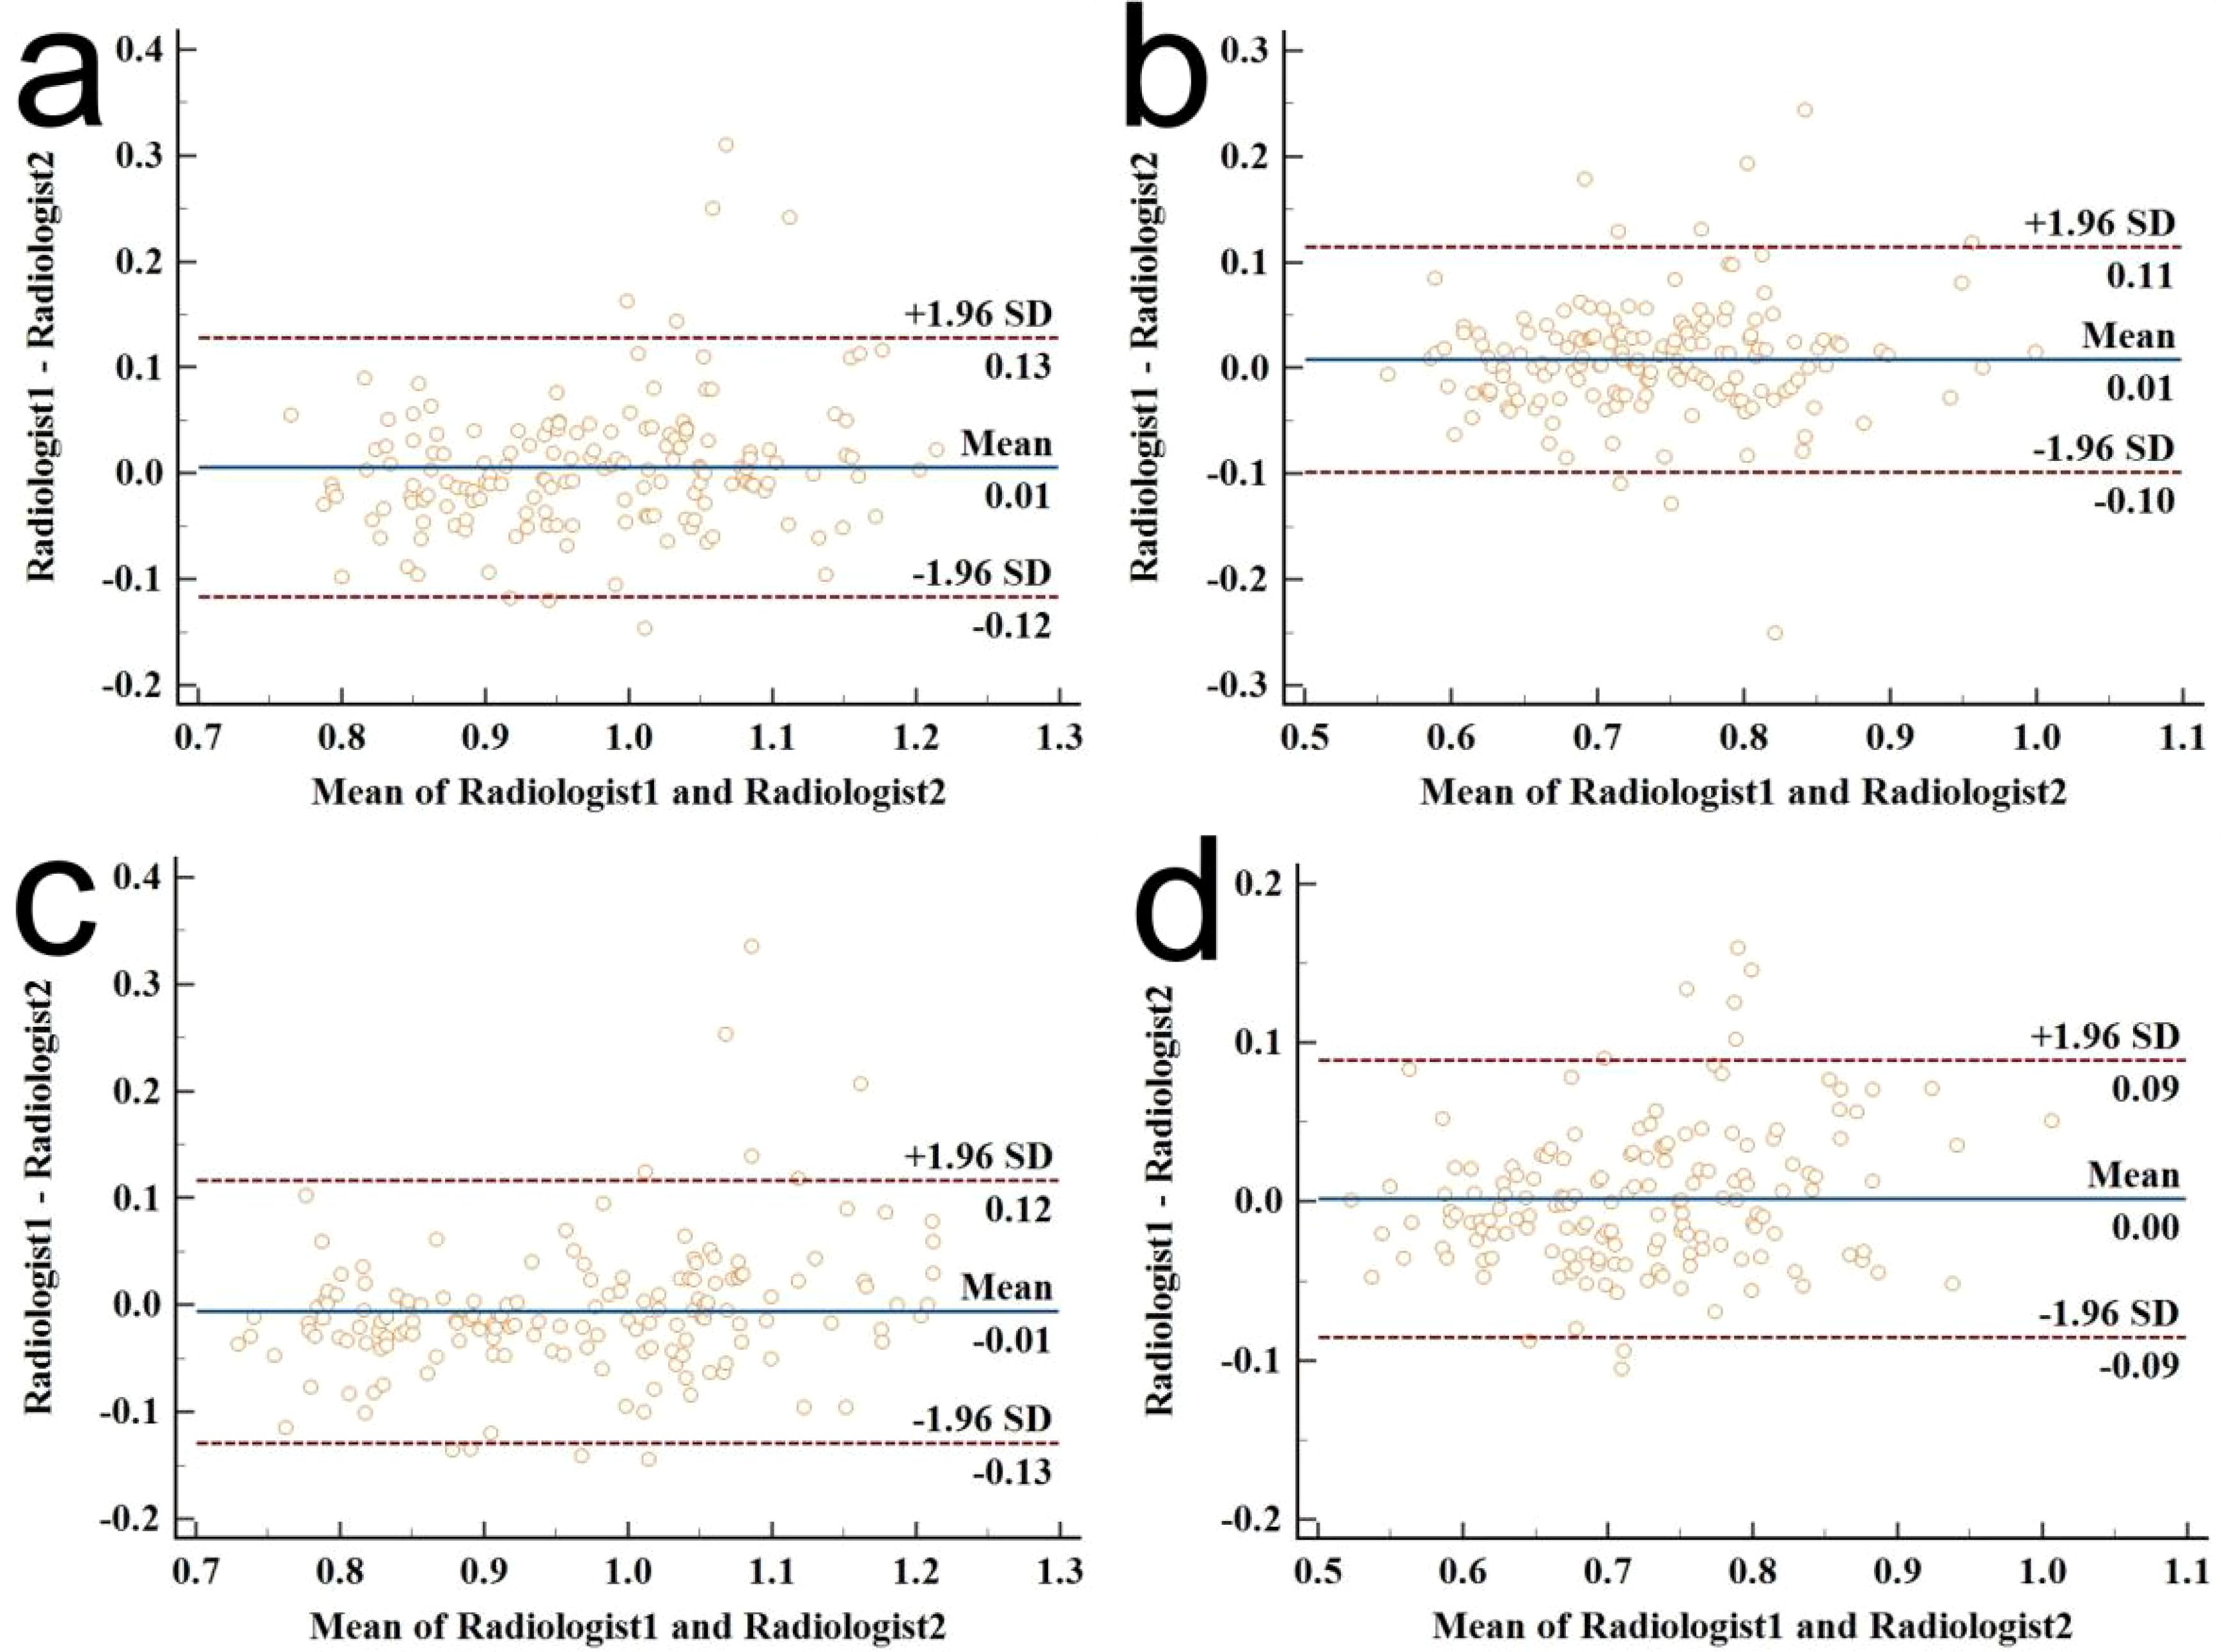
Figure 4. Bland–Altman plot diagrams for the interobserver agreement of ADC value measurements between the two radiologists. (a) ICC for ADCT measurements; (b) ICC for rADCT measurements; (c) ICC for ADCLN measurements; (d) ICC for rADCLN measurements.
ADC parameters analysis
Table 2 showed that ADCT, rADCT, ADCLN, rADCLN have statistically significant differences in distinguishing different N stages of GC (all p < 0.001). The ADCT, rADCT, ADCLN, and rADCLN values were negative correlation with N stage.
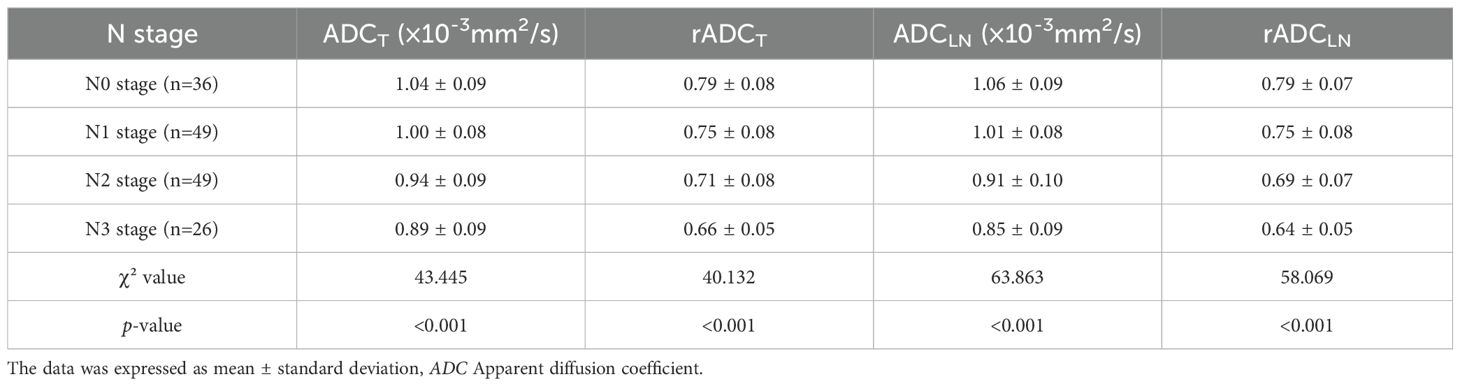
Table 2. Differences analysis of different ADC values between N stages.
The ROC curve indicated that the AUC values of ADCT, rADCT, ADCLN, and rADCLN for predicting N0 vs. N1 + 2 + 3 stages were 0.753, 0.727, 0.782, 0.792, respectively (Table 3, Figure 5a). In the pairwise comparison of ROC curves, there were statistically significant differences in AUC values between rADCT and rADCLN (Delong test, Z = 2.381, p = 0.017), while there was no statistically significant difference between other pairwise comparisons (all p > 0.05) (Table 4).

Table 3. ROC analysis of different ADC for predicting N0 vs. N1+2+3 stages of GC.
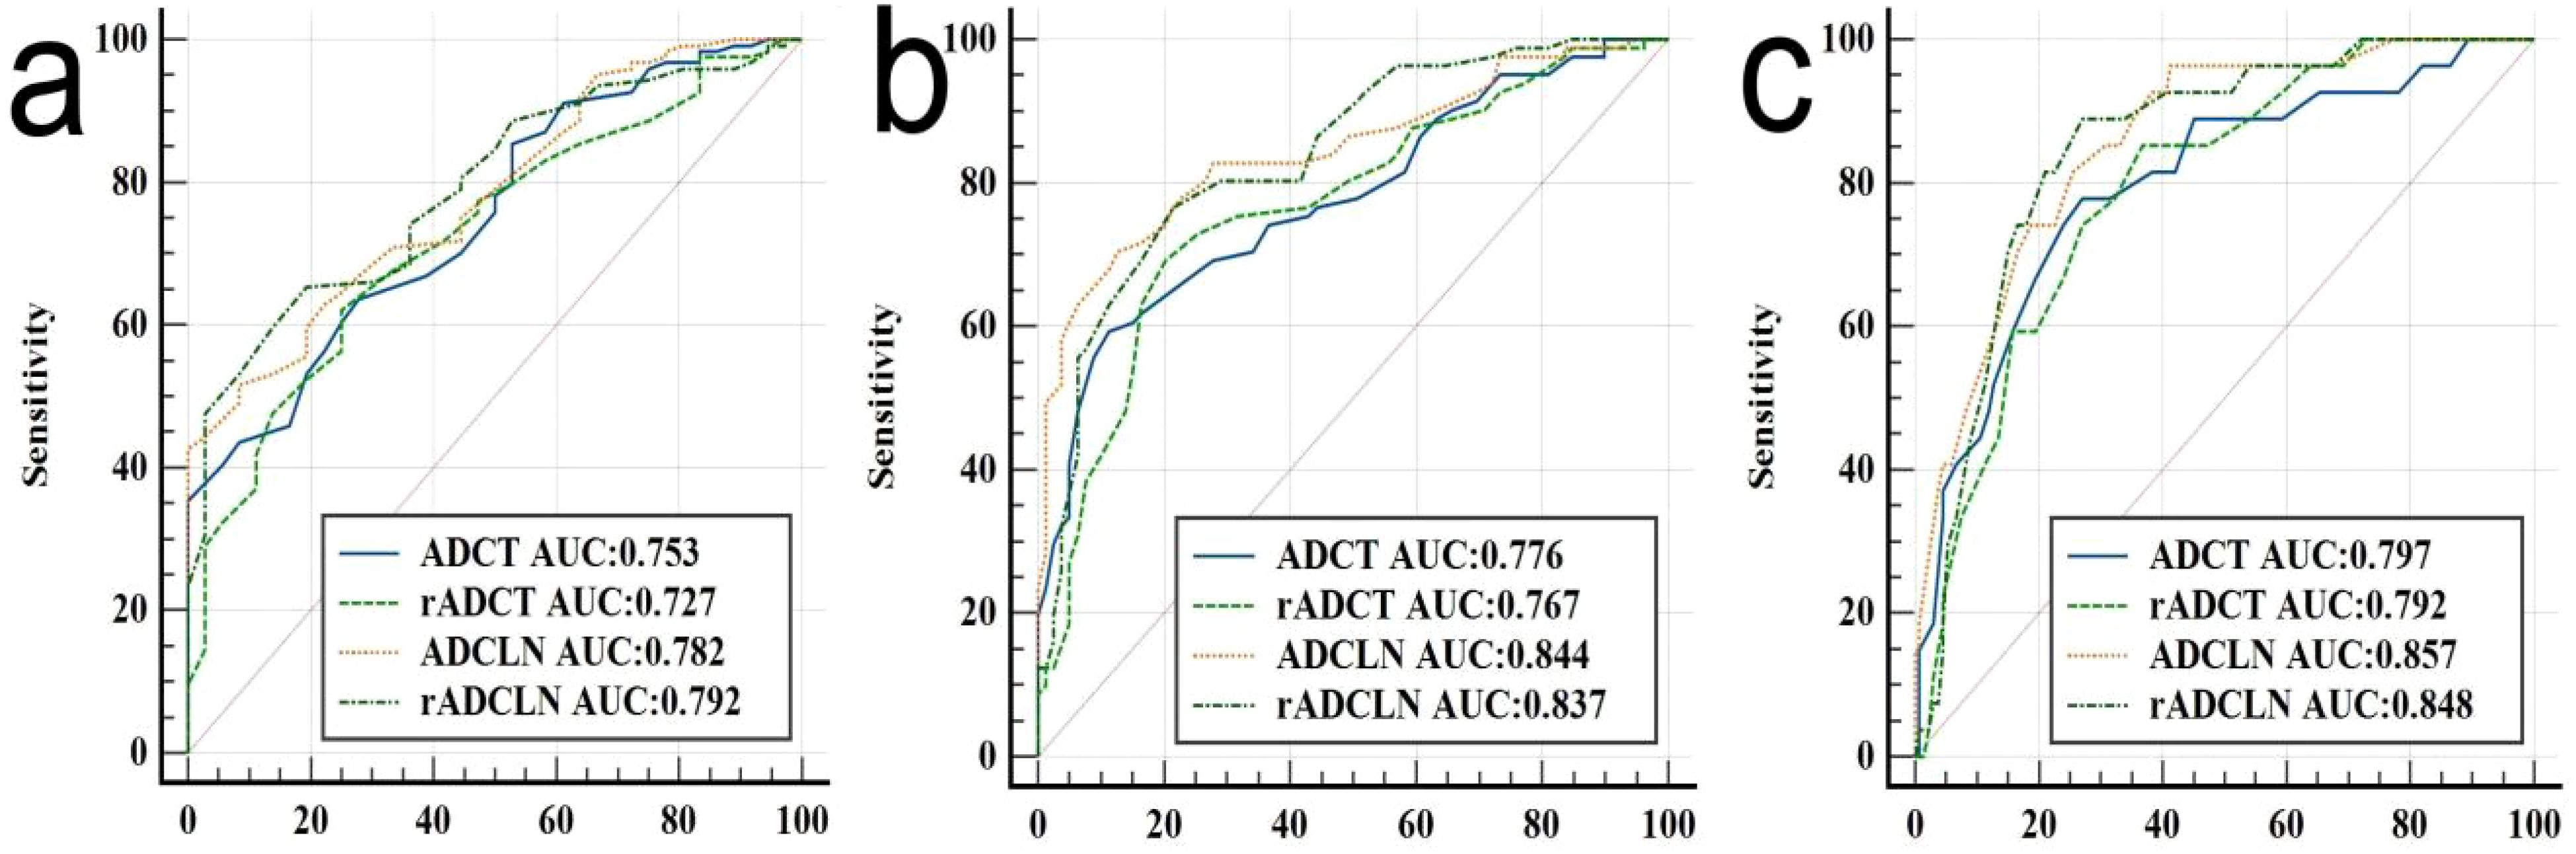
Figure 5. ROC analysis of different ADC for predicting (a) N0 vs. N1 + 2 + 3 stages, or (b) N0 + 1 vs. N2 + 3 stages, and (c) N0 + 1 + 2 vs. N3 stages of gastric cancer.
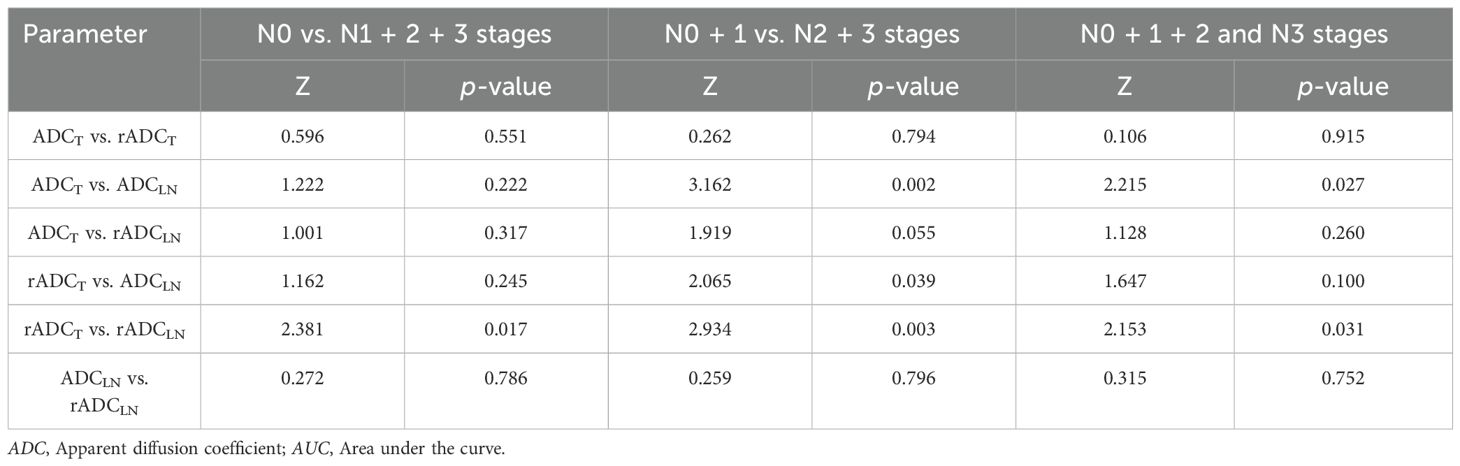
Table 4. Pairwise comparisons between different AUCs.
The AUC values of ADCT, rADCT, ADCLN, and rADCLN for predicting N0 + 1 vs. N2 + 3 stages were 0.776, 0.767, 0.844, 0.837, respectively (Table 5, Figure 5b). In the pairwise comparison of ROC curves, there were statistically significant differences in AUC values between ADCT and ADCLN, rADCT and ADCLN, rADCT and rADCLN (Z = 3.162, 2.065, 2.934, p = 0.002, 0.039, 0.003, respectively), while there was no statistically significant difference between other pairwise comparisons (all p > 0.05) (Table 4).

Table 5. ROC analysis of different ADC for predicting N0 + 1 vs. N2 + 3 stages of GC.
The AUC values of ADCT, rADCT, ADCLN, and rADCLN for predicting N0 + 1 + 2 vs. N3 stages were 0.797, 0.792, 0.857, 0.848, respectively (Table 6, Figure 5c). In the pairwise comparison of ROC curves, there were statistically significant differences in AUC values between ADCT and ADCLN, rADCT and rADCLN (Z = 2.215, 2.153, p = 0.027, 0.031, respectively), while there was no statistically significant difference between other pairwise comparisons (all p > 0.05) (Table 4).

Table 6. ROC analysis of different ADC for predicting N0 + 1 + 2 vs. N3 stages of GC.
Discussion
This prospective study investigated the diagnostic performances of ADC and rADC values measured in primary tumors and SLNs for N-stage classification in GC. Quantitative analysis demonstrated that both tumor-based ADC and SLN-based ADC parameters effectively discriminated between different N stages. Notably, SLN-based ADC parameters exhibited significantly higher diagnostic performance than tumor-based ADC parameters for predicting N0 vs. N1 + 2 + 3 stages, or N0 + 1 vs. N2 + 3 stages, and N0 + 1 + 2 vs. N3 stages.
Our findings demonstrated that ADCT can effectively differentiate N stages in GC, corroborating previous reports in the literature (9–11). The underlying physiological basis lies in how ADC values quantify water molecule diffusion. With advancing N stage, more aggressive tumor proliferation leads to higher cellular density and reduced extracellular space. These changes restrict water molecule mobility, thereby leading to the observed progressive decrease in ADC values (14).
This study demonstrated that both ADCLN and rADCLN values could effectively differentiate between N stages in GC. To our knowledge, no prior studies have investigated N staging using lymph node-based ADC parameters. This gap in the literature may be attributed to several technical challenges: 1. Difficulties in achieving precise radiological-pathological correlation for individual lymph nodes; 2. A high necrosis rate in metastatic lymph nodes, which can introduce bias into ADC measurements; 3. The presence of multiple metastatic lymph nodes in advanced GC, complicating the selection of nodes for measurement; 4. Interference from severe chemical shift artifacts in certain lymph nodes. To mitigate these limitations, our study employed stringent selection criteria by focusing on SLNs, thereby improving measurement accuracy and minimizing potential errors.
Our findings demonstrate the superior diagnostic performance of SLN-based over tumor-based ADC values in differentiating N0 vs. N1 + 2 + 3 stages, N0 + 1 vs. N2 + 3 stages, and N0 + 1 + 2 vs. N3 stages in GC. We propose that the shorter disease duration of SLN metastases compared to the primary tumor underlies this difference. Given the marked propensity of adenocarcinoma for necrosis (15), the more established primary tumor is likely to harbor more necrotic foci. Since necrosis elevates ADC values by reducing diffusion restriction (16)—and because our ROIs, despite stringent protocols, might have included microscopic necrosis—ADCT measurements could be systematically inflated. This would diminish their utility for staging. In contrast, the greater cellular integrity of SLN metastases maintains more consistent diffusion restrictions, which better reflect the metastatic burden.
We introduced rADC measurements with the original intention of normalizing values to mitigate inter-scanner variability. However, this study revealed that rADC—whether derived from primary tumors or SLNs—demonstrated either inferior or comparable diagnostic performance compared to absolute ADC values across all three N-stage subgroups. DeLong’s test further confirmed that the differences in AUC between rADC and ADC were not statistically significant. Consequently, selecting absolute ADC values as the standard parameter for N-stage stratification proves more clinically practical than relative ADC, as it eliminates the need for additional measurements of normal gastric wall or reference muscle ADC values, thereby facilitating broader clinical adoption.
Our research demonstrates that ADCLN effectively distinguishes between N0 and ≥N1 stages in GC, consistent with previous findings (17–20). This capability has important implications for clinical decision-making regarding lymph node dissection. Current guidelines recommend D1 lymphadenectomy for N0 stage patients, while D2 lymphadenectomy is indicated for ≥N1 stage cases (3, 21). Furthermore, this study provides a novel perspective for predicting patient survival by differentiating between N0 + 1 and N2 + 3 stages. Clinically, cases with metastasis confined only to the SLNs are mostly classified as N1 disease. As reported by Jeong et al. (22), the 5-year survival rate for patients with SLN metastasis only was 73.1%, compared to merely 39.6% for those with distant lymph node metastasis. Our study demonstrates that ADCLN (optimal cutoff: 0.93 × 10-³ mm²/s) may be used to predict patient prognostic outcomes.
The literature indicates that lymph nodes with a short-axis diameter exceeding 5 mm in GC exhibit a significantly increased likelihood of metastasis (23). In our study, the short-axis diameters of selected SLNs in the N1-N3 stages consistently exceeded 5 mm, aligning with these findings. In addition, to evaluate the impact of ADC values on N0 staging, we included SLNs with short axis diameters ranging from 3–5 mm as the research subjects.
This study excluded cases with skip lymph node metastasis, as prior studies reported a skip metastasis rate of 3.9%–5.3% in GC cases (24–26). Additionally, establishing standardized assessment criteria for skip metastatic lymph nodes presents inherent challenges.
Due to mucinous adenocarcinoma characteristically high extracellular mucin content (27)—which results in imaging features and ADC measurements that differ significantly from non-mucinous GCs—and its relatively low incidence (2.8-6.6% of cases (28)), we excluded mucinous adenocarcinoma cases from our final analysis.
This study has several limitations. First, it is a single-center study, which may introduce some bias into the results. Second, we did not evaluate the correlation with T stage or overall clinical staging; this will be the focus of future research. Third, the current first-line recommendations for GC TNM staging are endoscopic ultrasound and CT, while MRI is only a second-line recommendation (2). This suggests that the widespread adoption of our findings remains challenging. However, we note that MRI has gradually been recognized as a first-line recommended examination in expert consensus on TNM staging for other gastrointestinal tumors, such as esophageal and rectal cancer.
Conclusion
To sum up, both ADC values and rADC values based on primary tumors and the SLNs can be used to distinguish N stage of GC, and SLN-based ADC values exhibit superior diagnostic performance for predicting N0 vs. N1 + 2 + 3 stages, N0 + 1 vs. N2 + 3 stages, and N0 + 1 + 2 vs. N3 stages of GC.
Data availability statement
The raw data supporting the conclusions of this article will be made available by the authors, without undue reservation.
Ethics statement
The studies involving humans were approved by Affiliated Cancer Hospital of Zhengzhou University. The studies were conducted in accordance with the local legislation and institutional requirements. The participants provided their written informed consent to participate in this study.
Author contributions
L-LY: Writing – original draft, Methodology, Software, Visualization, Investigation, Writing – review & editing, Formal analysis, Project administration, Data curation, Validation, Funding acquisition, Conceptualization, Resources, Supervision. JL: Conceptualization, Methodology, Writing – review & editing. J-RQ: Writing – review & editing, Conceptualization. H-KZ: Data curation, Writing – review & editing. HZ: Formal Analysis, Writing – review & editing, Data curation. WY: Writing – review & editing, Supervision, Data curation, Software.
Funding
The author(s) declare financial support was received for the research and/or publication of this article. This study was supported by the National Natural Science Foundation of China (82202146), Henan Provincial Medical Science and Technology Project (SBGJ202402030), Science and Technology Development Foundation of Henan Province (242102311173), Special Fund for Henan Health Science and Technology Innovation Talent Project (YXKC2021054), and Henan Province Medical Science and Technology Research Program Joint Project (LHGJ20230091).
Conflict of interest
The authors declare that the research was conducted in the absence of any commercial or financial relationships that could be construed as a potential conflict of interest.
Generative AI statement
The author(s) declare that no Generative AI was used in the creation of this manuscript.
Any alternative text (alt text) provided alongside figures in this article has been generated by Frontiers with the support of artificial intelligence and reasonable efforts have been made to ensure accuracy, including review by the authors wherever possible. If you identify any issues, please contact us.
Publisher’s note
All claims expressed in this article are solely those of the authors and do not necessarily represent those of their affiliated organizations, or those of the publisher, the editors and the reviewers. Any product that may be evaluated in this article, or claim that may be made by its manufacturer, is not guaranteed or endorsed by the publisher.
Supplementary material
The Supplementary Material for this article can be found online at: https://www.frontiersin.org/articles/10.3389/fonc.2025.1667430/full#supplementary-material
Supplementary Table 1 | Consistency analysis of different ADC values measured by two radiologists. The data was expressed as mean ± standard deviation; ICC, Intraclass correlation coefficient; CI, Confidence interval; ADC, Apparent diffusion coefficient.
References
1. Bray F, Laversanne M, Sung H, Ferlay J, Siegel RL, Soerjomataram I, et al. Global cancer statistics 2022: GLOBOCAN estimates of incidence and mortality worldwide for 36 cancers in 185 countries. CA Cancer J Clin. (2024) 74:229–63. doi: 10.3322/caac.21834
2. Wang FH, Zhang XT, Tang L, Wu Q, Cai MY, Li YF, et al. The Chinese Society of Clinical Oncology (CSCO): Clinical guidelines for the diagnosis and treatment of gastric cancer, 2023. Cancer Commun (Lond). (2024) 44:127–72. doi: 10.1002/cac2.12516
3. Hatta W, Gotoda T, Oyama T, Kawata N, Takahashi A, Yoshifuku Y, et al. A Scoring System to Stratify Curability after Endoscopic Submucosal Dissection for Early Gastric Cancer: “eCura system. Am J Gastroenterol. (2017) 112:874–81. doi: 10.1038/ajg.2017.95
4. Matsuda S, Irino T, Kawakubo H, Takeuchi H, and Kitagawa Y. Current status and challenges in sentinel node navigation surgery for early gastric cancer. Chin J Cancer Res. (2021) 33:150–8. doi: 10.21147/j.issn.1000-9604.2021.02.03
5. Kinami S, Saito H, and Takamura H. Significance of lymph node metastasis in the treatment of gastric cancer and current challenges in determining the extent of metastasis. Front Oncol. (2022) 11:806162. doi: 10.3389/fonc.2021.806162
6. Willard-Mack CL. Normal structure, function, and histology of lymph nodes. Toxicol Pathol. (2006) 34:409–24. doi: 10.1080/01926230600867727
8. Liu S, Zhang Y, Chen L, Guan W, Guan Y, Ge Y, et al. Whole-lesion apparent diffusion coefficient histogram analysis: significance in T and N staging of gastric cancers. BMC Cancer. (2017) 17:665. doi: 10.1186/s12885-017-3622-9
9. Liu S, Wang H, Guan W, Pan L, Zhou Z, Yu H, et al. Preoperative apparent diffusion coefficient value of gastric cancer by diffusion-weighted imaging: Correlations with postoperative TNM staging. J Magn Reson Imaging. (2015) 42:837–43. doi: 10.1002/jmri.24841
10. Soydan L, Demir AA, Torun M, and Cikrikcioglu MA. Use of diffusion-weighted magnetic resonance imaging and apparent diffusion coefficient in gastric cancer staging. Curr Med Imaging. (2020) 16:1278–89. doi: 10.2174/1573405616666200218124926
11. Liang J, Lv H, Liu Q, Li H, Wang J, and Cui E. Role of diffusion-weighted magnetic resonance imaging and apparent diffusion coefficient values in the detection of gastric carcinoma. Int J Clin Exp Med. (2015) 8:15639–47.
12. Li J, Zhang H, Bei T, Wang Y, Ma F, Wang S, et al. Advanced diffusion-weighted MRI models for preoperative prediction of lymph node metastasis in resecta ble gastric cancer. Abdom Radiol (NY). (2025) 50:1057–68. doi: 10.1007/s00261-024-04559-3
13. Zhong J, Zhao W, Ren F, Qi S, Wang X, Lv T, et al. Lymph node metastasis in patients with gastric cancer: a multi-modality, morphologic and functional imaging study. Am J Transl Res. (2016) 8:5601–9.
14. Giganti F, Ambrosi A, Chiari D, Orsenigo E, Esposito A, Mazza E, et al. Apparent diffusion coefficient by diffusion-weighted magnetic resonance imaging as a sole biomarker for staging and prognosis of gastric cancer. Chin J Cancer Res. (2017) 29:118–26. doi: 10.21147/j.issn.1000-9604
15. Usuda K, Iwai S, Yamagata A, Sekimura A, Motono N, Matoba M, et al. Relationships and qualitative evaluation between diffusion-weighted imaging and pathologic findings of resected lung cancers. Cancers (Basel). (2020) 12:1194. doi: 10.3390/cancers12051194
16. Kamali A, Gandhi A, Nunez LC, Lugo AE, Arevalo-Espejo O, Zhu J, et al. The role of apparent diffusion coefficient values in glioblastoma: differentiating tumor progression versus treatment-related changes. J Comput Assist Tomogr. (2022) 46:923–92. doi: 10.1097/RCT.0000000000001373
17. Mao Y, Hedgire SS, Liao G, Lv F, Li Y, Li Q, et al. Topographic distribution and characteristics of normal gastric regional lymph nodes on diffusion-weighted magnetic resonance imaging. Acta Radiol. (2016) 57:152–61. doi: 10.1177/0284185115574736
18. Hasbahceci M, Akcakaya A, Memmi N, Turkmen I, Cipe G, Yildiz P, et al. Diffusion MRI on lymph node staging of gastric adenocarcinoma. Quant Imaging Med Surg. (2015) 5:392–400. doi: 10.3978/j.issn.2223-4292.2015.03.06
19. Cheng J, Wang Y, Deng J, McCarthy RJ, Wang G, Wang H, et al. Discrimination of metastatic lymph nodes in patients with gastric carcinoma using diffusion-weighted imaging. J Magn Reson Imaging. (2013) 37:1436–44. doi: 10.1002/jmri.23925
20. Joo I, Lee JM, Kim JH, Shin CI, Han JK, and Choi BI. Prospective comparison of 3T MRI with diffusion-weighted imaging and MDCT for the preoperative TNM staging of gastric cancer. J Magn Reson Imaging. (2015) 41:814–21. doi: 10.1002/jmri.24586
21. Kawata N, Kakushima N, Takizawa K, Tanaka M, Makuuchi R, Tokunaga M, et al. Risk factors for lymph node metastasis and long-term outcomes of patients with early gastric cancer after non-curative endoscopic submucosal dissection. Surg Endosc. (2017) 31:1607–16. doi: 10.1007/s00464-016-5148-7
22. Jeong O, Jung MR, and Kang JH. Prognostic value of the anatomic region of metastatic lymph nodes in the current TNM staging of gastric cancer. J Gastric Cancer. (2021) 21:236–45. doi: 10.5230/jgc.2021.21.e22
23. Loch FN, Beyer K, Kreis ME, Kamphues C, Rayya W, Schineis C, et al. Diagnostic performance of Node Reporting and Data System (Node-RADS) for regional lymph node staging of gastric cancer by CT. Eur Radiol. (2024) 34:3183–93. doi: 10.1007/s00330-023-10352-5
24. Zhao B, Mei D, Zhang J, Luo R, Lu H, Xu H, et al. Impact of skip lymph node metastasis on the prognosis of gastric cancer patients who underwent curative gastrectomy. J BUON. (2019) 24:693–700.
25. Park SS, Ryu JS, Min BW, Kim WB, Kim SJ, Kim CS, et al. Impact of skip metastasis in gastric cancer. ANZ J Surg. (2005) 75:645–9. doi: 10.1111/j.1445-2197.2005.03485.x
26. Liu JY, Deng JY, Zhang NN, Liu HF, Sun WL, He WT, et al. Clinical significance of skip lymph-node metastasis in pN1 gastric-cancer patients after curative surgery. Gastroenterol Rep (Oxf). (2019) 7:193–8. doi: 10.1093/gastro/goz008
27. Washington MK, Goldberg RM, Chang GJ, Limburg P, Lam AK, Salto-Tellez M, et al. Diagnosis of digestive system tumours. Int J Cancer. (2021) 148:1040–50. doi: 10.1002/ijc.33210
Keywords: apparent diffusion coefficient, magnetic resonance imaging, sentinel lymph node, primary tumor, stomach neoplasms
Citation: Yan L-l, Li J, Qu J-r, Zhang H-k, Zhang H and Yu W-h (2025) Comparison of apparent diffusion coefficient values in sentinel lymph nodes versus primary tumors for gastric cancer N staging. Front. Oncol. 15:1667430. doi: 10.3389/fonc.2025.1667430
Received: 16 July 2025; Accepted: 07 November 2025; Revised: 27 October 2025;
Published: 28 November 2025.
Edited by:
Xiaojun Liu, Lanzhou University Third Hospital, ChinaReviewed by:
Vahur Valvere, North Estonia Medical Centre, EstoniaYongjian Zhu, Chinese Academy of Medical Sciences and Peking Union Medical College, China
Copyright © 2025 Yan, Li, Qu, Zhang, Zhang and Yu. This is an open-access article distributed under the terms of the Creative Commons Attribution License (CC BY). The use, distribution or reproduction in other forums is permitted, provided the original author(s) and the copyright owner(s) are credited and that the original publication in this journal is cited, in accordance with accepted academic practice. No use, distribution or reproduction is permitted which does not comply with these terms.
*Correspondence: Liang-liang Yan, eWFubGlhbmdsaWFuZzIwMDhAMTI2LmNvbQ==