 Youjia Li
 Liyang Su
- Department of Ultrasound, Quanzhou First Hospital, Quanzhou, China
Background: Granulomatous lobular mastitis (GLM) frequently mimics ductal carcinoma in situ (DCIS) in clinical presentation and imaging characteristics, leading to misdiagnosis and unnecessary aggressive interventions. This study aimed to develop and validate a practical nomogram for differentiating GLM from DCIS.
Methods: We conducted a retrospective study at Quanzhou First Hospital from January 2020 to April 2025, including 290 patients with histopathologically confirmed GLM (n=128) or DCIS (n=162). Patients were randomly divided into training (n=203) and validation (n=87) sets. Clinical, laboratory, and ultrasound features were analyzed using univariate and multivariate logistic regression to identify independent predictors. A nomogram was constructed and evaluated using receiver operating characteristic (ROC) curves, calibration plots, and decision curve analysis.
Results: Six independent predictors were incorporated into the final nomogram: age, lesion size, margin characteristics, microcalcifications, posterior acoustic enhancement, and peri-lesional flow. The nomogram demonstrated excellent discriminative performance with areas under the ROC curve of 0.95 (95% CI: 0.92-0.98) in the training set and 0.93 (95% CI: 0.88-0.98) in the validation set. At optimal thresholds, the model achieved sensitivity of 92% and specificity of 89% in the training set, and 89% and 79% respectively in the validation set. Calibration plots confirmed high predictive accuracy, and decision curve analysis demonstrated substantial clinical benefit across clinically relevant threshold probabilities.
Conclusions: This novel nomogram represents a diagnostic tool specifically designed for GLM versus DCIS differentiation. Its reliance on widely available clinical and ultrasound parameters makes it particularly valuable for resource-limited settings, potentially reducing unnecessary biopsies and associated patient morbidity.
Introduction
Granulomatous lobular mastitis (GLM) is a rare, chronic inflammatory breast condition primarily affecting women of reproductive age, with a global prevalence of approximately 2.4 per 100,000 women (1, 2). Characterized by non-caseous granulomatous inflammation of the breast lobules, GLM often mimics breast malignancy, presenting with palpable masses, skin changes, and imaging abnormalities (3, 4). This mimicry leads to frequent misdiagnosis as ductal carcinoma in situ (DCIS) or invasive breast cancer, resulting in unnecessary mastectomies, chemotherapy, or radiation therapy, which cause significant patient morbidity and healthcare costs (5). Accurate differentiation of GLM from DCIS, which accounts for 25% of breast cancer diagnoses (over 56,000 annual cases in the United States) (6), is critical yet challenging due to overlapping clinical and imaging features, including irregular masses and architectural distortion (7).
Current diagnostic approaches, including the Breast Imaging-Reporting and Data System (BI-RADS) ultrasound classification, mammography, and MRI, rely on histopathological confirmation via core needle biopsy, as imaging alone lacks specificity for GLM (4). BI-RADS often misclassifies GLM as category 4 or 5 lesions, triggering invasive procedures. Recent studies have developed MRI-based radiomics models for differentiating granulomatous mastitis from breast malignancies, utilizing texture analysis and machine learning algorithms with promising results (8). However, these radiomics approaches, along with other MRI and deep learning-based radiomics models, though promising, are costly and inaccessible in resource-limited settings (9, 10). Existing nomograms focus on malignancy detection or differentiation between invasive and non-invasive cancers, neglecting GLM’s unique inflammatory characteristics (11). This diagnostic gap underscores the need for a tailored, accessible tool to improve GLM identification and reduce misdiagnosis.
Nomograms, as predictive models integrating multiple clinical parameters, offer a practical solution for complex differential diagnoses (12). This study addresses the diagnostic challenge by developing and validating a practical nomogram specifically designed to differentiate GLM from DCIS using readily available clinical and ultrasound parameters. By integrating clinical, ultrasound, and laboratory parameters, our model aims to enhance diagnostic accuracy, reduce unnecessary invasive procedures, and support conservative management in resource-constrained settings, ultimately improving patient outcomes.
Materials and methods
Study design and ethical considerations
This retrospective cohort study was conducted at Quanzhou First Hospital Affiliated to Fujian Medical University from January 2020 to April 2025. The study protocol was approved by the Institutional Review Board of Quanzhou First Hospital (Ethics Approval No: Quanyi Lun [2025]K152), and informed consent was waived due to the retrospective design, in accordance with the Declaration of Helsinki.
Patient selection
Patients with pathologically confirmed granulomatous lobular mastitis (GLM) or ductal carcinoma in situ (DCIS) were identified via the hospital’s electronic medical record system (EMRS). GLM was diagnosed based on World Health Organization (WHO) criteria, requiring non-caseous granulomatous inflammation of breast lobules (13). DCIS was confirmed per WHO breast tumor classification, characterized by absence of stromal invasion (14). Inclusion criteria were: (1) histopathologically confirmed GLM or DCIS via core needle biopsy or surgical specimen; (2) complete clinical, laboratory, and ultrasound data; (3) high-quality breast ultrasound images; (4) age ≥18 years; (5) complete follow-up data. Exclusion criteria included: (1) missing or inadequate ultrasound images (n=32); (2) missing blood sample data (n=126); (3) presence of mixed invasive and in situ carcinoma (n=195). Of 643 initial patients, 290 were included (162 DCIS, 128 GLM) and randomly allocated to training (n=203; 118 DCIS, 85 GLM) and validation (n=87; 44 DCIS, 43 GLM) sets using R software (version 4.3.0, sample function) with a random seed of 1256 to minimize selection bias (Figure 1).
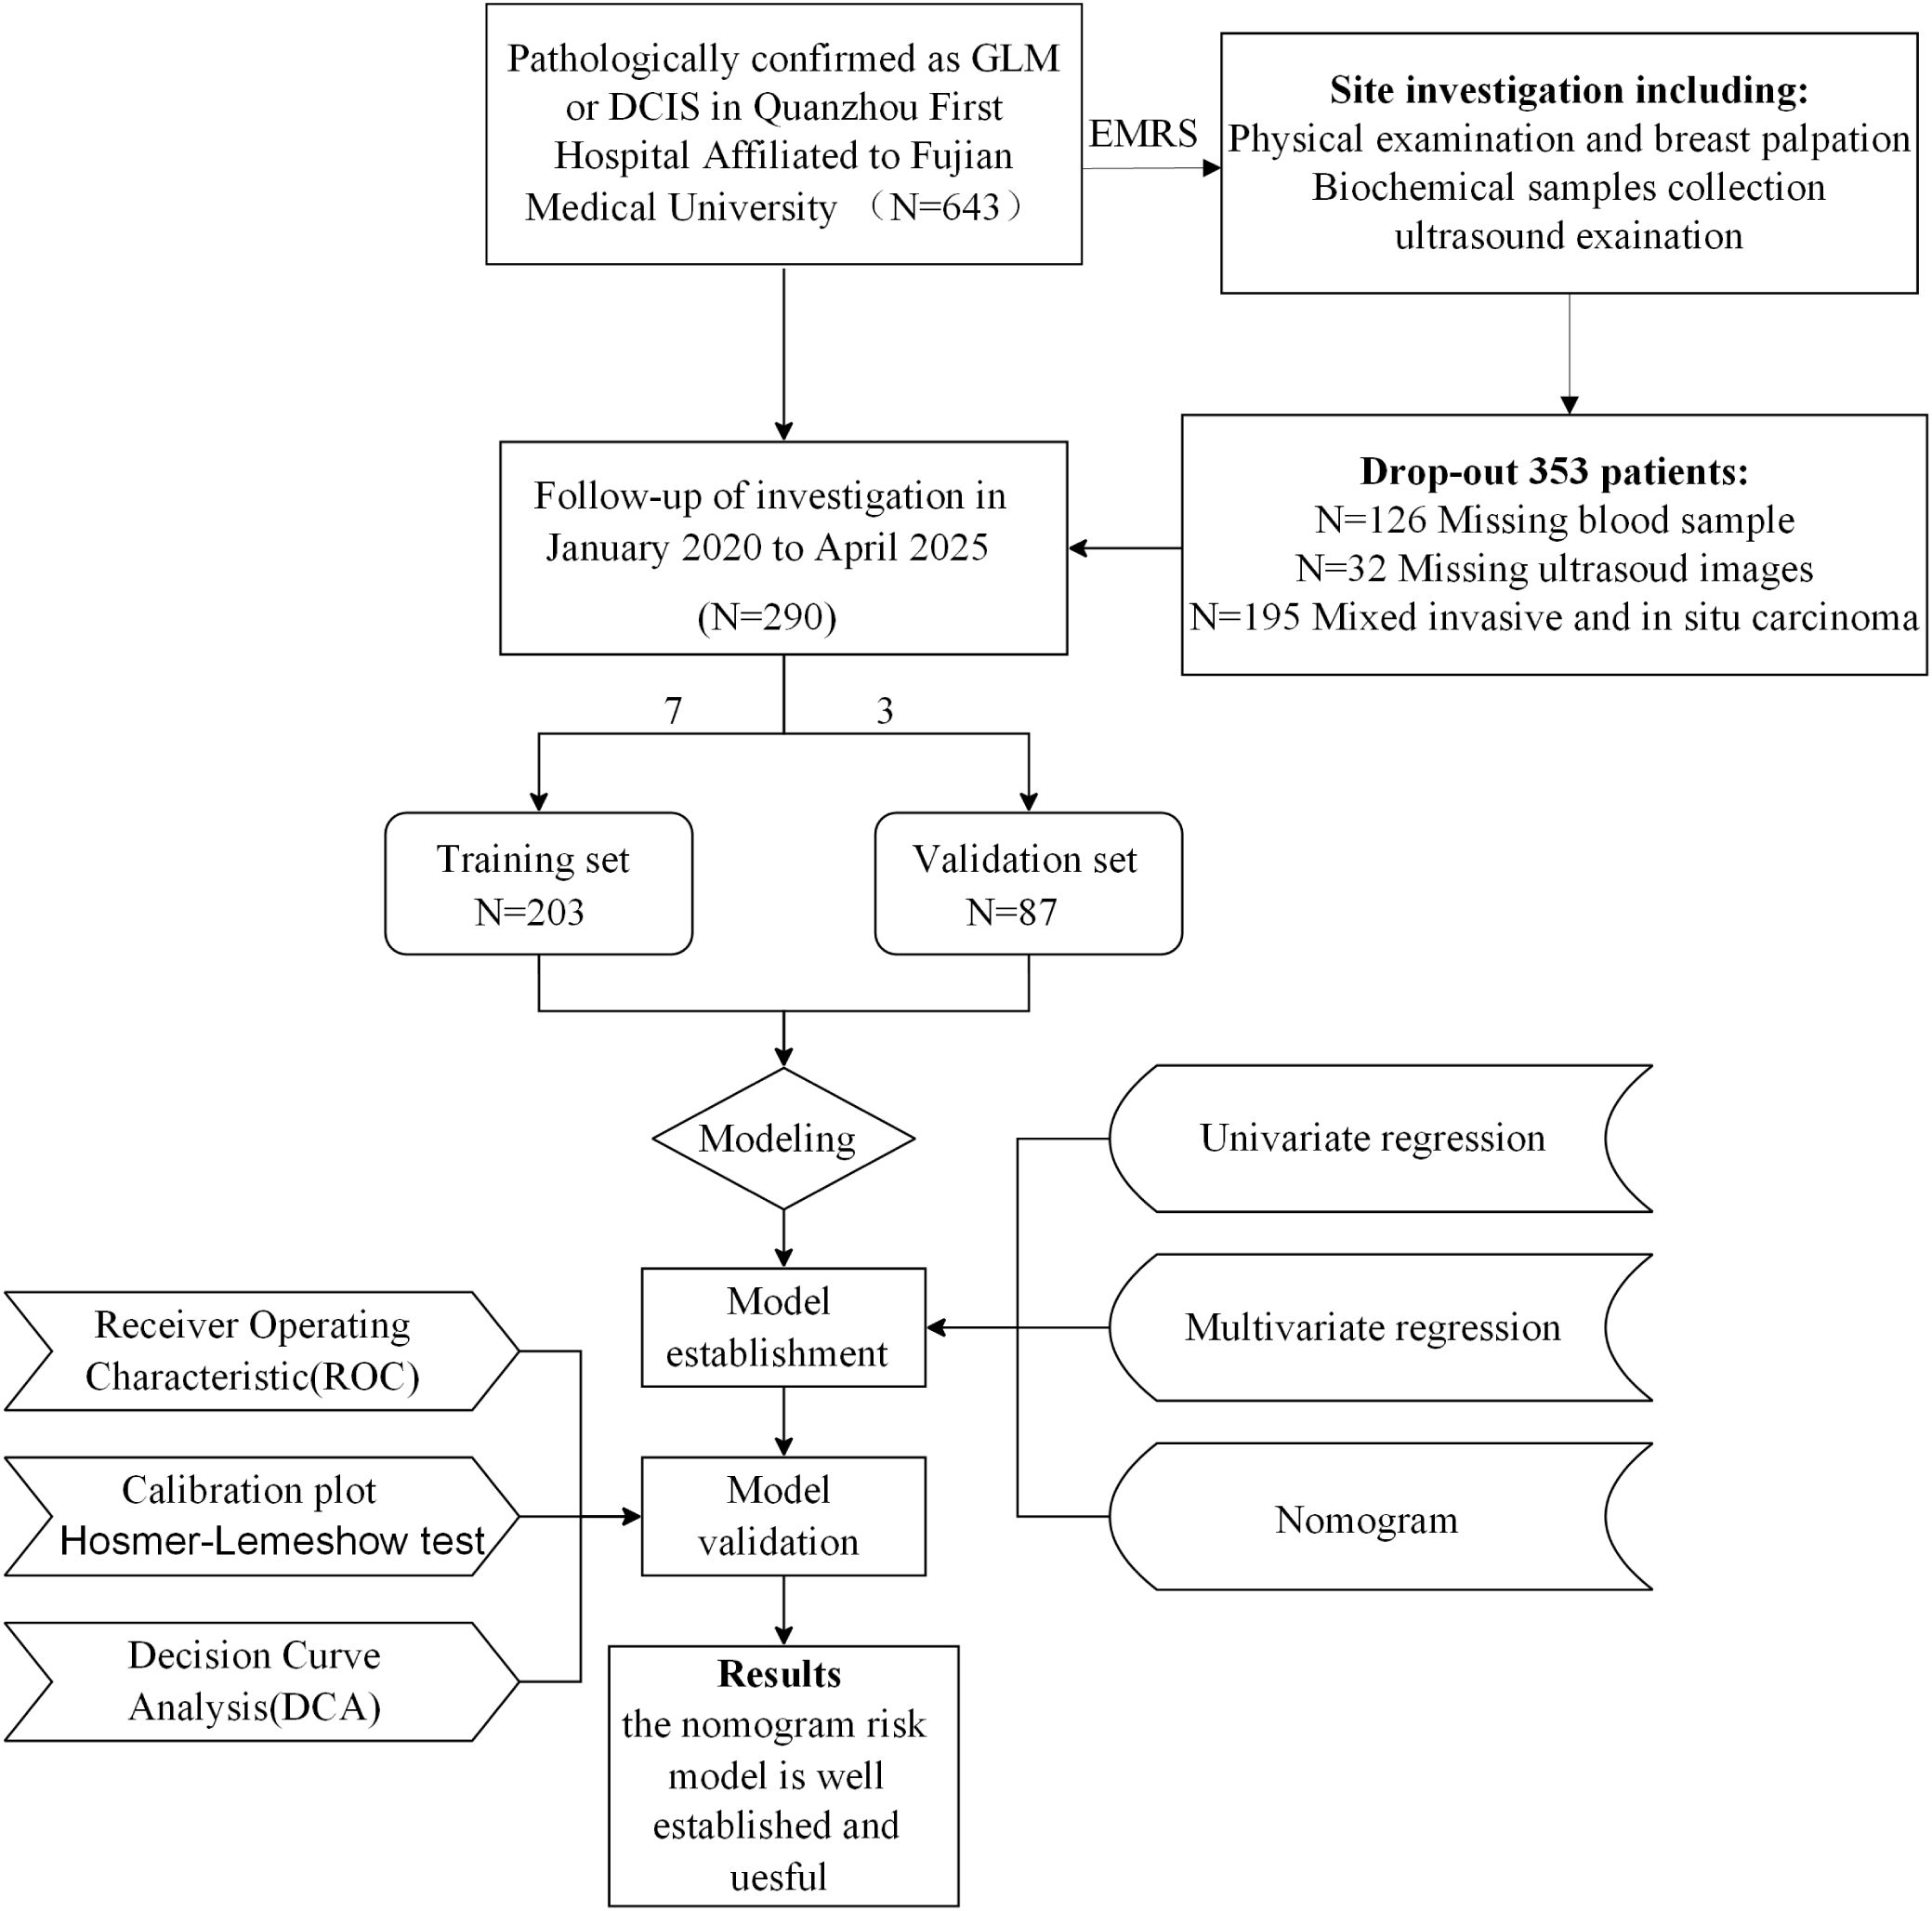
Figure 1. Patient selection flowchart and study design. A total of 643 patients with pathologically confirmed GLM or DCIS were initially enrolled from Quanzhou First Hospital Affiliated to Fujian Medical University. After excluding 353 patients due to various criteria (missing or inadequate ultrasound images, missing samples, and presence of mixed invasive and in situ carcinoma), 290 patients were included in the final analysis and randomly divided into training (n=203) and validation (n=87) sets. The study workflow included data collection, model establishment using univariate and multivariate regression analysis, and model validation through ROC analysis, calibration plots, Hosmer-Lemeshow test, and decision curve analysis.
Data collection
Clinical data, including age, height, weight, white blood cell count (WBC), carcinoembryonic antigen (CEA), CA125, CA153, and palpation findings, were extracted from EMRS by two trained researchers, with double-entry verification to ensure accuracy. These tumor markers were included based on their potential relevance in differentiating inflammatory from neoplastic breast conditions: CEA as a broad-spectrum tumor marker potentially elevated in malignant conditions, CA125 which may be elevated in inflammatory conditions like GLM due to inflammatory response, and CA153 as a breast-specific tumor marker theoretically more relevant to DCIS. Laboratory parameters were collected within 48 hours of ultrasound examination. Breast ultrasound was performed using Philips EPIQ Q5/Q7 or Siemens ACUSON Sequoia systems with 5–12 MHz linear transducers, calibrated per manufacturer guidelines. Patients were positioned supine with arms elevated, and both breasts were scanned in sagittal and transverse planes. Images were stored in DICOM format and reviewed by a senior radiologist to confirm adequate visualization of lesion characteristics.
Ultrasound evaluation
Ultrasound images were independently assessed by two breast radiologists (8 and 12 years of experience) blinded to clinical and histopathological data, with discrepancies resolved by consensus or a third senior radiologist. Lesion characteristics were evaluated per the BI-RADS ultrasound lexicon, including shape, aspect ratio, margins (distinct vs. indistinct), architectural distortion, microcalcifications, posterior acoustic features (enhancement vs. other), internal and peri-lesional flow, lymph node status, and focus number (single vs. multiple), as detailed in Table 1.
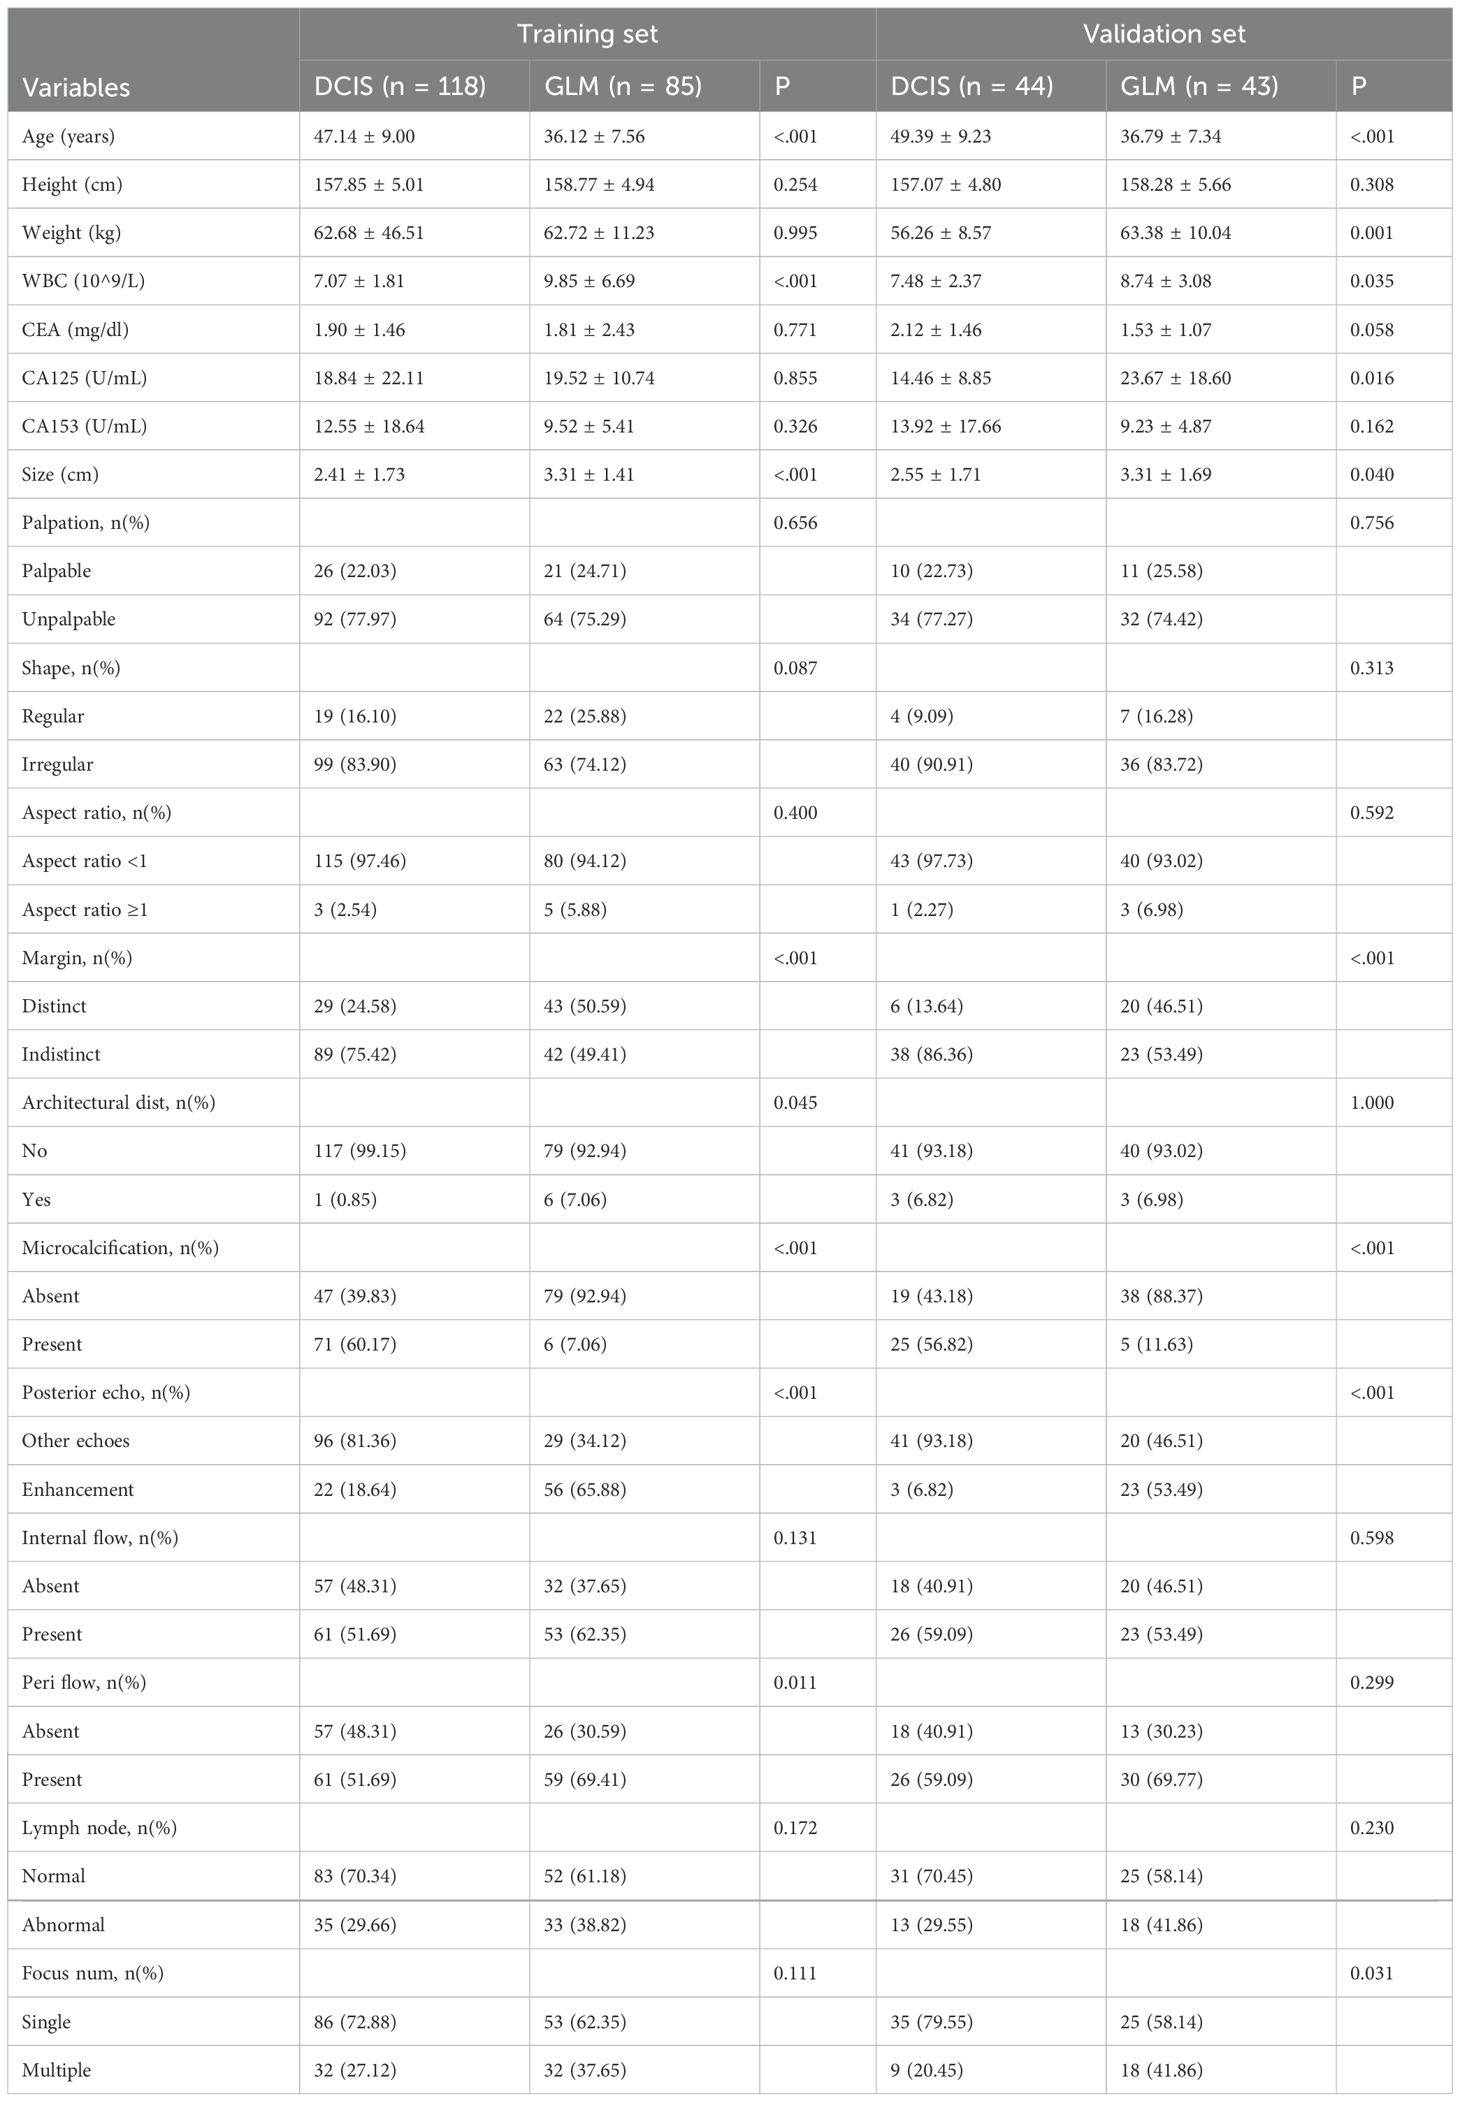
Table 1. Baseline characteristics in the training and validation sets.
Statistical analysis
Continuous variables (e.g., age, WBC, lesion size) were reported as mean ± standard deviation, and categorical variables (e.g., margins, microcalcifications) as frequencies (percentages). Receiver operating characteristic (ROC) curve analysis was performed to determine the optimal cut-off value for WBC in differentiating GLM from DCIS, with the Youden index used to identify the optimal threshold. Baseline characteristics were compared using t-tests or Mann-Whitney U tests for continuous variables and chi-square tests for categorical variables (Table 1). Missing blood sample data (n=126) were excluded after sensitivity analysis confirmed no significant bias. Univariate logistic regression identified eight significant predictors (p<0.05): age, white blood cell count (WBC), lesion size, margin characteristics, architectural distortion, microcalcifications, posterior acoustic enhancement, and peri-lesional flow. ROC curve analysis for WBC revealed an optimal cut-off value of 7.735 × 10⁹/L with sensitivity of 68% (95% CI: 61%-76%), specificity of 65% (95% CI: 57%-74%), and AUC of 0.69 (95% CI: 0.63-0.75) for differentiating GLM from DCIS. Multivariate logistic regression with backward stepwise selection (entry p<0.05, removal p>0.10) was performed to construct the nomogram, starting with an AIC of 127.74 and reducing to 127.29 after excluding WBC and architectural distortion. Although WBC showed moderate discriminatory ability (AUC = 0.69) with statistical significance in univariate analysis, it was excluded from the final multivariable model due to its relatively weaker predictive contribution compared to imaging features, and to maintain model parsimony while optimizing overall performance (VIF: WBC 1.183, architectural distortion 1.066). The final model incorporated six independent predictors: age, lesion size, margins, microcalcifications, posterior acoustic enhancement, and peri-lesional flow (Figure 2). Multicollinearity was assessed using variance inflation factors (VIF), with values for the final model ranging from 1.176 to 1.399, indicating no significant collinearity. Model performance was evaluated using receiver operating characteristic (ROC) curves (area under the curve [AUC] 0.95 [95% CI: 0.92–0.98] for training, 0.93 [95% CI: 0.88–0.98] for validation; Figure 3), calibration plots with the Hosmer-Lemeshow test (Figure 4), and decision curve analysis (DCA) across threshold probabilities of 0.1–0.9 (Figure 5). Internal validation was conducted using 1000 bootstrap resamples to assess overfitting. All analyses were performed in R (version 4.3.0) using packages rms, pROC, and dca. Statistical significance was set at p<0.05.
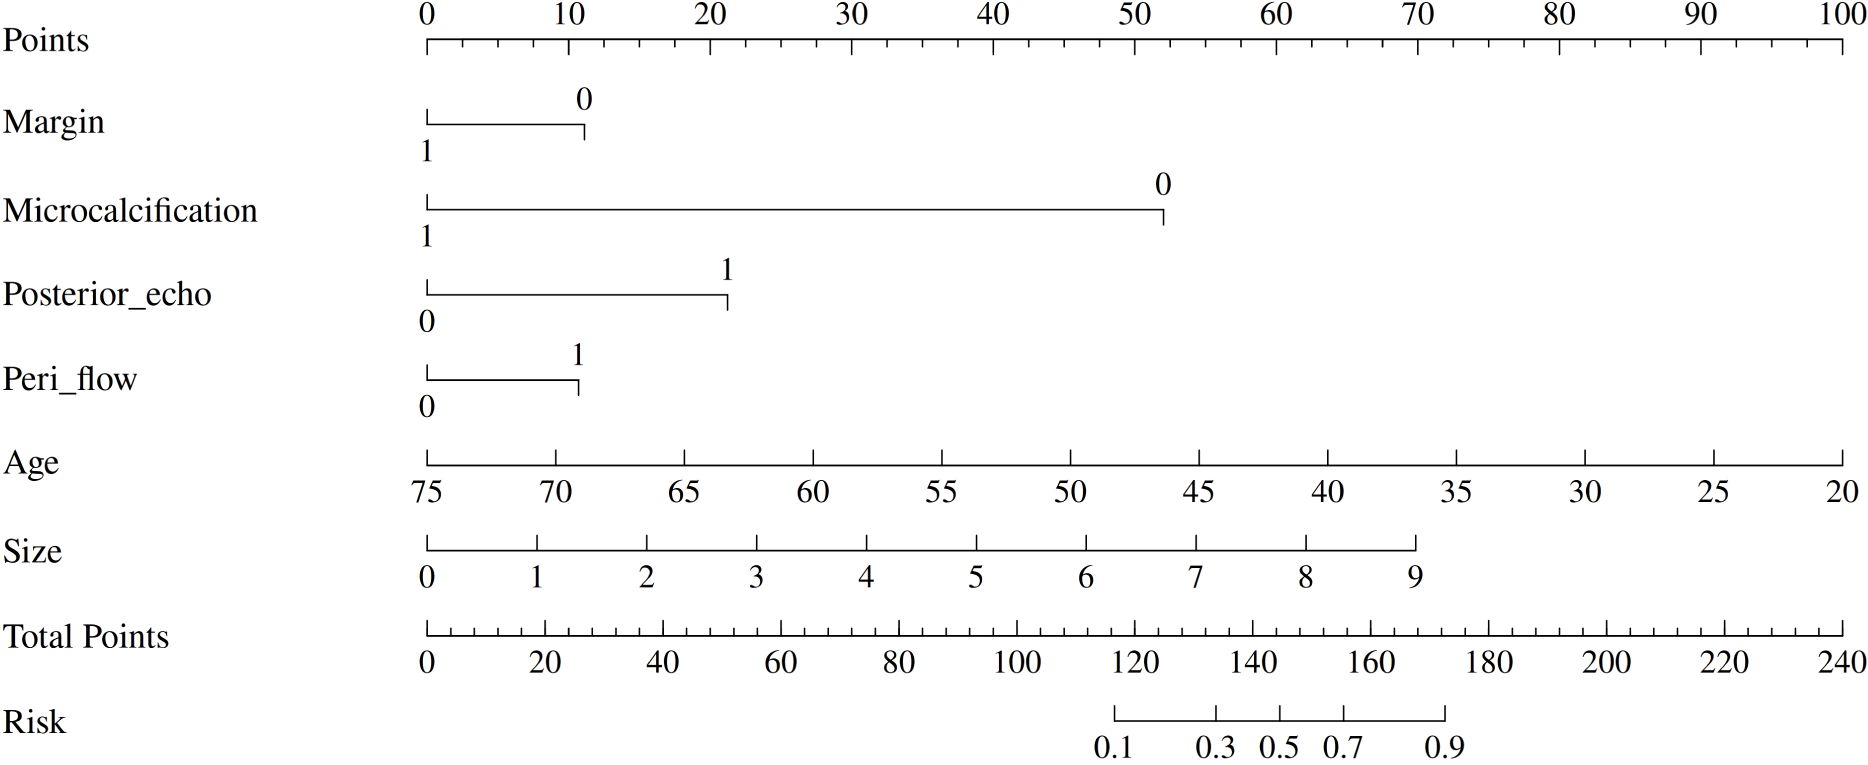
Figure 2. Nomogram for differentiating GLM from DCIS. The nomogram incorporates six clinical and imaging variables: margin characteristics, microcalcification presence, posterior acoustic enhancement, peri-lesional flow, patient age, and lesion size. Each variable contributes points based on its value, with the total points corresponding to the predicted risk of DCIS. The nomogram provides a practical tool for clinical decision-making in differential diagnosis.
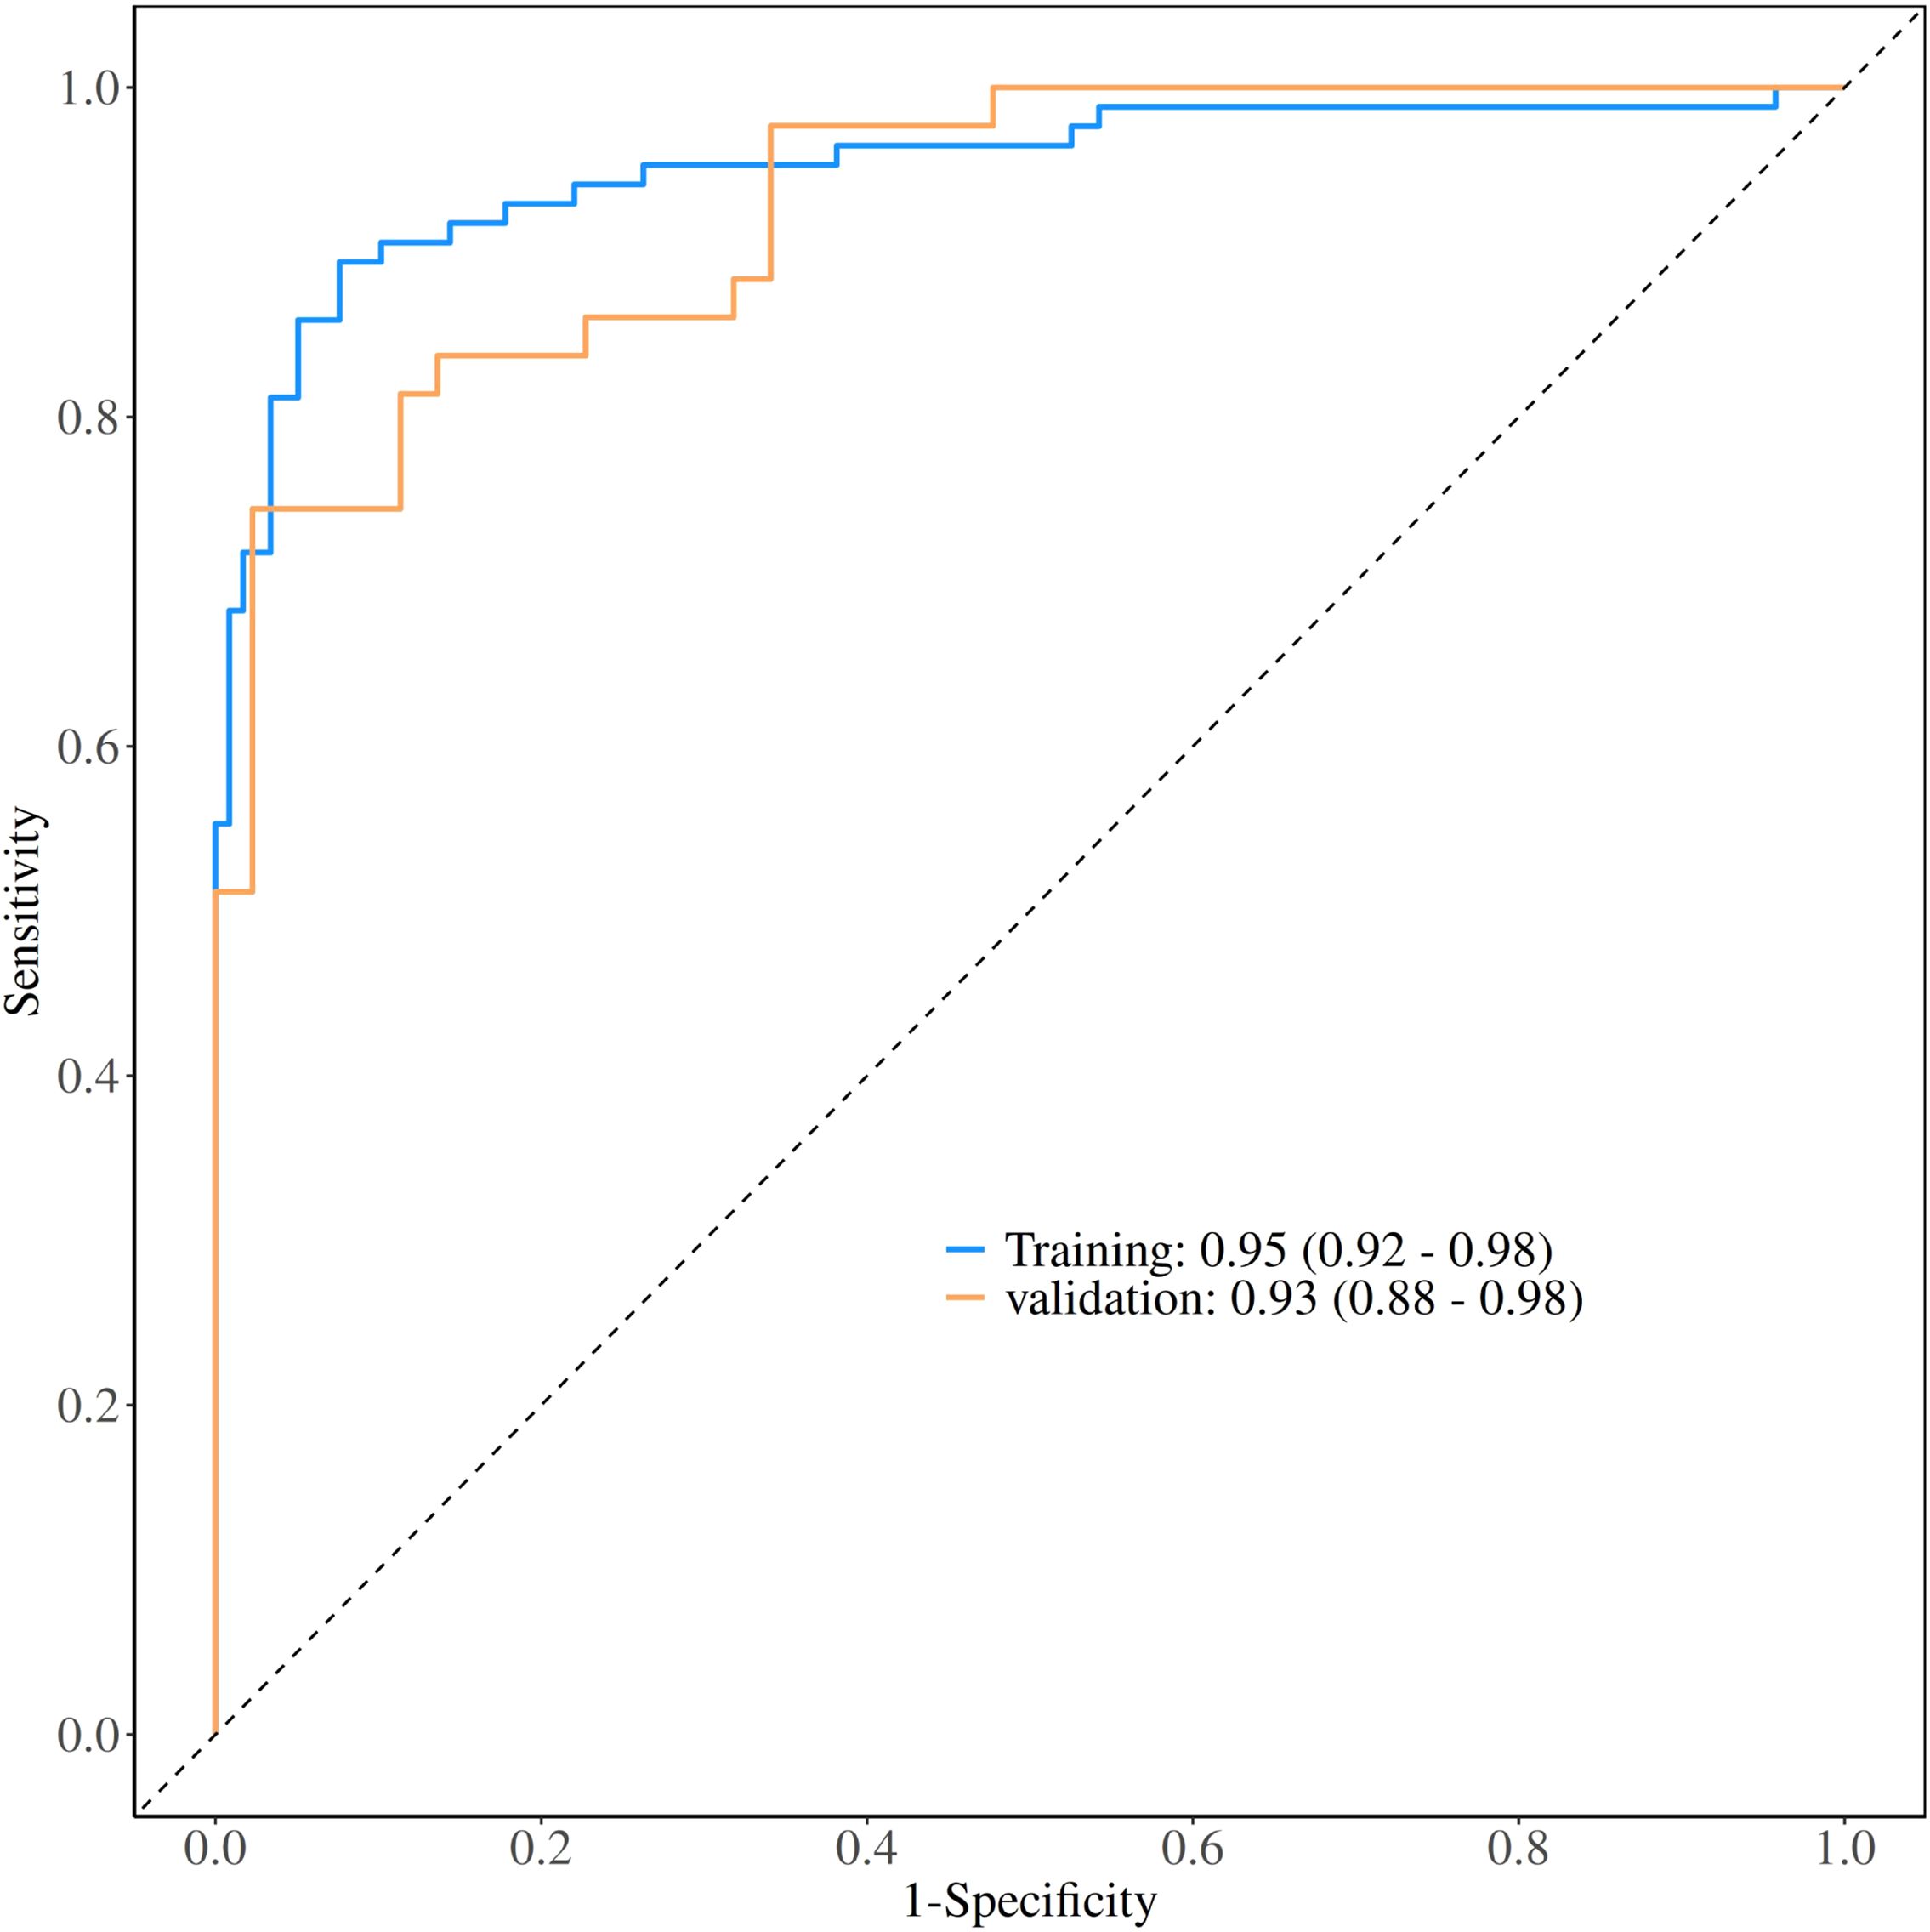
Figure 3. Receiver operating characteristic (ROC) curves for model performance evaluation. The ROC curves demonstrate the diagnostic performance of the nomogram model in both training and validation datasets. The area under the curve (AUC) values were 0.95 (95% CI: 0.92-0.98) for the training set and 0.93 (95% CI: 0.88-0.98) for the validation set, indicating excellent discriminative ability.
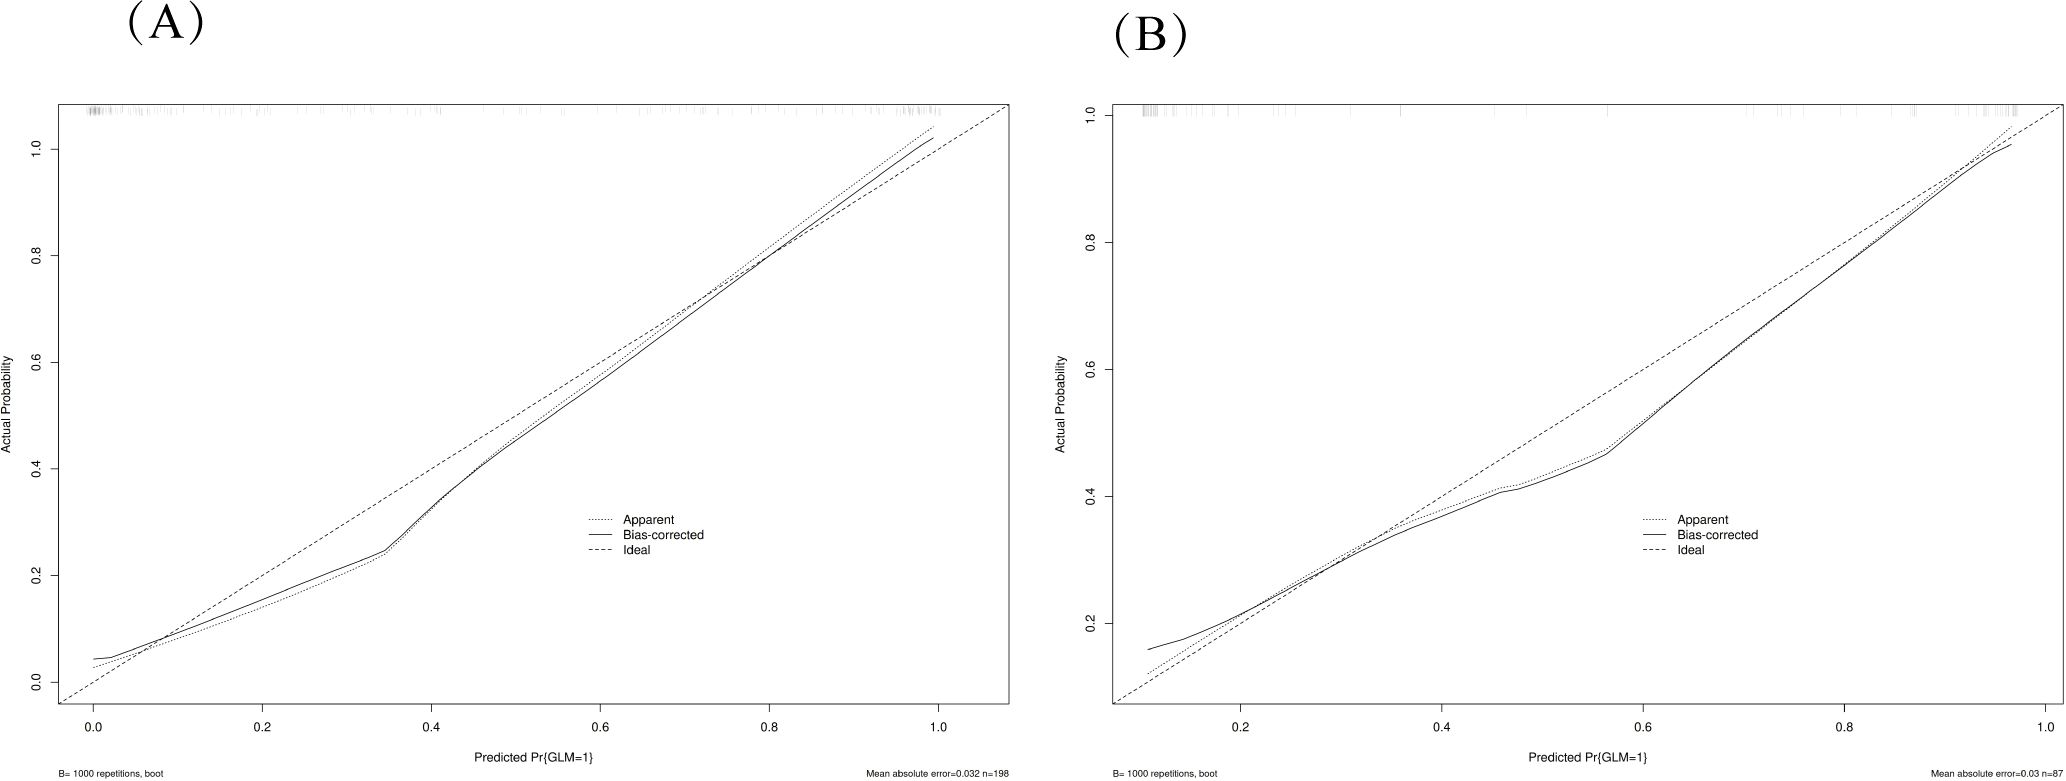
Figure 4. Calibration plots for model validation. The calibration plots show the agreement between predicted probabilities and observed outcomes in both training (A) and validation (B) datasets. The diagonal line represents perfect calibration, while the plotted line shows the model’s actual performance. The close alignment indicates good calibration of the nomogram model.
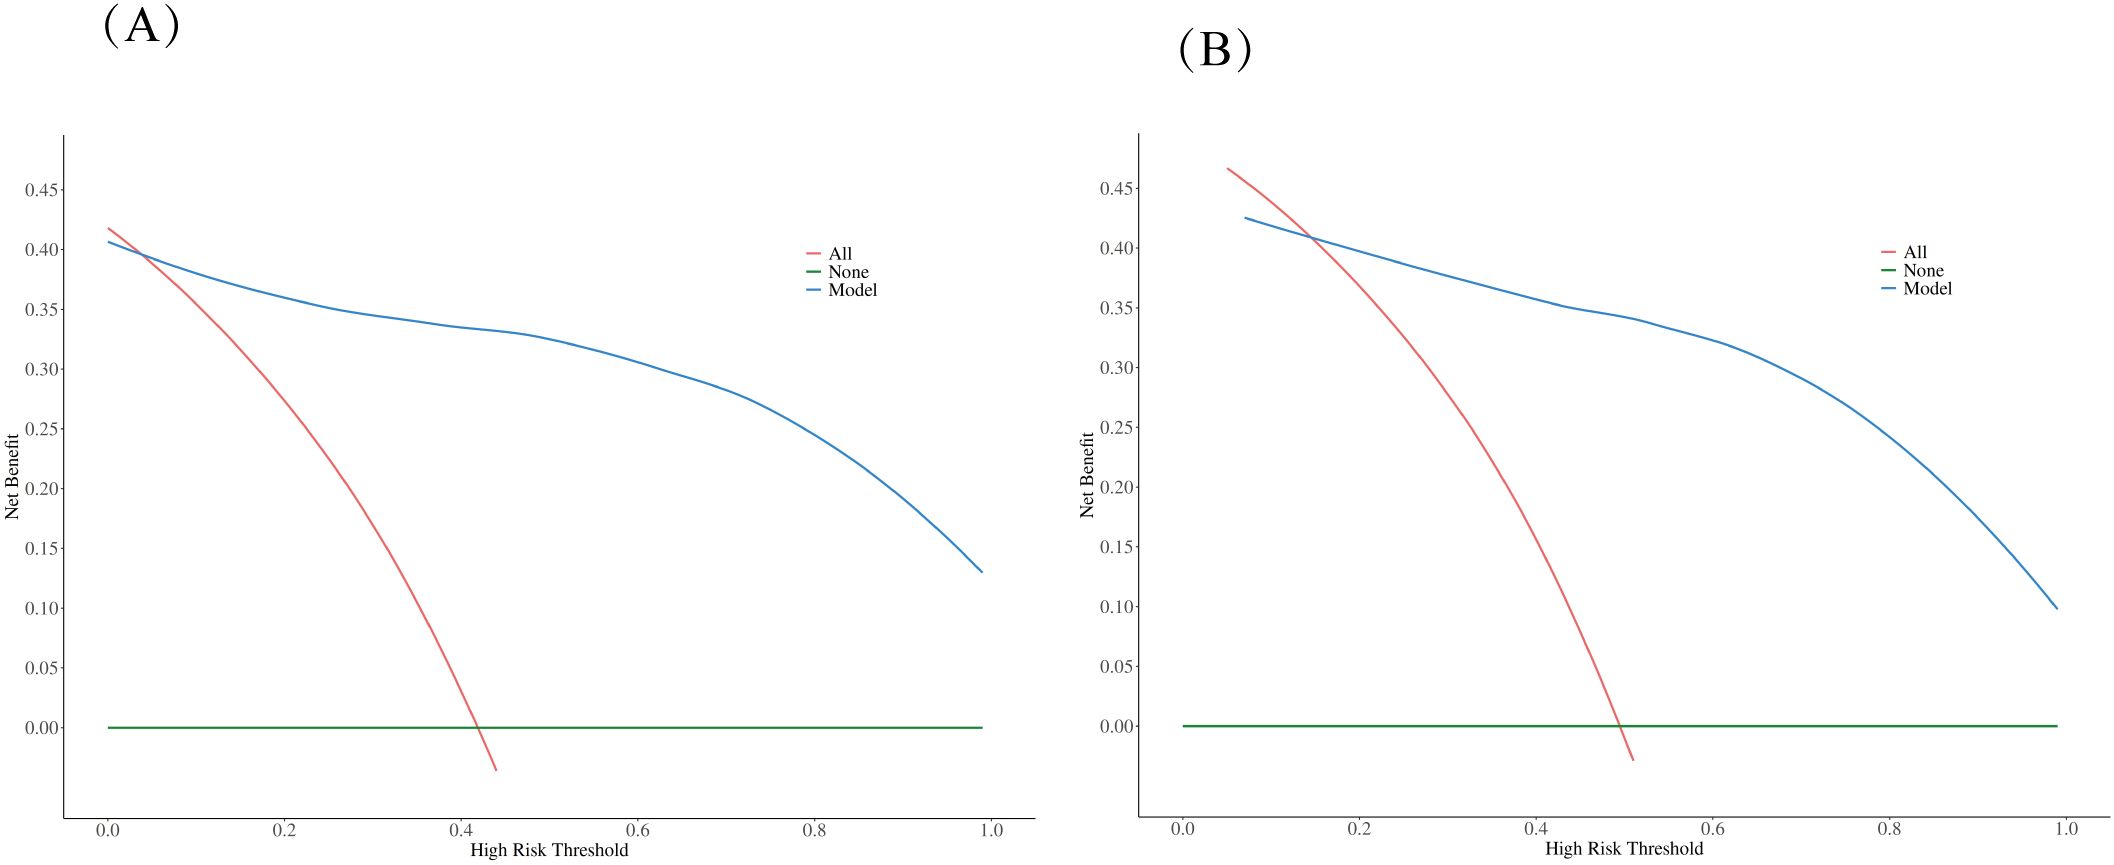
Figure 5. Decision curve analysis (DCA) comparing clinical utility. The DCA evaluates the clinical usefulness of the nomogram model compared to treating all patients or no patients across different risk thresholds in both training (A) and validation (B) datasets. The analysis demonstrates that the nomogram model provides superior net benefit over the “treat all” or “treat none” strategies across a wide range of threshold probabilities, supporting its clinical utility in decision-making.
Results
Patient characteristics
A total of 290 patients were included in this retrospective cohort study, comprising 203 patients in the training set and 87 patients in the validation set. Patients with DCIS were significantly older than those with GLM in both training and validation sets (P < 0.001), while height showed no significant differences between groups. White blood cell counts were significantly elevated in GLM patients compared to DCIS patients in both cohorts (P < 0.05). ROC curve analysis for WBC demonstrated an area under the curve (AUC) of 0.69 (95% CI: 0.63-0.75, P<0.001). The optimal cut-off value was determined to be 7.735 × 10⁹/L, yielding a sensitivity of 68% (95% CI: 61%-76%), specificity of 65% (95% CI: 57%-74%), accuracy of 67% (95% CI: 61%-72%), positive predictive value of 72% (95% CI: 65%-79%), and negative predictive value of 61% (95% CI: 53%-70%) for GLM diagnosis. Lesion size was significantly larger in GLM patients in both training and validation sets (P < 0.05). Several ultrasound characteristics showed significant inter-group differences: GLM lesions more frequently exhibited distinct margins compared to DCIS lesions (P<0.001), while microcalcifications were markedly more frequent in DCIS patients (P < 0.001). Posterior acoustic enhancement was significantly more common in GLM lesions (P < 0.001), and peripheral flow was more frequent in GLM patients in the training set P < 0.05). These baseline characteristics demonstrate distinct clinical and ultrasound profiles between DCIS and GLM, providing the foundation for the development of predictive models in this study. Baseline characteristics were well-balanced between training and validation sets, confirming study reliability, with detailed patient characteristics presented in Table 1.
Logistic regression analysis in the training set and construction of nomogram
To identify independent predictors for differentiating DCIS from GLM, univariate and multivariate logistic regression analyses were performed using the training set data. The detailed results of univariate and multivariate analyses are presented in Table 2. In the univariate analysis, several variables demonstrated significant associations with the diagnosis: margin characteristics (P < 0.001), architectural distortion (P = 0.045), microcalcification (P < 0.001), posterior echo enhancement (P < 0.001), peripheral flow (P = 0.012), age (P < 0.001), white blood cell count (P < 0.001), and lesion size (P < 0.001).
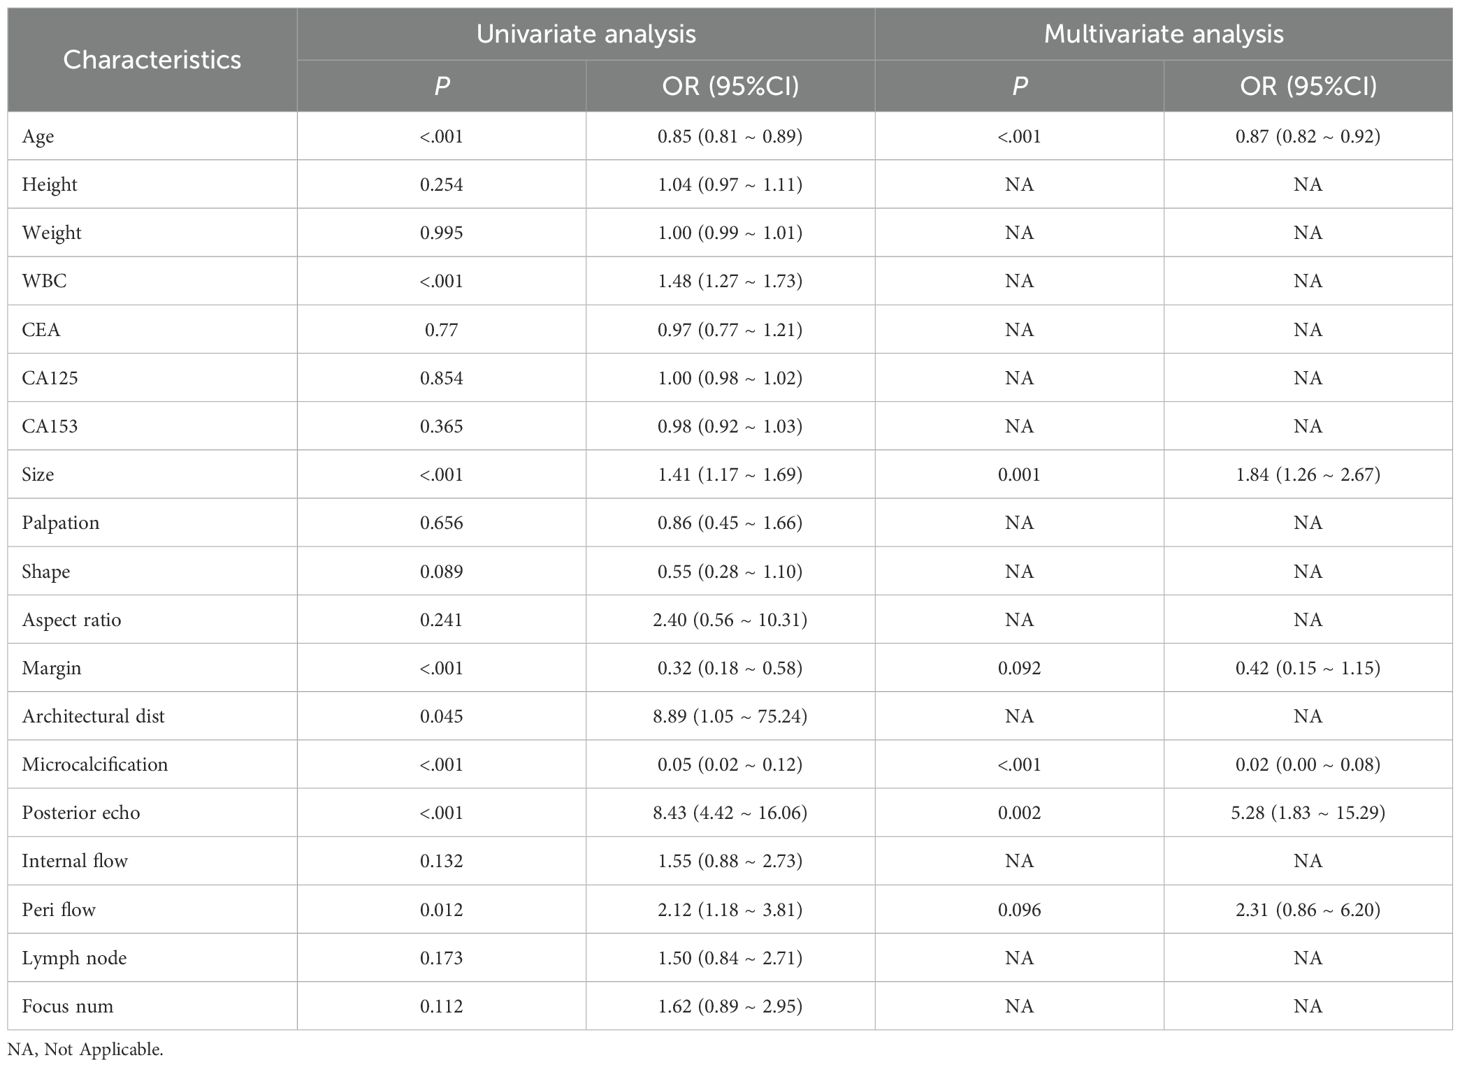
Table 2. Univariate and multivariate logistic regression analysis in the training set.
Subsequently, multivariate logistic regression analysis was performed using backward stepwise selection to identify independent predictors. All eight variables that demonstrated statistical significance in univariate analysis (p < 0.05) were initially included in the full multivariable logistic regression model. Using a removal criterion of p > 0.10, non-significant variables were sequentially eliminated: architectural distortion was first removed (p = 0.382), followed by white blood cell count (p = 0.199). Multicollinearity was assessed using variance inflation factors (VIF), confirming no multicollinearity issues (all VIF < 1.4). The final model achieved an AIC value of 127.29, representing an improvement over the full model (AIC = 127.74), indicating good model fit and clinical utility.
The final multivariate model identified six independent predictors that were retained in the nomogram: margin characteristics, microcalcification, posterior echo enhancement, peripheral flow, age, and lesion size. Based on these independent predictors, a predictive nomogram was constructed (Figure 2) to provide a visual and practical tool for clinical decision-making. The nomogram incorporates a point-based scoring system where each variable contributes specific points based on its value. The total points range from 0 to 240, corresponding to GLM risk probabilities from 0.1 to 0.9. To use the nomogram, clinicians locate each variable’s value on its respective axis, draw a vertical line to the points axis to determine the corresponding points, sum all points to obtain the total score, and finally project this total score onto the risk axis to estimate the probability of GLM diagnosis. This user-friendly tool enables individualized risk assessment and facilitates clinical decision-making in distinguishing between DCIS and GLM based on readily available clinical and ultrasound parameters.
Evaluation of nomogram
The performance of the constructed nomogram was comprehensively evaluated using multiple statistical metrics in both training and validation sets. Discrimination ability was assessed using receiver operating characteristic (ROC) curve analysis, which demonstrated excellent predictive performance with an area under the curve (AUC) of 0.95 (95% CI: 0.92-0.98) in the training set and 0.93 (95% CI: 0.88-0.98) in the validation set (Figure 3). These high AUC values indicate superior discriminatory capacity of the nomogram in distinguishing between DCIS and GLM. Calibration performance was evaluated using calibration plots, which showed good agreement between predicted probabilities and observed outcomes in both training and validation sets (Figure 4). The calibration curves demonstrated that the nomogram-predicted probabilities closely aligned with the actual probabilities, with minimal deviation from the ideal reference line and mean absolute errors of 0.032 and 0.03 for the training and validation sets, respectively. Bias-corrected calibration curves further confirmed the model’s reliability and suggested minimal overfitting. Clinical utility was assessed through decision curve analysis (DCA), which evaluates the net benefit of using the nomogram across different threshold probabilities. The DCA demonstrated that the nomogram provided substantial clinical benefit compared to treating all patients or treating no patients across a wide range of threshold probabilities (Figure 5). In both training and validation sets, the nomogram consistently outperformed the “treat all” and “treat none” strategies, with net benefit curves remaining above the reference lines across most clinically relevant threshold probabilities. These results collectively indicate that the developed nomogram exhibits excellent discrimination, good calibration, and meaningful clinical utility, making it a reliable tool for differentiating DCIS from GLM in clinical practice.
Two cases whose outcomes were successfully predicted by the nomogram model(Figure 6). Case 1 (Figures 6A, B) A 38-year-old female patient presented with ultrasound characteristics of indistinct margins, absence of microcalcifications, posterior acoustic enhancement, peri-lesional flow, and a lesion size of 3.2 cm, with a predicted probability of 90%. Case 2 (Figures 6C, D) A 45-year-old female patient exhibited ultrasound findings of indistinct margins, presence of microcalcifications, absence of posterior acoustic enhancement, peri-lesional flow, and a lesion size of 3.4 cm, with a predicted probability of 10%.
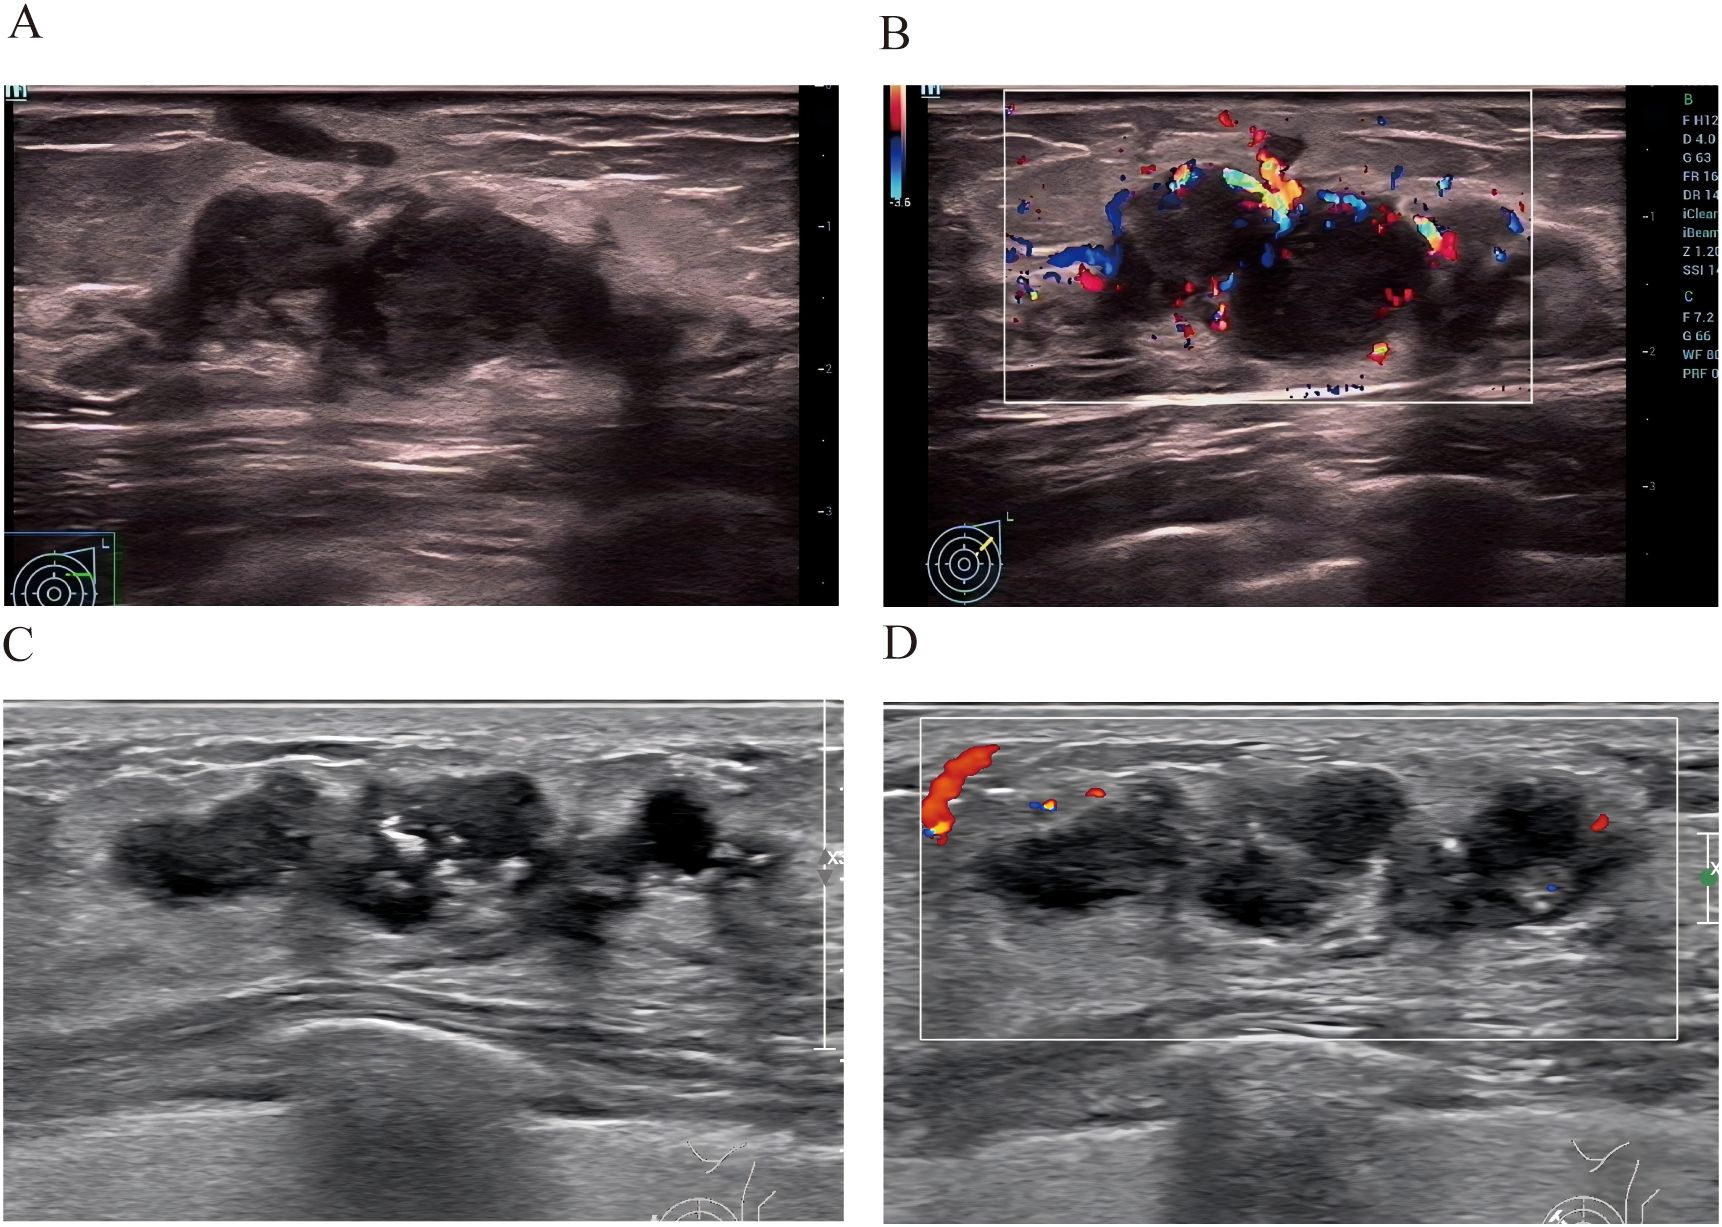
Figure 6. Two cases whose outcomes were successfully predicted by the nomogram model. Case 1 (A, B) A 38-year-old female patient presented with ultrasound characteristics of indistinct margins, absence of microcalcifications, posterior acoustic enhancement, peri-lesional flow, and a lesion size of 3.2 cm, with a predicted probability of 90%.Case 2 (C, D) A 45-year-old female patient exhibited ultrasound findings of indistinct margins, presence of microcalcifications, absence of posterior acoustic enhancement, peri-lesional flow, and a lesion size of 3.4 cm, with a predicted probability of 10%.
Discussion
Granulomatous lobular mastitis (GLM) remains a crucial and underrecognized diagnostic challenge in breast pathology, often imitating breast carcinoma due to its inflammatory presentation and overlapping imaging features (4, 15). As highlighted in recent literature, GLM’s mimicry of malignancy, including ductal carcinoma in situ (DCIS), underscores its clinical importance, leading to frequent misdiagnoses and unnecessary aggressive interventions such as mastectomies or chemotherapy (5, 16).This issue is particularly pertinent in reproductive-age women, where GLM’s idiopathic nature and potential links to immune dysregulation or hormonal factors amplify diagnostic complexity (17, 18). The developed nomogram, integrating age, lesion size, margin characteristics, microcalcifications, posterior acoustic enhancement, and peri-lesional flow, represents a pioneering tool for differentiating granulomatous lobular mastitis (GLM) from ductal carcinoma in situ (DCIS), achieving an area under the curve (AUC) of 0.95 in the training set and 0.93 in the validation set. This model’s clinical utility is underscored by its high sensitivity (0.92/0.89) and specificity (0.89/0.79), surpassing the typical specificity of BI-RADS ultrasound (0.60–0.70) (19, 20). This improvement may translate to a significant reduction in unnecessary biopsies, as suggested by the validation set’s enhanced specificity (0.79 vs. 0.60–0.70 for BI-RADS), providing substantial benefits in decreasing patient morbidity and healthcare costs associated with misdiagnosis-driven interventions, such as mastectomies or chemotherapy (5).
The selected predictors provide distinct diagnostic insights. Age and lesion size reflect the contrasting pathological mechanisms, with older age favoring DCIS due to its neoplastic nature (6, 21), while larger lesion sizes are more indicative of GLM’s inflammatory progression (3, 22). Ultrasound features like indistinct margins and microcalcifications are strongly associated with DCIS’s malignant characteristics (23, 24), whereas posterior acoustic enhancement and peri-lesional flow highlight GLM’s inflammatory etiology, consistent with granulomatous tissue changes (25). This combination effectively addresses the clinical overlap between GLM and DCIS, enhancing diagnostic precision in challenging cases. The nomogram’s reliance on widely available ultrasound and basic clinical data further positions it as a cost-effective alternative to advanced imaging modalities like MRI or deep learning radiomics, which are often inaccessible in resource-limited settings (9, 26).
The inclusion of tumor markers (CEA, CA125, CA153) in our analysis was based on their potential differential expression in inflammatory versus neoplastic breast conditions. However, our results demonstrated no significant differences in these markers between GLM and DCIS patients (Table 1), which has important clinical implications. This finding suggests that conventional tumor markers are inadequate for differentiating these conditions, supporting the need for our ultrasound and clinical feature-based nomogram. The lack of discriminatory value of these markers may be attributed to the fact that GLM, despite being benign, can elicit inflammatory responses that may affect marker levels, while early-stage DCIS may not significantly elevate these markers. This observation reinforces that morphological and clinical features, rather than serological markers, are more reliable for this specific differential diagnosis.
Our ROC curve analysis revealed that WBC count has moderate discriminatory value for differentiating GLM from DCIS, with an optimal cut-off of 7.735 × 10⁹/L and an AUC of 0.69. The elevation of WBC in GLM patients reflects the chronic inflammatory nature of this condition, which typically triggers a systemic immune response. While this biomarker provides useful supplementary information with reasonable sensitivity (68%) and positive predictive value (72%), our multivariable analysis demonstrated that imaging features offer superior discriminatory power, explaining why WBC was not retained in the final nomogram model. Nevertheless, the established cut-off value may serve as a valuable adjunct in clinical decision-making, particularly when combined with clinical and imaging findings, especially considering that WBC levels above 7.735 × 10⁹/L increase the likelihood of GLM diagnosis by 72%.
Despite these strengths, several limitations merit attention. The retrospective, single-center design at Quanzhou First Hospital may introduce selection bias, and the sample size of 290 patients, while adequately powered (128 GLM, 162 DCIS), is smaller than some multicenter cohorts, potentially limiting generalizability (27). Unassessed confounding factors, such as lifestyle variables (e.g., smoking, diet) (28), hormonal influences (e.g., estrogen levels) (28), and lactation-related factors (e.g., breastfeeding patterns, milk stasis) (29), could affect lesion characteristics and model performance, though their impact remains speculative due to data unavailability. The predominance of distinct margins in GLM (50.59% vs. 24.58% in DCIS) in our cohort, which differs from some previous reports, may be attributed to the higher proportion of cases with abscess formation in our series, as abscesses tend to develop well-defined boundaries that are interpreted as distinct margins. Therefore, the cohort’s representation of atypical GLM cases (e.g., those without abscess formation) is unclear, which may restrict applicability to diverse clinical presentations. Although internal validation demonstrated good performance with minimal overfitting, the lack of external validation remains a major limitation. External validation using independent multi-center datasets is essential to confirm the model’s generalizability and clinical applicability before widespread implementation.
Compared to existing models, this nomogram outperforms ultrasound and MRI-based discrimination models for differentiating non-lactational mastitis from breast cancer, which reported an AUC of 0.920 (26), by leveraging accessible ultrasound data without requiring advanced resources. It also rivals ultrasound-based deep learning models, which achieved a sensitivity of 0.92 but an AUC of approximately 0.90 (9), while offering a simpler, clinician-friendly approach. This aligns with the practical diagnostic needs highlighted in GLM literature (4). The decision curve analysis further supports its clinical utility, with net benefits exceeding “treat all” or “treat none” strategies.
Future research should focus on prospective validation of the nomogram in larger GLM cohorts and integration of advanced imaging techniques, such as contrast-enhanced ultrasound and elastography, which have shown promise in characterizing inflammatory breast conditions (30, 31).Furthermore, collaborative multi-institutional studies are warranted to establish the nomogram’s robustness across different healthcare settings and patient demographics.
Conclusion
This study presents the first nomogram tailored for differentiating granulomatous lobular mastitis (GLM) from ductal carcinoma in situ (DCIS), achieving high diagnostic accuracy with an area under the curve (AUC) of 0.95 in the training set and 0.93 in the validation set. By integrating age, lesion size, margin characteristics, microcalcifications, posterior acoustic enhancement, and peri-lesional flow, the model offers a reliable, cost-effective tool that outperforms conventional BI-RADS ultrasound assessments, potentially reducing unnecessary biopsies significantly. Its reliance on widely available ultrasound and clinical parameters makes it particularly valuable in resource-limited settings, such as community hospitals. However, external validation in independent cohorts is required before clinical implementation.
Data availability statement
The raw data supporting the conclusions of this article will be made available by the authors, without undue reservation.
Ethics statement
The studies involving humans were approved by Institutional Review Board of Quanzhou First Hospital. The studies were conducted in accordance with the local legislation and institutional requirements. The ethics committee/institutional review board waived the requirement of written informed consent for participation from the participants or the participants’ legal guardians/next of kin because According to the Declaration of Helsinki, informed consent requirements were waived due to the retrospective design of the study.
Author contributions
YL: Software, Writing – original draft, Writing – review & editing, Data curation. LS: Writing – original draft, Methodology, Visualization, Validation. QZ: Data curation, Writing – original draft, Investigation. ZL: Resources, Project administration, Writing – review & editing, Supervision.
Funding
The author(s) declare that no financial support was received for the research, and/or publication of this article.
Conflict of interest
The authors declare that the research was conducted in the absence of any commercial or financial relationships that could be construed as a potential conflict of interest.
Generative AI statement
The author(s) declare that Generative AI was used in the creation of this manuscript. The core content of this research, including research ideas, research design, data collection, analytical methods, and research conclusions, was completed independently by the author without the use of AI tools. During the writing process, ChatGPT 5.0 was used to assist with the following tasks: (1) optimization of English language expression and grammar checking; (2) compliance checking of academic writing formats; (3) standardization of reference formatting. All content generated with AI assistance has been carefully reviewed and revised by the author to ensure accuracy and appropriateness. The author takes full responsibility for all content in this article. This statement is made to maintain academic transparency and integrity.
Any alternative text (alt text) provided alongside figures in this article has been generated by Frontiers with the support of artificial intelligence and reasonable efforts have been made to ensure accuracy, including review by the authors wherever possible. If you identify any issues, please contact us.
Publisher’s note
All claims expressed in this article are solely those of the authors and do not necessarily represent those of their affiliated organizations, or those of the publisher, the editors and the reviewers. Any product that may be evaluated in this article, or claim that may be made by its manufacturer, is not guaranteed or endorsed by the publisher.
Abbreviations
GLM, Granulomatous Lobular Mastitis; DCIS, Ductal Carcinoma In Situ; ROC, Receiver Operating Characteristic; AUC, Area Under the Curve; BI-RADS, Breast Imaging-Reporting and Data System; WHO, World Health Organization; MRI, Magnetic Resonance Imaging; DCA, Decision Curve Analysis; WBC, White Blood Cell; CEA, Carcinoembryonic Antigen; CA125, Cancer Antigen 125; CA153, Cancer Antigen 15-3; VIF, Variance Inflation Factor; EMRS, Electronic Medical Record System; DICOM, Digital Imaging and Communications in Medicine; AIC, Akaike Information Criterion; CI, Confidence Interval; OR, Odds Ratio.
References
1. Gillen N and Leahy J. Promoting standardization of clinical evidence with severity-guided treatments for idiopathic granulomatous mastitis: A narrative review. Am Surg. (2025) 91:133–40. doi: 10.1177/00031348241275717
2. Kessler E and Wolloch Y. Granulomatous mastitis: a lesion clinically simulating carcinoma. Am J Clin Pathol. (1972) 58:642–6. doi: 10.1093/ajcp/58.6.642
3. Cui L, Sun C, Guo J, Zhang X, and Liu S. Pathological manifestations of granulomatous lobular mastitis. Front Med (Lausanne). (2024) 11:1326587. doi: 10.3389/fmed.2024.1326587
4. Shanbhag NM, Ameri MA, Shanbhag SN, Anandan N, Balaraj K, and Bin Sumaida A. Diagnostic challenges and insights into granulomatous mastitis: A systematic review. Cureus. (2024) 16:e75733. doi: 10.7759/cureus.75733
5. Shang B, Zhang T, Liu C, Lu J, Cui C, Feng J, et al. Analysis of three treatment methods for granulomatous lobular mastitis: a retrospective study in a single center. Front Oncol. (2025) 15:1588836. doi: 10.3389/fonc.2025.1588836
6. Giaquinto AN, Sung H, Newman LA, Freedman RA, Smith RA, Star J, et al. Breast cancer statistics 2024. CA Cancer J Clin. (2024) 74:477–95. doi: 10.3322/caac.21863
7. Hovanessian Larsen LJ, Peyvandi B, Klipfel N, Grant E, and Iyengar G. Granulomatous lobular mastitis: imaging, diagnosis, and treatment. AJR Am J Roentgenol. (2009) 193:574–81. doi: 10.2214/AJR.08.1528
8. Debbi K, Habert P, Grob A, Loundou A, Siles P, Bartoli A, et al. Radiomics model to classify mammary masses using breast DCE-MRI compared to the BI-RADS classification performance. Insights Imaging. (2023) 14:64. doi: 10.1186/s13244-023-01404-x
9. Wu L, Li S, Wu C, Wu S, Lin Y, and Wei D. Ultrasound-based deep learning radiomics nomogram for differentiating mass mastitis from invasive breast cancer. BMC Med Imaging. (2024) 24:189. doi: 10.1186/s12880-024-01353-x
10. Kayadibi Y, Saracoglu MS, Kurt SA, Deger E, Boy FNS, Ucar N, et al. Differentiation of Malignancy and idiopathic granulomatous mastitis presenting as non-mass lesions on MRI: radiological, clinical, radiomics, and clinical-radiomics models. Acad Radiol. (2024) 31:3511–23. doi: 10.1016/j.acra.2024.03.025
11. Cheng LL, Ye F, Xu T, Li HJ, Li WM, and Fan XF. Nomogram model for predicting minimal breast cancer based on clinical and ultrasonic characteristics. Int J Womens Health. (2024) 16:2173–84. doi: 10.2147/IJWH.S482291
12. Balachandran VP, Gonen M, Smith JJ, and DeMatteo RP. Nomograms in oncology: more than meets the eye. Lancet Oncol. (2015) 16:e173–80. doi: 10.1016/S1470-2045(14)71116-7
13. Yang WT and Bu H. Updates in the 5(th) edition of WHO classification of tumours of the breast. Zhonghua Bing Li Xue Za Zhi. (2020) 49:400–5. doi: 10.3760/cma.j.cn112151-20200303-00163
14. Tan PH, Ellis I, Allison K, Brogi E, Fox SB, Lakhani S, et al. The 2019 World Health Organization classification of tumours of the breast. Histopathology. (2020) 77:181–5. doi: 10.1111/his.14091
15. Aydin I, Kesicioglu T, Vural S, Sengul I, Yilmaz K, and Sengul D. Idiopathic granulomatous lobular mastitis: an imitation of breast carcinoma. Cureus. (2021) 13:e15206. doi: 10.7759/cureus.15206
16. Ahmed H, Steinhoff M, Al-Merekhi H, and Abu Shaikha S. Idiopathic granulomatous lobular mastitis emulating breast carcinoma: a case report. J Med Case Rep. (2025) 19:494. doi: 10.1186/s13256-025-05548-w
17. Wang S, Liu R, Yan S, and Zhao P. Idiopathic granulomatous mastitis: immune-pathogen imbalance in a treatment-resistant benign inflammatory disease. Int J Womens Health. (2025) 17:3607–31. doi: 10.2147/IJWH.S536970
18. Kumar N, Pankaj D, Sinha S, Kumari P, Pawar S, Bhushan V, et al. Beneath the surface: unveiling idiopathic granulomatous mastitis within a masquerading breast lump. Cureus. (2025) 17:e92678. doi: 10.7759/cureus.92678
19. Berg WA, Gutierrez L, NessAiver MS, Carter WB, Bhargavan M, Lewis RS, et al. Diagnostic accuracy of mammography, clinical examination, US, and MR imaging in preoperative assessment of breast cancer. Radiology. (2004) 233:830–49. doi: 10.1148/radiol.2333031484
20. D'Orsi CJ, Sickles EA, Mendelson EB, Morris EA, et al. ACR BI-RADS® Atlas, Breast Imaging Reporting and Data System. 5th ed. Reston, VA: American College of Radiology (2013).
21. Kalwaniya DS, Gairola M, Gupta S, and Pawan G. Ductal carcinoma in situ: A detailed review of current practices. Cureus. (2023) 15:e37932. doi: 10.7759/cureus.37932
22. Tan QW, Zhang YN, Jia YP, Gou J, Lv Q, and Yang XQ. Methylprednisolone for idiopathic granulomatous mastitis: a prospective observational cohort study. Gland Surg. (2022) 11:1538–45. doi: 10.21037/gs-22-484
23. Wang LC, Sullivan M, Du H, Feldman MI, and Mendelson EB. US appearance of ductal carcinoma in situ. Radiographics. (2013) 33:213–28. doi: 10.1148/rg.331125092
24. Lee MH, Ko EY, Han BK, Shin JH, Ko ES, and Hahn SY. Sonographic findings of pure ductal carcinoma in situ. J Clin Ultrasound. (2013) 41:465–71. doi: 10.1002/jcu.22085
25. Febery A and Bennett I. Sonographic features of inflammatory conditions of the breast. Australas J Ultrasound Med. (2019) 22:165–73. doi: 10.1002/ajum.12170
26. Peng J, Zhao M, and Wang S. Discrimination model construction for non-lactational mastitis and breast cancer based on imaging features. Br J Hosp Med (Lond). (2024) 85:1–15. doi: 10.12968/hmed.2024.0278
27. Ma Q, Lu X, Qin X, Xu X, Fan M, Duan Y, et al. A sonogram radiomics model for differentiating granulomatous lobular mastitis from invasive breast cancer: a multicenter study. Radiol Med. (2023) 128:1206–16. doi: 10.1007/s11547-023-01694-7
28. Krawczyk N, Kuhn T, Ditsch N, Hartmann S, Gentilini OD, Lebeau A, et al. Idiopathic granulomatous mastitis as a benign condition mimicking inflammatory breast cancer: current status, knowledge gaps and rationale for the GRAMAREG study (EUBREAST-15). Cancers (Basel). (2024) 16:3387. doi: 10.3390/cancers16193387
29. Alipour S, Tabatabaian M, Aziminezhadan P, Boloorinejad P, Orouji A, Farbod M, et al. From hypothesis to robust evidence in a nationwide multicenter case-control study on 1490 women: milk stasis and idiopathic granulomatous mastitis. Sci Rep. (2025) 15:37576. doi: 10.1038/s41598-025-10784-7
30. Yin L, Agyekum EA, Zhang Q, Pan L, Wu T, Xiao X, et al. Differentiation between granulomatous lobular mastitis and breast cancer using quantitative parameters on contrast-enhanced ultrasound. Front Oncol. (2022) 12:876487. doi: 10.3389/fonc.2022.876487
Keywords: granulomatous mastitis, carcinoma, intraductal, noninfiltrating, nomograms, ultrasonography, mammary, predictive learning models
Citation: Li Y, Su L, Zhang Q and Liu Z (2025) Development and validation of a nomogram for differentiating granulomatous lobular mastitis from ductal carcinoma in situ. Front. Oncol. 15:1668908. doi: 10.3389/fonc.2025.1668908
Received: 24 July 2025; Accepted: 24 November 2025; Revised: 10 November 2025;
Published: 08 December 2025.
Edited by:
Demet Sengul, Giresun University, TürkiyeReviewed by:
Cherry Bansal, Tantia University, IndiaAli Jahanshahi, Gilan University of Medical Sciences, Iran
Copyright © 2025 Li, Su, Zhang and Liu. This is an open-access article distributed under the terms of the Creative Commons Attribution License (CC BY). The use, distribution or reproduction in other forums is permitted, provided the original author(s) and the copyright owner(s) are credited and that the original publication in this journal is cited, in accordance with accepted academic practice. No use, distribution or reproduction is permitted which does not comply with these terms.
*Correspondence: Zhonghua Liu, bGl1emhvbmdodWEyMDA1QDEyNi5jb20=