 Haoqi Wang
 Shan Gao3
 Cuizhi Geng
- 1Department of Breast Center, The Fourth Hospital of Hebei Medical University, Shijiazhuang, Hebei, China
- 2Hebei Key Laboratory of Breast Cancer Molecular Medicine, The Fourth Hospital of Hebei Medical University, Shijiazhuang, Hebei, China
- 3Department of Gland Surgery, The Hebei Province People’s Hospital, Shijiazhuang, Hebei, China
- 4Department of Computed Tomography and Magnetic Resonance, The Fourth Hospital of Hebei Medical University, Shijiazhuang, Hebei, China
Background: The development of a robust and clinically applicable predictive model for pathological complete response (pCR) following neoadjuvant therapy (NAT) in human epidermal growth factor receptor 2 (HER2)-positive breast cancer (BC) is of critical importance.
Methods: In this retrospective study, 393 female patients with stage II–III BC who received NAT followed by surgery between May 2021 and December 2023 were included. Clinicopathological data, apparent diffusion coefficient (ADC) values from breast MRI, and pathological remission after NAT were collected. The change rate of ADC values after two cycles of NAT (ΔADC0-2%) was calculated. The efficacy of NAT regimens containing trastuzumab plus pertuzumab (HP) and trastuzumab plus pyrotinib (HPy) was compared. A nomogram predicting pCR was constructed, and its performance was evaluated. The model was internally validated using the bootstrap resampling method.
Results: The rate of total pathological complete response (tpCR) in the overall population was 68%. There was no statistically significant difference in tpCR between the HP and HPy groups (P > 0.05). Hormone receptor (HR) negativity, HER2 3+, high Ki-67 index, moderate-highly (M-H) infiltrated tumor-infiltrating lymphocytes (TILs), and ΔADC0-2% > 36.2% were independently associated with tpCR (P < 0.05). The nomogram integrating these variables exhibited good discrimination (AUC, 0.75) and calibration ability (P = 0.925), as well as valuable clinical applicability.
Conclusion: Both HP and HPy combined with chemotherapy can be considered as optional NAT regimens for HER2-positive BC. The nomogram incorporating common clinical indicators provides a basis for clinicians to predict NAT efficacy at an earlier stage.
Introduction
Human epidermal growth factor receptor 2 (HER2)-positive breast cancer is a subtype of breast cancer (BC), characterized by HER2 amplification and accounting for 20-25% of all BC cases (1). Neoadjuvant therapy (NAT) is a crucial preoperative systemic therapy for HER2-positive BC, facilitating tumor downstaging to render it operable and breast-conserving (2). It also assesses drug sensitivity, thereby optimizing postoperative adjuvant treatment plans (3). According to the NeoSphere (4) and PEONY (5) clinical trials, chemotherapy combined with trastuzumab (H) and pertuzumab (P) is the standard of care for HER2-positive BC in NAT. Based on the PHEDRA study (6), pyrotinib (Py), a small molecule tyrosine kinase inhibitor originally developed in China, in combination with H and docetaxel, has also become an optional NAT regimen for patients with HER2-positive tumors. Although the combination of two different anti-HER2 targeted drugs significantly improves pathological response compared to single-targeted treatment with H, there are currently no randomized controlled clinical trials comparing the two combination regimens.
Pathological complete response (pCR) is a crucial indicator for assessing the effectiveness of NAT (7). Patients with HER2-positive tumors who achieve pCR through NAT tend to have significantly prolonged survival (7). However, pCR can only be confirmed through pathological testing of the tumor bed after surgery. If the efficacy of NAT could be predicted earlier, allowing for timely adjustment of the therapeutic regimen, the likelihood of achieving pCR and improving prognosis would be significantly enhanced. To date, numerous clinicopathological indicators and even multidimensional radiomics have been incorporated into predictive models for pCR in order to improve the accuracy of predictions (8–12). However, there is a scarcity of models specifically designed for the HER2-positive subtype, and the parameters included in existing models are often complex and not readily accessible (8–12), which limits their widespread application by clinicians. Therefore, it is essential to construct a predictive model specifically for HER2-positive breast cancer that incorporates routine and readily available clinicopathological and imaging parameters, making it more practical for clinical use.
Owing to its superior soft tissue resolution and multiparametric imaging capabilities, MRI is considered the most accurate imaging modality for evaluating the efficacy of NAT (13–16). Both imaging and clinical guidelines recommend MRI for this purpose. The apparent diffusion coefficient (ADC) is the most commonly used parameter in MRI diffusion-weighted imaging (DWI). It describes the speed and range of molecular diffusion in different directions of the DWI sequence, reflecting the random motion of water molecules within tissue. High ADC values typically indicate free movement of water molecules, while low ADC values suggest restricted movement, which may be associated with high cellular density. Thus, ADC values can not only distinguish between benign and malignant tumors (17, 18), but also provide valuable reference for assessing the efficacy of NAT (19, 20). During NAT, if the treatment is effective, the ADC value will increase as cancer cell density decreases (17, 21–23). Numerous studies have confirmed that ADC values and their changes are closely related to NAT efficacy (12, 24). Moreover, it has been proposed that early changes in ADC values can better predict pCR after NAT. Clinically, ADC values are routinely recorded in standard MRI reports, offering valuable insights for clinicians to evaluate patients’ conditions.
Consequently, this study was designed to compare the efficacy of NAT regimens containing HP (trastuzumab plus pertuzumab) and HPy (trastuzumab plus pyrotinib) in a real-world setting. It also aimed to explore the correlation between the early change rate of the ADC value (after two cycles of NAT) and the efficacy of NAT for HER2-positive BC. Univariate and multivariate analyses were conducted to identify predictors of pCR and to construct a predictive nomogram that could forecast the probability of pCR at an earlier stage.
Materials and methods
Patients
Patients who received NAT at the Fourth Hospital of Hebei Medical University between May 2021 and December 2023 were included in this study. The inclusion criteria were as follows: (1) Female, (2) Pathologically confirmed HER2-positive primary BC, (3) No prior treatment before NAT, (4) Completion of the full course of NAT followed by surgery, (5) Periodic breast contrast-enhanced (CE)-MRI examinations (before and after NAT, and every two cycles during NAT), (6) Availability of complete clinicopathological information and imaging data. The exclusion criteria were: (1) Bilateral or occult breast cancer, (2) Incomplete NAT or surgery, (3) Insufficient clinicopathological data, (4) Loss to follow-up. The study was approved by the Ethics Committee of the Fourth Hospital of Hebei Medical University, in accordance with the Helsinki Declaration of 1975.
Therapeutic regimens
Chemotherapy combined with dual anti-HER2 drugs is the standard of care for HER2-positive BC in NAT. The chemotherapy regimens used included:TCb: Albumin-bound paclitaxel (T, 250 mg/m²) plus carboplatin (Cb, AUC = 6), administered for six cycles. AC-T: Pirarubicin (A, 60 mg/m²) or doxorubicin liposome (35 mg/m²) or epirubicin (90 mg/m²) plus cyclophosphamide (C, 600 mg/m²) for four cycles, followed by albumin-bound paclitaxel (T, 250 mg/m²) for four cycles. TA: Albumin-bound paclitaxel (T, 250 mg/m²) plus pirarubicin (A, 50 mg/m²) or doxorubicin liposome (35 mg/m²) or epirubicin (75 mg/m²), administered for six cycles. T: Albumin-bound paclitaxel (T, 250 mg/m²) alone, administered for six cycles. The anti-HER2 targeted combinations included: HP: Trastuzumab (H, loading dose 8 mg/kg, maintenance dose 6 mg/kg) plus pertuzumab (P, loading dose 840 mg, maintenance dose 420 mg). HPy: Trastuzumab (H, loading dose 8 mg/kg, maintenance dose 6 mg/kg) plus pyrotinib (Py, initial dose 400 mg, with dose reduction to 320 mg or even 240 mg based on adverse events (AEs), taken orally once daily). These combinations were administered concurrently with chemotherapy throughout NAT. All regimens, except for pyrotinib, were administered intravenously on day 1 every 21 days. Dose reductions or delays were permitted for chemotherapy and pyrotinib based on AEs. Dose reductions were not allowed for trastuzumab and pertuzumab.
Clinicopathologic data collection and definitions
The clinicopathological data collected included age, menstrual status, T stage, axillary lymph node metastasis and N stage, TNM stage (AJCC version 8.0), hormone receptor (HR) status, HER2 expression, Ki-67 index, tumor-infiltrating lymphocytes (TILs), the change rate of the apparent diffusion coefficient (ΔADC0-2%), NAT regimens, surgical method, Miller-Payne (MP) grading, and residual cancer burden (RCB) classification. The estrogen receptor (ER), progesterone receptor (PR), HER2, and Ki-67 were evaluated using immunohistochemical (IHC) staining.
HR-positive status was defined as ER and/or PR expression of ≥1%, while HR-negative status was assigned to cases with expression levels below this threshold (25). HER2-positive status was determined by IHC staining showing 3+ or 2+ with confirmatory fluorescence in situ hybridization (FISH) positivity. TILs were assessed via hematoxylin-eosin (HE) staining and categorized as low (L, 0%-10%), moderate (M, 11%-59%), and high (H, >60%) (26). ΔADC0-2% was calculated as (ADC value after two cycles of NAT − ADC value pre-NAT)/ADC value pre-NAT×100%. Total pathological complete response (tpCR) was defined as the absence of residual invasive cancer cells in both the breast and lymph nodes (ypT0/is and ypN0), corresponding to residual cancer burden (RCB) 0. Breast pathological complete response (bpCR) was defined as the absence of residual invasive cancer in the breast, equivalent to Miller-Payne (MP) grade 5.
Statistical analysis
Data analysis was performed using SPSS version 27.0, R software (version 4.0), and MedCalc 20.0. Continuous variables were expressed as mean ± standard deviation (SD) or median (interquartile range), and intergroup comparisons were made using the t-test or nonparametric tests as appropriate. Categorical variables were presented as frequencies with percentages, and differences between groups were assessed using the Chi-square test or Fisher’s exact test. Propensity score matching (PSM) was conducted at a 1:2 ratio to adjust for confounding variables between the HP and HPy groups using R software. Multivariate binary logistic regression analysis was performed to identify independent predictors of pCR. A predictive nomogram for pCR was developed using the ‘rms’ package in R software. Receiver operating characteristic (ROC) curves were generated using the ‘pROC’ and ‘ggplot2’ packages to calculate the area under the curve (AUC) and determine the optimal cutoff values, specificity, and sensitivity. ROC curves comparing each variable and the nomogram were plotted using MedCalc 20.0 software, and the corresponding AUC, optimal cutoff values, specificity, and sensitivity were calculated. The calibration accuracy of the model was assessed using the Hosmer-Lemeshow Calibration Curve. Decision curve analysis (DCA) was performed using the ‘rmda’ package to evaluate the clinical utility of the nomogram. Internal validation of the model was conducted using the Bootstrap resampling method. A two-tailed P value of less than 0.05 was considered statistically significant.
Results
Patient characteristics
Between May 2021 and December 2023, a total of 428 patients diagnosed with HER2-positive BC underwent NAT. Of these, 35 patients were excluded due to incomplete pathological information post-NAT (n = 15) and missing baseline MRI (n = 20) (Figure 1). Consequently, 393 patients (median age, 51 years) were included in the study. At initial diagnosis, 57% of the patients were premenopausal. The majority of patients were staged as T2 (67%), N1 (62%), and stage II (62%). The predominant pathological histological type was invasive ductal carcinoma (83%), with most histological grades ranging from 1 to 2 (86%). The proportion of HR negativity was 44%, while the positive rate was 56%. HER2 amplification was primarily manifested as 3+ (92%). A relatively high percentage of patients (55%) exhibited high expression of Ki-67 (> 30%). TILs predominantly showed low infiltration (60%). The most commonly used chemotherapy regimen was TCb*6 (57%), followed by T*6 (23%) and AC*4 - T*4/TA*6 (20%). The primary anti-HER2 targeted combination was HP (77%) (Table 1).
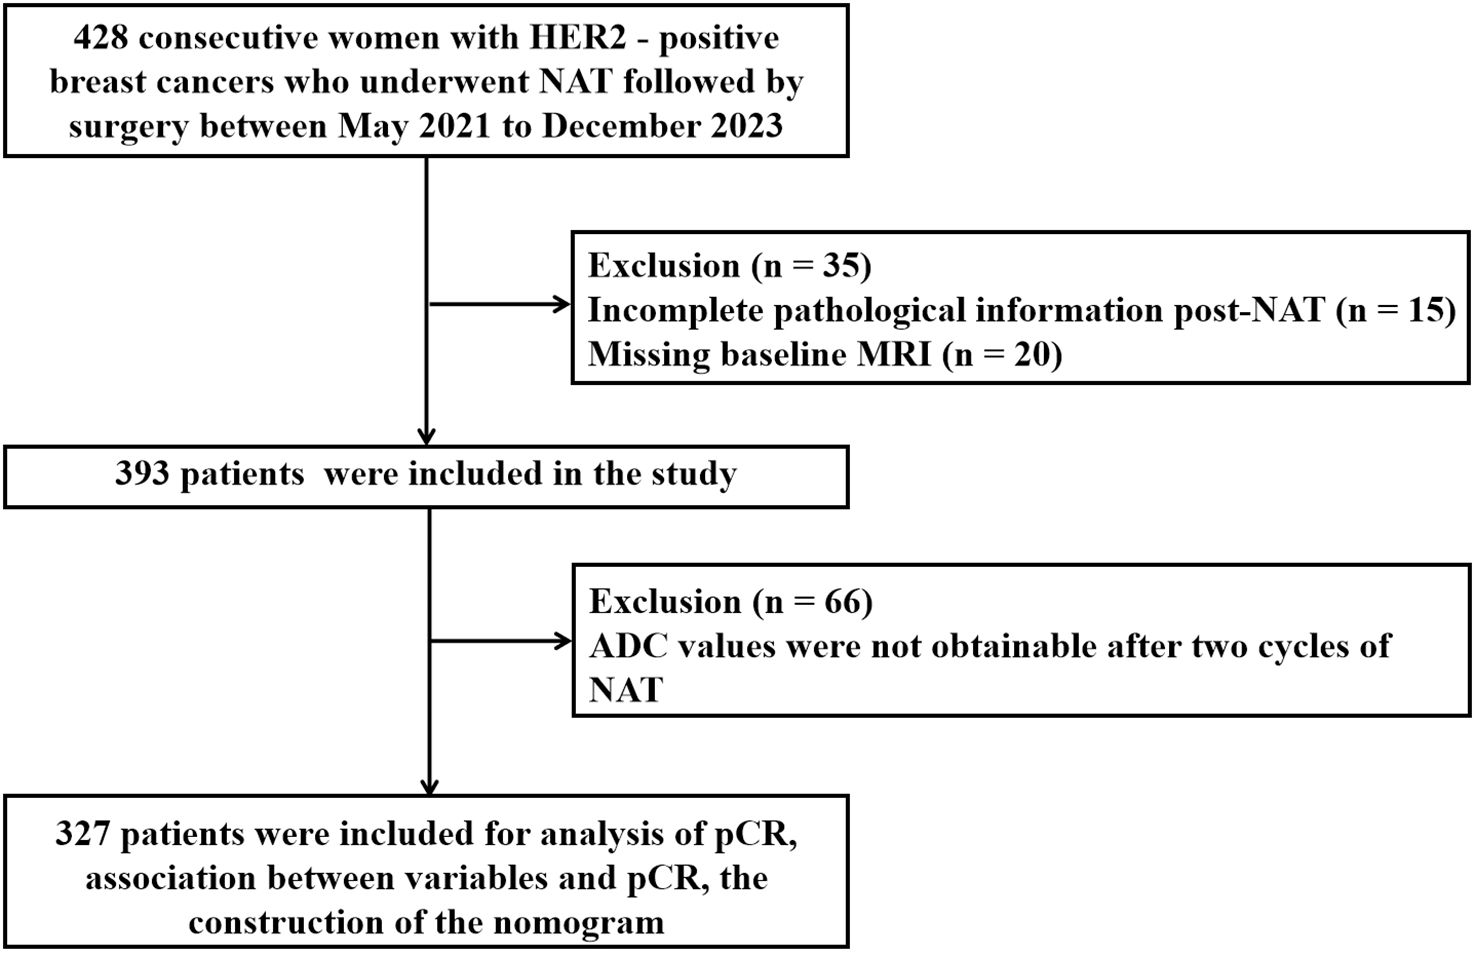
Figure 1. Flowchart shows patient exclusion for the study.
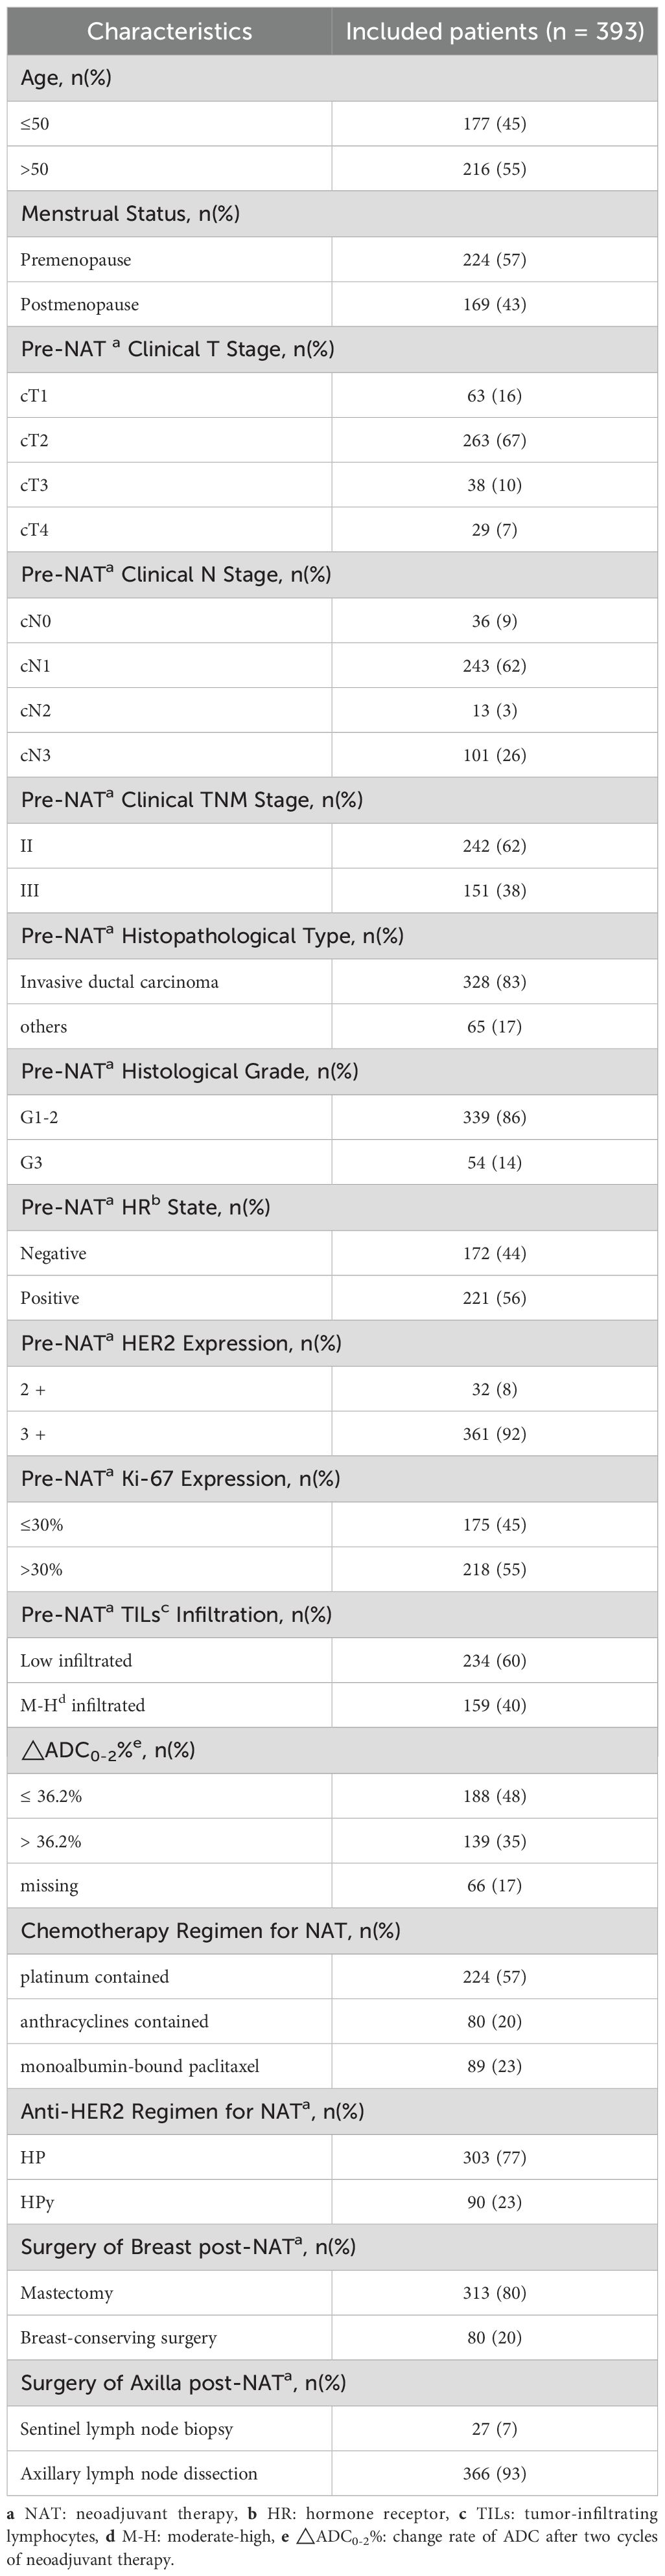
Table 1. Characteristics of included patients.
Pathological response after NAT of the overall population and the optimal cutoff of ΔADC0–2% for tpCR
All patients underwent surgery within 2 to 4 weeks after completing NAT, with 80% undergoing mastectomy and 20% undergoing breast-conserving surgery. The tpCR rate for the entire cohort was 68%, and the pathological complete response rate in the breast (bpCR) was 76%. Due to significant tumor regression, ADC values were not obtainable for 66 patients after two cycles of NAT. For the remaining patients with available ΔADC0-2%, the tpCR rate was 64%, and the bpCR rate was 71%. According to the ROC curve for ΔADC0-2% (Figure 2), the AUC was 0.63 [95% CI: 0.58, 0.68], with an optimal cutoff value of 36.2% for predicting tpCR. Based on this cutoff, patients were divided into two groups for further analysis: those with ΔADC0-2% ≤ 36.2% and those with ΔADC0-2% > 36.2%.
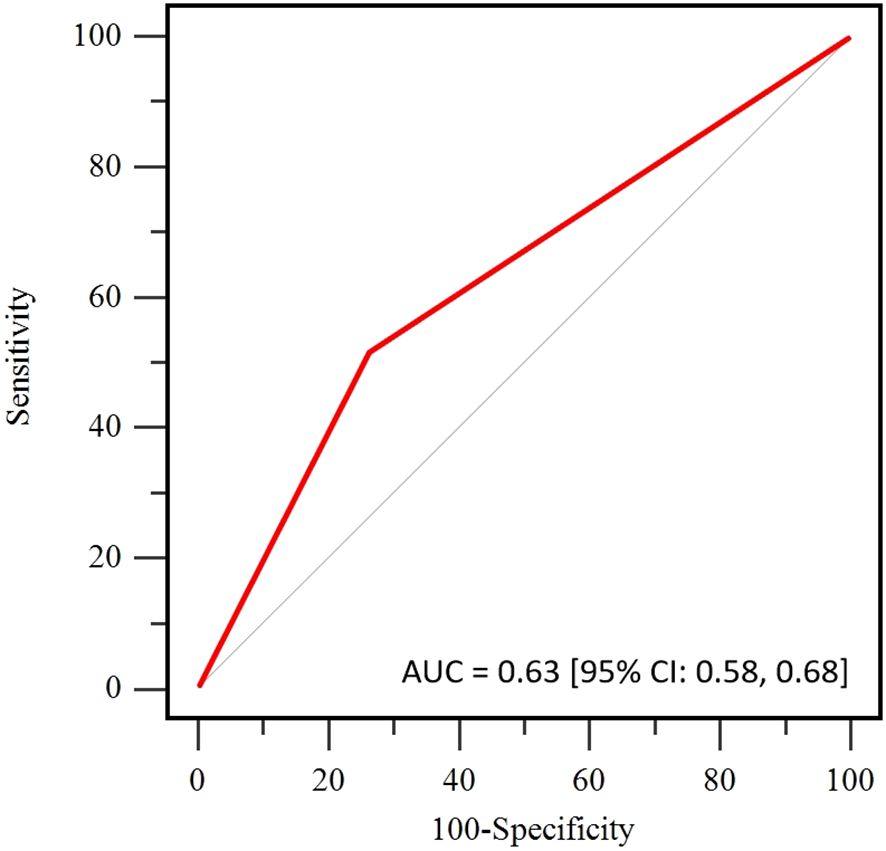
Figure 2. Receiver operating curve (ROC) of the apparent diffusion coefficient (ADC) for pathological complete response (pCR) prediction.
Comparison of demographic characteristics and pathological response between the HP group and the HPy group
Before PSM
Before PSM (Table 2), statistically significant differences were observed between the two groups in terms of patient age, menstrual status, histological type, and the choice of chemotherapy regimen (P < 0.05). Compared with patients treated with HP, a higher proportion of patients in the HPy group were over 50 years old (64%), postmenopausal (52%), had a histological type of non-invasive ductal carcinoma (26%), and received a chemotherapy regimen including anthracyclines (51%). No significant differences were found between the two groups in other clinical and pathological indicators (P > 0.05). The tpCR rate was numerically higher in the HP group than in the HPy group, but the difference was not statistically significant (69% vs 64%, P = 0.419). The bpCR rate was significantly higher in the HP group (79% vs 67%, P = 0.061).
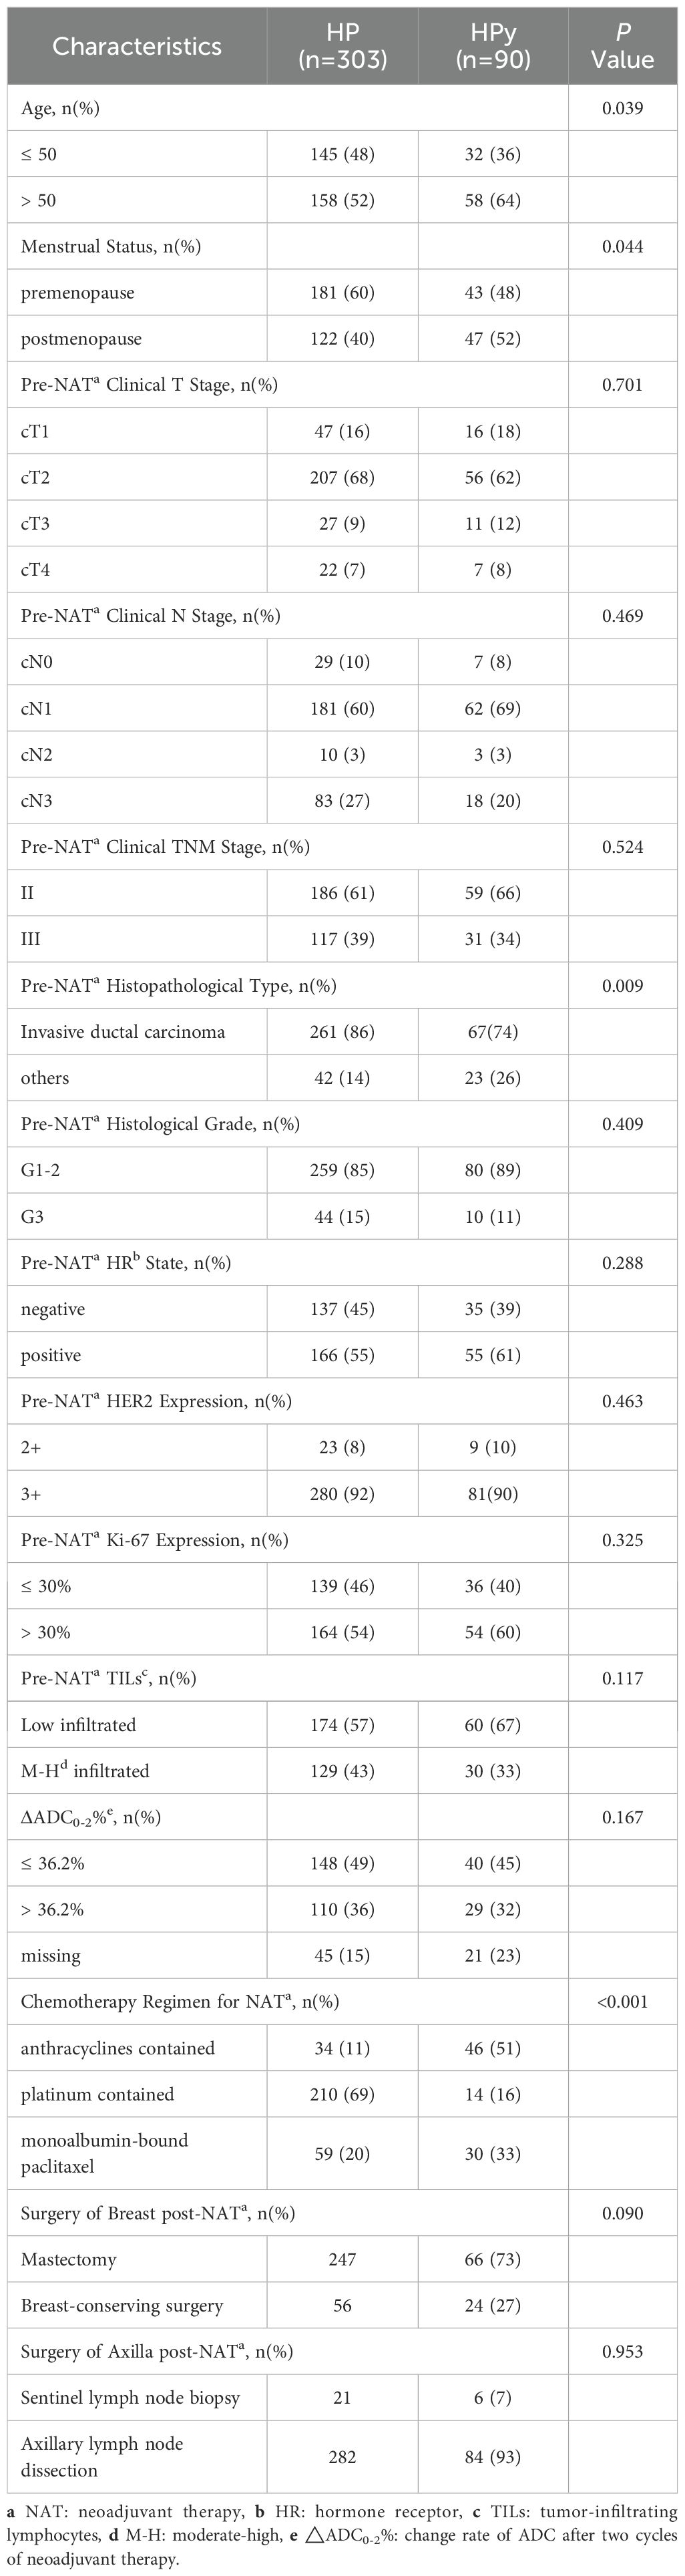
Table 2. Comparison of clinicopathological characteristics between the HP and HPy groups before PSM.
After PSM
To eliminate confounding factors, this study employed a 1:2 nearest neighbor matching without replacement based on propensity scores, with a caliper width set at 0.2. The post-matching analysis demonstrated a more uniform distribution of propensity scores between the two groups (Figure 3A), with the standard deviation clustering around zero (Figure 3B). Following PSM, the HP group included 106 individuals, and the HPy group included 67 patients. Tumor characteristics were well-balanced between the two groups (Table 3). After PSM, there was no statistically significant difference in the tpCR (65% vs 64%, P = 0.902) and bpCR (75% vs 66%, P = 0.211) rates between the HP and HPy groups.
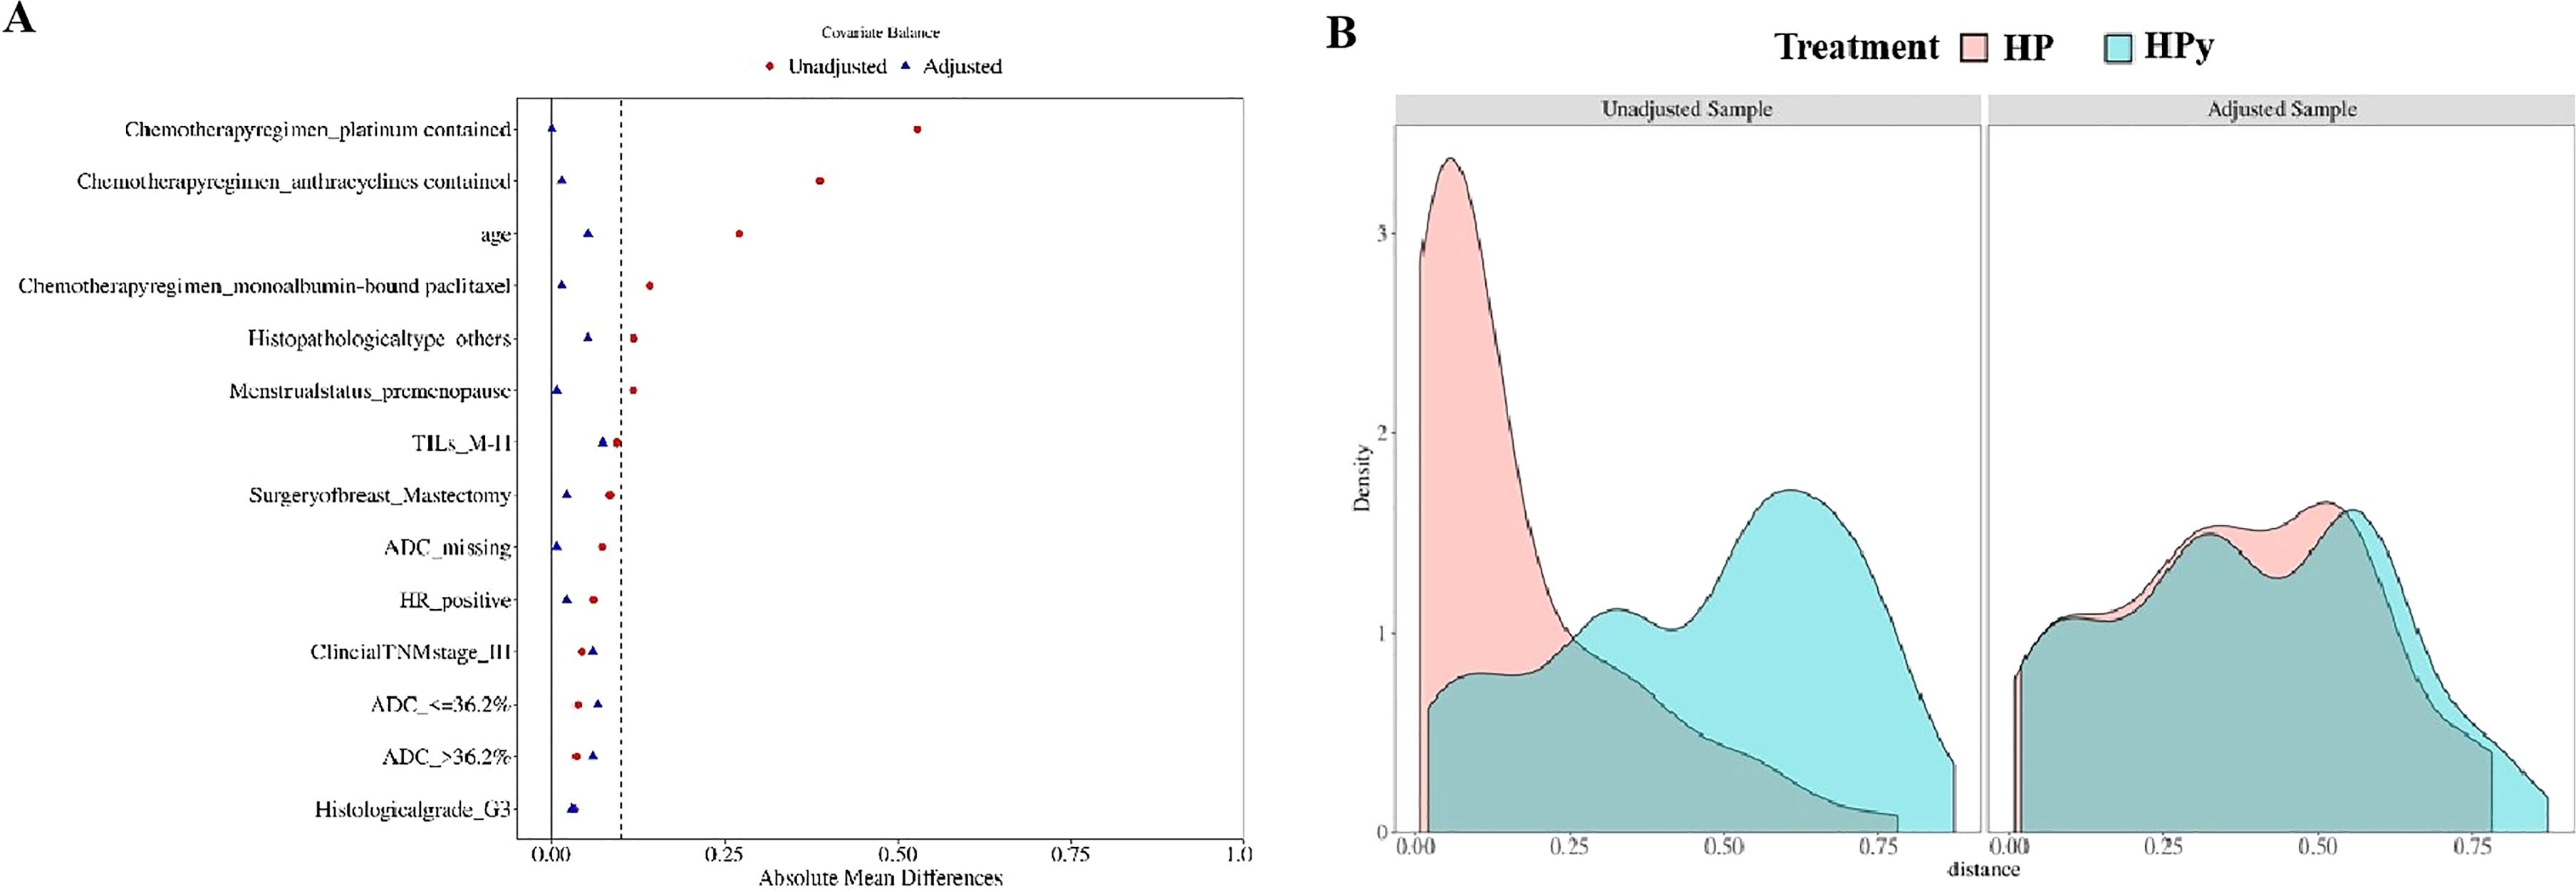
Figure 3. Testing the balance of covariates between the HP group and the HPy group before and after PSM. (A) Propensity score scatter plot before and after the PSM. (B) Distribution histogram of standard deviation.
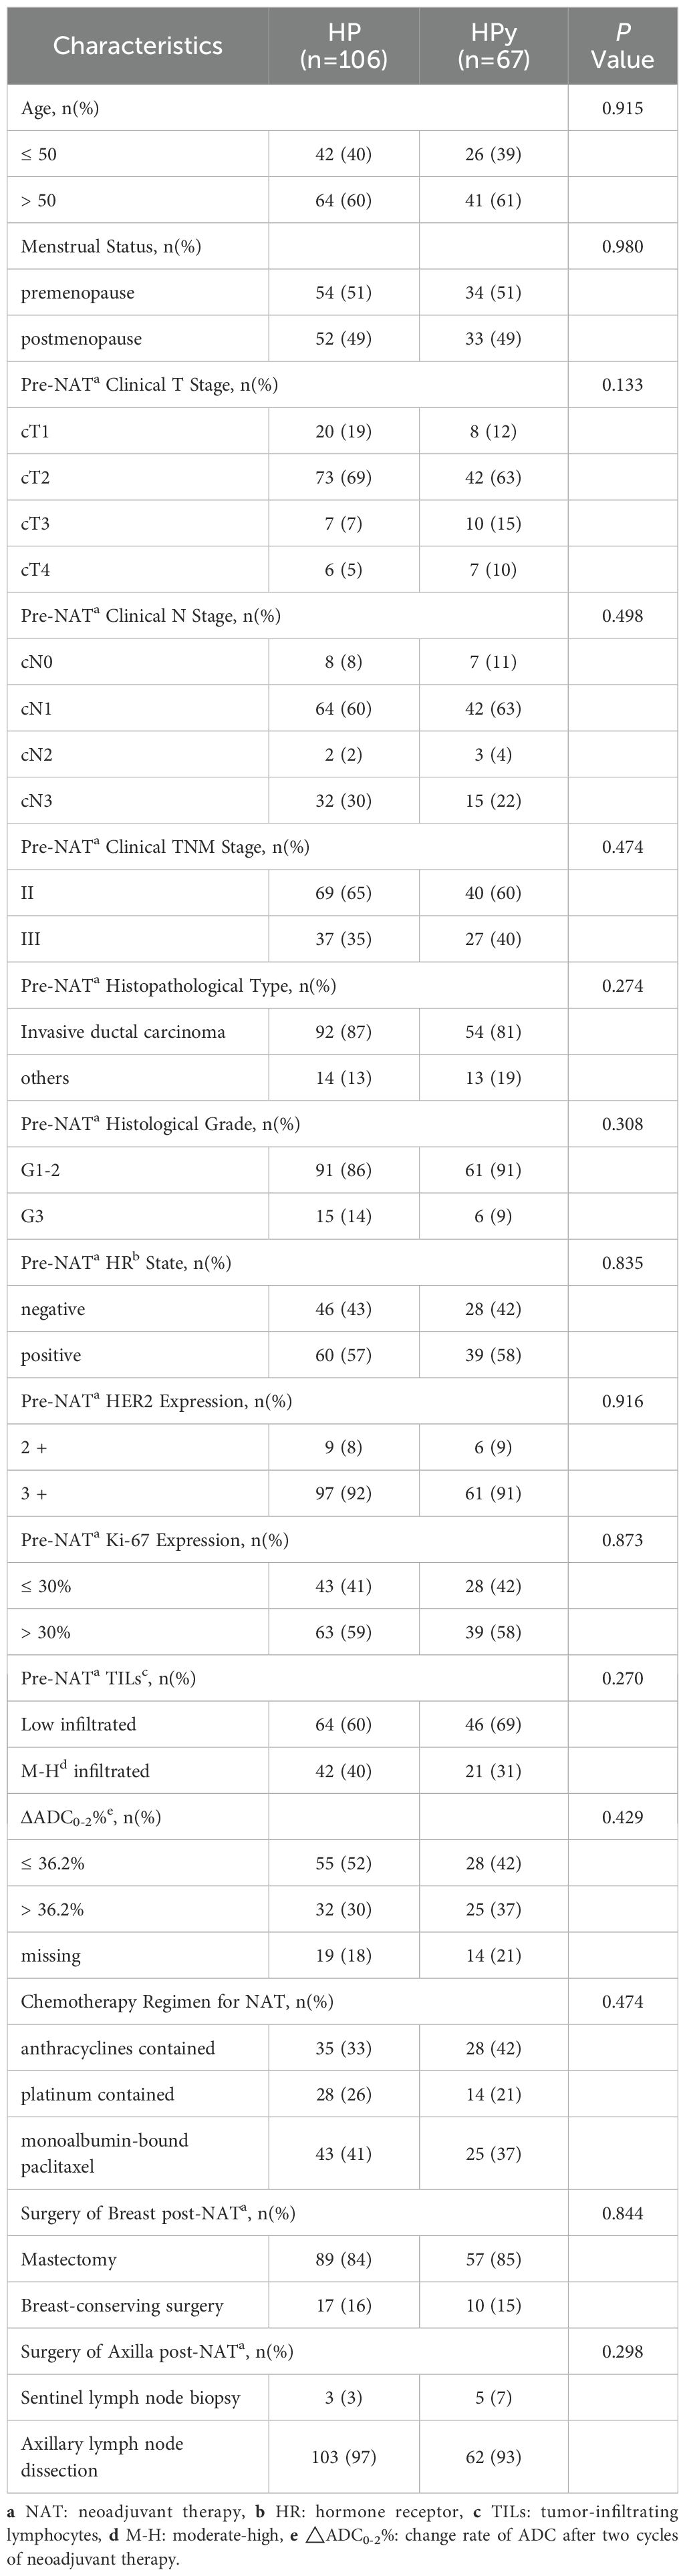
Table 3. Comparison of clinicopathological characteristics between the HP and HPy groups after PSM.
Clinicopathological indicators influencing tpCR
The analysis was conducted after excluding 66 patients who did not have ADC values after the second cycle of NAT. Among the clinicopathological and imaging characteristics (Table 4), positive lymph nodes (P = 0.015), HR negativity (P < 0.001), high Ki-67 index (P = 0.005), moderate-to-high (M-H) infiltrated TILs (P < 0.001), ΔADC0-2% > 36.2% (P < 0.001), HER2 3+ (P < 0.001), and the TCb regimen (P = 0.003) were associated with tpCR.
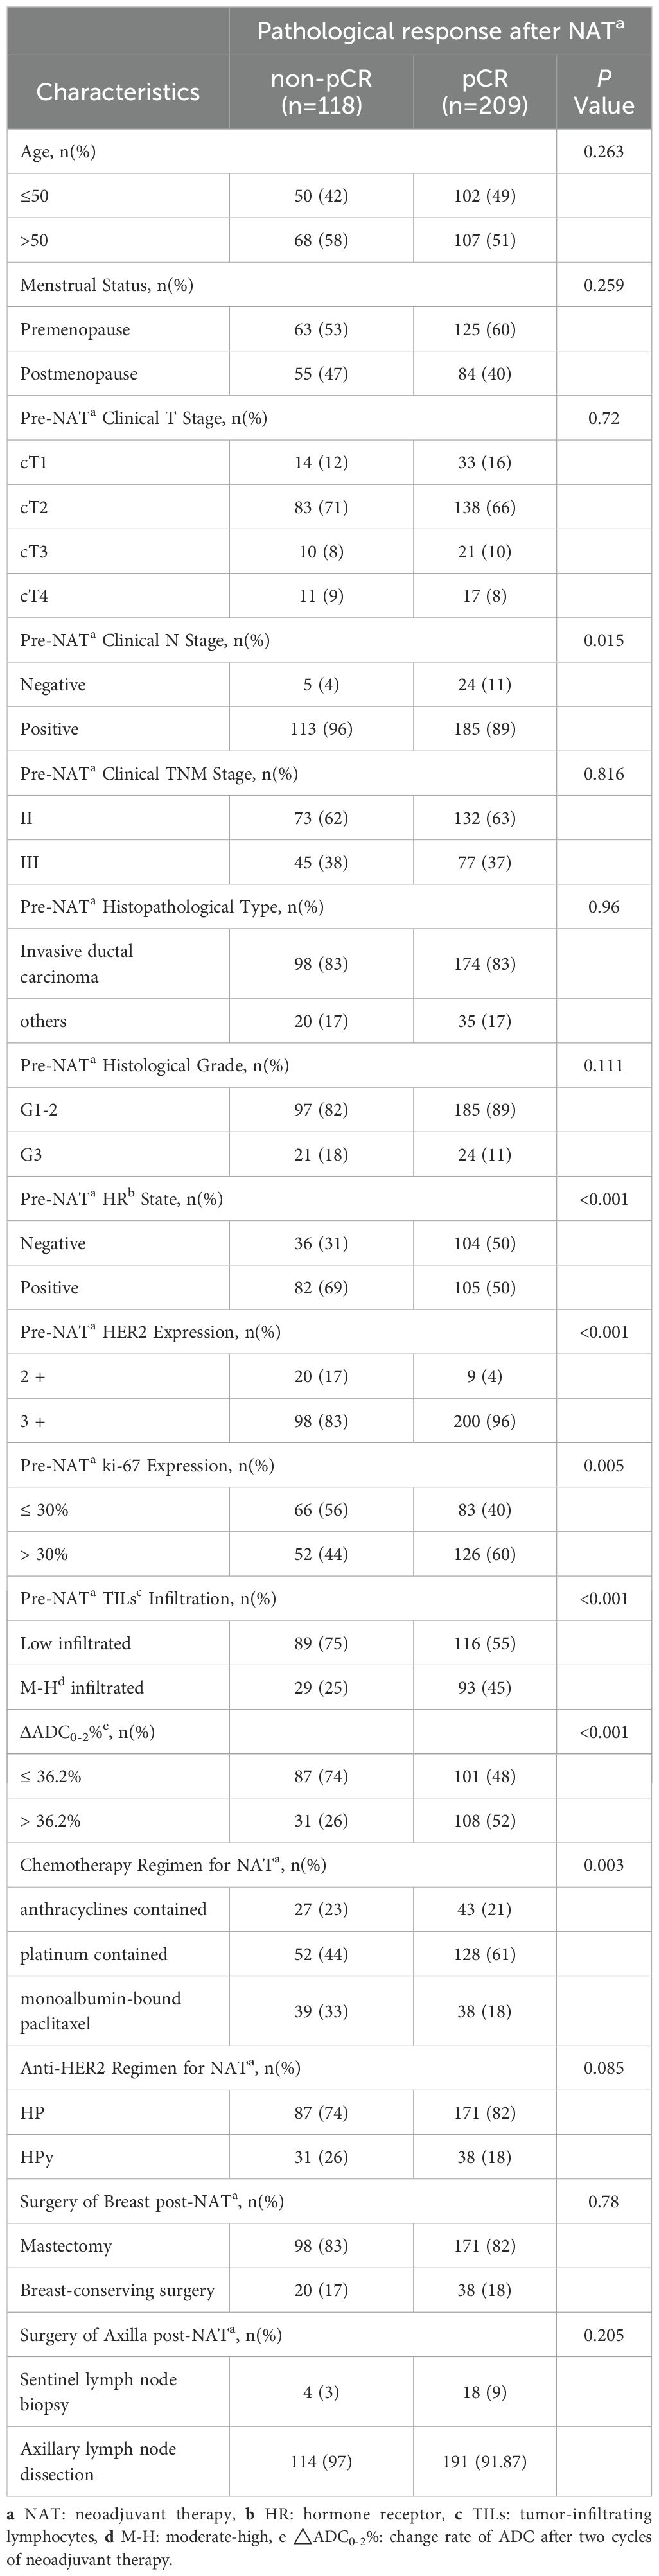
Table 4. Comparison of clinicopathological characteristics between the pCR and non-pCR groups in the overall population.
For patients receiving HP combined with chemotherapy (Table 5), tpCR was more common in those with HR negativity (P = 0.004), high Ki-67 levels (P = 0.003), M-H infiltrated TILs (P = 0.011), ΔADC0-2% > 36.2% (P < 0.001), HER2 3+ (P = 0.008), and the TCb regimen (P = 0.013). For patients receiving HPy plus chemotherapy (Table 6), tpCR was significantly associated with M-H infiltration of TILs (P = 0.008), ΔADC0-2% > 36.2% (P = 0.003), and HER2 3+ (P = 0.007).
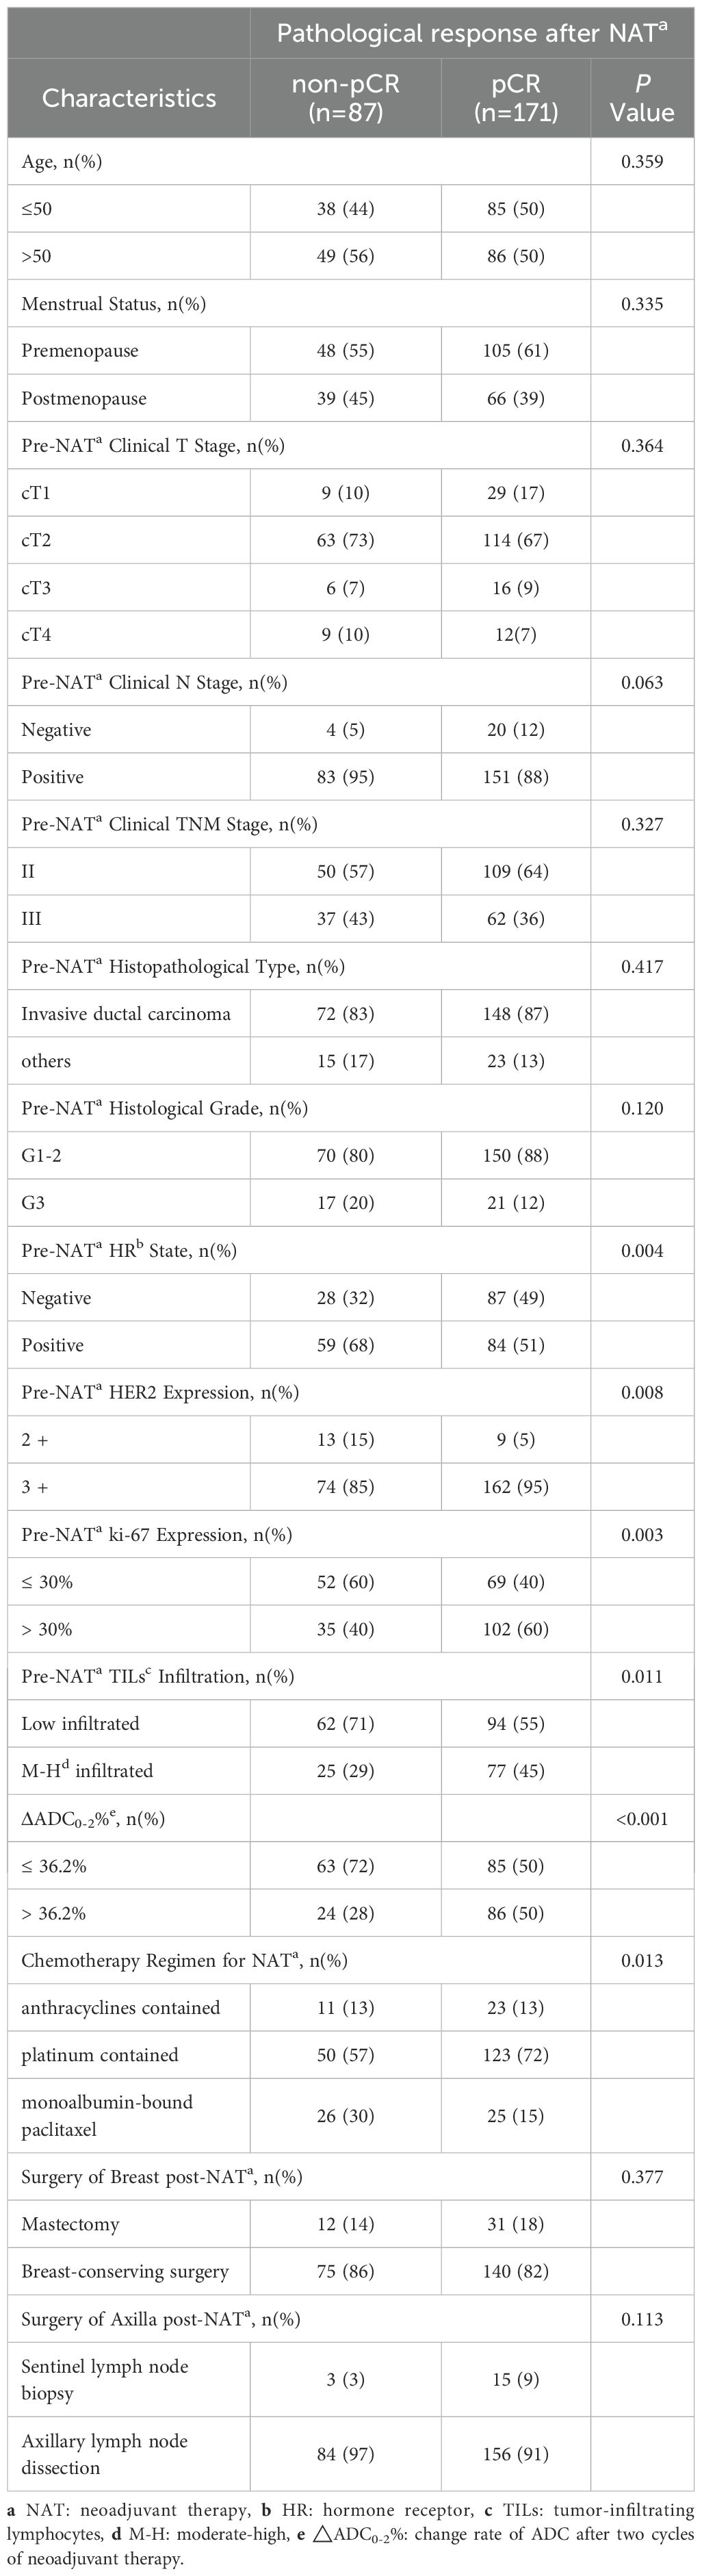
Table 5. Comparison of clinicopathological characteristics between the pCR and non-pCR groups in patients receiving HP plus chemotherapy.
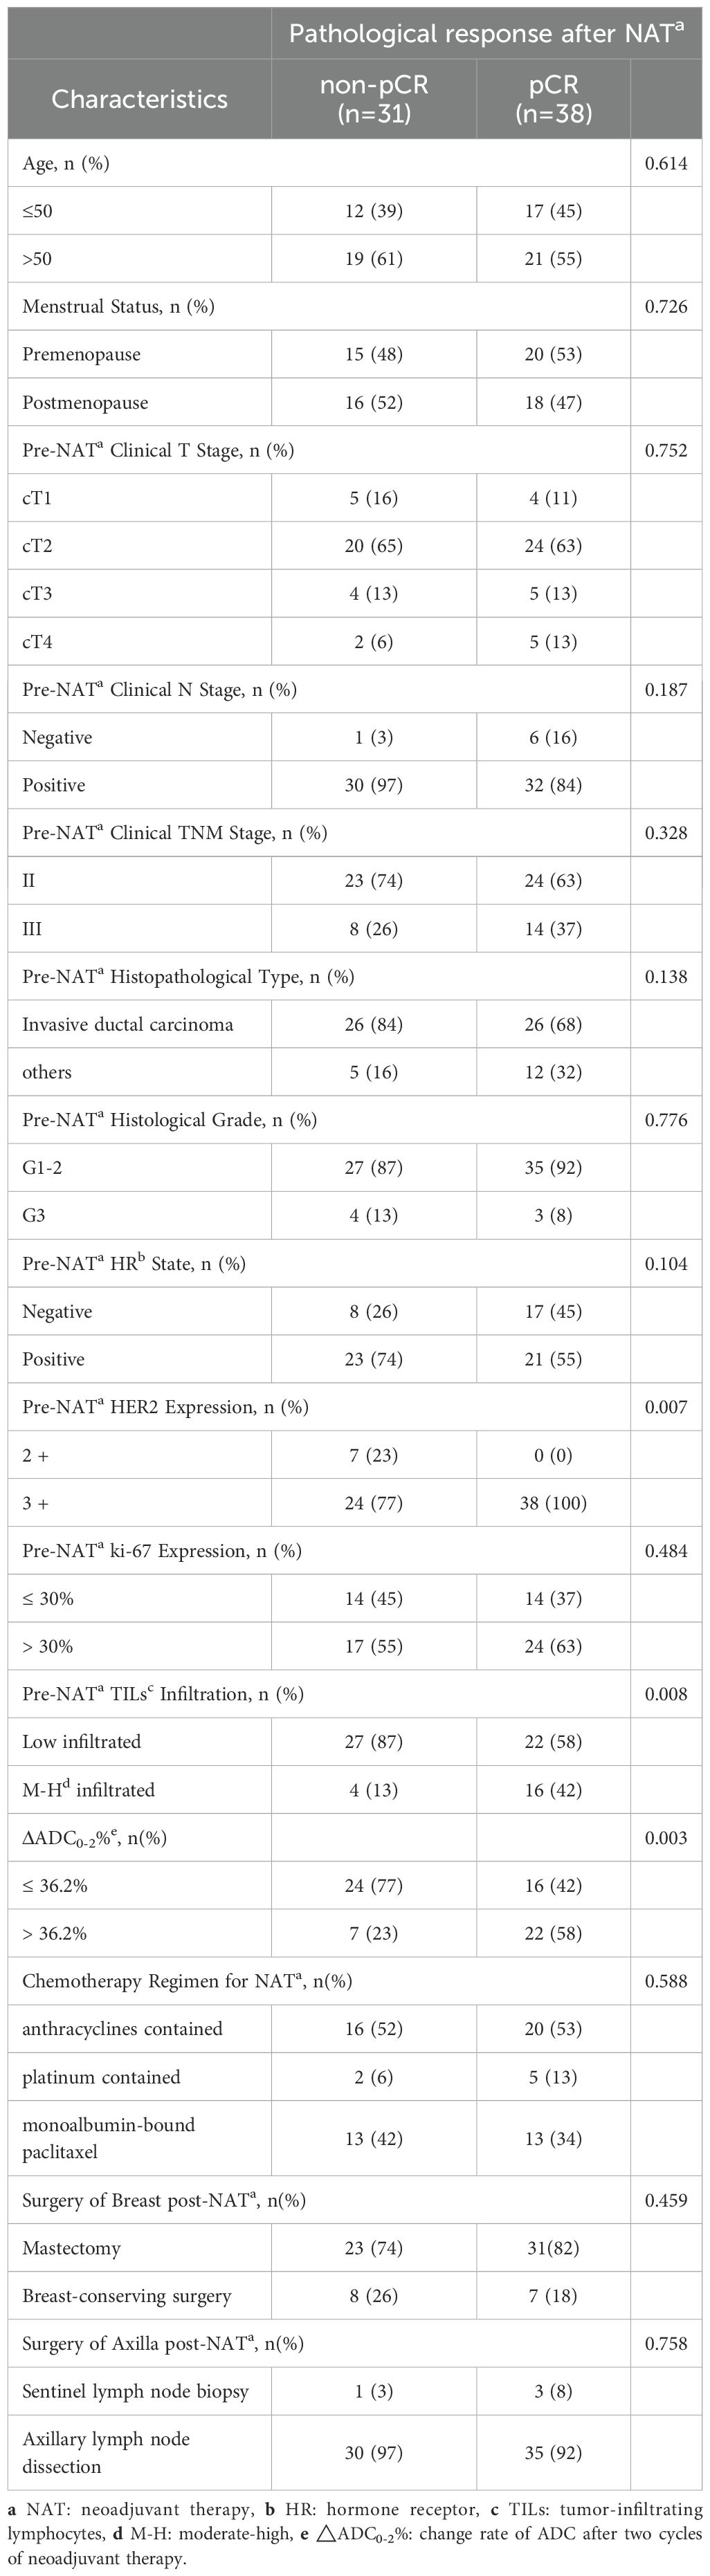
Table 6. Comparison of clinicopathological characteristics between the pCR and non-pCR groups in patients receiving HPy plus chemotherapy.
Multivariate regression analyses of factors affecting tpCR
The multivariate analysis (Table 7) revealed that HR negativity (odds ratio [OR], 2.86; 95% CI: 1.64, 4.99; P < 0.001), HER2 3+ (OR, 4.63; 95% CI: 1.82, 11.79; P = 0.001), high Ki-67 index (OR, 2.52; 95% CI: 1.47, 4.32; P < 0.001), H-M infiltrated TILs (OR, 2.47; 95% CI: 1.38, 4.40; P = 0.002), and ΔADC0-2% > 36.2% (OR, 3.68; 95% CI: 2.10, 6.44; P < 0.001) were independent predictive indicators for tpCR.
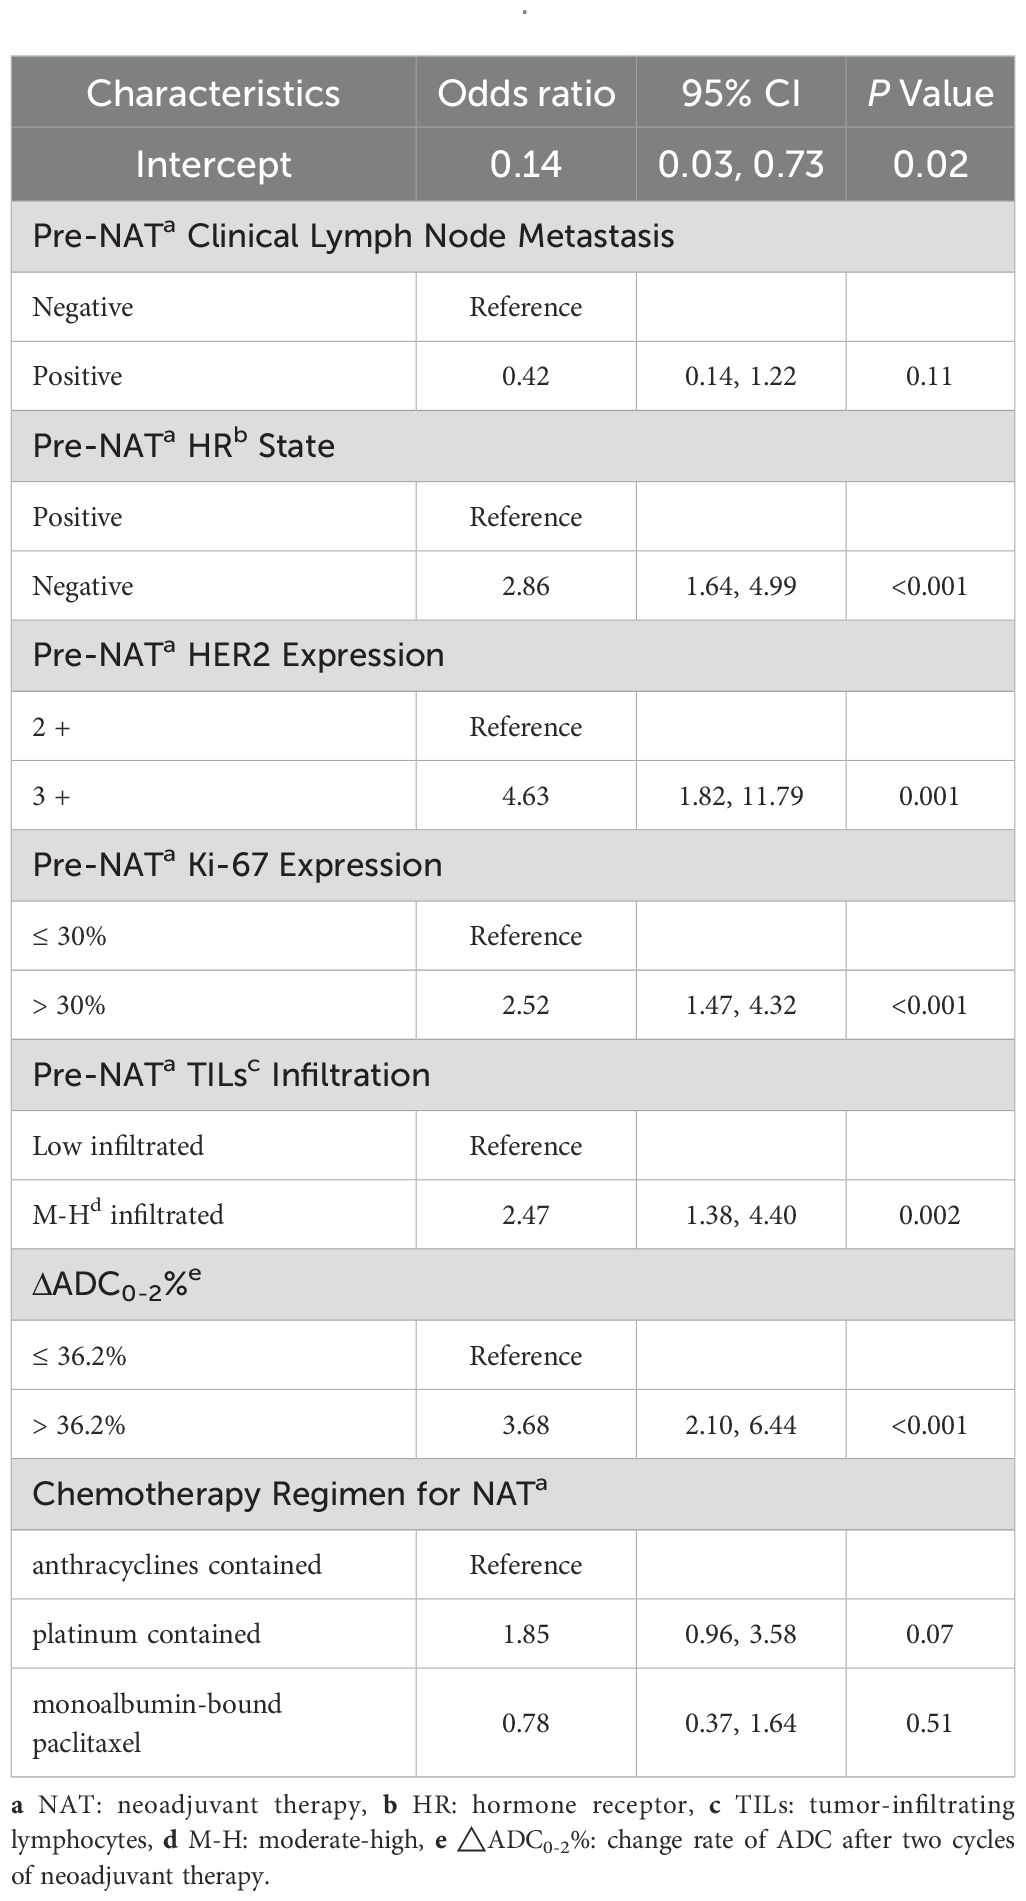
Table 7. Multivariate binary logistic regression analysis of variables for their association with pCR after NATa.
Nomogram development and validation
Based on the aforementioned results, the nomogram was constructed using HR status, HER2 expression, Ki-67 index, TILs infiltration, and ΔADC0-2% as predictors. The corresponding score for each predictor was summed to generate a risk value that reflected the probability of achieving tpCR (Figure 4). The nomogram demonstrated good discrimination capability, as evidenced by ROC curve analysis (Figure 5A), with an AUC of 0.75 [95% CI: 0.69, 0.80] (P = 0.001). Internal validation of the nomogram model was performed using the bootstrap resampling method with 1,000 repetitions, which confirmed its high discriminative ability (AUC: 0.73). Furthermore, the nomogram was compared with individual variables (HR status, HER2 expression, Ki-67 index, TILs infiltration, and ΔADC0-2%), and it showed superior performance (Figure 5B). The calibration curve indicated good calibration performance of the nomogram (χ² = 3.14, df = 8, P = 0.925) (Figure 5C). DCA (Figure 6) further demonstrated the excellent clinical application value of the nomogram model.
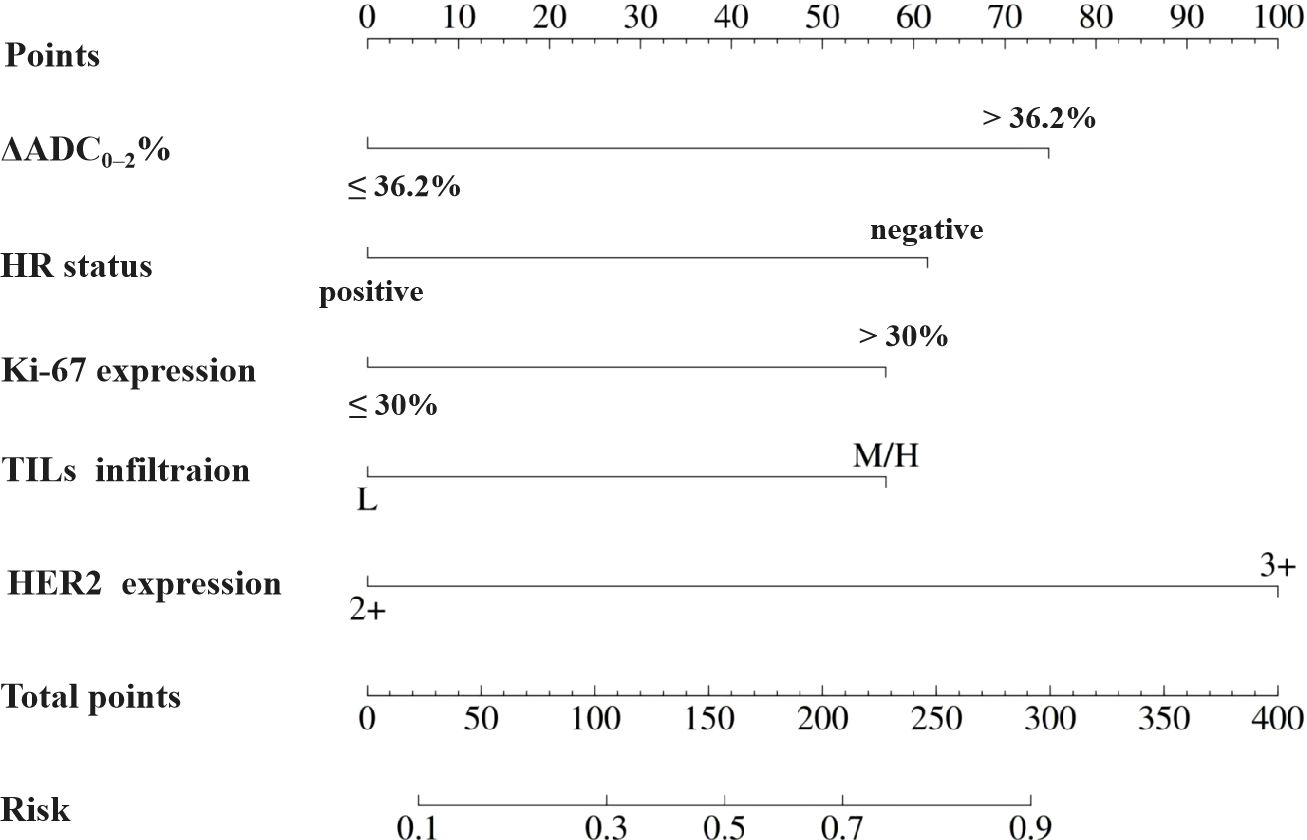
Figure 4. Nomogram for pCR prediction following neoadjuvant therapy in HER2-positive breast cancer.
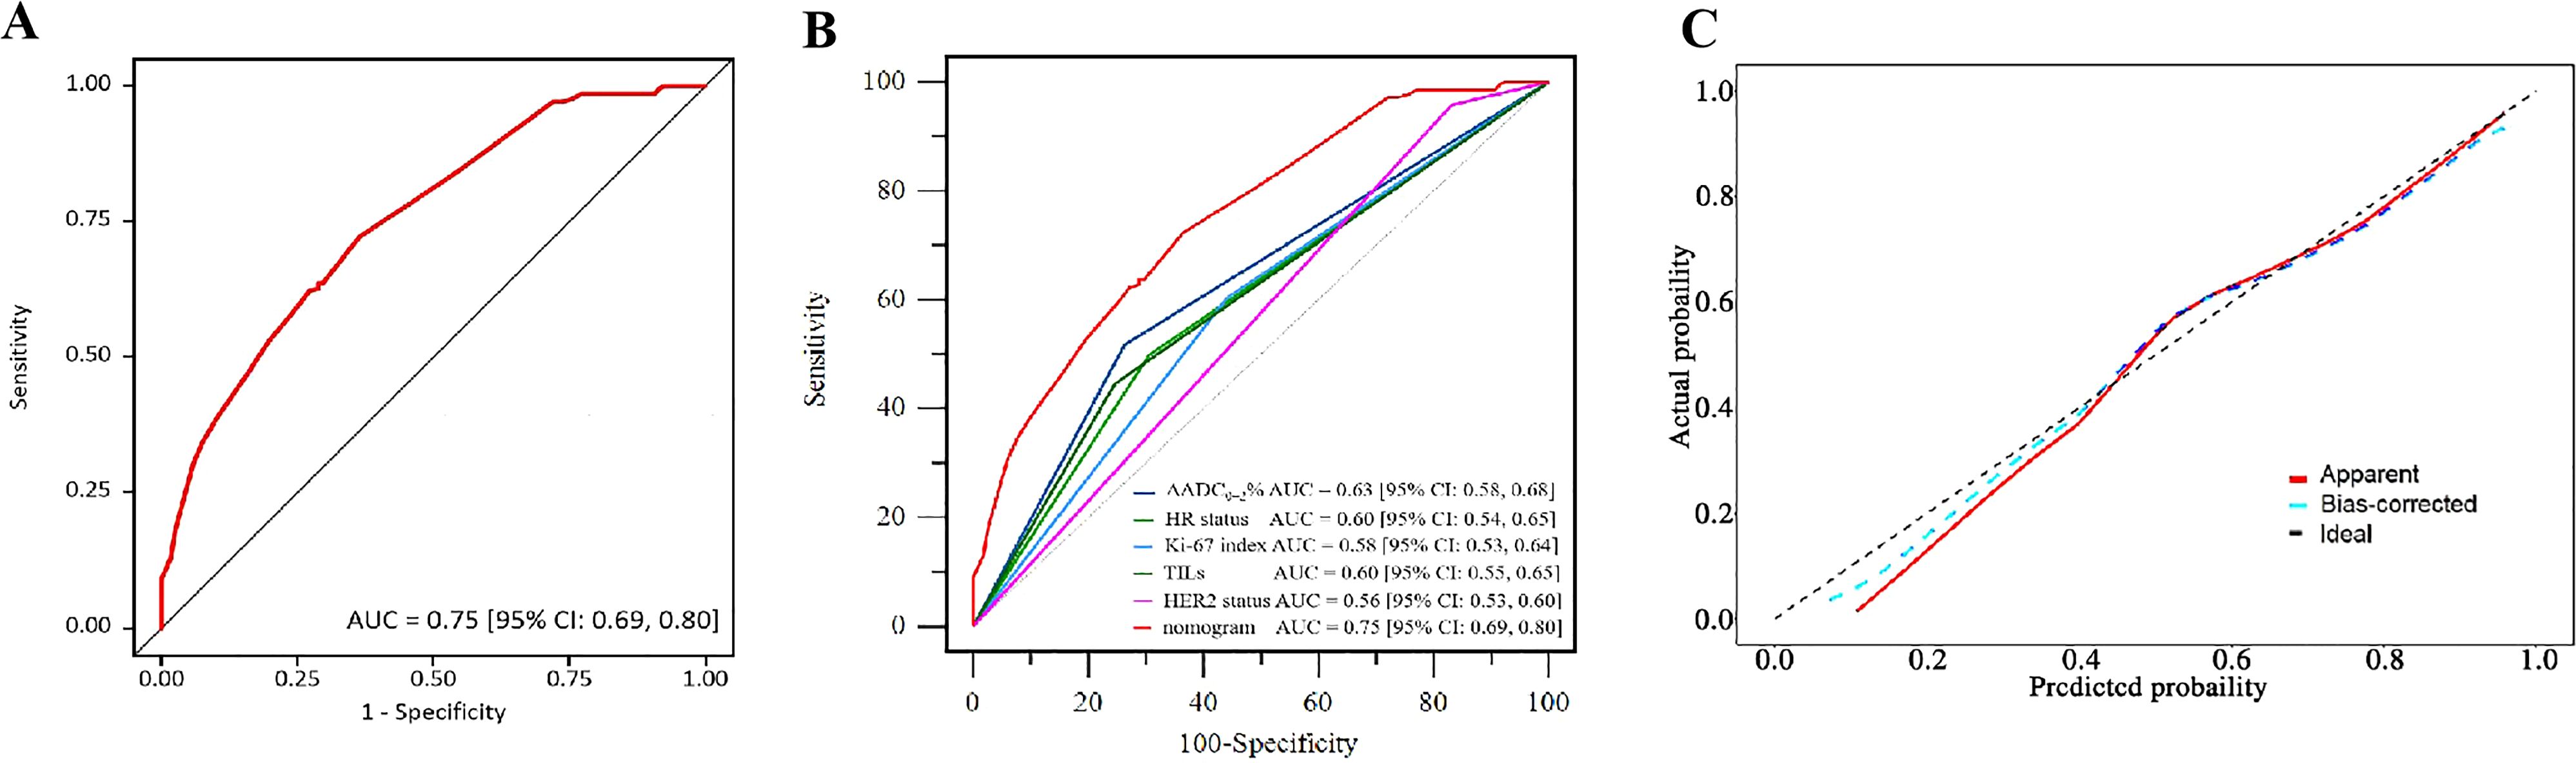
Figure 5. Validation of the nomogram. (A) ROC of the nomogram. (B) ROC of the variables and the nomogram. (C) Calibration plot of the nomogram.
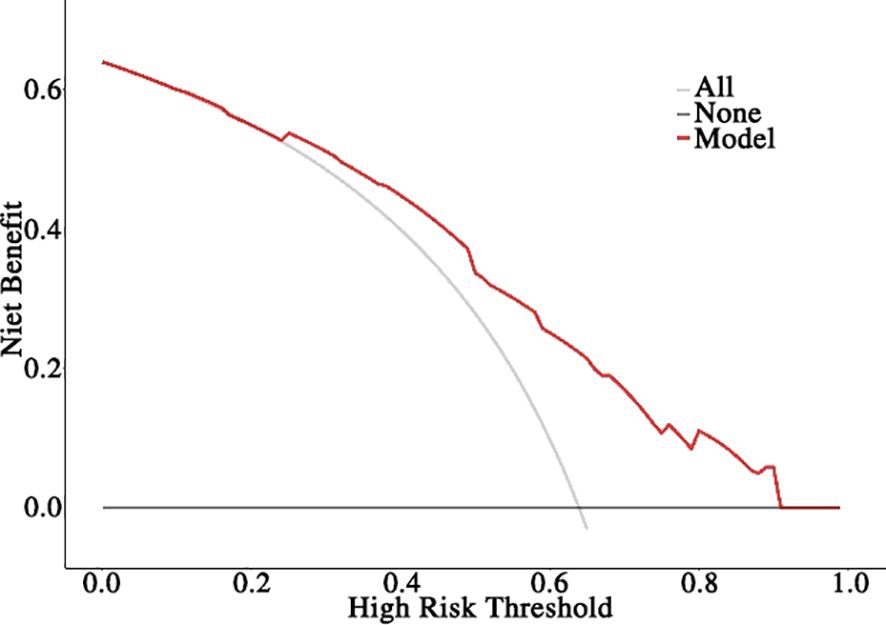
Figure 6. The decision curve analysis (DCA) for the nomogram.
Discussion
This study retrospectively reviewed the pathological remission status of NAT for HER2-positive BC and compared the efficacy of HP and HPy targeted therapies combined with chemotherapy, yielding results similar to those of previous studies (27–30). Through univariate and multivariate regression analyses, HR status, HER2 expression, Ki-67 index, TILs infiltration, and ΔADC0-2% were included to develop a predictive model for tpCR. The model demonstrated excellent performance compared with individual variables and good clinical applicability. The variables included in the nomogram are common and readily available for clinical practice, facilitating its widespread application.
Based on published evidence, HP combined with chemotherapy is the preferred NAT regimen recommended by various guidelines (31, 32). Py, a novel oral irreversible tyrosine kinase inhibitor (TKI) targeting HER1, HER2, and HER4, was initially approved in China for the treatment of HER2-positive advanced or metastatic BC in 2018. By covalently binding to ATP at the intracellular kinase domains, Py inhibits the formation of homodimers and heterodimers as well as the auto-phosphorylation of the HER family. This action blocks the activation of downstream signaling pathways and inhibits the tumor cell cycle at the G1 phase, restricting tumor progression (33, 34). Due to the different mechanisms of action of H and Py, studies have explored their combination efficacy in early (6) and advanced HER2-positive BC (35). The results of the phase 3 PHERDA study indicated that HPy significantly improved the pCR rate compared to H monotherapy combined with chemotherapy (41.0% vs 22%, P < 0.0001) (6), thereby establishing the role of Py in NAT for HER2-positive BC. Currently, several studies have investigated the efficacy and safety of different chemotherapy regimens plus HPy (28–30, 36–41). Studies exploring TCb plus HPy demonstrated tpCR rates of 52%-73% (30, 36–38, 41). Other studies revealed that the tpCR rate for AC-T combined with HPy ranged from 63% to 73% (28, 29, 39, 41). Zhong et al. (40) reported that a T+H (weekly) plus Py regimen achieved a tpCR of 57.1%. A multicenter retrospective study involving 107 patients compared the efficacy of 4*T, 6*TCb/4*P (cisplatin), and 4*AC-4*T plus HP, suggesting that long-cycle taxane and platinum-containing regimens had higher tpCR and bpCR rates (42). In this study, the pCR rates for AC-T/TA, TCb, and T in combination with HPy (excluding patients without ADC values after 2 cycles of NAT) were 56% (20/36), 71% (5/7), and 50% (13/26), respectively, which were consistent with previous studies. However, due to the lack of large-scale, prospective, high-quality randomized controlled clinical trials (RCTs), the optimal chemotherapy regimen to be combined with HPy has not yet been determined. Considering patients’ age, general condition, comorbidities, and the prominent adverse reaction of diarrhea associated with Py, tailored therapy should be considered.
Although both HP and HPy are currently optional anti-HER2 targeted combinations for HER2-positive BC, there is no definitive conclusion on which regimen is superior due to the lack of prospective, randomized head-to-head comparisons between them. A retrospective study compared the efficacy of the two targeted therapies combined with TCb (41), suggesting that the pCR rates were comparable (TCb+HPy: 55.6%, TCb+HP: 56.6%). Further subgroup analyses confirmed that there was no difference in pCR rates between the two targeted combinations regardless of HR status and HER2 expression. A meta-analysis incorporating nine studies with a total of 1,745 patients also reached a similar conclusion (43). In our study, the efficacy of HP and HPy was evaluated. PSM was performed to account for confounding factors such as gender, age, and histological grade. After PSM, there was no statistically significant difference in pCR rates between the two regimens, indicating comparable efficacy. Since this was a retrospective study, AEs could not be fully collected, and the safety of the two combinations was not compared. Given that the prominent AE of Py is diarrhea, while the addition of P to H does not add extra AEs, the general condition of the patient, comorbidities, economic status, drug availability, and patient preference should be considered when selecting an appropriate combined regimen.
Previous studies have employed clinical and pathological parameters similar to those used in our study to construct predictive models. For instance, Yang et al. (44) utilized ER and PR expression, Ki-67 index, and HER2 status to build a predictive model for HER2-positive BC. The AUC was 0.73, and further validation demonstrated good discrimination and calibration. Similarly, Fujii T et al. (45) incorporated IHC biomarkers (ER, PR, and HER2 expression), clinical manifestation (inflammatory breast cancer [IBC] vs. non-IBC), and NAT regimen. However, this model was less discriminative (C-index: 0.69) and lacked determination of clinical usefulness. Compared to IHC biomarkers and NAT regimens, MRI image characteristics can more objectively and precisely reflect the nature and changes of lesions. Therefore, MRI parameters should be recommended for inclusion in predictive model development.
Several studies have utilized a wide variety of MRI parameters to construct models to forecast pCR following NAT. For example, Li et al. (46) developed a predictive model for HER2-positive BC that integrated radiomics based on contrast-enhanced MRI (CE-MRI), which showed good calibration, discrimination, and superior clinical usefulness. van der Voort A et al. (47) applied DWI combined with DCE-MRI but found no added value in identifying pCR for early HER2-positive BC. Kim SY et al. (48) introduced multiple indicators, including pre-NAT characteristics (tumor size, lesion type, rim enhancement, and peritumoral edema) and post-NAT characteristics (tumor size, lesion-to-background parenchymal signal enhancement ratio [SER]). Although the integration of various indices can enhance model performance, it involves a significant workload and is inconvenient for clinicians to apply in routine clinical practice.
The ADC value is commonly used to evaluate the response to NAT. Moreover, increases in ADC value during NAT have been shown to be more valuable than changes in tumor size or volume after treatment (49). Previous studies have investigated the association between ADC value and pCR, but the conclusions have been contradictory. For example, some studies (24, 50, 51) suggested that a low pretreatment ADC value is more likely to achieve pCR, while others (21, 47, 52, 53) did not identify a significant association between pCR and pretreatment ADC values. Two factors may contribute to these conflicting results: First, the lack of standardization of ADC values regarding scanner technology, equipment, and imaging sequences/protocols (54), which leads to diverse ADC values; Second, pretreatment ADC values vary across different molecular subtypes of BC (24). Therefore, the change rate of ADC values after NAT may be a preferable alternative.
Consequently, in this study, we utilized the change rate of ADC values during NAT. However, a key question remains: Which time point of the change rate should be used? Currently, there is no consensus on this issue (12, 21, 51, 55). Evidence suggests that the change rate of ADC value after two cycles of NAT is more indicative of pCR (9, 55). In this study, we also investigated the ADC value change rate following two cycles (ΔADC0-2%) of treatment and determined the optimal cutoff for pCR to be 36.2%. However, Lu et al. (12) demonstrated that only an ADC value change below 15% was related to pCR (OR = 9.865, 95% CI 1.024–95.021). The different cutoff values may result from disparate study cohorts, as treatment response varies with underlying molecular subtypes and tumor biology (21). This highlights the importance of constructing predictive models specific to various molecular subtypes. Additionally, our cutoff value of ΔADC0-2% is higher than that reported in a previous study (12), which may be attributed to the higher rate of pCR observed in our cohort.
This study has several limitations. Firstly, it was a retrospective, single-center study, which is susceptible to selection bias. Secondly, the limited sample size of patients receiving the HPy regimen may reduce the persuasiveness of the comparison between HPy and HP. Thirdly, given that the collection of AEs in retrospective studies may be incomplete, no summary or comparison of AEs was performed. Fourthly, external validation based on data from other institutions was not conducted; thus, verifying the performance of our nomogram through external validation is essential. And lastly, we only selected the rate of change in ADC values after two cycles of NAT, future work should analyze more time points.
Conclusions
In conclusion, this study retrospectively reviewed the efficacy of NAT in patients with HER2-positive BC from a single center, comparing the pathological response of the combinations of HP or HPy with chemotherapy. A nomogram integrating the early change rate of ADC values and clinicopathological variables was developed to predict pCR, demonstrating good performance and clinical utility. Further head-to-head randomized clinical trials are needed to confirm the benefits and risks of HP and HPy plus chemotherapy. Additionally, external validation studies should be conducted to validate our nomogram model.
Data availability statement
The original contributions presented in the study are included in the article/supplementary material. Further inquiries can be directed to the corresponding author.
Ethics statement
The studies involving humans were approved by The Fourth Hospital of Hebei Medical University. The studies were conducted in accordance with the local legislation and institutional requirements. Written informed consent for participation was not required from the participants or the participants’ legal guardians/next of kin in accordance with the national legislation and institutional requirements.
Author contributions
HW: Investigation, Methodology, Writing – review & editing, Formal Analysis, Writing – original draft. SG: Investigation, Formal Analysis, Writing – original draft. ZB: Formal Analysis, Data curation, Writing – original draft. LW: Methodology, Writing – original draft, Resources. CG: Supervision, Writing – review & editing, Validation.
Funding
The author(s) declare that no financial support was received for the research, and/or publication of this article.
Conflict of interest
The authors declare that the research was conducted in the absence of any commercial or financial relationships that could be construed as a potential conflict of interest.
Generative AI statement
The author(s) declare that no Generative AI was used in the creation of this manuscript.
Any alternative text (alt text) provided alongside figures in this article has been generated by Frontiers with the support of artificial intelligence and reasonable efforts have been made to ensure accuracy, including review by the authors wherever possible. If you identify any issues, please contact us.
Publisher’s note
All claims expressed in this article are solely those of the authors and do not necessarily represent those of their affiliated organizations, or those of the publisher, the editors and the reviewers. Any product that may be evaluated in this article, or claim that may be made by its manufacturer, is not guaranteed or endorsed by the publisher.
References
1. Schlam I and Swain SM. HER2-positive breast cancer and tyrosine kinase inhibitors: the time is now. NPJ Breast Cancer. (2021) 7:56. doi: 10.1038/s41523-021-00265-1
2. Korde LA, Somerfield MR, Carey LA, Crews JR, Denduluri N, Hwang ES, et al. Neoadjuvant chemotherapy, endocrine therapy, and targeted therapy for breast cancer: ASCO guideline. J Clin Oncol. (2021) 39:1485–505. doi: 10.1200/JCO.20.03399
3. Pusztai L, Foldi J, Dhawan A, Digiovanna MP, and Mamounas EP. Changing frameworks in treatment sequencing of triple-negative and HER2-positive, early-stage breast cancers. Lancet Oncol. (2019) 20:e390–6. doi: 10.1016/S1470-2045(19)30158-5
4. Gianni L, Pienkowski T, Im YH, Tseng LM, Liu MC, Lluch A, et al. 5-year analysis of neoadjuvant pertuzumab and trastuzumab in patients with locally advanced, inflammatory, or early-stage HER2-positive breast cancer (NeoSphere): a multicentre, open-label, phase 2 randomised trial. Lancet Oncol. (2016) 17:791–800. doi: 10.1016/S1470-2045(16)00163-7
5. Huang L, Pang D, Yang H, Li W, Wang S, Cui S, et al. Neoadjuvant–adjuvant pertuzumab in HER2-positive early breast cancer: final analysis of the randomized phase III PEONY trial. Nat Commun. (2024) 15:2153. doi: 10.1038/s41467-024-45591-7
6. Wu J, Jiang Z, Liu Z, Yang B, Yang H, Tang J, et al. Neoadjuvant pyrotinib, trastuzumab, and docetaxel for HER2-positive breast cancer (PHEDRA): a double-blind, randomized phase 3 trial. BMC Med. (2022) 20:498. doi: 10.1186/s12916-022-02708-3
7. Cortazar P, Zhang L, Untch M, Mehta K, Costantino JP, Wolmark N, et al. Pathological complete response and long-term clinical benefit in breast cancer: the CTNeoBC pooled analysis. Lancet. (2014) 384:164–72. doi: 10.1016/s0140-6736(13)62422-8
8. Cai L, Sidey-Gibbons C, Nees J, Riedel F, Schäfgen B, Togawa R, et al. Can multi-modal radiomics using pretreatment ultrasound and tomosynthesis predict response to neoadjuvant systemic treatment in breast cancer? Eur Radiol. (2024) 34:2560–73. doi: 10.1007/s00330-023-10238-6
9. Chen X, Chen X, Yang J, Li Y, Fan W, and Yang Z. Combining dynamic contrast-enhanced magnetic resonance imaging and apparent diffusion coefficient maps for a radiomics nomogram to predict pathological complete response to neoadjuvant chemotherapy in breast cancer patients. J Comput Assist Tomogr. (2020) 44:275–83. doi: 10.1097/RCT.0000000000000978
10. Sutton EJ, Onishi N, Fehr DA, Dashevsky BZ, Sadinski M, Pinker K, et al. A machine learning model that classifies breast cancer pathologic complete response on MRI post-neoadjuvant chemotherapy. Breast Cancer Res. (2020) 22:1–11. doi: 10.1186/s13058-020-01291-w
11. Bian T, Wu Z, Lin Q, Wang H, Ge Y, Duan S, et al. Radiomic signatures derived from multiparametric MRI for the pretreatment prediction of response to neoadjuvant chemotherapy in breast cancer. Br J Radiol. (2020) 93:20200287. doi: 10.1259/bjr.20200287
12. Lu N, Dong J, Fang X, Wang L, Jia W, Zhou Q, et al. Predicting pathologic response to neoadjuvant chemotherapy in patients with locally advanced breast cancer using multiparametric MRI. BMC Med Imaging. (2021) 21:155. doi: 10.1186/s12880-021-00688-z
13. Fowler AM, Mankoff DA, and Joe BN. Imaging neoadjuvant therapy response in breast cancer. Radiology. (2017) 285:358–75. doi: 10.1148/radiol.2017170180
14. Hayward JH, Linden OE, Lewin AA, Weinstein SP, Bachorik AE, Balija TM, et al. ACR appropriateness criteria® monitoring response to neoadjuvant systemic therapy for breast cancer: 2022 update. J Am Coll Radiol. (2023) 20:S125–45. doi: 10.1016/j.jacr.2023.02.016
15. Mann RM, Balleyguier C, Baltzer PA, Bick U, Colin C, Cornford E, et al. Breast MRI: EUSOBI recommendations for women’s information. Eur Radiol. (2015) 25:3669–78. doi: 10.1007/s00330-015-3807-z
16. Gradishar WJ, Moran MS, Abraham J, Aft R, Agnese D, Allison KH, et al. Breast cancer, version 3.2022, NCCN clinical practice guidelines in oncology. J Natl Compr Canc Netw. (2022) 20:691–722. doi: 10.6004/jnccn.2022.0030
17. Surov A, Meyer HJ, and Wienke A. Can apparent diffusion coefficient (ADC) distinguish breast cancer from benign breast findings? A meta-analysis based on 13–847 lesions. BMC Cancer. (2019) 19:1–14. doi: 10.1186/s12885-019-6201-4
18. Clauser P, Krug B, Bickel H, Dietzel M, Pinker K, Neuhaus VF, et al. Diffusion-weighted imaging allows for downgrading MR BI-RADS 4 lesions in contrast-enhanced MRI of the breast to avoid unnecessary biopsy. Clin Cancer Res. (2021) 27:1941–8. doi: 10.1158/1078-0432.CCR-20-3037
19. Li XR, Cheng LQ, Liu M, Zhang YJ, Wang JD, Zhang AL, et al. DW-MRI ADC values can predict treatment response in patients with locally advanced breast cancer undergoing neoadjuvant chemotherapy. Med Oncol. (2012) 29:425–31. doi: 10.1007/s12032-011-9842-y
20. Reig B, Heacock L, Lewin A, Cho N, and Moy L. Role of MRI to assess response to neoadjuvant therapy for breast cancer. J Magn Reson Imaging. (2020) 52:1587. doi: 10.1002/jmri.27145
21. Partridge SC, Zhang Z, Newitt DC, Gibbs JE, Chenevert TL, Rosen MA, et al. Diffusion-weighted MRI findings predict pathologic response in neoadjuvant treatment of breast cancer: the ACRIN 6698 multicenter trial. Radiology. (2018) 289:618–27. doi: 10.1148/radiol.2018180273
22. Surov A, Meyer HJ, and Wienke A. Correlation between apparent diffusion coefficient (ADC) and cellularity is different in several tumors: a meta-analysis. Oncotarget. (2017) 8:59492. doi: 10.18632/oncotarget.17752
23. Durando M, Gennaro L, Cho GY, Giri DD, Gnanasigamani MM, Patil S, et al. Quantitative apparent diffusion coefficient measurement obtained by 3.0 Tesla MRI as a potential noninvasive marker of tumor aggressiveness in breast cancer. Eur J Radiol. (2016) 85:1651–8. doi: 10.1016/j.ejrad.2016.06.019
24. Surov A, Pech M, Meyer HJ, Bitencourt AG, Fujimoto H, Baxter GC, et al. Evaluation of pretreatment ADC values as predictors of treatment response to neoadjuvant chemotherapy in patients with breast cancer-a multicenter study. Cancer Imaging. (2022) 22:68. doi: 10.1186/s40644-022-00501-2
25. Allison KH, Hammond MEH, Dowsett M, McKernin SE, Carey LA, Fitzgibbons PL, et al. Estrogen and progesterone receptor testing in breast cancer: ASCO/CAP guideline update. J Clin Oncol. (2020) 38:1346–66. doi: 10.1200/JCO.19.02309
26. Denkert C, Von Minckwitz G, Darb-Esfahani S, Lederer B, Heppner BI, Weber KE, et al. Tumour-infiltrating lymphocytes and prognosis in different subtypes of breast cancer: a pooled analysis of 3771 patients treated with neoadjuvant therapy. Lancet Oncol. (2018) 19:40–50. doi: 10.1016/S1470-2045(17)30904-X
27. Van Ramshorst MS, van der Voort A, Van Werkhoven ED, Mandjes IA, Kemper I, Dezentjé VO, et al. Neoadjuvant chemotherapy with or without anthracyclines in the presence of dual HER2 blockade for HER2-positive breast cancer (TRAIN-2): a multicentre, open-label, randomised, phase 3 trial. Lancet Oncol. (2018) 19:1630–40. doi: 10.1016/S1470-2045(18)30570-9
28. Liu L, Zhu M, Wang Y, Li M, and Gu Y. Neoadjuvant pyrotinib plus trastuzumab and chemotherapy for HER2-positive breast cancer: a prospective cohort study. World J Surg Oncol. (2023) 21:389. doi: 10.1186/s12957-023-03266-5
29. Shi Q, Qi X, Tang P, Fan L, Chen L, Wang S, et al. A multicenter single-arm trial of neoadjuvant pyrotinib and trastuzumab plus chemotherapy for HER2-positive breast cancer. MedComm. (2023) 4:e435. doi: 10.1002/mco2.435
30. Ding Y, Mo W, Xie X, Wang O, He X, Zhao S, et al. Neoadjuvant pyrotinib plus trastuzumab, docetaxel, and carboplatin in early or locally advanced human epidermal receptor 2-positive breast cancer in China: A multicenter, randomized, double-blind, placebo-controlled phase 2 trial. Oncol Res Treat. (2023) 46:303–11. doi: 10.1159/000531492
31. Gradishar WJ, Moran MS, Abraham J, Abramson V, Aft R, Agnese D, et al. Breast cancer, version 3.2024, NCCN clinical practice guidelines in oncology. J Natl Compr Canc Netw. (2024) 22:331–57. doi: 10.6004/jnccn.2024.0035
32. Li J, Hao C, Wang K, Zhang J, Chen J, Liu Y, et al. Chinese society of clinical oncology (CSCO) breast cancer guidelines 2024. Transl Breast Cancer Res. (2024) 5:18. doi: 10.21037/tbcr-24-31
33. Blair HA. Pyrotinib: first global approval. Drugs. (2018) 78:1751–5. doi: 10.1007/s40265-018-0997-0
34. Li X, Yang C, Wan H, Zhang G, Feng J, Zhang L, et al. Discovery and development of pyrotinib: a novel irreversible EGFR/HER2 dual tyrosine kinase inhibitor with favorable safety profiles for the treatment of breast cancer. Eur J Pharm Sci. (2017) 110:51–61. doi: 10.1016/j.ejps.2017.01.021
35. Ma F, Yan M, Li W, Ouyang Q, Tong Z, Teng Y, et al. Pyrotinib versus placebo in combination with trastuzumab and docetaxel as first line treatment in patients with HER2 positive metastatic breast cancer (PHILA): randomised, double blind, multicentre, phase 3 trial. BMJ. (2023) 383:e076065. doi: 10.1136/bmj-2023-076065
36. Yin W, Wang Y, Wu Z, Ye Y, Zhou L, Xu S, et al. Neoadjuvant trastuzumab and pyrotinib for locally advanced HER2-positive breast cancer (NeoATP): primary analysis of a phase II study. Clin Cancer Res. (2022) 28:3677–85. doi: 10.1158/1078-0432.CCR-22-0446
37. Chen Y, Zhang T, Zhang R, and Cao X. Pyrotinib and trastuzumab plus chemotherapy serve as an acceptable neoadjuvant regimen exhibiting good efficacy and tolerance in HER2-positive breast cancer patients. Cancer Biother Radiopharm. (2024) 39:435–40. doi: 10.1089/cbr.2023.0175
38. Liu Z, Wang C, Chen X, Zhu J, Sun X, Xia Q, et al. Pathological response and predictive role of tumour-infiltrating lymphocytes in HER2-positive early breast cancer treated with neoadjuvant pyrotinib plus trastuzumab and chemotherapy (Panphila): a multicentre phase 2 trial. Eur J Cancer. (2022) 165:157–68. doi: 10.1016/j.ejca.2022.01.022
39. Xuhong J, Qi X, Tang P, Fan L, Chen L, Zhang F, et al. Neoadjuvant pyrotinib plus trastuzumab and chemotherapy for stage I-III HER2-positive breast cancer: A phase II clinical trial. Oncologist. (2020) 25:e1909–20. doi: 10.1002/onco.13546
40. Zhong X, He P, Chen J, Yan X, Wei B, Zhang Z, et al. Neoadjuvant pyrotinib plus trastuzumab and nab-paclitaxel for HER2-positive early or locally advanced breast cancer: an exploratory phase II trial. Gland Surg. (2022) 11:216. doi: 10.21037/gs-21-911
41. Zhu J, Jiao D, Wang C, Lu Z, Chen X, Li L, et al. Neoadjuvant efficacy of three targeted therapy strategies for HER2-positive breast cancer based on the same chemotherapy regimen. Cancers (Basel). (2022) 14:4508. doi: 10.3390/cancers14184508
42. Wang S, Jin Z, Li Z, Zhu G, Liu B, Zhang D, et al. An exploration of the optimal combination chemotherapy regimen based on neoadjuvant therapy containing pyrotinib for HER2-positive breast cancer: A multicenter real-world study. Transl Oncol. (2025) 51:102173. doi: 10.1016/j.tranon.2024.102173
43. Yuan Y, Liu X, Xu G, Zhang J, Chen L, and Long X. Comparative efficacy and safety of pyrotinib plus trastuzumab versus trastuzumab plus pertuzumab and trastuzumab monotherapy in neoadjuvant treatment of HER2-positive breast cancer: A systematic review and meta-analysis. Cancer Treat Rev. (2025) 134:102901. doi: 10.1016/j.ctrv.2025.102901
44. Yang ZJ, Xin F, Chen ZJ, Yu Y, Wang X, and Cao XC. Real-world data on neoadjuvant chemotherapy with dual-anti HER2 therapy in HER2 positive breast cancer. BMC Cancer. (2024) 24:134. doi: 10.1186/s12885-024-11871-0
45. Fujii T, Kogawa T, Wu J, Sahin AA, Liu DD, Chavez-Macgregor M, et al. Nomogram to predict pathologic complete response in HER2-positive breast cancer treated with neoadjuvant systemic therapy. Brit J Cancer. (2017) 116:509–14. doi: 10.1038/bjc.2016.444
46. Li Q, Huang Y, Xiao Q, Duan S, Wang S, Li J, et al. Value of radiomics based on CE-MRI for predicting the efficacy of neoadjuvant chemotherapy in invasive breast cancer. Br J Radiol. (2022) 95:20220186. doi: 10.1259/bjr.20220186
47. Van Der Voort A, van der Hoogt KJ, Wessels R, Schipper RJ, Wesseling J, Sonke GS, et al. Diffusion-weighted imaging in addition to contrast-enhanced MRI in identifying complete response in HER2-positive breast cancer. Eur Radiol. (2024) 34:7994–8004. doi: 10.1007/s00330-024-10857-7
48. Kim SY, Cho N, Choi Y, Lee SH, Ha SM, Kim ES, et al. Factors affecting pathologic complete response following neoadjuvant chemotherapy in breast cancer: development and validation of a predictive nomogram. Radiology. (2021) 299:290–300. doi: 10.1148/radiol.2021203871
49. Pereira NP, Curi C, Osório CA, Marques EF, Makdissi FB, Pinker K, et al. Diffusion-weighted magnetic resonance imaging of patients with breast cancer following neoadjuvant chemotherapy provides early prediction of pathological response-a prospective study. Sci Rep. (2019) 9:16372. doi: 10.1038/s41598-019-52785-3
50. Bedair R, Priest AN, Patterson AJ, McLean MA, Graves MJ, Manavaki R, et al. Assessment of early treatment response to neoadjuvant chemotherapy in breast cancer using non-mono-exponential diffusion models: a feasibility study comparing the baseline and mid-treatment MRI examinations. Eur Radiol. (2017) 27:2726–36. doi: 10.1007/s00330-016-4630-x
51. Liu S, Ren R, Chen Z, Wang Y, Fan T, Li C, et al. Diffusion-weighted imaging in assessing pathological response of tumor in breast cancer subtype to neoadjuvant chemotherapy. J Magn Reson Imaging. (2015) 42:779–87. doi: 10.1002/jmri.24843C
52. Surov A, Wienke A, and Meyer HJ. Pretreatment apparent diffusion coefficient does not predict therapy response to neoadjuvant chemotherapy in breast cancer. Breast. (2020) 53:59–67. doi: 10.1016/j.breast.2020.06.001
53. Bufi E, Belli P, Costantini M, Cipriani A, Di Matteo M, Bonatesta A, et al. Role of the apparent diffusion coefficient in the prediction of response to neoadjuvant chemotherapy in patients with locally advanced breast cancer. Clin Breast Cancer. (2015) 15:370–80. doi: 10.1016/j.clbc.2015.02.002
54. Baltzer P, Mann RM, Iima M, Sigmund EE, Clauser P, Gilbert FJ, et al. Diffusion-weighted imaging of the breast—a consensus and mission statement from the EUSOBI International Breast Diffusion-Weighted Imaging working group. Eur Radiol. (2020) 30:1436–50. doi: 10.1007/s00330-019-06510-3
Keywords: real world, HER2-positive breast cancer, neoadjuvant therapy, different anti-HER2 targeted therapies, pathological complete response, nomogram
Citation: Wang H, Gao S, Bai Z, Wang L and Geng C (2025) Assessment of the efficacy of various neoadjuvant anti-HER2 targeted therapies combined with chemotherapy for HER2-positive breast cancer in the real-world setting and development of a predictive model for pathological complete response. Front. Oncol. 15:1673810. doi: 10.3389/fonc.2025.1673810
Received: 26 July 2025; Accepted: 28 October 2025;
Published: 17 November 2025.
Edited by:
Wenyan Wang, Beijing Tiantan Hospital and Capital Medical University, ChinaReviewed by:
Jiaqi Liu, National Cancer Center of China, ChinaZeyu Xing, Chinese Academy of Medical Sciences and Peking Union Medical College, China
Copyright © 2025 Wang, Gao, Bai, Wang and Geng. This is an open-access article distributed under the terms of the Creative Commons Attribution License (CC BY). The use, distribution or reproduction in other forums is permitted, provided the original author(s) and the copyright owner(s) are credited and that the original publication in this journal is cited, in accordance with accepted academic practice. No use, distribution or reproduction is permitted which does not comply with these terms.
*Correspondence: Cuizhi Geng, NDYzMDAzNDlAaGVibXUuZWR1LmNu