 Jun Li1Changjun Ma2Shifeng Tian1,3
 Ailian Liu1,3,4*Qingling Song1,3Nan Wang1,3
 Qingwei Song1,3
 Liangjie Lin5
 Peng Sun5
 Jiazheng Wang5
- 1Department of Radiology, The First Affiliated Hospital of Dalian Medical University, Dalian, Liaoning, China
- 2School of Biomedical Engineering, Faculty of Medicine, Dalian University of Technology, Dalian, Liaoning, China
- 3Dalian Medical Image Artificial Intelligence Engineering Technology Research Center, Dalian, Liaoning, China
- 4Technology Innovation Center of Hyperpolarized MRI, Dalian, Liaoning, China
- 5Philips Health Technology (China) Co., Ltd., Beijing, China
By Li J, Ma C, Tian S, Liu A, Song Q, Wang N, Song Q, Lin L, Sun P and Wang J (2025). Front. Oncol. 15:1556311. doi: 10.3389/fonc.2025.1556311
There was a mistake in Figure 2 and Figure 3 as published. Both of these figures contained unintended internal duplication. The corrected Figure 2 and Figure 3 appear below.
There was a mistake in the captions of Figure 2 and Figure 3 as published. The captions have been revised to correspond with the updated figures. The corrected captions of Figure 2 and Figure 3 appear below.
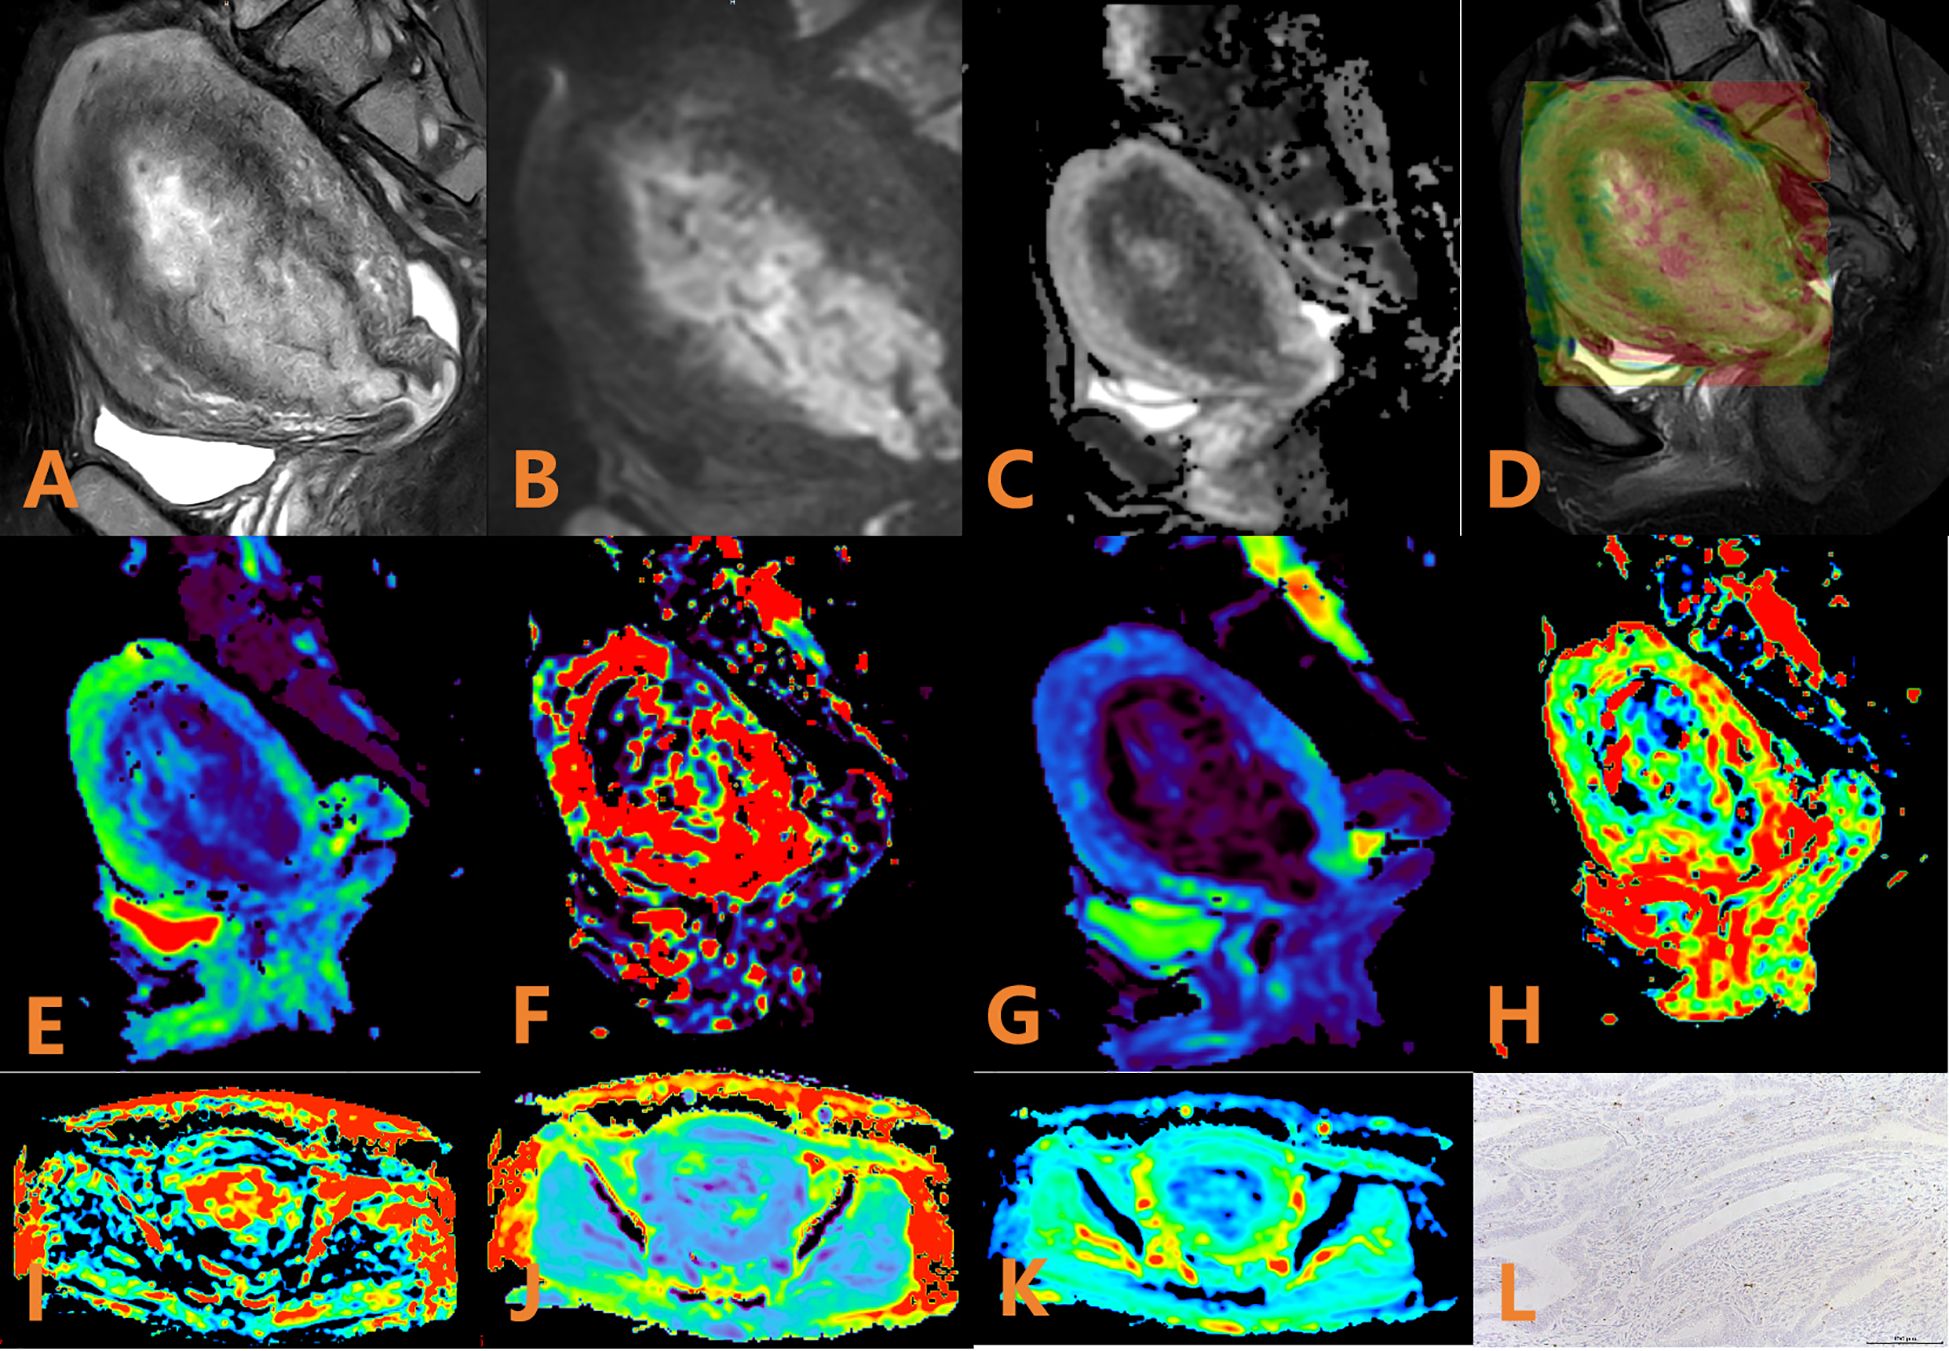
Figure 2. APTw, DKI and IVIM parameters for an EC patient with low HIF-1α expression. (A) sagittal T2WI, showing a slightly high signal mass in the uterine cavity; (B) sagittal DWI image; (C) sagittal ADC image; (D) APTw fused with T2WI (mean MTRasym value 3.53%); (E–H) ADC, D, D*, and f images. Mean values are 0.600 × 10⁻³ mm2/sec for ADC, 0.410 × 10⁻³ mm2/sec for D, 0.280 × 10⁻² mm2/sec for D* and 0.57% for f; (I–K) FA, MK, and MD images. Mean values are 0.388 for FA, 0.586 for MK, and 1.147 μm2/ms for MD; (L) Immunohistochemical staining image (×200) showed that HIF-1α expression of the tumor appeared as low expression.
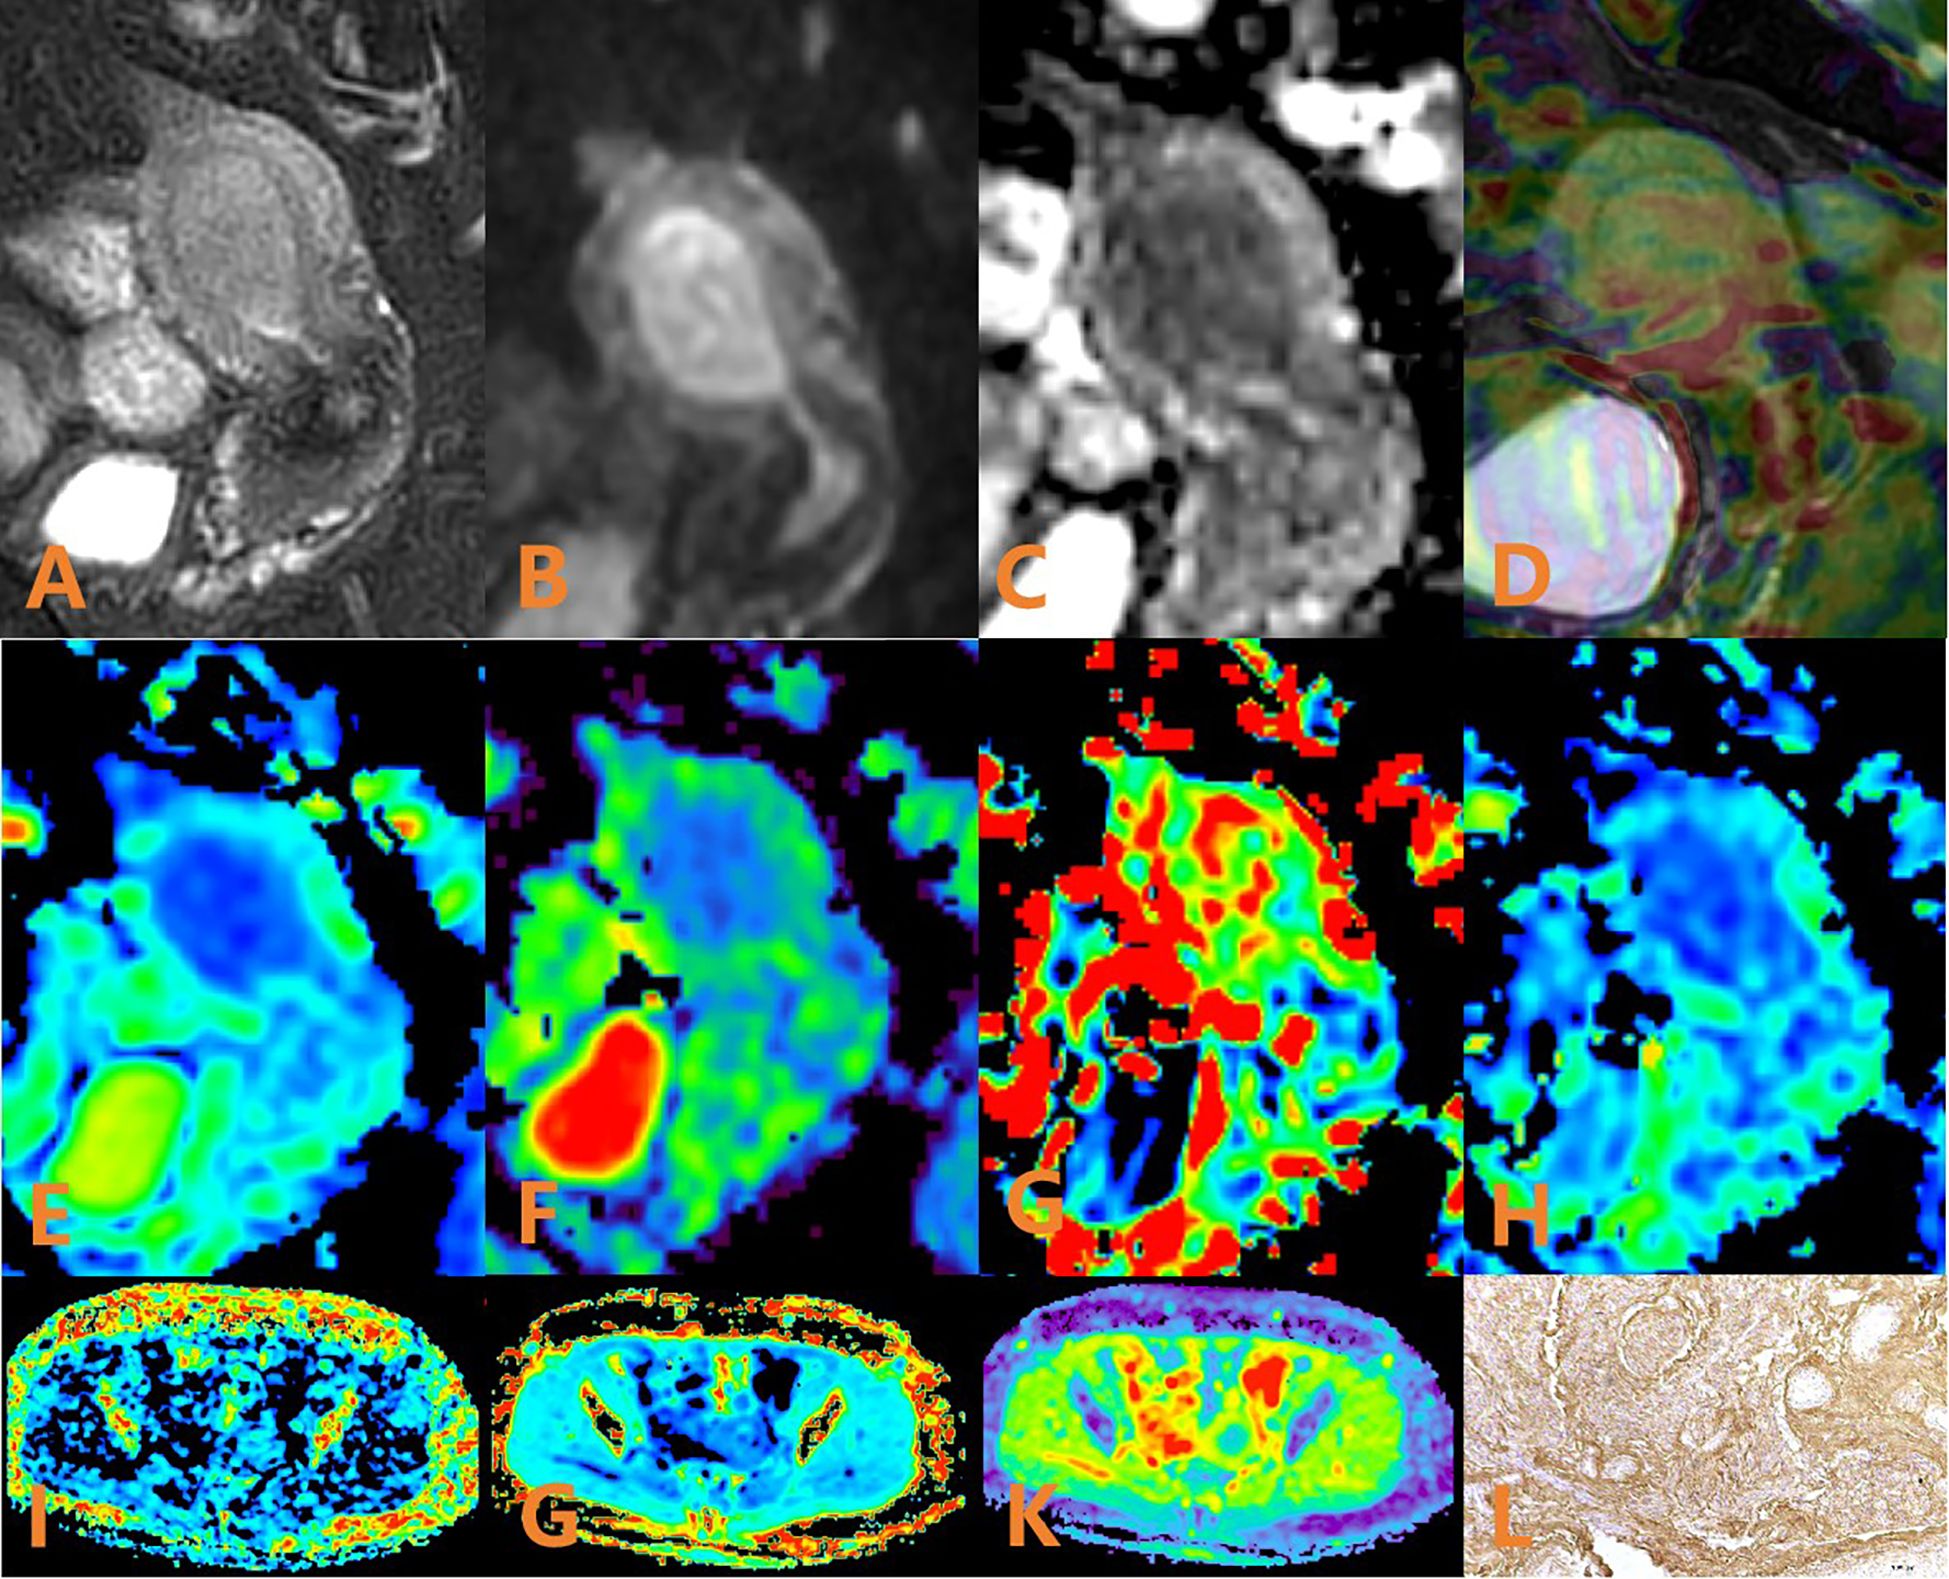
Figure 3. APTw, DKI and IVIM in EC that had high HIF-1α expression. (A) sagittal T2WI, showing a slightly high signal mass in the uterine cavity; (B) sagittal DWI image; (C) sagittal ADC images; (D) APTw and T2WI fusion images (mean APT value 1.63%) (E–H) ADC, D, D*, and f images. Mean values are 0.950×10⁻³ mm2/sec for ADC, 0.890 × 10⁻³ mm2/sec for D, 4.780 × 10⁻² mm2/sec for D* and 0.130% for f; (I–K) FA, MK, and MD images. Mean values are 0275 for FA, 0.566 for MK, and 0.966μm2/ms for MD; (L) Immunohistochemical staining image (×200) showed that HIF-1α expression of the tumor appeared as high expression.
Publisher’s note
All claims expressed in this article are solely those of the authors and do not necessarily represent those of their affiliated organizations, or those of the publisher, the editors and the reviewers. Any product that may be evaluated in this article, or claim that may be made by its manufacturer, is not guaranteed or endorsed by the publisher.
Keywords: DWI, IVIM, HIF-1α, endometrial cancer, amide proton transfer weighted imaging
Citation: Li J, Ma C, Tian S, Liu A, Song Q, Wang N, Song Q, Lin L, Sun P and Wang J (2025) Correction: Amide proton transfer-weighted imaging combined with multiple models diffusion-weighted imaging of endometrial cancer: correlations between multi-modal MRI parameters and HIF-1α expression. Front. Oncol. 15:1675936. doi: 10.3389/fonc.2025.1675936
Received: 29 July 2025; Accepted: 15 September 2025;
Published: 26 September 2025.
Edited and reviewed by:
Silvia Capuani, National Research Council (CNR), ItalyCopyright © 2025 Li, Ma, Tian, Liu, Song, Wang, Song, Lin, Sun and Wang. This is an open-access article distributed under the terms of the Creative Commons Attribution License (CC BY). The use, distribution or reproduction in other forums is permitted, provided the original author(s) and the copyright owner(s) are credited and that the original publication in this journal is cited, in accordance with accepted academic practice. No use, distribution or reproduction is permitted which does not comply with these terms.
*Correspondence: Ailian Liu, Y2pyLmxpdWFpbGlhbkB2aXAuMTYzLmNvbQ==