 Qing-Lin Ren1†
 Liu Lin2†Kai Chu3Xin-Rong Xu4Hui-Jun Wang1Jun Wu4
 Jin-Zhi You5
 Jun-Xi Hu4
 Xiao-Lin Wang4*
 Yu-Sheng Shu4*
- 1Department of Graduate School, Dalian Medical University, Dalian, China
- 2Department of Thoracic Surgery, Wuxi People’s Hospital, Wuxi, China
- 3Department of Graduate School, Xuzhou Medical University, Xuzhou, China
- 4Department of Thoracic Surgery, Northern Jiangsu People’s Hospital, Yangzhou, China
- 5Department of Thoracic Surgery, The Affiliated Suqian Hospital of Xuzhou Medical University, Suqian, China
Background: This study aimed to preoperatively predict spread through air spaces (STAS) in stage I lung adenocarcinoma presenting as part-solid and solid nodules by leveraging clinical features and machine learning models, thereby guiding surgical decision-making and enhancing patient counseling.
Methods: A total of 473 patients were retrospectively enrolled, including 353 from our center and 120 from an validation cohort. Predictive features were selected using maximum relevance minimum redundancy (mRMR) and least absolute shrinkage and selection operator (LASSO) algorithms. Seven machine learning models—logistic regression, random forest, support vector machine (SVM), extreme gradient boosting (XGBoost), adaptive boosting (AdaBoost), light gradient boosting machine (LightGBM), and category boosting (CatBoost)—were developed and evaluated using receiver operating characteristic curves, calibration plots, and decision curve analysis (DCA). Feature importance was assessed using Shapley Additive Explanations (SHAP). A web-based nomogram was constructed for clinical application.
Result: STAS was present in 44.76% of the training set and 50.83% of the validation cohort. Seven predictors were selected to construct the predictive models. The XGBoost model demonstrated superior performance with an AUC of 0.889 (95% CI, 0.852–0.926) in training and 0.856 (95% CI, 0.789–0.928) in validation. The calibration curves in training and validation set exhibited good agreement between the predictions and actual observations. The Decision Curve Analyses (DCA) provide significant clinical utility. SHAP analysis identified the most important predictors for STAS as CEA, vascular convergence, proGRP, age, AFP, smoking history, and CTR.
Conclusion: The XGBoost model provides robust preoperative prediction of STAS and may assist clinicians in optimizing surgical strategies for patients with stage I lung adenocarcinoma.
Introduction
Lung cancer remains one of the most commonly diagnosed malignancies and the leading cause of cancer-related mortality globally. In China, it accounts for approximately 1.06 million new cases and 0.73 million deaths annually (1). Lung adenocarcinoma (LUAD) is the predominant histological subtype, comprising approximately 85% of non-small cell lung cancer (NSCLC) cases (2, 3). For stage I NSCLC patients undergoing curative R0 resection, 5-year recurrence-free survival (RFS) and overall survival (OS) range from 62.5%–64.7% and 78.7%–81.9%, respectively (4). Despite achieving negative resection margins, early-stage LUAD patients continue to face high locoregional recurrence rates.
Spread through air spaces (STAS) is a newly recognized form of invasion in lung cancer, first proposed in the 2015 WHO classification. It is defined as micropapillary clusters, solid nests, or single cancer cells infiltrating into air spaces beyond the main tumor edge (5, 6), STAS is an independent predictor of poor outcomes in stage I NSCLC and is associated with increased recurrence and reduced survival (7, 8). It also raises recurrence risk in LUAD patients treated with limited resection (9, 10).
With advances in imaging technology, lung cancer is being detected earlier, and smaller nodules are considered suitable for sublobar resection, providing surgeons with more opportunities to choose this approach. providing surgeons with more opportunities to opt for sublobar resection. However, several studies have shown that, compared to lobectomy, sublobar resection is associated with lower RFS and OS in patients with STAS-positive tumors. Patients who underwent wedge resection had significantly worse RFS and OS than those who underwent lobectomy (11). Thus, lobectomy is associated with better outcomes for STAS-positive T1 LUAD compared to sublobar resection (12, 13). Therefore, accurately selecting the surgical approach preoperatively is critical.
Given the importance of preoperative STAS identification for optimal surgical decision-making, enhancing the accuracy of these predictions is crucial for improving patient outcomes. Machine learning (ML) models have gained significant traction in disease prediction due to their ability to process high-dimensional data efficiently (14, 15). However, further optimization and validation of ML models for preoperative STAS prediction are needed to improve their clinical applicability.
We developed several ML models for preoperative STAS prediction using clinical and radiological data from our institution, followed by external validation in an independent cohort from another medical center. The primary goal of this study is to accurately identify STAS preoperatively, facilitating precise surgical decisions, improving patient prognosis, and providing valuable insights for clinical treatment strategies.
Materials and methods
Patients
Clinical data were collected from 158 cases of stage I lung adenocarcinoma with STAS admitted to Northern Jiangsu People’s Hospital between January 2021 and June 2025. These cases were compared with clinical data from 195 stage I lung adenocarcinoma patients without STAS (the flowchart of this study is shown in Figure 1). This study was approved by the Ethics Committee of Northern Jiangsu People’s Hospital.
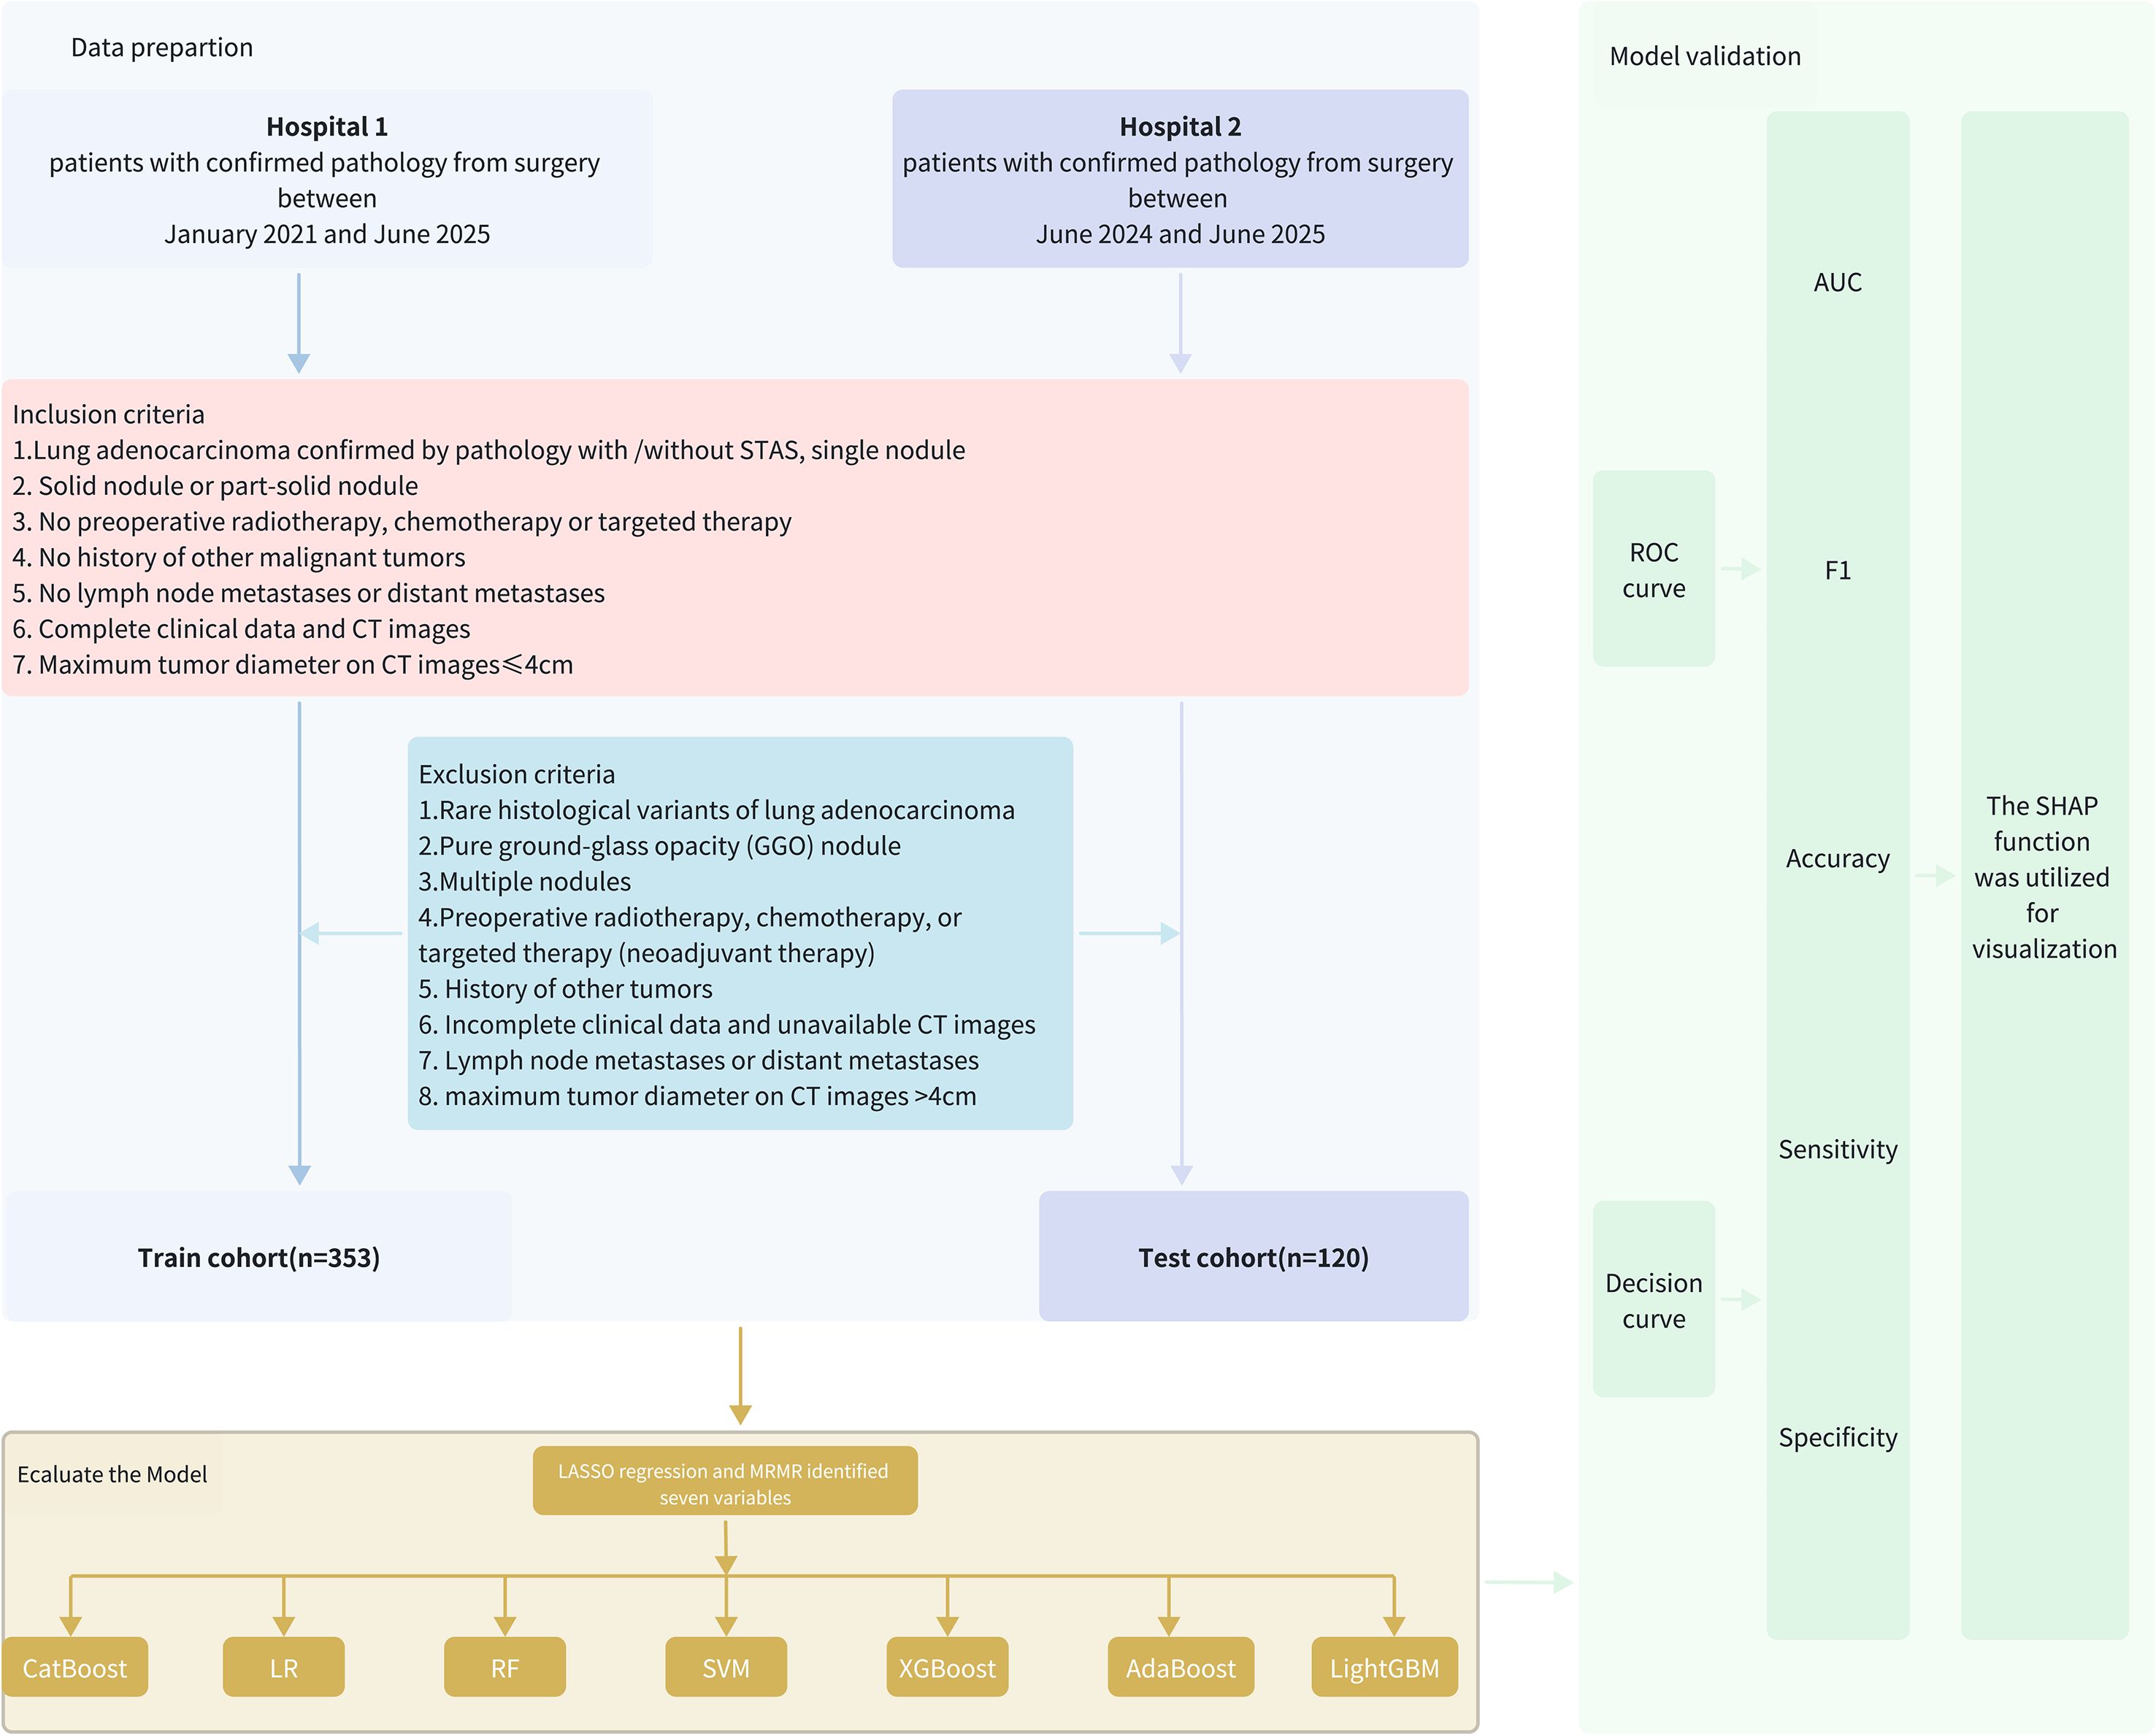
Figure 1. The flow diagram of the study.
Inclusion criteria
1. Lung adenocarcinoma confirmed by pathology with or without STAS and single nodule.
2. Solid or part-solid nodule.
3. No preoperative radiotherapy, chemotherapy or targeted therapy.
4. No history of other malignant tumors.
5. No lymph node metastases or distant metastases.
6. Complete clinical data and CT images available.
7. Maximum tumor diameter ≤ 4 cm on CT.
Exclusion criteria
1. Rare histological variants of lung adenocarcinoma.
2. Pure ground-glass opacity (GGO) nodules.
3. Multiple nodules.
4. Preoperative radiotherapy, chemotherapy, or targeted therapy (neoadjuvant therapy).
5. History of other malignancies.
6. Incomplete clinical data or unavailable CT images.
7. Lymph node metastases or distant metastases.
8. Maximum tumor diameter on CT images >4cm on CT.
Based on the postoperative pathological results, patients were classified as either STAS-positive or STAS-negative.
Radiological and histological evaluation
Based on findings in the lung window, the solid component was defined as a patch that completely obscures the underlying lung parenchyma and the GGO component was defined as a hazy area of increased lung attenuation with preserved bronchial and vascular margins. The part-solid nodule was defined as a lesion containing both GGO and solid components, solid nodule was defined as a lesion consisting solely of solid components. In histological evaluation, we focused on stage I lung adenocarcinoma with nodules consisting of solid components, excluding pure GGO nodules.
CT features evaluated included pleural invasion, vascular invasion, spiculation, lobulation, vascular convergence, pleural traction, pleural indention, air bronchogram, vacuole, and consolidation/tumor ratio (CTR). CTR was quantified as the ratio of the tumor consolidation diameter to the total diameter. These CT features were defined and assessed according to previous reports (16–19). Two radiologists with over 10 years of chest imaging experience validated the reliability of the radiological assessments. Only features with good inter-observer agreement between the two radiologists were included in subsequent analyses. Both radiologists were blinded to the patients’ STAS status.
Clinical data collection
Clinical information was obtained through the hospital’s medical record system. The clinicopathologic features included the age at surgery, sex, smoking history, BMI, pathologic tumor(T) stage (seventh edition of the lung cancer staging system) (20), tumor location, operative methods, forced expiratory volume in 1 s (FEV1), and diffusing capacity of the carbon monoxide (DLCO). Laboratory findings on admission included serum levels of white blood cell (WBC), neutrophil, lymphocyte, monocyte, platelet, albumin, neutrophil to lymphocyte ratio (NLR), monocyte to lymphocyte ratio (MLR), platelet to lymphocyte ratio (PLR), carbohydrate antigen 125 (CA125), alpha-Fetoprotein (AFP), carcinoembryonic antigen (CEA), neuron-specific enolase (NSE), cytokeratin 19 Fragment 21-1(cyfra21-1) and pro-Gastrin-Releasing Peptide (proGRP) within 2 weeks prior to surgery. In this study, patients who underwent lobectomy, segmentectomy, or wedge resection were reviewed. Variables with >30% missingness were removed. Likewise, patients whose records exceeded this threshold across candidate predictors were excluded from model development. For the remaining data, missing values were imputed using the mode for categorical variables and the mean for continuous variables.
We aimed to develop a machine learning model to predict the presence of STAS in stage I lung adenocarcinoma patients using preoperative indicators. Thus, operative methods were excluded from the construction of the machine learning model.
External validation
A validation cohort from Wuxi People’s Hospital, affiliated with Nanjing MedicalFI University, was included for external validation. This cohort included 120 patients, 59 of whom were pathologically confirmed as STAS-positive and 61 as STAS-negative, all meeting the inclusion and exclusion criteria.
Predictive model construction and evaluation
Maximum relevance minimum redundancy (mRMR) was applied to the initial feature set to reduce data dimensionality (21). Subsequently, the least absolute shrinkage and selection operator (LASSO) logistic regression was employed to identify key features and develop a predictive model for STAS (22).
To reduce dimensionality while retaining non-redundant information, we first applied maximum relevance minimum redundancy (mRMR) using the mRMRe framework (mutual-information–based relevance with redundancy penalization). We used ensemble selection with feature_count = 15 and solution_count = 1, targeting the binary outcome (STAS positive or negative). The retained candidates were then passed to LASSO logistic regression (glmnet) with α = 1. The regularization parameter λ was tuned by 10-fold stratified cross-validation, minimizing binomial deviance. We used λ_min = 0.03469344 for subsequent selection, yielding seven non-zero predictors (CTR, age, smoking history, AFP, CEA, proGRP, vascular convergence).
Seven predictive models were constructed, including logistic regression, random forest, support vector machines (SVM), extreme gradient boosting (XGBoost), adaptive boosting (AdaBoost), light gradient boosting machine (LightGBM), and category boosting (CatBoost) (23–26) and were trained on the selected clinical features using stratified cross-validation (primary metric AUC). Logistic regression (logit link) reported class probabilities without additional penalties. Random Forest used the Gini criterion with 500 trees and CV-tuned mtry (final mtry = 5). SVM (RBF kernel) tuned C and γ (selected: C = 1×10⁶, γ = 1×10⁻⁶). XGBoost (objective = binary:logistic) tuned learning rate (η), tree depth, min_child_weight, and subsample by 10-fold CV with early stopping, then trained for nrounds = 1000. AdaBoost used mfinal = 10 based on the training-error plateau. LightGBM (metric = AUC) used max_depth = 8 and nrounds = 1000 with leaf/sampling controls chosen by CV. CatBoost (loss = Logloss, eval_metric = AUC) trained with iterations = 1000, learning_rate = 0.1, depth = 8, while l2_leaf_reg and rsm were tuned by CV. After hyperparameter tuning within the training set by stratified 10-fold CV (primary metric AUC), each model was refitted on the full training set and evaluated once on an validation set; we report both cross-validation and external validation performance.
Model performance was evaluated using area under the receiver operating characteristics curve (AUC) and decision curve analysis (DCA) to assess both discriminatory power and clinical utility. Additionally, Shapley additive explanations (SHAP) analysis was employed to interpret model results and assess feature importance, with particular focus on the top-performing machine learning model.
Statistical methods
Statistical analyses were performed using R software (version 4.3.1). Variables with a missing data rate exceeding 20% and outliers were excluded, with remaining missing values addressed via multiple imputation. Continuous variables following a normal distribution were expressed as mean ± standard deviation (x ± s) and compared using the t-test. For non-normally distributed continuous variables, data were presented as median (25th percentile, 75th percentile) [M (P25, P75)] and analyzed using the Mann-Whitney U test. Categorical variables were summarized as counts and percentages [n (%)] and compared using the chi-square test or Fisher’s exact test, as appropriate.
Results
Baseline characteristics of patients
A total of 473 stage I lung adenocarcinoma patients, with either STAS-positive or STAS-negative status, met the eligibility criteria for this study. These patients were divided into the training set (n = 353; data from Northern Jiangsu People’s Hospital) and the independent validation cohort (n = 120; data from Wuxi People’s Hospital, affiliated with Nanjing Medical University).
In the training set, 158 patients were STAS-positive, accounting for 44.76%. In the validation set, 61 patients were STAS-positive, representing 50.83%. Demographic data of all patients were thoroughly examined before modeling.
Table 1 summarizes the baseline characteristics and perioperative serum variables of the 473 patients. Variables such as age, CEA, CYFRA 21-1, proGRP, NLR, CTR, gender, smoking history, pleural invasion, and vascular convergence demonstrated statistically significant differences between groups in the training set (p< 0.05) but not in the validation set. CEA was the only variable that showed significant differences in both cohorts.
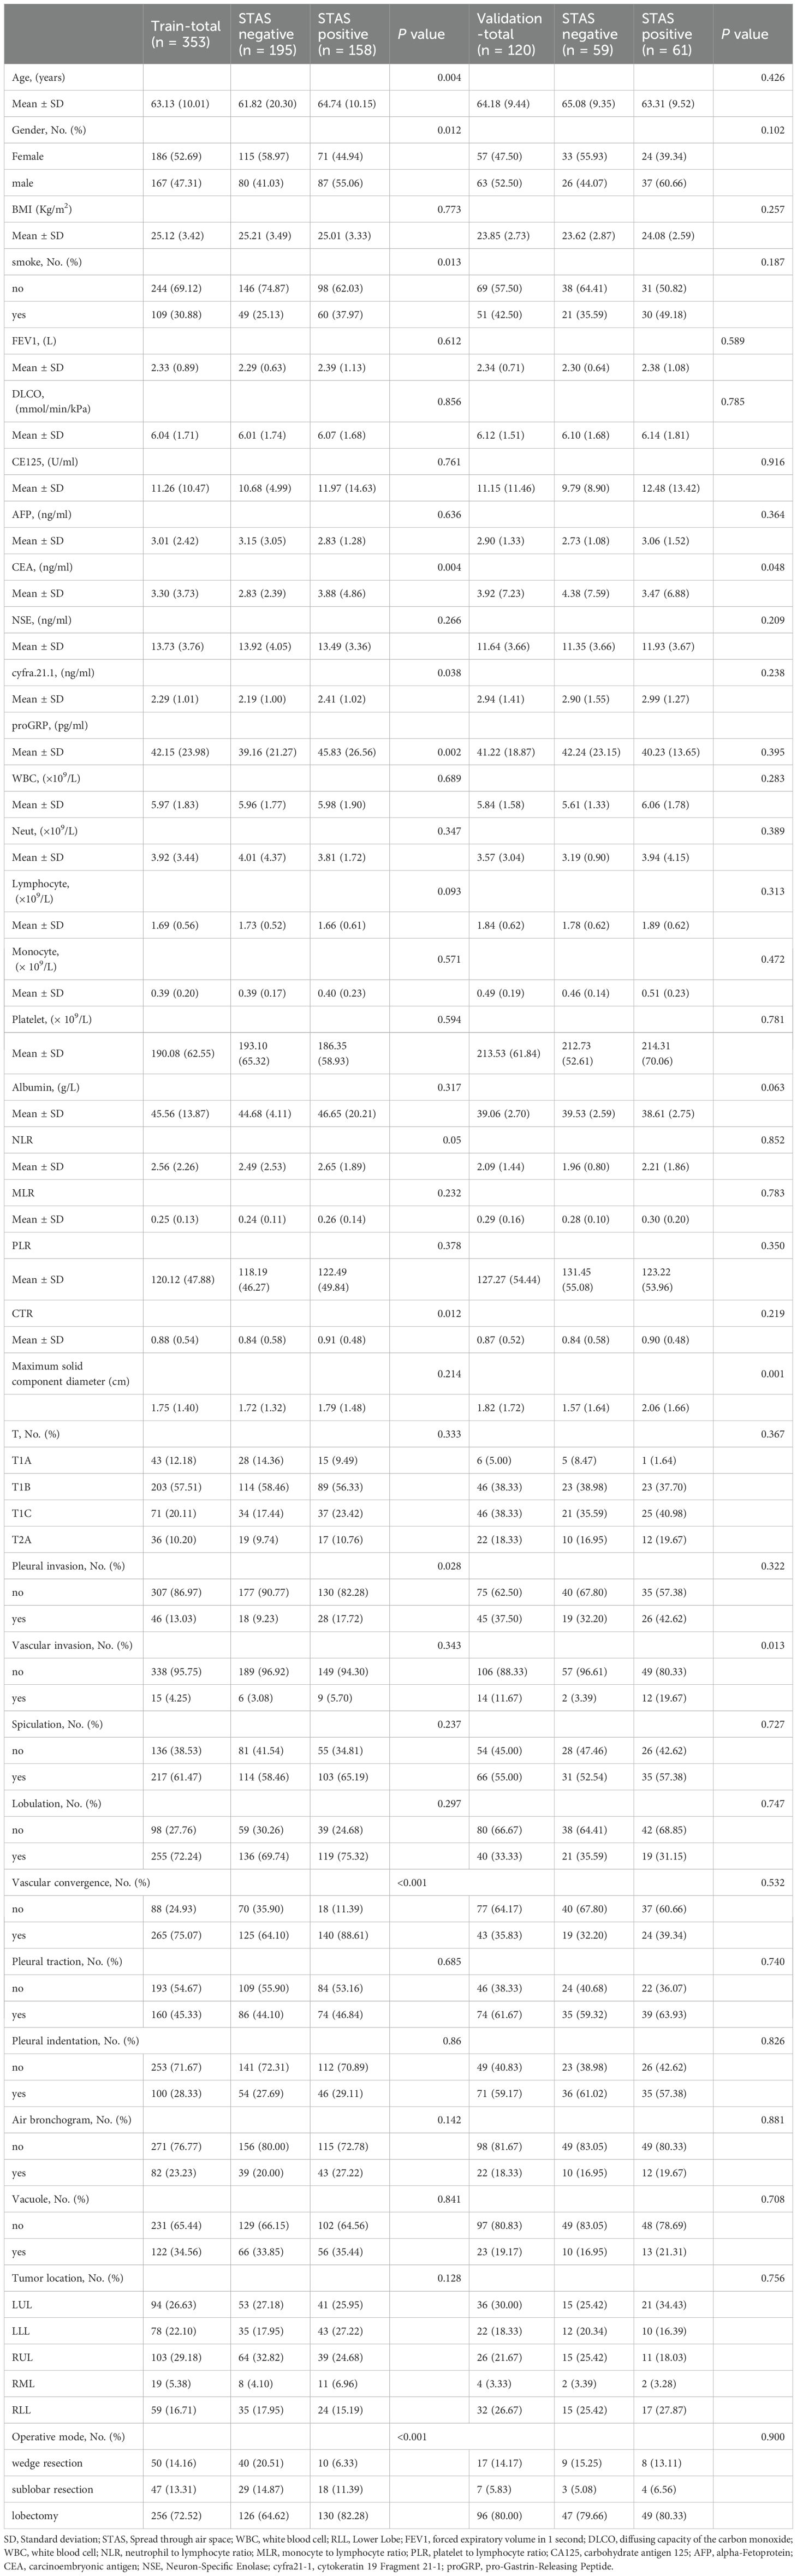
Table 1. Characteristics baseline of patients in train set and validation set.
Selection of variables
We first employed mRMR for initial variable screening to maximize the correlation between features while minimizing inter-feature redundancy, followed by LASSO to identify key STAS-related variables (Figures 2A, B). The selected predictive variables were: CTR, age, smoking history, AFP, CEA, proGRP, and vascular convergence.
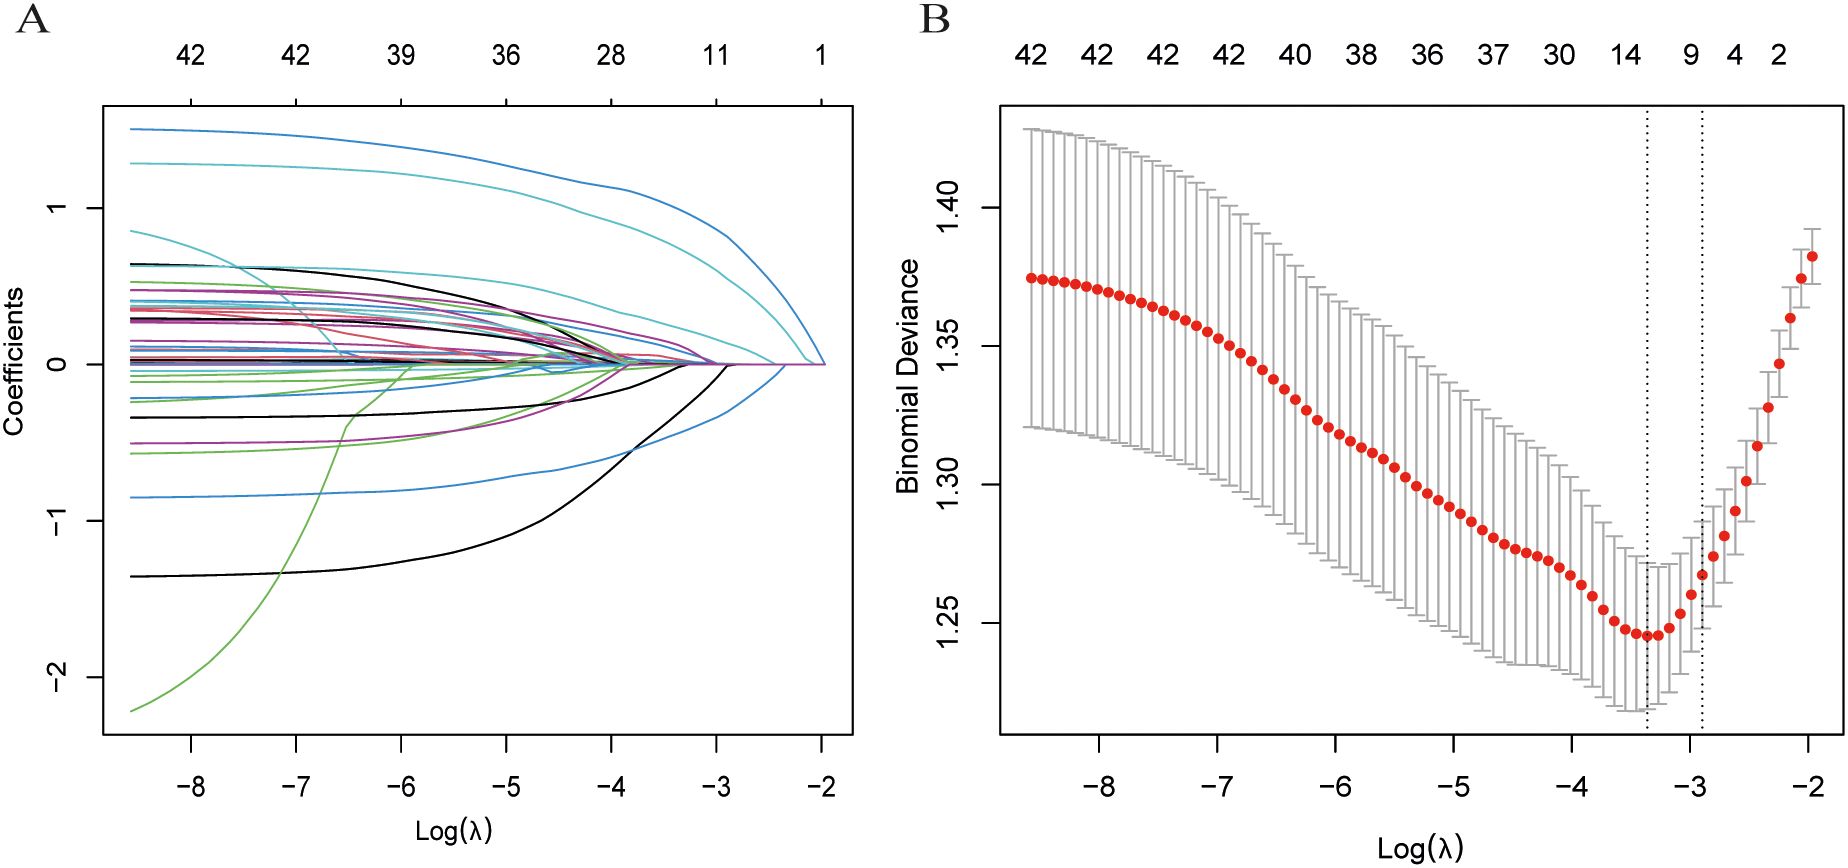
Figure 2. Process of selecting variables through LASSO regression. (A) LASSO coefficient profiles across a sequence of log(λ) values. The optimal penalty parameter λ was determined via ten-fold cross-validation. (B) Validation of the optimal λ, with dotted vertical lines indicating the chosen value. Seven variables with nonzero coefficients were selected by λ. min.
Model construction and validation
Using the 7 selected variables, seven machine learning algorithms—logistic regression, random forest, SVM, XGBoost, AdaBoost, LightGBM, and CatBoost—were employed to construct and validate predictive models.
the AdaBoost model demonstrated the highest discriminative ability, with an area under the curve (AUC) of 0.963 (95% CI: 0.947–0.980), along with a sensitivity of 0.886, specificity of 0.908, positive predictive value (PPV) of 0.886, and negative predictive value (NPV) of 0.907. However, the Hosmer-Lemeshow test indicated poor calibration (P = 1.33 × 10⁻¹⁵), suggesting a significant discrepancy between the predicted probabilities and the observed outcomes.
In contrast, the XGBoost model exhibited strong and more balanced performance across both the training and validation sets. In the training set, XGBoost achieved an AUC of 0.889 (95% CI: 0.852–0.926), with a sensitivity of 0.810, specificity of 0.805, PPV of 0.701, and NPV of 0.840. In the validation cohort, the model demonstrated an AUC of 0.856 (95% CI: 0.789–0.928), with sensitivity, specificity, PPV, and NPV of 0.738, 0.881, 0.865, and 0.765, respectively (see Figure 3). Its calibration curve demonstrated close agreement between observed and predicted risks (Figure 4), indicating good calibration. A comprehensive summary of all models is provided in Table 2. The calibration plot demonstrated close agreement between observed and predicted outcomes, indicating good predictive accuracy of the model. (see Figure 4). A comprehensive performance summary for each model is presented in Table 2.
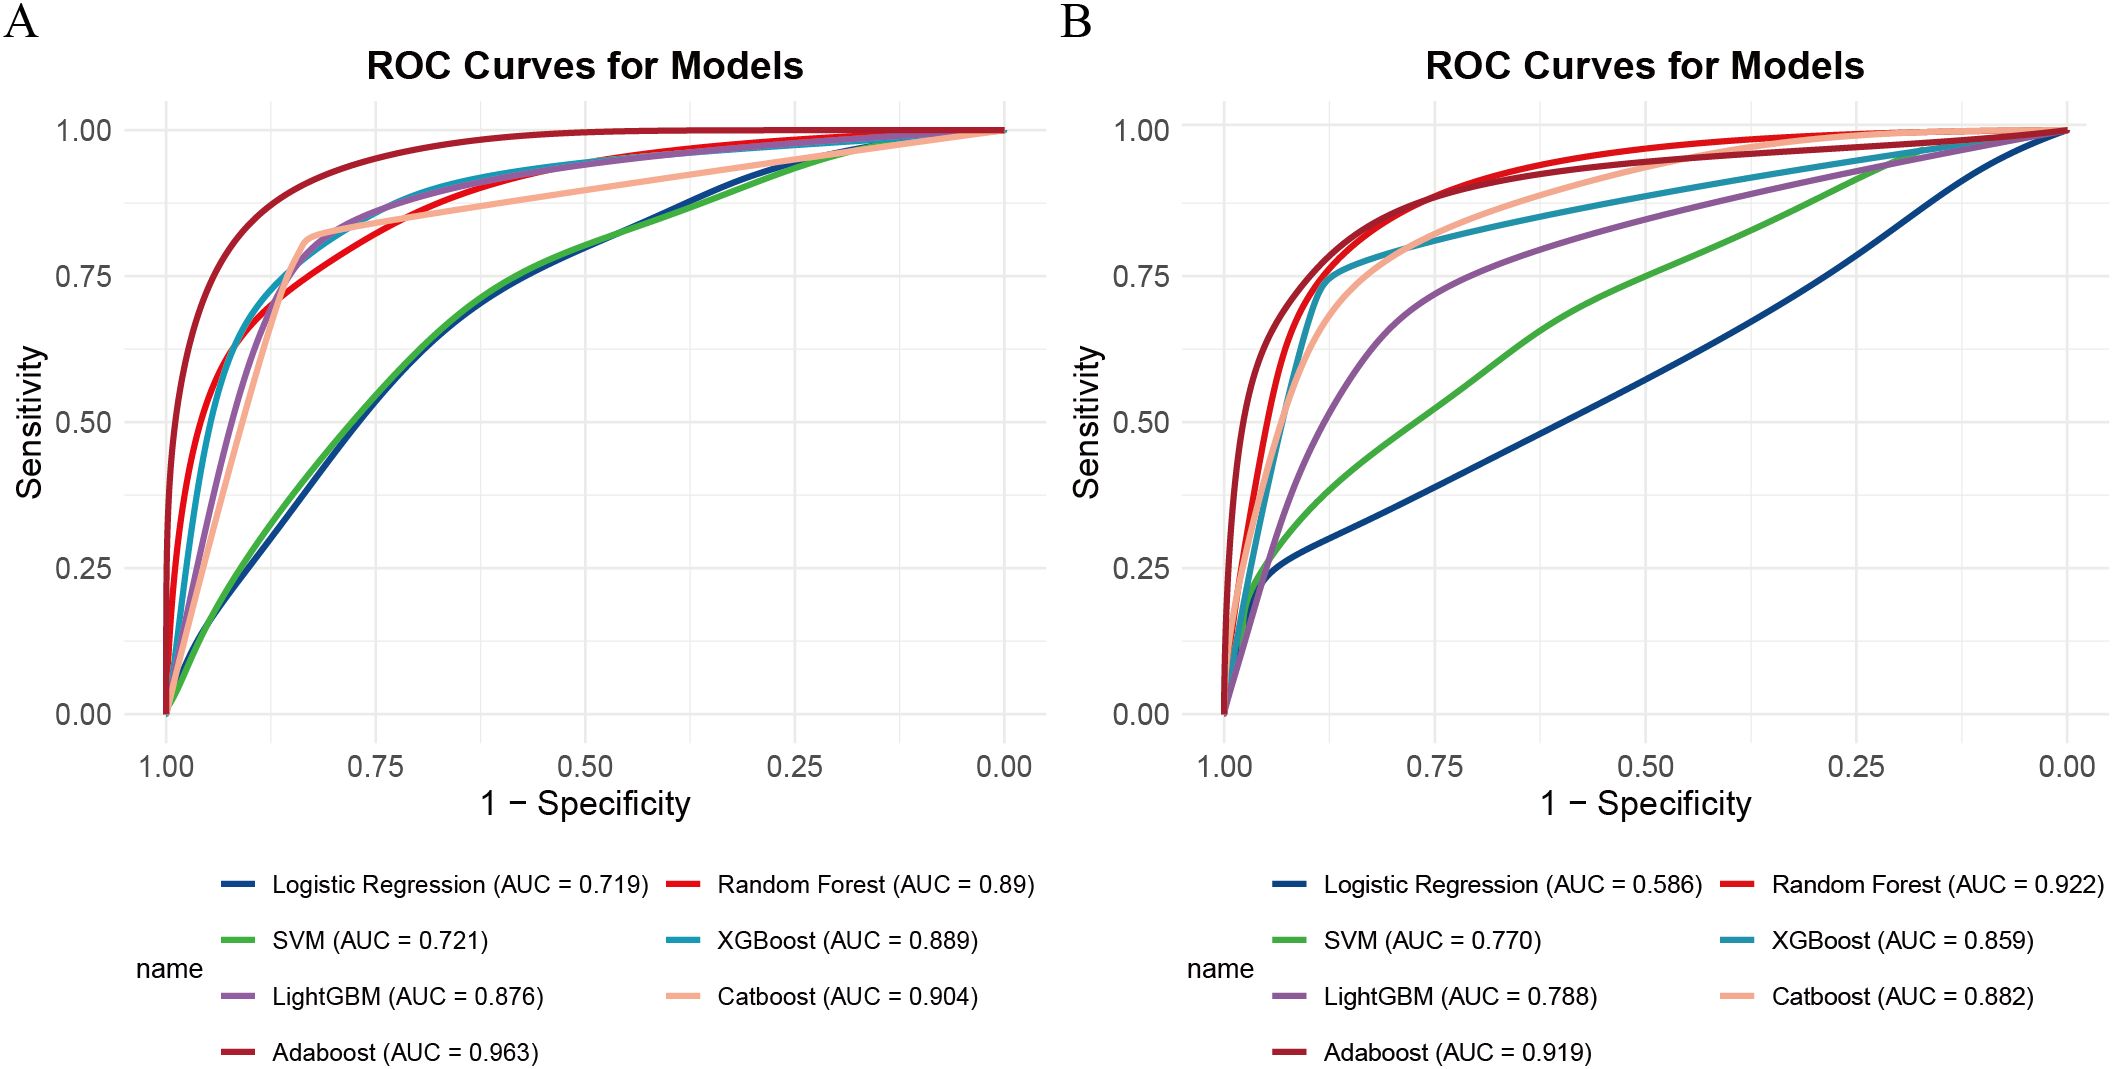
Figure 3. ROC curves for seven machine learning models. (A) Training set, (B) validation set. ROC, receiver operating characteristic.
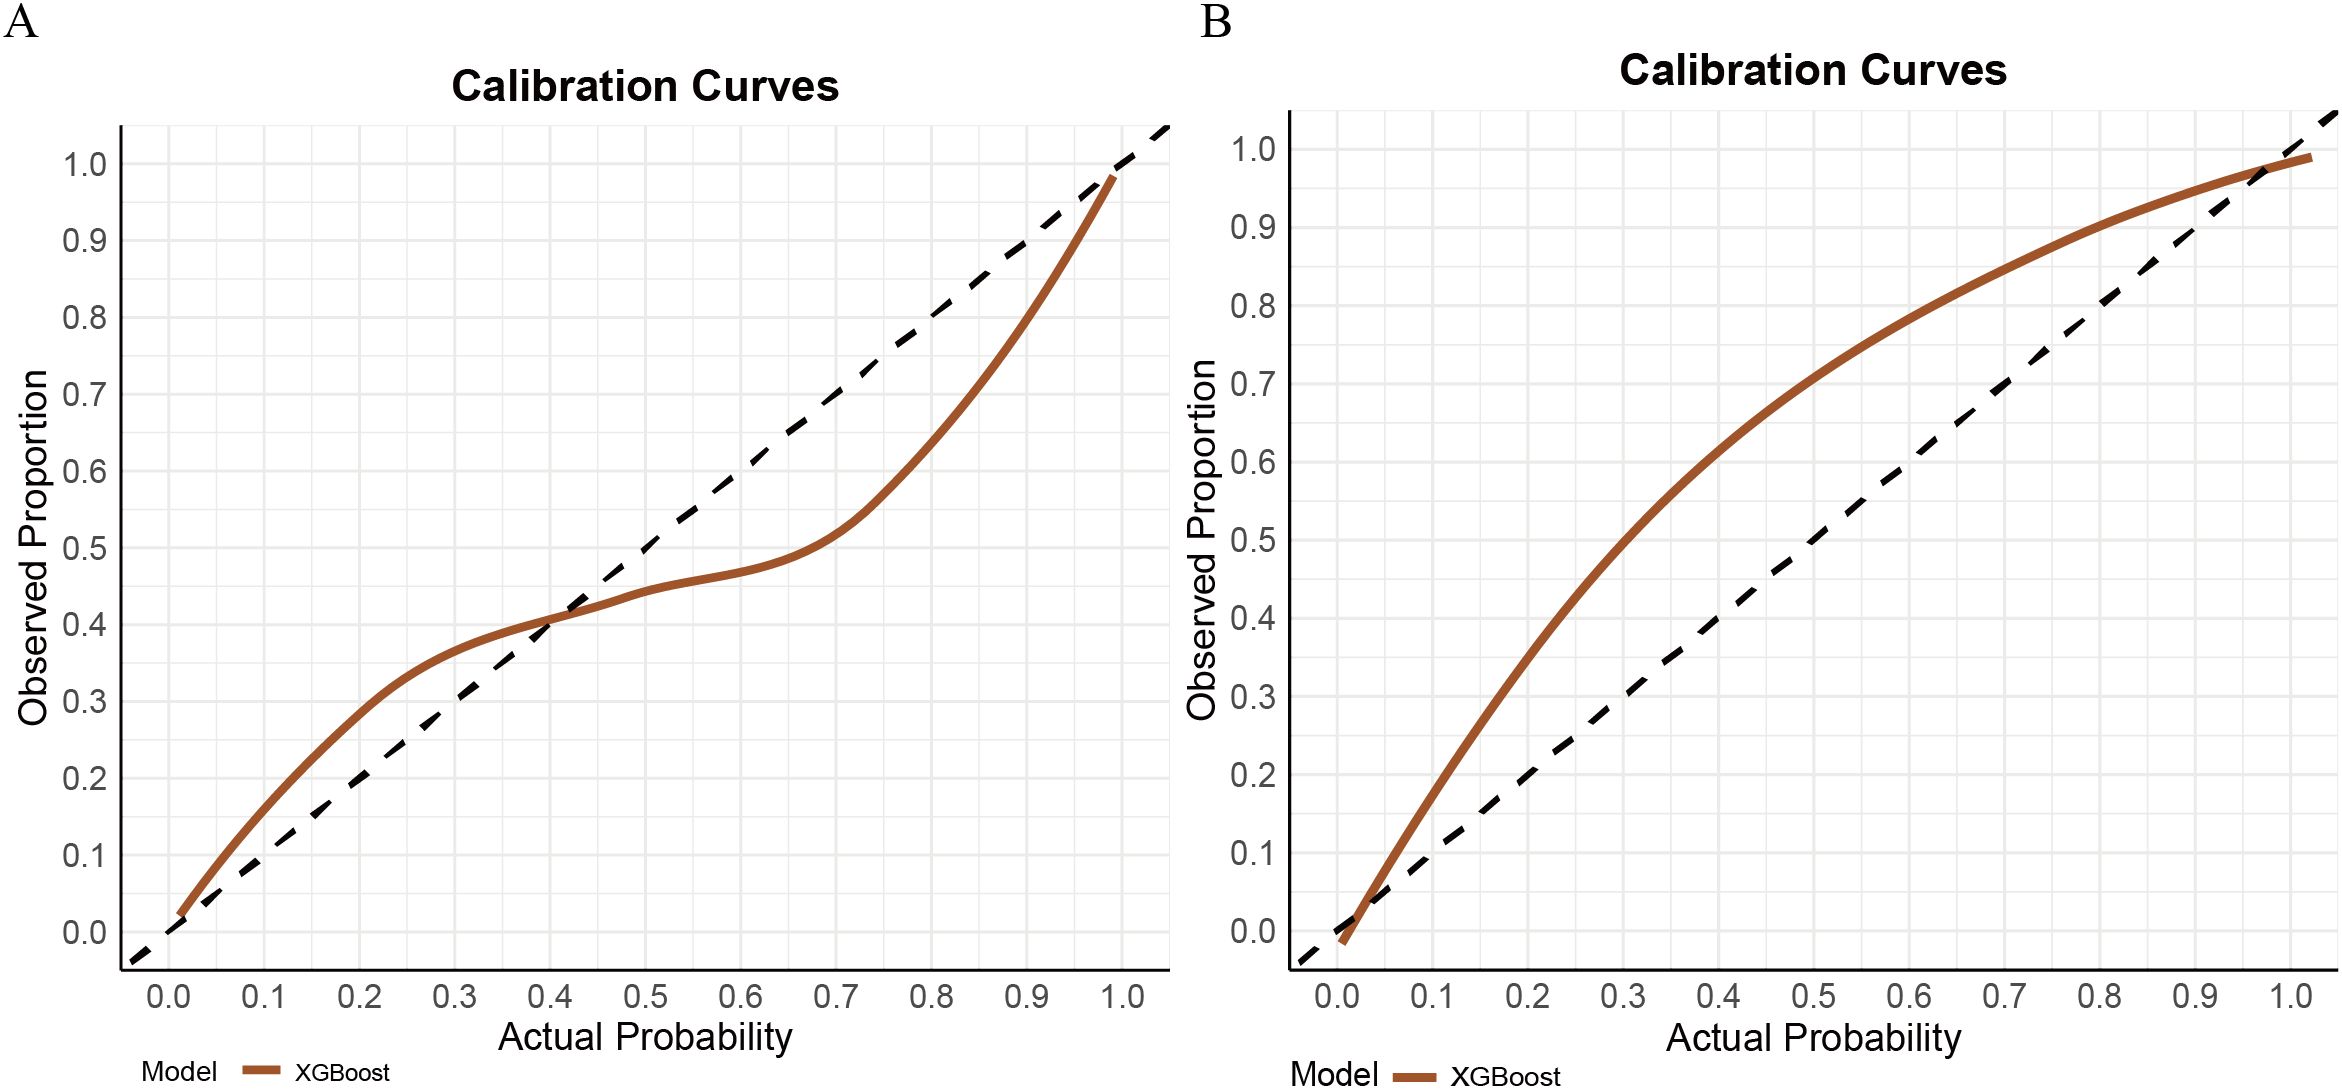
Figure 4. Calibration curves for XGBoost model in the train set (A) and validation (B) set.
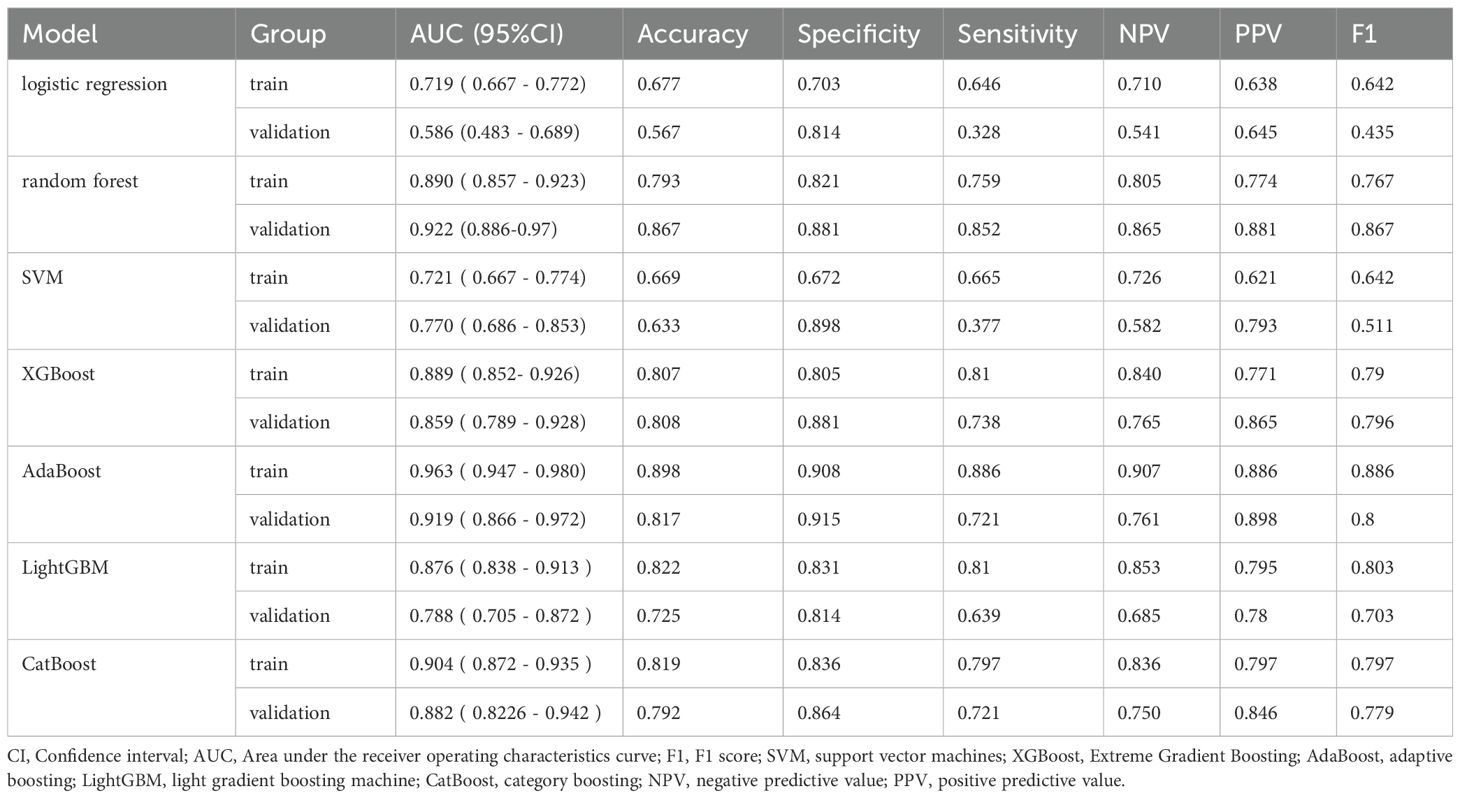
Table 2. Performance of seven models.
The DCA revealed all seven models consistently provided a net benefit greater than 0 across a range of threshold probabilities (0.0 to 0.8), suggesting their potential clinical utility in guiding STAS prediction decisions (Figure 5). The net benefit rate for all models remained above 0 in both the training and validation sets. The XGBoost model maintained a favorable net benefit within the clinically relevant cost-benefit ratio range (1:4 to 4:1), highlighting its robustness and practical value in clinical settings. To clarify threshold selection and clinical use, we focused on as a prespecified, clinically plausible range based on the accepted trade-off between missing STAS and unnecessary escalation. Within this range—particularly around 0.30–0.50—XGBoost offers the most consistent net benefit, supporting model-guided escalation when the consequence of missing STAS is considered high, whereas higher thresholds (≥0.60) help limit overtreatment.
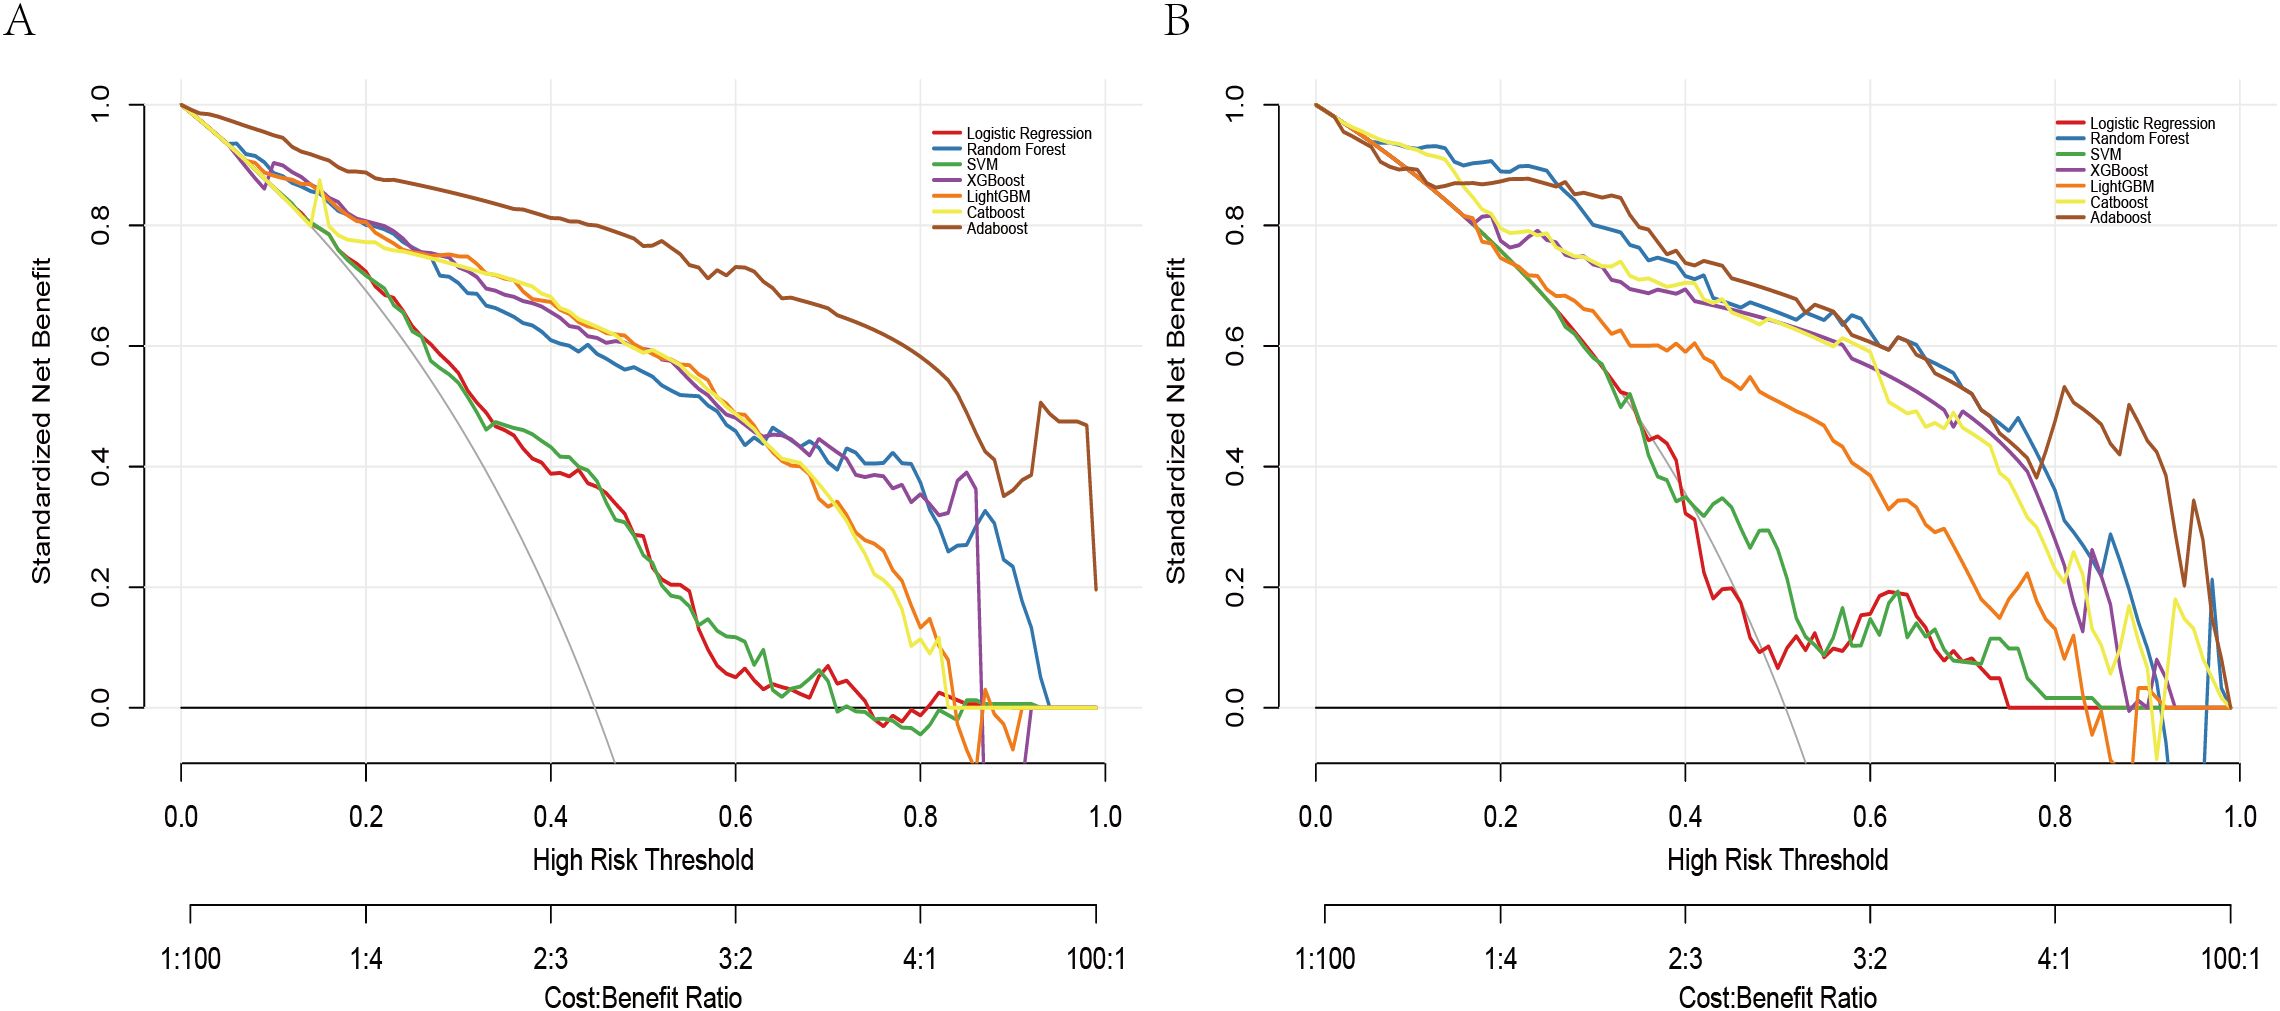
Figure 5. Decision curves for seven machine learning models: (A) training set, (B) validation set.
Taken together, while AdaBoost delivered the highest AUC, however, its calibration performance was markedly unsatisfactory, as indicated by the Hosmer–Lemeshow test (P = 1.33×10⁻¹⁵) and the corresponding calibration curves (see Supplementary Figure 1), which revealed a considerable discrepancy between predicted and observed outcomes. In contrast, XGBoost provided a more balanced performance: it maintained strong discrimination while demonstrating good calibration, with predicted risks well aligned with actual probabilities (see Figure 3). From a clinical perspective, accurate probability estimates are crucial for risk stratification and surgical decision-making, where over- or underestimation of risk may lead to inappropriate treatment choices. Therefore, despite its slightly lower AUC, XGBoost was chosen as the preferred model.
Model explanation
To enhance clinical interpretability, we used SHAP to quantify both the direction and magnitude of each feature’s contribution to the final XGBoost model’s predictions. Figure 6A summarizes global importance as the mean absolute SHAP value for each feature, with CEA contributing the most overall, followed by vascular convergence, proGRP, age, AFP, smoking history, and CTR. In the beeswarm plot (Figure 6B), features are ordered by mean absolute SHAP value (global importance). Horizontal position reflects the SHAP value for each case (positive values increase the predicted probability of STAS; negative values decrease it), while color encodes the feature value (yellow = higher value, purple = lower value). Consistent with the biological rationale, higher CEA values (yellow points) cluster toward positive SHAP values, indicating that elevated CEA is associated with an increased predicted risk of STAS. A similar positive directionality is observed for vascular convergence and CTR (higher values tend to push predictions toward higher STAS probability). proGRP and AFP exhibit modest positive contributions at higher values, and smoking history (ever vs. never) shifts predictions toward higher risk. Age shows a smaller but directionally consistent effect.
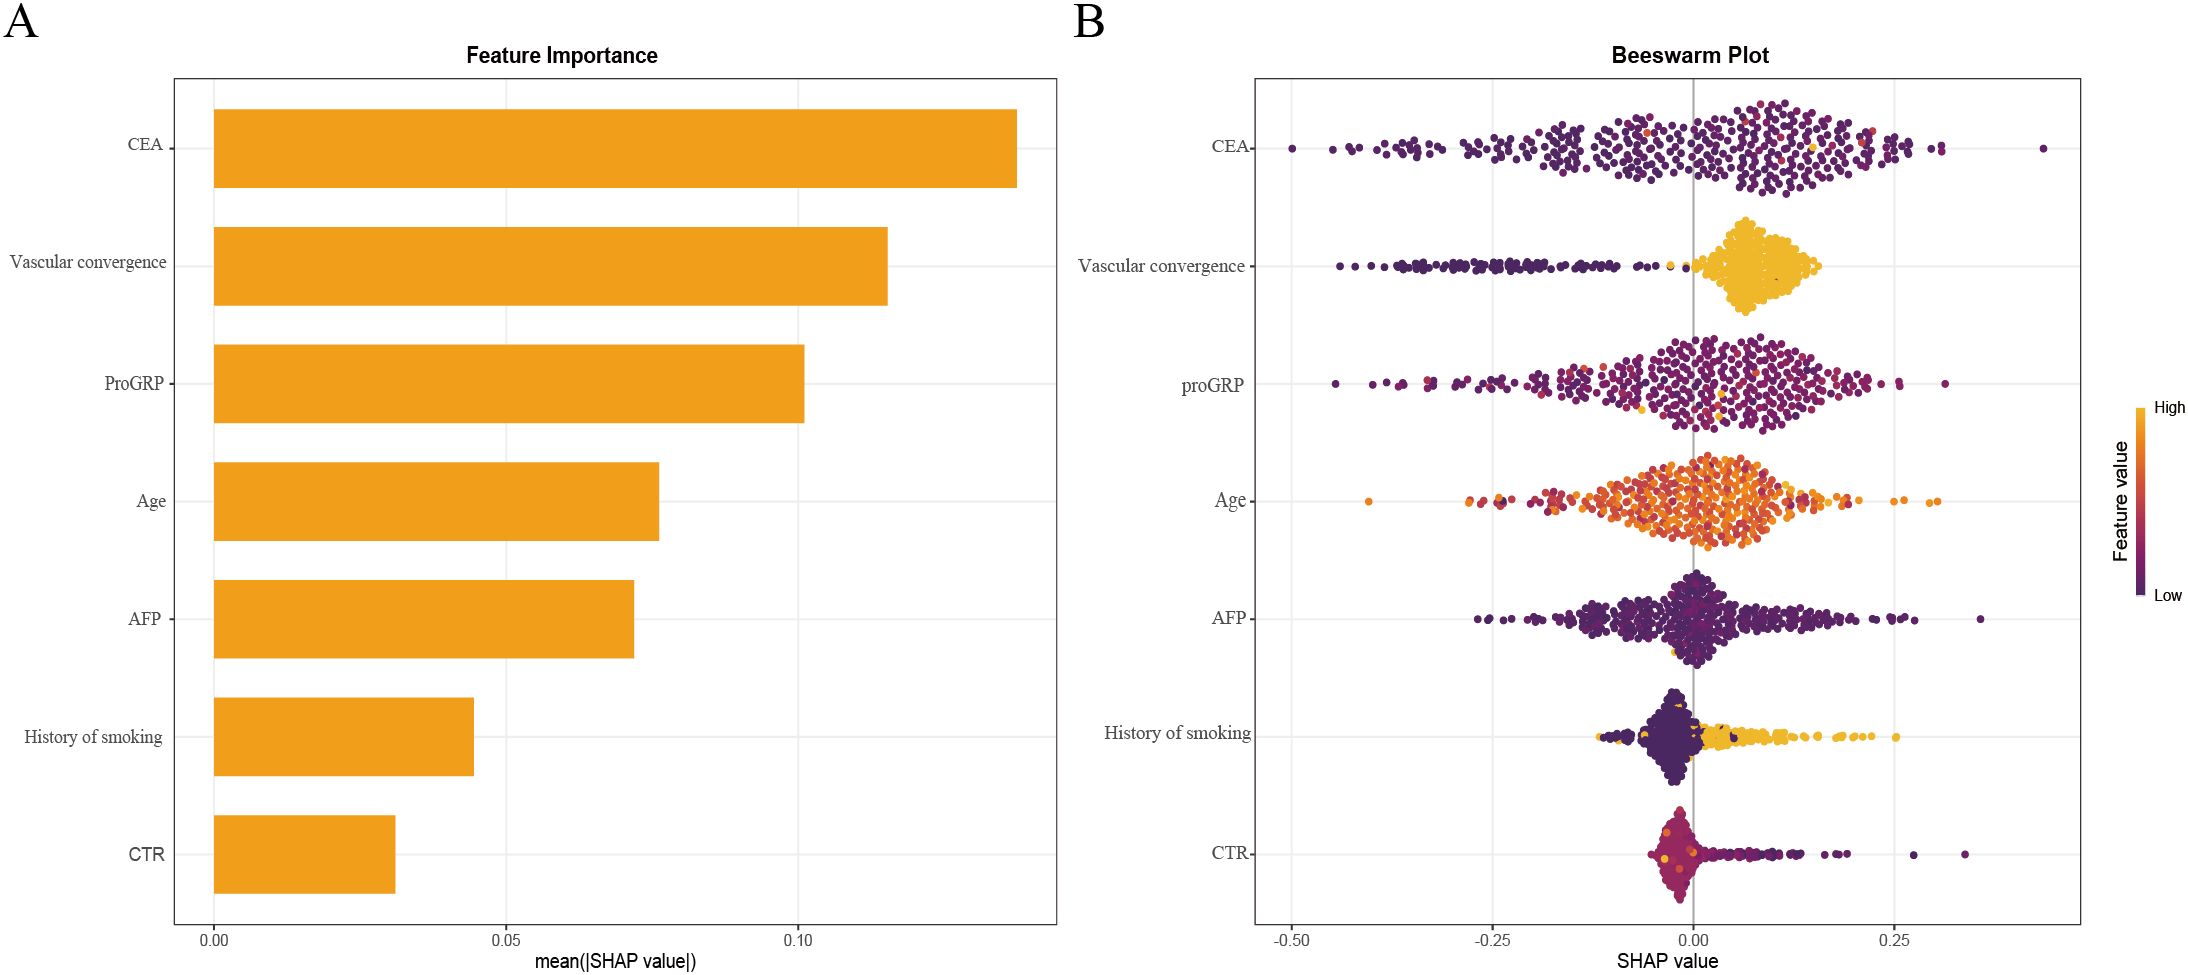
Figure 6. XGBoost model interpretability using SHAP.SHAP summary bar plot ranking feature importance (A). SHAP summary dot plot illustrating feature contributions (B). Each dot represents an individual patient’s SHAP value for a given feature, with color intensity indicating the feature’s actual value. Higher SHAP values reflect an increased probability of STAS positivity.
To facilitate clinical utility, a final prediction nomogram was constructed using the seven predictive variables (CEA, vascular convergence, proGRP, age, AFP, smoking history, CTR) and implemented in a web-based application for clinical use. The web application is accessible online at: https://cuncun.shinyapps.io/DynNomapp/.
Discussion
This study presents a retrospective analysis of clinical features associated with STAS in stage I lung adenocarcinoma, utilizing seven risk factors (CEA, vascular convergence, proGRP, age, AFP, smoking history, and CTR) to develop predictive models. We compared seven machine learning models, with AdaBoost demonstrating the best diagnostic performance. However, XGBoost exhibited superior discriminatory power and predictive accuracy, We employed the SHAP function to visualize model interpretability, thereby enhancing the model’s transparency.
Our study has several advantages (1). Multi-center design: This is a multi-center retrospective study leveraging preoperative clinical indicators to predict STAS in stage I lung adenocarcinoma, aiming to develop a predictive model for assessing STAS risk. (2) Clinical variables: Unlike radiomics-based studies, the clinical variables (27, 28), used in this model are easily accessible, significantly improving the model’s generalizability. Additionally, we developed a web-based nomogram, which facilitates practical use in clinical settings. (3) Superior interpretability: Compared to other ML models, our nomogram shows similar diagnostic performance but offers superior interpretability and operational ease.
STAS has emerged as a critical pathological feature linked to local recurrence and poor prognosis in lung cancer (10, 29, 30). It is a powerful independent predictor of recurrence and prognosis in stage I lung adenocarcinoma. STAS-positive patients exhibit significantly worse postoperative outcomes than STAS-negative patients in stage IA, with prognosis approaching that of stage IB patients (31, 32). STAS also predicts recurrence and prognosis in stage I lung squamous cell carcinoma, although this association does not extend to stages II–III (8). Radiologically, the presence of solid components correlates with higher STAS risk, with a threefold increase in STAS risk for every 1% increase in the solid component of the tumor (33).
Surgical outcomes are significantly influenced by STAS. In T1N0M0 lung adenocarcinoma, patients with STAS who undergo sublobar resection have higher recurrence rates and lung cancer–specific mortality than those treated with lobectomy (34). Moreover, among sublobar approaches, wedge resection is associated with inferior OS and RFS compared with segmentectomy or lobectomy (11). Therefore, accurate preoperative identification of STAS-positive patients is crucial for surgical decision-making—particularly when considering sublobar resection—as failure to recognize STAS preoperatively may lead to undertreatment and a substantially increased risk of recurrence. Patients at high predicted risk may be considered for lobectomy to mitigate recurrence risk.
Our study identified several predictive factors, including baseline characteristics, CT imaging features and tumor markers, Smoking, the most significant risk factor for lung cancer, has been linked to increased STAS risk, particularly in older patients (10, 32). However, the exact relationship between smoking, age, and STAS positivity remains unclear and warrants further investigation.
Tumor markers, including CEA, proGRP, AFP reflect tumor biology and systemic disease burden (35). CEA, a glycoprotein associated with cell adhesion, is typically absent in healthy adult blood (36). Our feature interpretability analysis revealed CEA as the most significant factor in the XGBoost model, which is consistent with findings from other studies (37, 38). High CEA expression can promote epithelial-mesenchymal transition (EMT) by modulating various signaling molecules within the EMT pathway. During EMT, tumor cells lose epithelial adhesion markers and gain mesenchymal markers, enhancing motility and invasiveness, which in turn increases STAS likelihood (31, 39).
ProGRP plays a vital role in diagnosing and subtyping lung cancer (40), particularly in small cell lung cancer(SCLC). It has been widely applied as a biomarker for SCLC diagnosis, monitoring, and evaluation of treatment response (41, 42), and is also considered an effective marker for diagnosing lung neuroendocrine neoplasms (43). Recent studies further suggest that ProGRP, when combined with artificial intelligence approaches, can accurately predict lung cancer risk (44). Nevertheless, the role of ProGRP in lung adenocarcinoma remains insufficiently understood, and further research is warranted to clarify its potential diagnostic and prognostic value.
AFP is a glycoprotein originally identified as the first oncoprotein and is now widely used as a biomarker in hepatocellular carcinoma screening (45, 46), Elevated serum AFP levels have also been reported in some patients with primary lung cancer (47, 48), and extremely high concentrations are a distinguishing feature of hepatoid adenocarcinoma of the lung (49), However, the intrinsic relationship between AFP and lung adenocarcinoma remains poorly understood and warrants further investigation.
Vascular convergence has been identified as a strong indicator of STAS, appearing frequently in STAS-positive patients (50, 51).
The aggressiveness of lung cancer is also linked to the proportion of solid tumor components observed on CT, a higher solid component indicates a more significant, CTR have a positive correlation with STAS (32, 52) and as the most accurate CT characteristic for forecasting STAS in lung adenocarcinomas measuring ≤2 cm (53). Our research shows that an increase in solid components is an independent predictor of STAS, significantly heightening the risk, consistent with previous studies.
In this study, we utilized clinical baseline characteristics, imaging characteristics and tumor markers to develop various machine learning models to preoperatively predict the presence of STAS preoperatively. the XGBoost model, which effectively manages high-dimensional data and complex interactions, showed superior performance, with the predicted values aligning closely with actual results. The SHAP algorithm was used to enhance model interpretability, making the results more accessible to clinicians.
Previous studies based on CT radiomics models have faced challenges due to the low incidence of STAS and the typically single-center design of such studies, limiting their generalizability. Multi-center studies have also struggled with robustness (28, 54).
Additionally, radiomics models often suffer from a lack of interpretability, creating a “black box” effect that reduces clinical confidence. In contrast, the clinical variables in our model are derived from preoperative data and CT images, which are easily accessible. The use of the SHAP algorithm further enhances interpretability, and the model can be accessed through a web-based platform, improving clinical applicability.
Nonetheless, this study has several limitations. First, the retrospective design introduces potential selection bias, highlighting the need for prospective validation. Second, although external validation was performed, it was derived from a single-center cohort, which limits the generalizability of the findings. Third, the relatively small sample size raises concerns about potential overfitting of the model, and the lack of long-term follow-up further restricts the strength of the conclusions. In addition, pure GGO nodules and patients with multiple nodules were excluded; future investigations should develop strategies to better evaluate STAS in these subgroups. Overall, larger multi-center prospective studies with extended follow-up are required to confirm and extend our findings. However, the web-based tool developed in this study has not yet undergone prospective, multi-center validation or formal clinical impact assessment, and thus its clinical applicability remains preliminary. At this stage, it should be regarded as a research prototype rather than a tool to guide individual patient care.
The predictive models based on XGBoost regression demonstrated significant preoperative predictive accuracy for STAS in stage I LUAD solid and part-solid nodules. The application of SHAP analysis augmented the model’s interpretability by establishing associations between predictions and relevant clinical variables, thereby enhancing its clinical applicability. This interpretable model offers a promising tool for personalized preoperative surgical planning and tailored postoperative management.
Data availability statement
The raw data supporting the conclusions of this article will be made available by the authors, without undue reservation.
Ethics statement
The Ethics Committee of Northern Jiangsu People’s Hospital reviewed and approved this retrospective study involving human participants. A waiver of informed consent was granted in accordance with national regulations and institutional policies, as the research design utilized anonymized archival data without new interventions.
Author contributions
Q-LR: Software, Writing – review & editing, Writing – original draft, Investigation, Resources, Formal analysis, Methodology, Conceptualization, Visualization, Validation. LL: Writing – review & editing, Investigation, Writing – original draft, Data curation, Validation, Visualization, Conceptualization, Methodology. KC: Data curation, Software, Conceptualization, Writing – review & editing, Resources, Visualization. X-RX: Methodology, Software, Conceptualization, Visualization, Validation, Writing – review & editing. H-JW: Writing – review & editing, Investigation, Methodology, Formal analysis. JW: Writing – review & editing, Conceptualization, Methodology. J-ZY: Writing – review & editing, Conceptualization, Validation, Visualization, Methodology. J-XH: Methodology, Writing – review & editing, Investigation, Formal analysis. X-LW: Validation, Project administration, Funding acquisition, Writing – review & editing, Formal analysis, Conceptualization, Methodology, Supervision. Y-SS: Formal analysis, Resources, Project administration, Investigation, Data curation, Methodology, Conceptualization, Writing – review & editing.
Funding
The author(s) declare financial support was received for the research and/or publication of this article. This study was supported by the Jiangsu Provincial Health Commission Research Project on Elderly Health (LKZ2022019), the Suqian Sci&Tech Program (Grant No. Z2023119), the Yangzhou Social Development and Clinical Frontier Technology Project (YZ2023084 and YZ2021078),and the Yangzhou Innovation Capability Building Design Plan Project (YZ2022168).
Acknowledgments
We extend our gratitude to all authors for their valuable contributions to this manuscript.
Conflict of interest
The authors declare that the research was conducted in the absence of any commercial or financial relationships that could be construed as a potential conflict of interest.
Generative AI statement
The author(s) declare that Generative AI was used in the creation of this manuscript. Generative AI was used solely for language polishing and grammar refinement during manuscript preparation. No AI tools were used for data analysis, interpretation, or generation of scientific content. The authors take full responsibility for the integrity and accuracy of the manuscript.
Any alternative text (alt text) provided alongside figures in this article has been generated by Frontiers with the support of artificial intelligence and reasonable efforts have been made to ensure accuracy, including review by the authors wherever possible. If you identify any issues, please contact us.
Publisher’s note
All claims expressed in this article are solely those of the authors and do not necessarily represent those of their affiliated organizations, or those of the publisher, the editors and the reviewers. Any product that may be evaluated in this article, or claim that may be made by its manufacturer, is not guaranteed or endorsed by the publisher.
Supplementary material
The Supplementary Material for this article can be found online at: https://www.frontiersin.org/articles/10.3389/fonc.2025.1682633/full#supplementary-material
Supplementary Figure 1 | Calibration curves of seven machine learning models in the training set (A) and validation set (B). Closer alignment of the curves with the diagonal line indicates better agreement between predicted and observed probabilities.
Abbreviations
AdaBoost, Adaptive boosting; AFP, Alpha-fetoprotein; AUC, Area under the receiver operating characteristics curve; CA125, Carbohydrate antigen 125; CatBoost, Categorical boosting; CEA, Carcinoembryonic antigen; CTR, Consolidation/Tumor Ratio; cyfra21-1, Cytokeratin 19 Fragment 21-1; DCA, Decision curve analysis; DLCO, Diffusing Capacity of the Lungs for Carbon Monoxide; FEV1, Forced Expiratory Volume in 1 second; GGO, Pure Ground-Glass Opacity; LASSO, Least absolute shrinkage and selection operator; LightGBM, Light Gradient Boosting Machine; LLL, Left Lower Lobe; LUAD, Lung adenocarcinoma; LUL, Left Upper Lobe; ML, Machine Learning; MLR, Monocyte to Lymphocyte Ratio; mRMR, Maximum Relevance Minimum Relevance; NLR, Neutrophil to Lymphocyte Ratio; NSCLC, Non-Small Cell Lung Cancer; NSE, Neuron-Specific Enolase; OS, Overall survival; PLR, Platelet to Lymphocyte Ratio; proGRP, Pro-Gastrin-Releasing Peptide; RFS, Recurrence-Free Survival; RLL, Right Lower Lobe; RML,Right Middle Lobe; RUL, Right Upper Lobe; SHAP, Shapley Additive Explanations; STAS, Spread Through Air Spaces; SVM, Support Vector Machine; WBC, White Blood Cell; XGBoost, Extreme Gradient Boosting.
References
1. Han B, Zheng R, Zeng H, Wang S, Sun K, Chen R, et al. Cancer incidence and mortality in China, 2022. J Natl Cancer Center. (2024) 4:47–53. doi: 10.1016/j.jncc.2024.01.006
2. Sung H, Ferlay J, Siegel RL, Laversanne M, Soerjomataram I, Jemal A, et al. Global cancer statistics 2020: globocan estimates of incidence and mortality worldwide for 36 cancers in 185 countries. CA: A Cancer J Clin. (2021) 71:209–49. doi: 10.3322/caac.21660
3. Travis WD, Brambilla E, and Riely GJ. New pathologic classification of lung cancer: relevance for clinical practice and clinical trials. J Clin Oncol. (2013) 31:992–1001. doi: 10.1200/JCO.2012.46.9270
4. Altorki N, Wang X, Damman B, Mentlick J, Landreneau R, Wigle D, et al. Lobectomy, segmentectomy, or wedge resection for peripheral clinical T1an0 non-small cell lung cancer: A post hoc analysis of calgb 140503 (Alliance). J Thorac Cardiovasc Surg. (2024) 167:338–47.e1. doi: 10.1016/j.jtcvs.2023.07.008
5. Warth A, Beasley MB, and Mino-Kenudson M. Breaking new ground: the evolving concept of spread through air spaces (Stas). J Thorac Oncol. (2017) 12:176–8. doi: 10.1016/j.jtho.2016.10.020
6. Travis WD, Brambilla E, Nicholson AG, Yatabe Y, Austin JHM, Beasley MB, et al. The 2015 world health organization classification of lung tumors: impact of genetic, clinical and radiologic advances since the 2004 classification. J Thorac Oncol. (2015) 10:1243–60. doi: 10.1097/JTO.0000000000000630
7. Ding Y, Chen Y, Wen H, Li J, Chen J, Xu M, et al. Pretreatment prediction of tumour spread through air spaces in clinical stage I non-small-cell lung cancer. Eur J Cardio-thoracic Surg. (2022) 62:ezac248. doi: 10.1093/ejcts/ezac248
8. Yanagawa N, Shiono S, Endo M, and Ogata S-Y. Tumor Spread through Air Spaces Is a Useful Predictor of Recurrence and Prognosis in Stage I Lung Squamous Cell Carcinoma, but Not in Stage Ii and Iii. Lung Cancer (amsterdam Netherlands). (2018) 120:14–21. doi: 10.1016/j.lungcan.2018.03.018
9. Kadota K, Nitadori J-I, Sima CS, Ujiie H, Rizk NP, Jones DR, et al. Tumor Spread through Air Spaces Is an Important Pattern of Invasion and Impacts the Frequency and Location of Recurrences after Limited Resection for Small Stage I Lung Adenocarcinomas. J Thorac Oncol. (2015) 10:806–14. doi: 10.1097/JTO.0000000000000486
10. Khalil HA, Shi W, Mazzola E, Lee DN, Norton-Hughes E, Dolan D, et al. Analysis of recurrence in lung adenocarcinoma with spread through air spaces. J Thorac Cardiovasc Surg. (2023) 166:1317–28.e4. doi: 10.1016/j.jtcvs.2023.01.030
11. Ikeda T, Kadota K, Go T, Misaki N, Haba R, and Yokomise H. Segmentectomy provides comparable outcomes to lobectomy for stage ia non-small cell lung cancer with spread through air spaces. Semin Thorac Cardiovasc Surg. (2023) 35:156–63. doi: 10.1053/j.semtcvs.2022.02.001
12. Eguchi T, Kameda K, Lu S, Bott MJ, Tan KS, Montecalvo J, et al. Lobectomy Is Associated with Better Outcomes Than Sublobar Resection in Spread through Air Spaces (Stas)-Positive T1 Lung Adenocarcinoma: A propensity Score-Matched Analysis. J Thorac Oncol. (2019) 14:87–98. doi: 10.1016/j.jtho.2018.09.005
13. Dai Z-Y, Shen C, Wang X, Wang F-Q, and Wang Y. Could less be enough: sublobar resection vs lobectomy for clinical stage ia non-small cell lung cancer patients with visceral pleural invasion or spread through air spaces. Int J Surg (london England). (2025) 111:2675–85. doi: 10.1097/JS9.0000000000002249
14. Deo RC. Machine learning in medicine. Circulation. (2015) 132:1920–30. doi: 10.1161/CIRCULATIONAHA.115.001593
15. Greener JG, Kandathil SM, Moffat L, and Jones DT. A guide to machine learning for biologists. Nat Rev Mol Cell Biol. (2022) 23:40–55. doi: 10.1038/s41580-021-00407-0
16. Hasegawa M, Sakai F, Ishikawa R, Kimura F, Ishida H, and Kobayashi K. Ct features of epidermal growth factor receptor-mutated adenocarcinoma of the lung: comparison with nonmutated adenocarcinoma. J Thorac Oncol. (2016) 11:819–26. doi: 10.1016/j.jtho.2016.02.010
17. Toyokawa G, Takada K, Okamoto T, Shimokawa M, Kozuma Y, Matsubara T, et al. Computed tomography features of lung adenocarcinomas with programmed death ligand 1 expression. Clin Lung Cancer. (2017) 18:e375–e83. doi: 10.1016/j.cllc.2017.03.008
18. Zhou JY, Zheng J, Yu ZF, Xiao WB, Zhao J, Sun K, et al. Comparative analysis of clinicoradiologic characteristics of lung adenocarcinomas with alk rearrangements or egfr mutations. Eur Radiol. (2015) 25:1257–66. doi: 10.1007/s00330-014-3516-z
19. Ma X, He W, Chen C, Tan F, Chen J, Yang L, et al. A ct-based deep learning model for preoperative prediction of spread through air spaces in clinical stage I lung adenocarcinoma. Front Oncol. (2024) 14:1482965. doi: 10.3389/fonc.2024.1482965
20. Amin MB, Greene FL, Edge SB, Compton CC, Gershenwald JE, Brookland RK, et al. The eighth edition ajcc cancer staging manual: continuing to build a bridge from a population-based to a more “Personalized” Approach to cancer staging. CA: A Cancer J Clin. (2017) 67:93–9. doi: 10.3322/caac.21388
21. Zhang Y, Ding C, and Li T. Gene selection algorithm by combining relieff and mrmr. BMC Genomics. (2008) 9 Suppl 2:S27. doi: 10.1186/1471-2164-9-S2-S27
22. Li S, Liu S, Sun X, Hao L, and Gao Q. Identification of endocrine-disrupting chemicals targeting key dcm-associated genes via bioinformatics and machine learning. Ecotoxicol Environ Saf. (2024) 274:116168. doi: 10.1016/j.ecoenv.2024.116168
23. LaValley MP. Logistic regression. Circulation. (2008) 117:2395–9. doi: 10.1161/CIRCULATIONAHA.106.682658
24. Gohari MR, Doggett A, Patte KA, Ferro MA, Dubin JA, Hilario C, et al. Using random forest to identify correlates of depression symptoms among adolescents. Soc Psychiatry Psychiatr Epidemiol. (2024) 59:2063–71. doi: 10.1007/s00127-024-02695-1
25. Hao N, Sun P, Zhao W, and Li X. Application of a developed triple-classification machine learning model for carcinogenic prediction of hazardous organic chemicals to the us, eu, and who based on chinese database. Ecotoxicol Environ Saf. (2023) 255:114806. doi: 10.1016/j.ecoenv.2023.114806
26. Wang J, Chen H, Wang H, Liu W, Peng D, Zhao Q, et al. A risk prediction model for physical restraints among older chinese adults in long-term care facilities: machine learning study. J Med Internet Res. (2023) 25:e43815. doi: 10.2196/43815
27. Lin M-W, Chen L-W, Yang S-M, Hsieh M-S, Ou D-X, Lee Y-H, et al. Ct-based deep-learning model for spread-through-air-spaces prediction in ground glass-predominant lung adenocarcinoma. Ann Surg Oncol. (2024) 31:1536–45. doi: 10.1245/s10434-023-14565-2
28. Liao G, Huang L, Wu S, Zhang P, Xie D, Yao L, et al. Preoperative ct-based peritumoral and tumoral radiomic features prediction for tumor spread through air spaces in clinical stage I lung adenocarcinoma. Lung Cancer (amsterdam Netherlands). (2022) 163. doi: 10.1016/j.lungcan.2021.11.017
29. Chae M, Jeon JH, Chung J-H, Lee SY, Hwang WJ, Jung W, et al. Prognostic Significance of Tumor Spread through Air Spaces in Patients with Stage Ia Part-Solid Lung Adenocarcinoma after Sublobar Resection. Lung Cancer (amsterdam Netherlands). (2021) 152:21–6. doi: 10.1016/j.lungcan.2020.12.001
30. Laville D, Désage A-L, Fournel P, Bayle-Bleuez S, Neifer C, Picot T, et al. Spread through Air Spaces in Stage I to Iii Resected Lung Adenocarcinomas: Should the Presence of Spread through Air Spaces Lead to an Upstaging? Am J Surg Pathol. (2024) 48:596–604. doi: 10.1097/PAS.0000000000002188
31. Luo Y, Ding W, Yang X, Bai H, Jiao F, Guo Y, et al. Construction and validation of a predictive model for meningoencephalitis in pediatric scrub typhus based on machine learning algorithms. Emerging Microbes Infections. (2025) 14:2469651. doi: 10.1080/22221751.2025.2469651
32. Toyokawa G, Yamada Y, Tagawa T, Kozuma Y, Matsubara T, Haratake N, et al. Significance of spread through air spaces in resected pathological stage I lung adenocarcinoma. Ann Thorac Surg. (2018) 105:1655–63. doi: 10.1016/j.athoracsur.2018.01.037
33. Gao Z, An P, Li R, Wu F, Sun Y, Wu J, et al. Development and validation of a clinic-radiological model to predict tumor spread through air spaces in stage I lung adenocarcinoma. Cancer Imaging. (2024) 24:25. doi: 10.1186/s40644-024-00668-w
34. David EA, Atay SM, McFadden PM, and Kim AW. Sublobar or suboptimal: does tumor spread through air spaces signify the end of sublobar resections for T1n0 adenocarcinomas? J Thorac Oncol. (2019) 14:11–2. doi: 10.1016/j.jtho.2018.11.001
35. Varadhachary GR, Abbruzzese JL, and Lenzi R. Diagnostic strategies for unknown primary cancer. Cancer. (2004) 100:1776–85. doi: 10.1002/cncr.20202
36. Konstantopoulos K and Thomas SN. Cancer cells in transit: the vascular interactions of tumor cells. Annu Rev Biomed Eng. (2009) 11:177–202. doi: 10.1146/annurev-bioeng-061008-124949
37. Wang J, Yao Y, Tang D, and Gao W. An individualized nomogram for predicting and validating spread through air space (Stas) in surgically resected lung adenocarcinoma: A single center retrospective analysis. J Cardiothor Surg. (2023) 18:337. doi: 10.1186/s13019-023-02458-0
38. Wang Y, Lyu D, Zhang D, Hu L, Wu J, Tu W, et al. Nomogram based on clinical characteristics and radiological features for the preoperative prediction of spread through air spaces in patients with clinical stage ia non-small cell lung cancer: A multicenter study. Diagn Interventional Radiol (ankara Turkey). (2023) 29:771–85. doi: 10.4274/dir.2023.232404
39. Yoshikawa M, Morine Y, Ikemoto T, Imura S, Higashijima J, Iwahashi S, et al. Elevated preoperative serum cea level is associated with poor prognosis in patients with hepatocellular carcinoma through the epithelial-mesenchymal transition. Anticancer Res. (2017) 37:1169–75. doi: 10.21873/anticanres.11430
40. Korkmaz ET, Koksal D, Aksu F, Dikmen ZG, Icen D, Maden E, et al. Triple test with tumor markers cyfra 21.1, he4, and progrp might contribute to diagnosis and subtyping of lung cancer. Clin Biochem. (2018) 58:15–9. doi: 10.1016/j.clinbiochem.2018.05.001
41. Zeng Q, Liu M, Zhou N, Liu L, and Song X. Serum human epididymis protein 4 (He4) may be a better tumor marker in early lung cancer. Clin Chim Acta; Int J Clin Chem. (2016) 455:102–6. doi: 10.1016/j.cca.2016.02.002
42. Wojcik E and Kulpa JK. Pro-gastrin-releasing peptide (Progrp) as a biomarker in small-cell lung cancer diagnosis, monitoring and evaluation of treatment response. Lung Cancer (Auckl). (2017) 8:231–40. doi: 10.2147/LCTT.S149516
43. Rosiek V, Kogut A, and Kos-Kudła B. Pro-gastrin-releasing peptide as a biomarker in lung neuroendocrine neoplasm. Cancers (Basel). (2023) 15. doi: 10.3390/cancers15133282
44. Hu W, Zhang X, Saber A, Cai Q, Wei M, Wang M, et al. Development and validation of a nomogram model for lung cancer based on radiomics artificial intelligence score and clinical blood test data. Front In Oncol. (2023) 13:1132514. doi: 10.3389/fonc.2023.1132514
45. Yeo YH, Lee Y-T, Tseng H-R, Zhu Y, You S, Agopian VG, et al. Alpha-fetoprotein: past, present, and future. Hepatol Commun. (2024) 8. doi: 10.1097/HC9.0000000000000422
46. Force M, Park G, Chalikonda D, Roth C, Cohen M, Halegoua-DeMarzio D, et al. Alpha-fetoprotein (Afp) and afp-L3 is most useful in detection of recurrence of hepatocellular carcinoma in patients after tumor ablation and with low afp level. Viruses. (2022) 14. doi: 10.3390/v14040775
47. Gavrancic T and Park Y-HA. A novel approach using sorafenib in alpha fetoprotein-producing hepatoid adenocarcinoma of the lung. J Natl Compr Canc Netw. (2015) 13. doi: 10.6004/jnccn.2015.0054
48. Yamagata T, Yamagata Y, Nakanishi M, Matsunaga K, Minakata Y, and Ichinose M. A case of primary lung cancer producing alpha-fetoprotein. Can Respir J. (2004) 11:504–6. doi: 10.1155/2004/510350
49. Grossman K, Beasley MB, and Braman SS. Hepatoid adenocarcinoma of the lung: review of a rare form of lung cancer. Respir Med. (2016) 119:175–9. doi: 10.1016/j.rmed.2016.09.003
50. Yang Y, Li L, Hu H, Zhou C, Huang Q, Zhao J, et al. A nomogram integrating the clinical and ct imaging characteristics for assessing spread through air spaces in clinical stage ia lung adenocarcinoma. Front Immunol. (2025) 16:1519766. doi: 10.3389/fimmu.2025.1519766
51. Gu Y, Zheng B, Zhao T, and Fan Y. Computed tomography features and tumor spread through air spaces in lung adenocarcinoma: A meta-analysis. J Thorac Imaging. (2023) 38:W19–29. doi: 10.1097/RTI.0000000000000693
52. Qin L, Sun Y, Zhu R, Hu B, and Wu J. Clinicopathological and ct features of tumor spread through air space in invasive lung adenocarcinoma. Front Oncol. (2022) 12:959113. doi: 10.3389/fonc.2022.959113
53. Qi L, Xue K, Cai Y, Lu J, Li X, and Li M. Predictors of ct morphologic features to identify spread through air spaces preoperatively in small-sized lung adenocarcinoma. Front Oncol. (2020) 10:548430. doi: 10.3389/fonc.2020.548430
54. Yu W, Yun D, Xin L, Xin L, Xiap J, Jiu L, et al. Preoperative ct-based radiomics combined with tumour spread through air spaces can accurately predict early recurrence of stage I lung adenocarcinoma: A multicentre retrospective cohort study. Cancer Imaging. (2023) 23. doi: 10.1186/s40644-023-00605-3
Keywords: spread through air spaces, lung adenocarcinoma, machine learning, solid and part solid component, surgical strategy
Citation: Ren Q-L, Lin L, Chu K, Xu X-R, Wang H-J, Wu J, You J-Z, Hu J-X, Wang X-L and Shu Y-S (2025) Development and validation of machine learning models for predicting STAS in stage I lung adenocarcinoma with part-solid and solid nodules: a two-center study. Front. Oncol. 15:1682633. doi: 10.3389/fonc.2025.1682633
Received: 09 August 2025; Accepted: 17 October 2025;
Published: 29 October 2025.
Edited by:
Yeon Wook Kim, Seoul National University, Republic of KoreaReviewed by:
Konstantinos Gioutsos, Inselspital University Hospital Bern, SwitzerlandXiangkui Li, Harbin University of Science and Technology, China
Copyright © 2025 Ren, Lin, Chu, Xu, Wang, Wu, You, Hu, Wang and Shu. This is an open-access article distributed under the terms of the Creative Commons Attribution License (CC BY). The use, distribution or reproduction in other forums is permitted, provided the original author(s) and the copyright owner(s) are credited and that the original publication in this journal is cited, in accordance with accepted academic practice. No use, distribution or reproduction is permitted which does not comply with these terms.
*Correspondence: Yu-Sheng Shu, MTgwNTEwNjE5OTlAeXp1LmVkdS5jbg==; Xiao-Lin Wang, MTgwNTEwNjM5MDlAeXp1LmVkdS5jbg==
†These authors have contributed equally to this work and share first authorship