 Wei Zhu
 Juan Ji2†
- 1Department of General Surgery, The First Affiliated Hospital of Soochow University, Suzhou, China
- 2Wound Care Clinic, The First Affiliated Hospital of Soochow University, Suzhou, China
- 3Department of Nursing, The Fourth Affiliated Hospital of Soochow University, Suzhou, China
- 4Department of Nursing, The First Affiliated Hospital of Soochow University, Suzhou, China
Purpose: Frailty can impact the prognosis of cancer patients. We aimed to elucidate longitudinal frailty trajectories in cancer patients undergoing immunotherapy and to analyze the factors influencing these trajectories.
Methods: A prospective observational cohort study was conducted among cancer patients scheduled for immunotherapy from December 2022 to November 2023. Sociodemographic and disease-related information was collected. The Chinese version of the Tilburg Frailty Indicator, the Activities of Daily Living scale, the Hospital Anxiety and Depression Scale, the Nutritional Risk Screening 2002, and the Social Support Rating Scale were used to assess patients before the first immunotherapy session (T0) and 1 week after each subsequent immunotherapy session until the sixth cycle (T1–T6). A growth mixed model was applied to explore frailty trajectories. Univariate and multivariate logistic regression analyses were performed to identify variables associated with each trajectory.
Results: A total of 205 patients completed the treatment cycles and were included in the analysis. The overall frailty score demonstrated significant changes (p = 0.037), with an initial increase followed by a subsequent decrease during the six treatment cycles. Four distinct frailty trajectories were identified: the “persistently non-frail group” (Class 1), the “persistently frail group” (Class 2), the “frailty deterioration–remission group” (Class 3), and the “frailty remission–deterioration group” (Class 4). Compared with Class 1, patients in Class 2 were more likely to have nutritional risk (odds ratio [OR] = 4.173, 95% confidence interval [CI]: 1.637–12.664) and live in rural areas (OR = 6.869, 95% CI: 2.589–18.223), while the likelihood of being male was significantly lower (OR = 0.365, 95%, CI: 0.136–0.982). In Class 3, more patients had depression (OR = 6.663, 95% CI: 2.266–19.592), had low social support (OR = 9.483, 95% CI: 1.493–60.249), and were dependent on their spouses (OR = 5.728, 95% CI: 1.584–20.716) or their children for care (OR = 7.847, 95% CI: 1.994–30.885); however, being male and the presence of anxiety were associated with lower odds (OR = 0.316, 95% CI: 0.122–0.815; OR = 0.281, 95% CI: 0.100–0.789, respectively). Patients with distant tumor metastasis (OR = 12.712, 95% CI: 2.930–53.988), pre-treatment frailty (OR = 8.427, 95% CI: 1.973–36.003), and no history of chemotherapy (OR = 0.182, 95% CI: 0.033–0.994) were more likely to be in Class 4.
Conclusions: There was significant heterogeneity in the frailty trajectories of cancer patients undergoing immunotherapy. Identifying factors associated with different frailty trajectories is crucial for implementing targeted interventions to improve prognosis in these patients.
Introduction
According to the International Agency for Research on Cancer (1, 2), the number of new cancer cases in China was approximately 4.57 million in 2020, accounting for 23.7% of all cases worldwide. The number of cancer-related deaths was approximately 3 million, representing 30% of global cancer deaths. With an aging population, the prevalence of cancer is expected to continue increasing. The prevention and treatment of cancer have therefore become major public health concerns.
In recent years, in addition to traditional surgery, chemotherapy, and radiotherapy, immunotherapy—represented by immune checkpoint inhibitors (ICIs)—has developed rapidly. Programmed death receptor 1 (PD-1), programmed death ligand 1 (PD-L1), and cytotoxic T-lymphocyte–associated protein 4 (CTLA-4) inhibitors, which activate T cells by blocking the interaction between immune checkpoint proteins and inhibitory antibodies, thereby killing cancer cells. These agents have been widely used in patients with lung, esophageal, colorectal, gallbladder, and head and neck cancers (3). Immunotherapy has brought substantial survival benefits to patients, with reported objective remission rates reaching up to 80% (4, 5). However, similar to other treatments, immunotherapy can also result in adverse outcomes. Frailty, as one of the serious health issues in patients undergoing immunotherapy, has recently drawn considerable attention (6).
In patients with cancer, accelerated aging of the immune system and excessive release of inflammatory cytokines can lead to reduced physiological reserve (7). In addition, these patients often have abnormal nutrient metabolism (8). All of these factors can contribute to frailty. Frailty is a state of reduced physiological reserve and increased vulnerability to stressors, with an elevated risk of adverse outcomes (9). It is characterized by decreased body mass, fatigue, reduced physical activity, and depressed mood (10). The risk of frailty in patients undergoing immunotherapy is high, with reported incidence rates ranging from 27.7% to 75% (11, 12). Studies have shown that frailty not only leads to a significant reduction in patients’ physical function and daily activities but also affects their quality of life (13). In addition, frailty also prolongs the hospitalization time, increases the medical costs, and may even lead to treatment interruption or fatal immune-related adverse events (irAEs), which seriously affect patient prognosis of patients (14–16).
However, most current studies on frailty in patients receiving immunotherapy are cross-sectional (8) and therefore unable to capture the dynamic progression of frailty in individuals who may experience profound biopsychosocial changes during treatment (17). Moreover, heterogeneity in frailty change trajectories among different individuals makes it difficult to draw definitive conclusions (18). Longitudinal studies incorporating a growth mixture model (GMM) can identify and classify frailty trajectories in different patients (19, 20), thereby facilitating the early identification of those at high risk for frailty and enabling the development of targeted interventions tailored to specific trajectory patterns.
Therefore, we conducted a longitudinal study to track and examine frailty trends in cancer patients undergoing immunotherapy. Our objectives were to elucidate potential categories of frailty trajectories and to analyze the factors influencing these trajectories, to provide recommendations for the early detection of frailty and the implementation of precise interventions in this patient population.
Methods
Study design and participant selection
We performed a prospective observational cohort study in patients scheduled for immunotherapy at the oncology and radiotherapy departments of a tertiary care hospital, the First Affiliated Hospital of Soochow University, in Suzhou, Jiangsu, China, between December 2022 and November 2023. The study protocol was approved by the Ethics Review Committee of Soochow University (approval No. SUDA20221228H12). The researcher explained the purpose and process of the study, as well as privacy protection measures, to eligible patients. Informed consent was obtained from every study participant.
The inclusion criteria were as follows: 1) patients aged 18 years or older; 2) a diagnosis of malignant tumors based on pathologic reports; 3) hospitalization for first-time immunotherapy; 4) normal cognitive function and communication skills; and. 5) patients scheduled for immunotherapy alone or in combination with chemotherapy, radiotherapy, or antiangiogenic therapy, as well as those scheduled for dual immune checkpoint therapy. Patients were excluded if they had 1) severe mental illness or 2) complications, including serious physical illnesses or organ dysfunction. In addition, the following patients were excluded from the final study analysis: 1) those who died, suffered serious complications, or became sicker and were unable to remain in the study; 2) those whose treatment changed or who were transferred to another hospital; or 3) those who did not complete the treatment cycle, withdrew, or were lost to follow-up during the study period.
Sample size calculation
According to the principle of sample size estimation for multifactor analysis, the sample size is usually at least 10–15 times the number of independent variables. In this study, the number of independent variables was 20. Therefore, we targeted a sample size of 20 variables × 10 = 200 cases. In addition, based on the Bayesian information criterion (BIC) as a fitness indicator, the sample size should be at least 200. Considering a 20% loss during the follow-up period, the final sample size was determined to be 240 cases.
Study protocol
Sociodemographic information (sex, age, marital status, education level, place of residence, and primary caregiver) and disease-related information (tumor site, disease duration, distant metastasis status, treatment plan, and type of medication) were recorded.
Immunotherapy was administered every 3 weeks (21 days) and continued until disease progression or the development of severely intolerable immune-related adverse events, with a maximum duration of up to 2 years. In this study, the time points for baseline investigation and follow-up were established based on the characteristics of immunotherapy. These time points were before the first use of immune checkpoint inhibitors (T0) and 1 week after each immunotherapy session until the sixth cycle (T1–T6). Immunotherapy patients are usually discharged within 3 days; therefore, face-to-face interviews were conducted at T0, and telephone interviews were performed at T1–T6. At each time point from T0 to T6, we collected the following information.
Tilburg frailty indicator
The TFI was proposed by Gobbens et al. in 2010 (17). The scale covers three dimensions—physical, psychological, and social frailty—with a total of 15 items and a score ranging from 0 to 15. A score of 5 or more indicates frailty, with higher scores reflecting greater severity. The TFI was translated into Chinese by Xi et al. (21), with a Cronbach’s α of 0.686. In this study, the Cronbach’s α was 0.638.
Nutritional risk screening 2002
The NRS 2002 is used to assess nutritional risk and has been validated as a nutritional screening tool in oncology patients (22). It evaluates nutritional status, including body mass index (BMI), recent weight change, and dietary intake, as well as disease severity and age. The total score ranges from 0 to 7, with a score of 3 or more indicating nutritional risk.
Social support rating scale
The SSRS was developed by Xiao et al. in 1994 to assess the level of social support (23). It consists of 10 items in three dimensions: objective support (3 items), subjective support (4 items), and utilization of social support (3 items). Higher total scores indicate greater social support. Scores of ≤22, 23–44, and ≥45 correspond to low, medium, and high levels of social support, respectively. In this study, the Cronbach’s α was 0.834.
Hospital anxiety and depression scale
The HADS was developed by Zigmond et al. to assess psychological distress in individuals (24). The scale consists of two subscales, anxiety (HADS-A) and depression (HADS-D), with each subscale containing seven items. Each item is scored from 0 to 3, and each subscale score ranges from 0 to 21. A HADS-A score of ≥8 or a HADS-D score of ≥8 indicates significant symptoms. In this study, the Cronbach’s α was 0.942.
Activity of daily living scale
The ADL scale was developed by Lawton and Brody in 1969 and consists of two parts: physical self-care and instrumental activities of daily living, with a total of 14 items (25). The total score ranges from 14 to 56. Scores of 14, 15–21, and ≥22 are considered normal, mild to moderate impairment, and severe impairment, respectively. In this study, the Cronbach’s α was 0.926.
Statistical analysis
Data analysis was conducted using SPSS 26.0 (IBM, USA) and Mplus 8.3 (Muthén & Muthén, USA). Continuous variables were presented as mean ± standard deviation or median with interquartile range (IQR) and compared using the Student’s t-test or Mann–Whitney U-test, depending on the results of the normality test results. Categorical variables were presented as numbers and percentages and compared using the chi-square test or Fisher’s exact test. Differences between patients who completed the study and those lost to follow-up were analyzed. Repeated-measures analysis of variance (ANOVA) was used to investigate longitudinal changes from T0 to T6.
The growth mixture model (GMM), which can identify subgroups within heterogeneous populations, was used to explore frailty trajectories. The model fit indices for frailty trajectories included the Akaike information criterion (AIC), Bayesian information criterion (BIC), sample size–adjusted BIC (aBIC), entropy, Lo–Mendell–Rubin likelihood ratio test (LRT), and bootstrap-based likelihood ratio test (BLRT). The best model was determined by combining practical significance with fit indices. Factors influencing the frailty trajectory were first analyzed using univariate analysis. Variables with p ≤ 0.2 in the univariate analysis were subsequently included in a multivariate logistic regression analysis. A p < 0.05 was considered statistically significant.
Results
Patient characteristics
A total of 241 patients were enrolled at T0, with 36 patients dropping out during the study period due to serious illness, death, or changes in the treatment regimen. Ultimately, 205 patients completed the survey at all time points (response rate: 85.1%). Their baseline characteristics are shown in Table 1. The patients’ ages ranged from 34 to 85 years. The majority were male (67.8%) and married (91.2%), with 39.5% having an education level of primary school or lower, 55.6% having a body mass index (BMI) between 18.5 and 23.9 kg/m², 62.4% living in urban areas, and 43.9% depending on their spouses for care. In addition, 118 patients (57.5%) had gastrointestinal tract cancer, and most (75.6%) had no distant cancer metastasis. A majority (58.1%) had a disease duration <6 months, and 60.0% and 29.8% had undergone surgery and chemotherapy, respectively, prior to immunotherapy. Immunotherapy was most commonly combined with chemotherapy (74.6%), and 93.7% of patients used PD-1 inhibitors. Overall, 23.4% were at risk of malnutrition, 44.4% experienced anxiety, 63.9% exhibited symptoms of depression, 45.4% had severe functional impairments, and 15.6% reported low levels of social support.
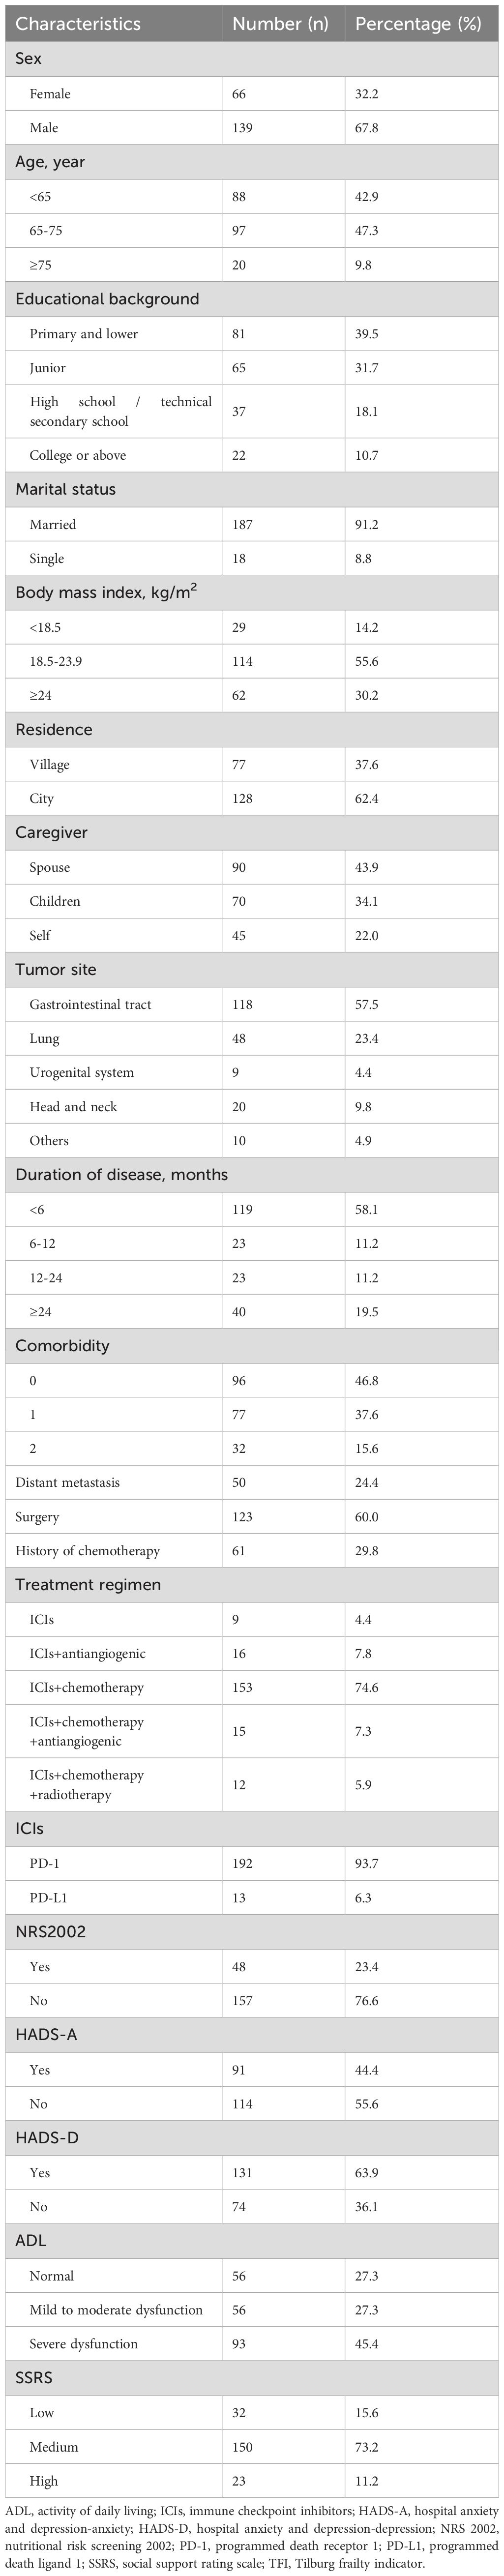
Table 1. Patient baseline characteristics (n=205).
Prevalence of frailty and trajectories of frailty
During immunotherapy, the incidence of frailty in cancer patients from pre-treatment to the sixth treatment cycle (T0–T6) was 53.2%, 63.4%, 67.3%, 63.9%, 63.9%, 61.0%, and 54.1%, respectively (Table 2). Repeated-measures ANOVA results showed that frailty scores differed significantly across the seven time points (p = 0.037). Frailty scores showed an increasing trend from T0 to T3, followed by a decreasing trend to T6, with scores at T6 still higher than those at T0.
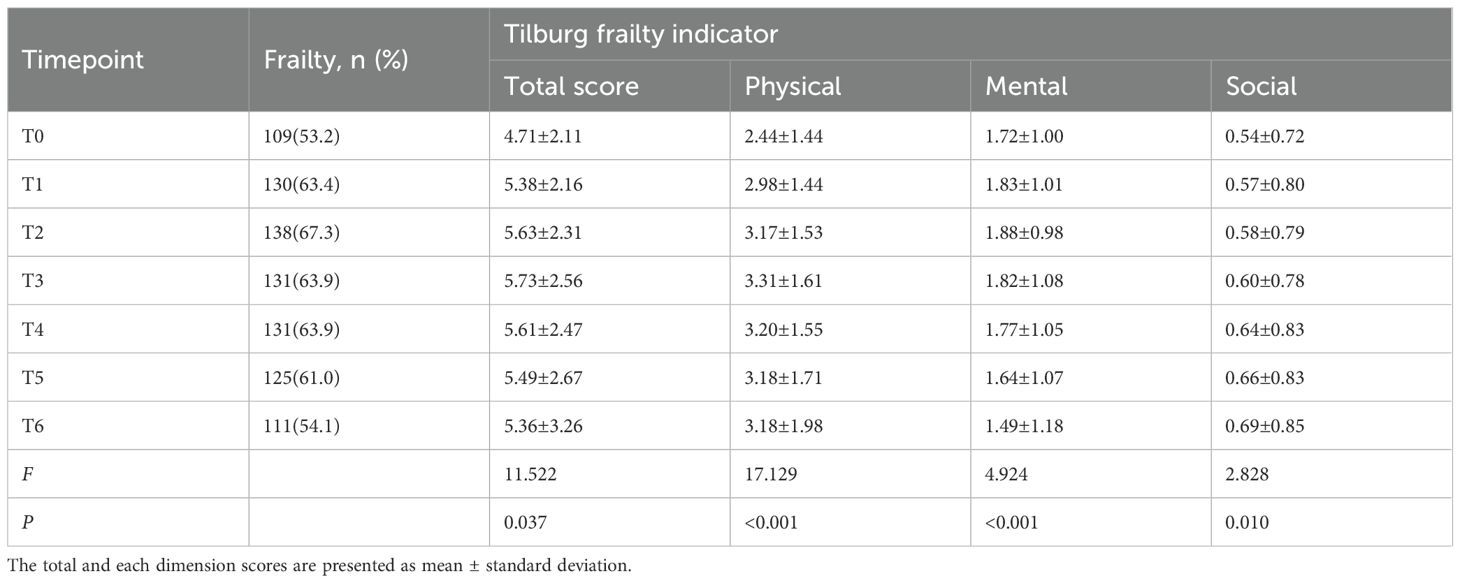
Table 2. Changes in the incidence and scores of frailty during immunotherapy.
Based on the AIC, BIC, and aBIC values, four frailty trajectories were identified in patients receiving cancer immunotherapy (Table 3; Figure 1). They were named according to their slopes and intercepts:
● Category 1 (C1): 76 patients (37.1%). The baseline frailty score was 4.270 (standard error [SE] 0.313; P < 0.001) with a slope of -0.129 (SE 0.072; P = 0.071), indicating that patients in C1 were not frail at baseline and showed a slight downward trend. Thus, C1 was named the “persistently non-frail group”.
● Category 2 (C2): 54 patients (26.3%). Patients in C2 were initially frail (intercept: 5.565, SE 0.276; p < 0.001), and their frailty level continued to rise over the subsequent six time points (slope: 0.550, SE 0.073; P< 0.001). Therefore, C2 was named the “persistently frail group.”
● Category 3 (C3): 57 patients (27.8%). C3 was named the “frailty deterioration–remission group.” Patients in this group were non-frail at baseline but showed an upward trend (intercept: 4.804, SE 0.337; P < 0.001; slope: 1.664, SE 0.137; P < 0.001). They became extremely frail by the third cycle, after which the frailty score declined and was alleviated to a non-frail state by the sixth cycle.
● Category 4 (C4): 18 patients (8.8%). C4, named the “frailty remission– deterioration group,” included patients who were highly frail at baseline but experienced rapid remission (intercept: 6.539, SE 0.648; P < 0.001; slope: −1.657, SE 0.226; P < 0.001). However, their frailty deteriorated after the third cycle, and by the sixth cycle, the frailty severity was worse than that at baseline.
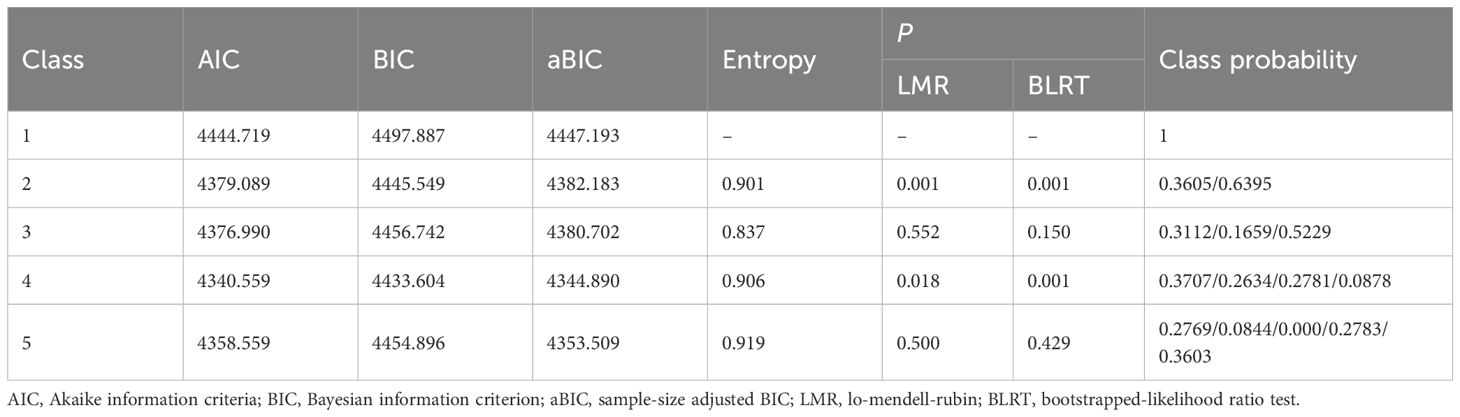
Table 3. Latent class analysis on the trajectory of frailty during immunotherapy.
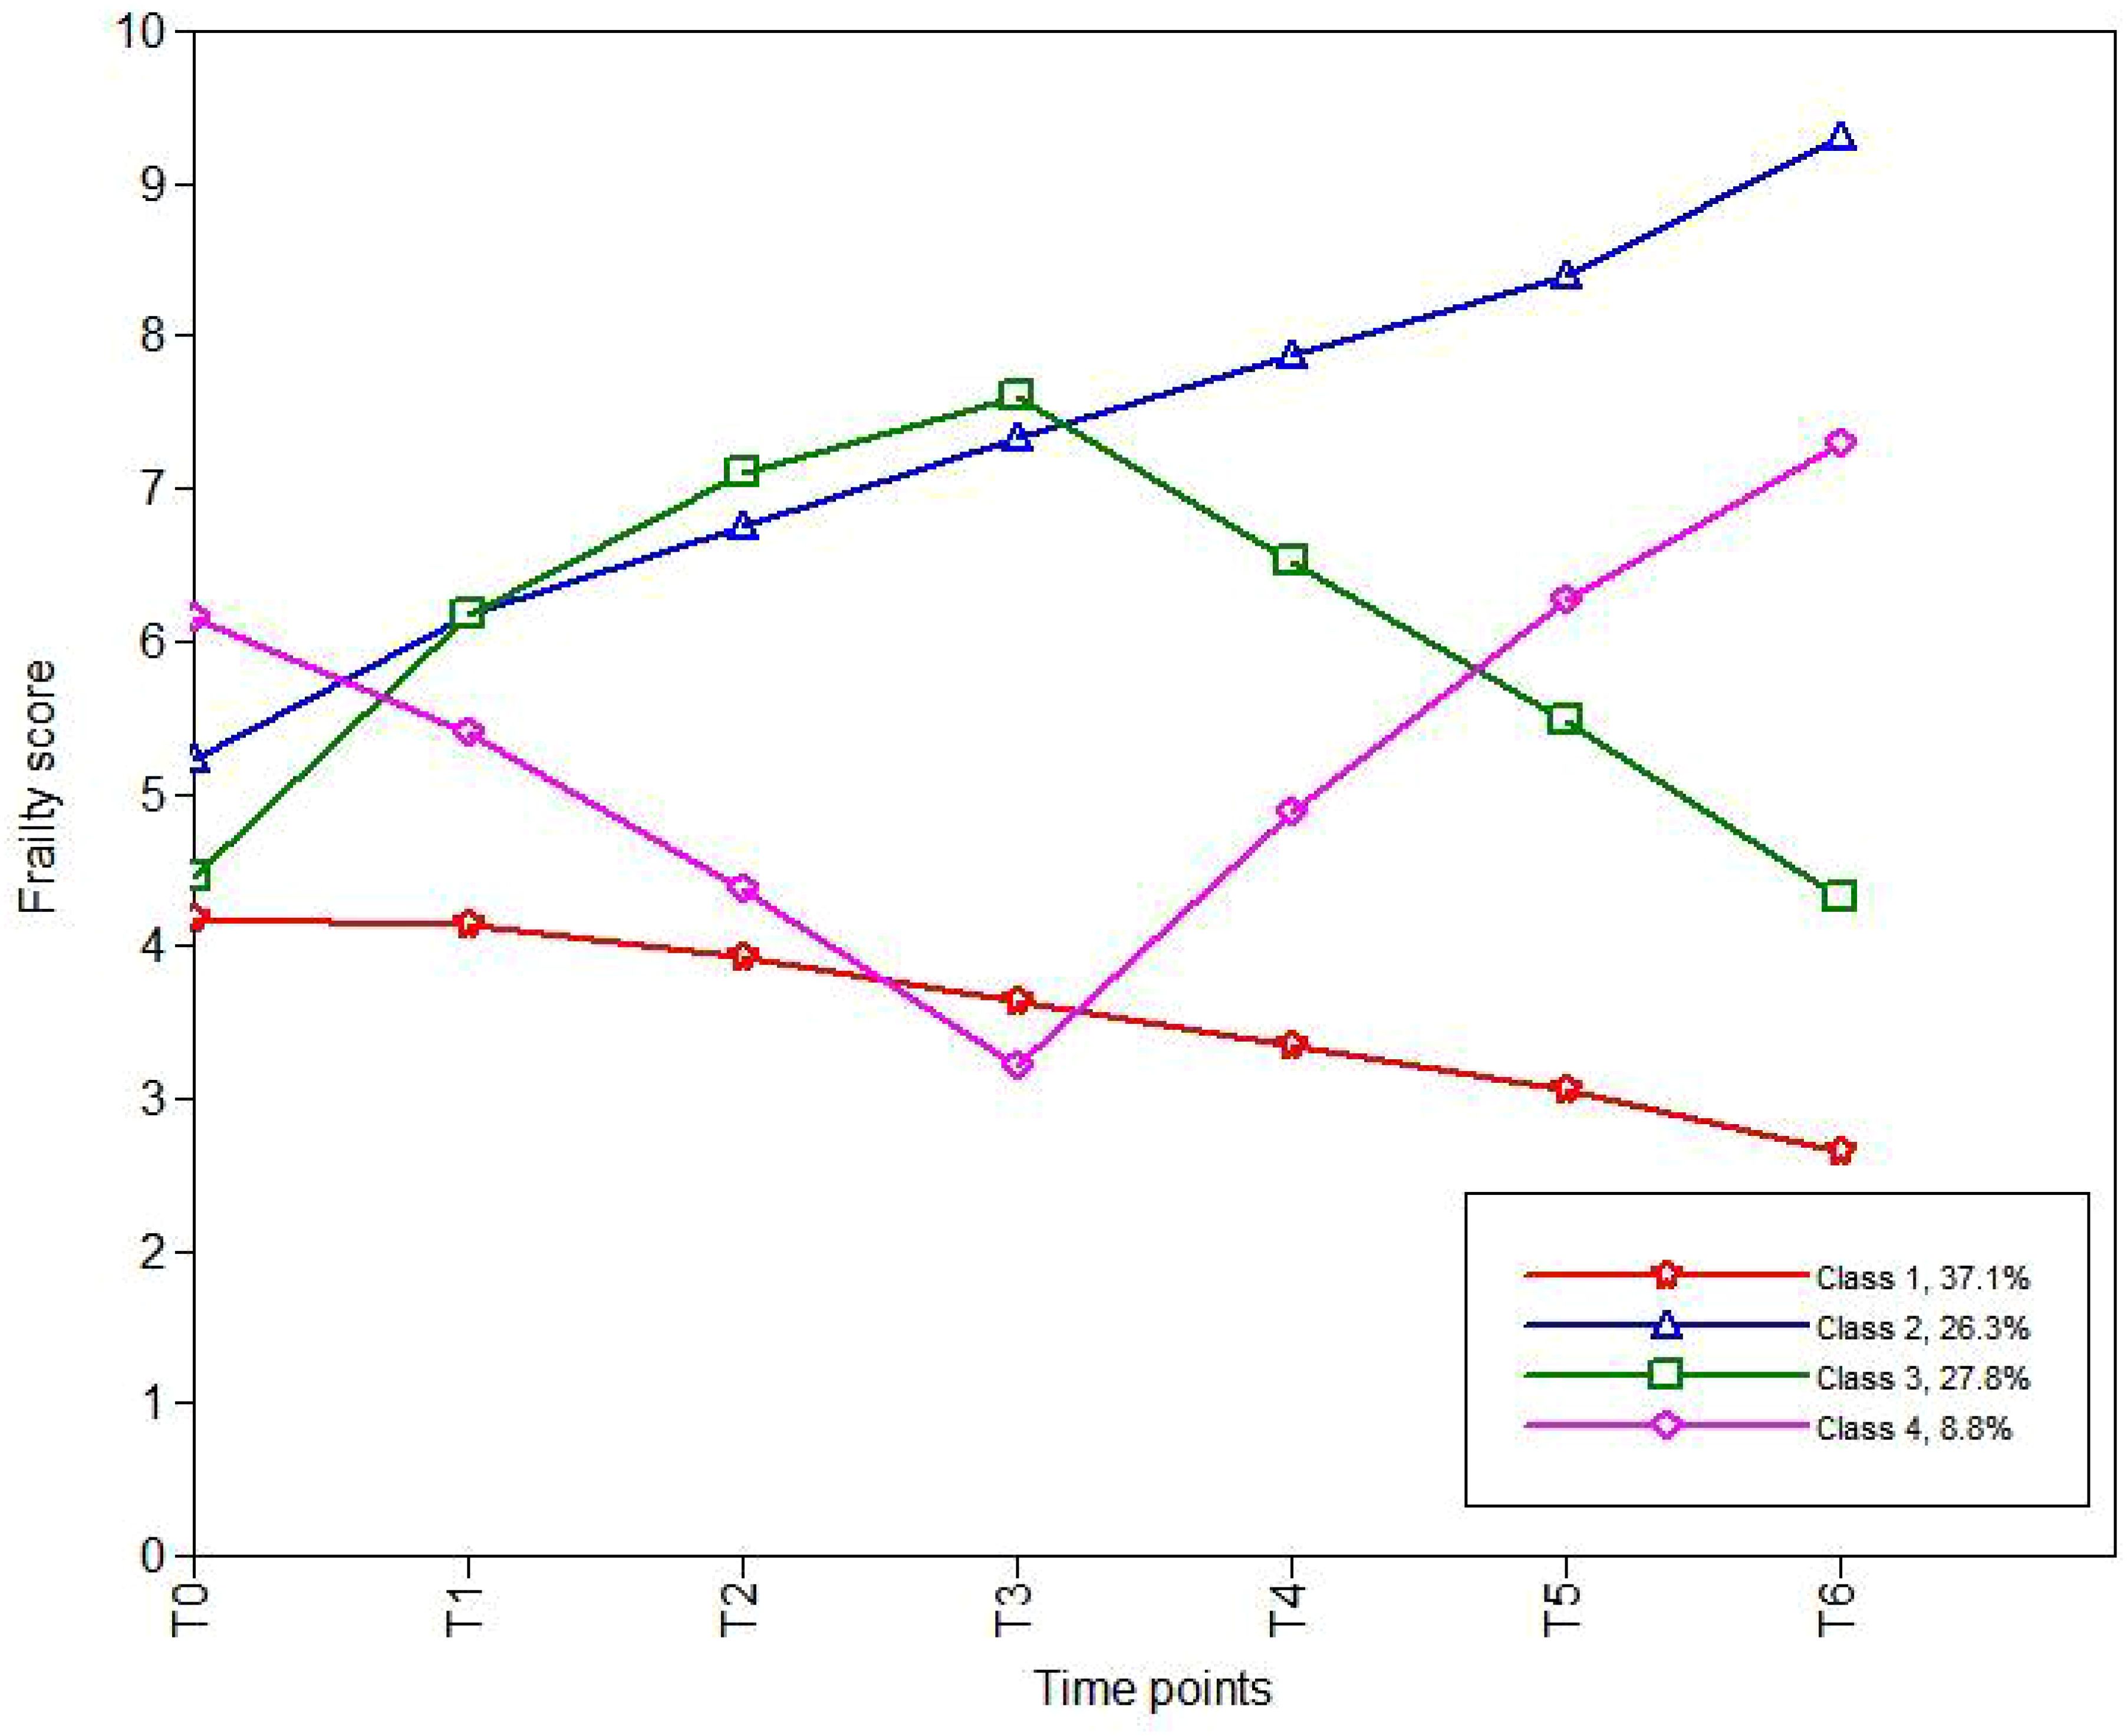
Figure 1. Four models of frailty trajectories in cancer patients under immunotherapy.
Univariate and multivariate analysis of the influencing factors of frailty trajectories
We further identified the influencing factors of frailty trajectories through logistic regression analysis (Tables 4 and 5). Compared with C1, patients in C2 (persistently frail group) were more likely to be at nutritional risk (odds ratio [OR] = 4.173; p = 0.004) and reside in rural areas (OR = 6.896; p < 0.001). In addition, the likelihood of being male in this group was significantly lower than that of being female (OR = 0.365; p = 0.046).
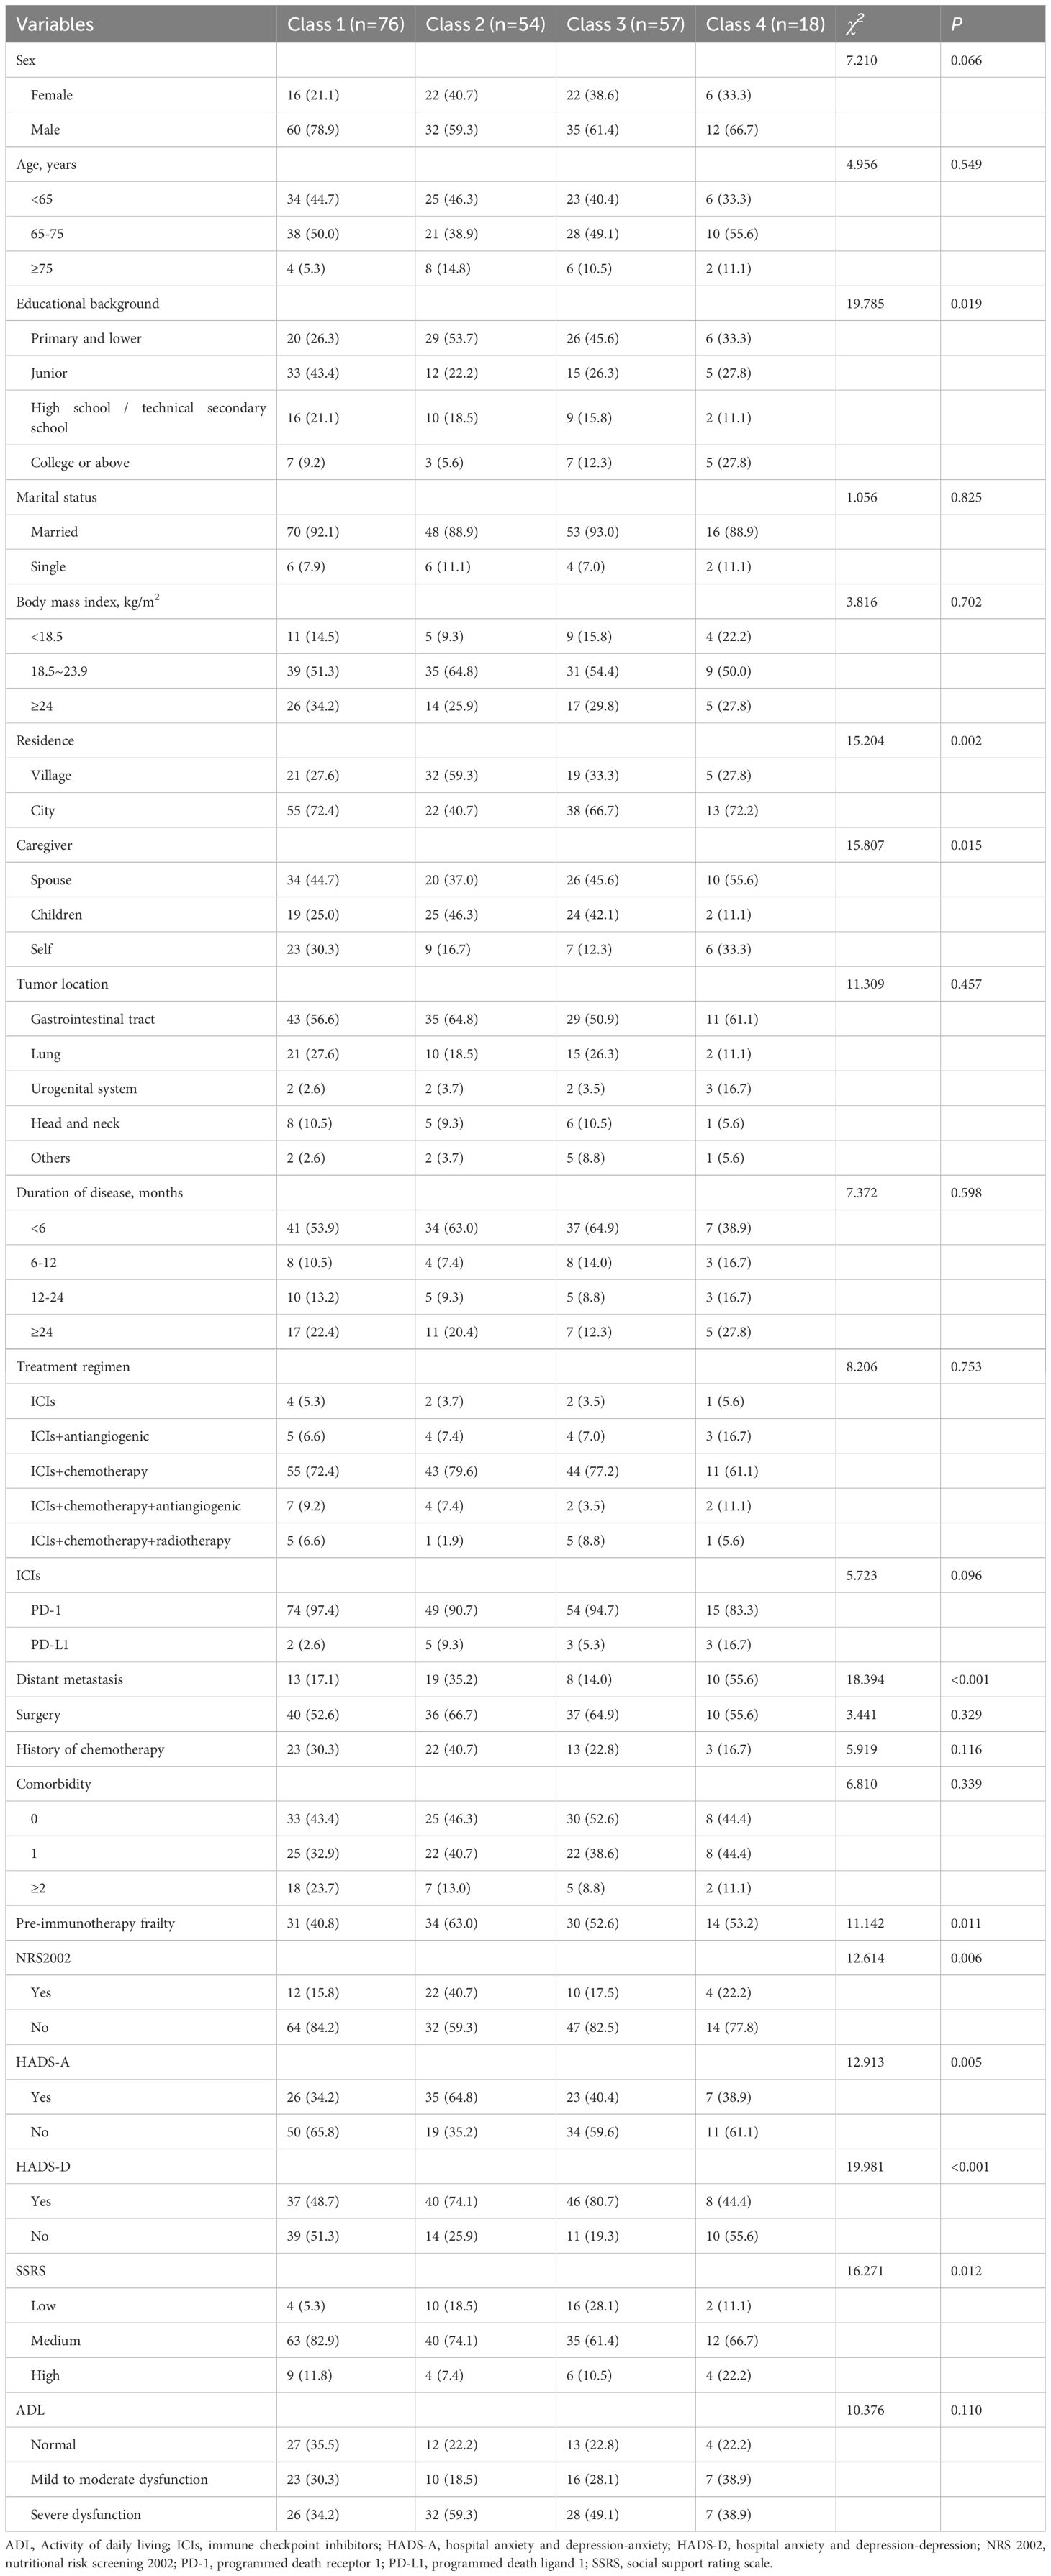
Table 4. Univariate analysis of variables associated with the different classes of frailty trajectories.
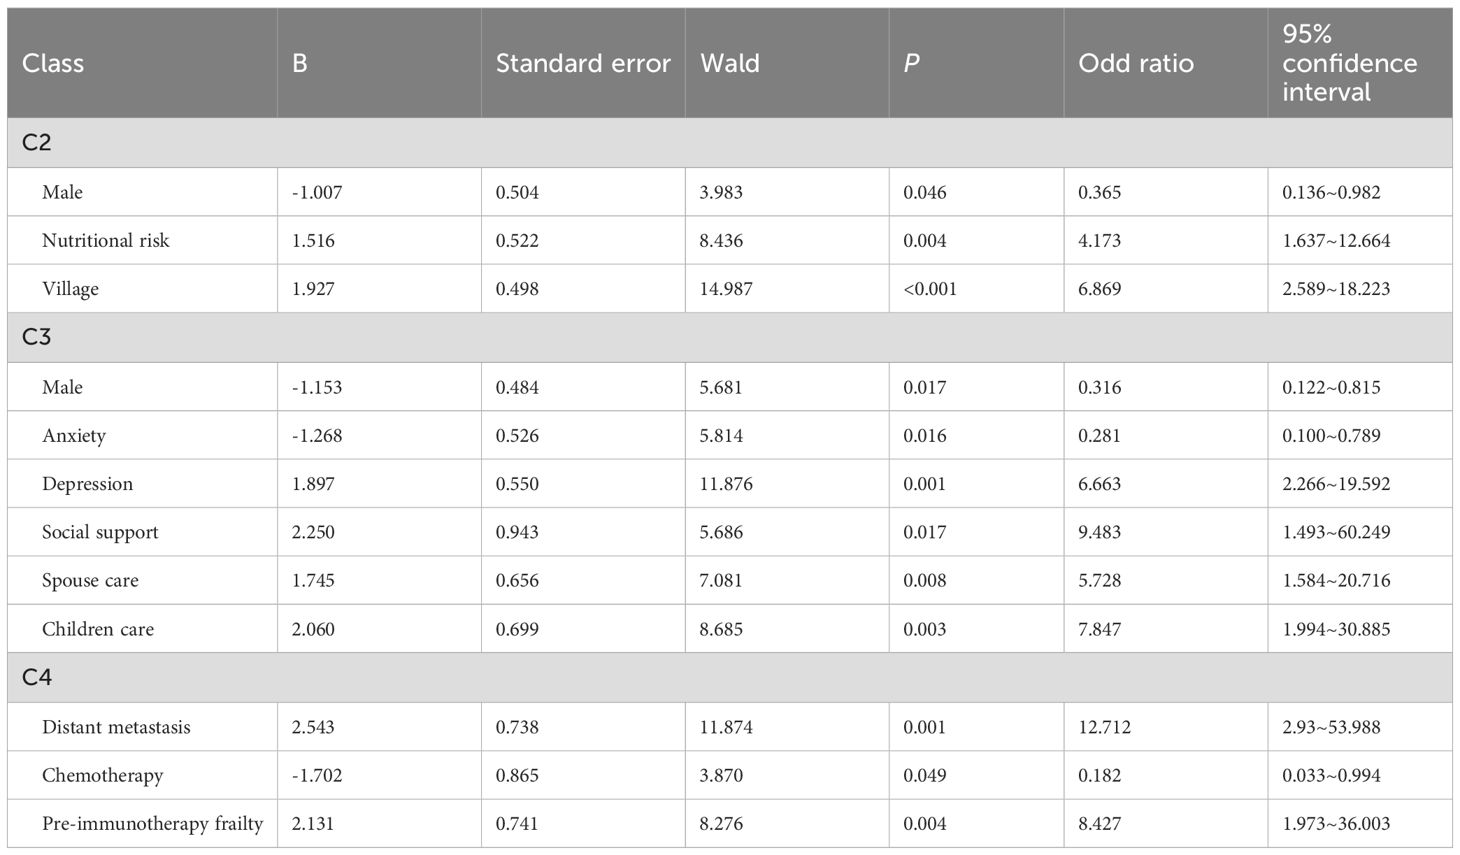
Table 5. Multivariate logistic regression analysis of variables associated with the frailty trajectories.
For C3 (frailty deterioration–remission group), the influencing factors included presence of depression (OR = 6.663; p < 0.001), lower levels of social support (OR = 9.483; p = 0.017), and requiring care from their spouses or children (OR = 5.728; p = 0.008; OR = 7.847; p = 0.003, respectively). However, being male and presence of anxiety were associated with lower odds (OR = 0.316; p = 0.017; OR = 0.281; p = 0.016, respectively).Patients with distant tumor metastasis (OR = 12.712; p = 0.001), pre-treatment frailty (OR = 8.427; p = 0.004), and no history of chemotherapy (OR = 0.182; p = 0.049) were more likely to be in C4 (frailty remission–deterioration group).
Discussion
We investigated the frailty status and trajectories of cancer patients undergoing immunotherapy and found a relatively high incidence of frailty during treatment. The pre-treatment frailty prevalence was 53.2%, peaking at 67.3% during therapy. Compared with other therapeutic modalities, the frailty incidence observed in this study was slightly higher. Bruijnen et al. found that the incidence of frailty among 98 melanoma patients treated with PD-1 inhibitors was 29% (15). By contrast, Gomes et al. reported a frailty incidence of around 50% among elderly cancer patients undergoing immunotherapy (14). The reason for this discrepancy might be due to differences in study populations and assessment scales. Our study included patients with multiple tumor types and primarily utilized the TFI for frailty assessment. The TFI is designed to measure three dimensions—physical, psychological, and social frailty—and has strong potential to identify frail patients. During immunotherapy, cancer patients often experience reduced comfort levels and nutritional disturbances (26), attributable not only to tumor-related cachexia but also to immune-related adverse events. In addition, these patients frequently face negative emotional states such as anxiety and diminished social engagement (27, 28), leading to multidimensional impacts on physical, psychological, and social status. Therefore, immunotherapy patients exhibit greater heterogeneity in frailty trajectories. A longitudinal study on breast cancer patients has reported three trajectories of frailty: “remained robust,” “started and remained pre-frail,” and “initially had nearly frail scores and became more frail” (29). Miao et al. followed 381 gastric cancer patients (aged ≥60 years) undergoing radical gastrectomy and identified three trajectory patterns: “frailty remission,” “persistently frail,” and “frailty progression” (18). Although these studies have identified three types of frailty trajectories, most of them only reported only two trends—progression or remission. In contrast, we have identified more pronounced fluctuations in frailty trajectories, which might be due to interindividual variability in immune responses, adaptive capacity, and recovery potential. Miao et al. also found that the “persistently frail” and “frailty progression” trajectories were significantly associated with worse outcomes (18). However, the relationship between frailty trajectories and clinical outcomes in immunotherapy patients remains to be further investigated. Future studies should validate this association to facilitate timely frailty management in this patient population.
Sex, residence, anxiety and depression, prior chemotherapy history, nutritional risk, social support, distant tumor metastasis, and baseline frailty status were key contributors to heterogeneity in frailty trajectories among cancer patients undergoing immunotherapy, consistent with existing research. Studies have indicated that females aged 45–79 years have a higher risk of frailty (30), potentially due to aging, abdominal obesity, and decreased estrogen levels, which predispose them to greater comorbidity burdens and sarcopenia. Xin et al. reported that rural residents were more vulnerable to frailty among Chinese older adults (31). This disparity may stem from limited healthcare resources, insufficient health literacy, and heightened physical and psychological stress associated with long-distance medical access.
Patients reliant on familial care exhibited exacerbated frailty severity, perpetuating a vicious cycle of declining functional autonomy. Metastatic disease worsens frailty due to progressive deterioration of physical function, often surpassing baseline frailty levels (32). Contrary to previous studies identifying chemotherapy history as a risk factor for symptom burden in immunotherapy patients (33), our findings suggested a protective trend. This discrepancy may arise from adaptive tolerance developed during prior chemotherapy-induced symptom burden, enabling better resilience to immunotherapy-related stressors. Further investigations are warranted to clarify the temporal relationship between chemotherapy exposure and frailty progression in the context of immunotherapy.
Notably, anxiety emerged as a protective factor in our cohort, whereas depression increased frailty risk. Potential mechanisms could include anxiety-driven proactive healthcare-seeking behaviors and improved self-management, which may mitigate prolonged psychological inertia. In parallel, robust economic and emotional support from social networks may significantly alleviate negative emotional states (34). Patients with nutritional risk demonstrated progressive frailty escalation due to impaired nutrient absorption and accelerated muscle catabolism. Pre-existing frailty at treatment initiation predicted poorer stress resilience, highlighting the need for targeted preventive strategies that address baseline frailty.
This study aimed to investigate the developmental trends and trajectories of frailty in cancer patients undergoing immunotherapy. Its strengths include a longitudinal study design, the use of a multidimensional frailty assessment scale encompassing physiological, psychological, and social domains, and follow-up monitoring over six treatment cycles. Additionally, heterogeneous frailty trajectories were identified through mixed-effects modeling.
However, this study had several limitations. First, due to serious illness, death, or changes in treatment, we excluded 36 patients who did not complete all six cycles of treatment cycles. This might have excluded the weakest patients. Furthermore, the observation period was confined to six immunotherapy cycles, whereas immunotherapy can be a long-term therapeutic process. Future research should prioritize extended longitudinal studies to elucidate the dynamic evolution of frailty and its relationship with clinical outcomes in immunotherapy patients. Multicenter investigations are also required to improve the generalizability of the study results.
Conclusion
Patients undergoing immune checkpoint inhibitor therapy exhibited a progressively increasing trend in frailty. Four distinct frailty developmental trajectories were identified: “persistent non-frailty,” “persistent frailty,” “frailty exacerbation–remission,” and “frailty remission–exacerbation.” These trajectories demonstrated considerable heterogeneity in both frailty status and its progression, with different contributing factors across groups. Future interventions should be tailored to the specific characteristics of each frailty trajectory to optimize patient outcomes and quality of life.
Data availability statement
The raw data supporting the conclusions of this article will be made available by the authors, without undue reservation.
Ethics statement
The study protocol was approved by the Ethics Review Committee of Soochow University (Approval No. SUDA20221228H12). The studies were conducted in accordance with the local legislation and institutional requirements. The studies were conducted in accordance with the local legislation and institutional requirements. The participants provided their written informed consent to participate in this study.
Author contributions
WZ: Writing – original draft, Conceptualization, Methodology, Data curation, Formal analysis. JJ: Writing – review & editing, Project administration. YY: Writing – review & editing, Conceptualization, Methodology.
Funding
The author(s) declare financial support was received for the research and/or publication of this article. This study was funded by the Suzhou Science and Education Strengthening Healthcare Youth Science and Technology Project (KJXW2023003) and Suzhou Science and Technology Project (SZM2023011) in China.
Conflict of interest
The authors declare that the research was conducted in the absence of any commercial or financial relationships that could be construed as a potential conflict of interest.
Generative AI statement
The author(s) declare that no Generative AI was used in the creation of this manuscript.
Any alternative text (alt text) provided alongside figures in this article has been generated by Frontiers with the support of artificial intelligence and reasonable efforts have been made to ensure accuracy, including review by the authors wherever possible. If you identify any issues, please contact us.
Publisher’s note
All claims expressed in this article are solely those of the authors and do not necessarily represent those of their affiliated organizations, or those of the publisher, the editors and the reviewers. Any product that may be evaluated in this article, or claim that may be made by its manufacturer, is not guaranteed or endorsed by the publisher.
References
1. Sung H, Ferlay J, Siegel RL, Laversanne M, Soerjomataram I, Jemal A, et al. Global cancer statistics 2020: GLOBOCAN estimates of incidence and mortality worldwide for 36 cancers in 185 countries. CA Cancer J Clin. (2021) 71:209–49. doi: 10.3322/caac.21660
2. Cao W, Chen HD, Yu YW, Li N, and Chen WQ. Changing profiles of cancer burden worldwide and in China: a secondary analysis of the global cancer statistics 2020. Chin Med J (Engl). (2021) 134:783–91. doi: 10.1097/CM9.0000000000001474
3. Vaddepally RK, Kharel P, Pandey R, Garje R, and Chandra AB. Review of indications of FDA-approved immune checkpoint inhibitors per NCCN guidelines with the level of evidence. Cancers (Basel). (2020) 12:738. doi: 10.3390/cancers12030738
4. Brahmer JR, Rodriguez-Abreu D, Robinson AG, Hui R, Csőszi T, Fülöp A, et al. KEYNOTE-024 5-year OS update: First-line pembrolizumab vs platinum-based chemotherapy in patients with metastatic NSCLC and PD-L1 tumour proportion score (TPS) 50%. Ann Oncol. (2020) 31:S1181–2. doi: 10.1016/j.annonc.2020.08.2284
5. Lee CK, Rha SY, Kim HS, Jung M, Kang B, Che J, et al. A single arm phase Ib/II trial of first-line pembrolizumab, trastuzumab and chemotherapy for advanced HER2-positive gastric cancer. Nat Commun. (2022) 13:6002. doi: 10.1038/s41467-022-33267-z
6. Muhandiramge J, Orchard S, Haydon A, and Zalcberg J. The acceleration of ageing in older patients with cancer. J Geriatr Oncol. (2021) 12:343–51. doi: 10.1016/j.jgo.2020.09.010
7. Elias R, Hartshorn K, Rahma O, Lin N, and Snyder-Cappione JE. Aging, immune senescence, and immunotherapy: A comprehensive review. Semin Oncol. (2018) 45:187–200. doi: 10.1053/j.seminoncol.2018.08.006
8. Ma N, Teng Y, Yan L, Hou Y, and Kan Z. Analysis of the frailty status and influencing factors of lung cancer patients treated with PD-1/PDL-1 therapy. Tianjin Nurs. (2023) 31:524–8. doi: 10.3969/j.issn.1006-9143.2023.05.005
9. Cohen CI, Benyaminov R, Rahman M, Ngu D, and Reinhardt M. Frailty: A multidimensional biopsychosocial syndrome. Med Clin North Am. (2023) 107:183–97. doi: 10.1016/j.mcna.2022.04.006
10. Fried LP, Tangen CM, Walston J, Newman AB, Hirsch C, Gottdiener J, et al. Frailty in older adults: evidence for a phenotype. J Gerontol A Biol Sci Med Sci. (2001) 56:M146–56. doi: 10.1093/gerona/56.3.M146
11. Olsson Ladjevardi C, Koliadi A, Rydén V, Inan El-Naggar A, Digkas E, Valachis A, et al. Predicting immune-related adverse events using a simplified frailty score in cancer patients treated with checkpoint inhibitors: A retrospective cohort study. Cancer Med. (2023) 12:13217–24. doi: 10.1002/cam4.6013
12. Li J, Zhang X, Zhou S, Zhou Y, and Liu X. Association between PD-1 inhibitor-related adverse events and frailty assessed by frailty index in lung cancer patients. Cancer Med. (2023) 12:9272–81. doi: 10.1002/cam4.5669
13. Thomas CM, Sklar MC, Su J, Xu W, DeAlmeida JR, Alibhai SMH, et al. Longitudinal assessment of frailty and quality of life in patients undergoing head and neck surgery. Laryngoscope. (2021) 131:E2232–42. doi: 10.1002/lary.29375
14. Gomes F, Lorigan P, Woolley S, Foden P, Burns K, Yorke J, et al. A prospective cohort study on the safety of checkpoint inhibitors in older cancer patients-the ELDERS study. ESMO Open. (2021) 6:100042. doi: 10.1016/j.esmoop.2020.100042
15. Bruijnen CP, Koldenhof JJ, Verheijden RJ, vandenBos F, Emmelot-Vonk MH, Witteveen PO, et al. Frailty and checkpoint inhibitor toxicity in older patients with melanoma. Cancer. (2022) 128:2746–52. doi: 10.1002/cncr.34230
16. Sakakida T, Ishikawa T, Uchino J, Tabuchi Y, Komori S, Asai J, et al. Safety and tolerability of PD-1/PD-L1 inhibitors in elderly and frail patients with advanced Malignancies. Oncol Lett. (2020) 20:14. doi: 10.3892/ol.2020.11875
17. Kim DH and Rockwood K. Frailty in older adults. N Engl J Med. (2024) 391:538–48. doi: 10.1056/NEJMra2301292
18. Miao X, Guo Y, Chen Y, Xu X, Ding L, Hu J, et al. Exploration of frailty trajectories and their associations with health outcomes in older gastric cancer survivors undergoing radical gastrectomy: A prospective longitudinal observation study. Eur J Surg Oncol. (2024) 50:107934. doi: 10.1016/j.ejso.2023.107934
19. Du J, Zhang M, Zeng J, Han J, Duan T, Song Q, et al. Frailty trajectories and determinants in Chinese older adults: A longitudinal study. Geriatr Nurs. (2024) 59:131–8. doi: 10.1016/j.gerinurse.2024.06.015
20. Jenkins ND, Hoogendijk EO, Armstrong JJ, Lewis NA, Ranson JM, Rijnhart JJM, et al. Trajectories of frailty with aging: coordinated analysis of five longitudinal studies. Innov Aging. (2022) 6:igab059. doi: 10.1093/geroni/igab059
21. Xi X, Guo G, and Sun J. Reliability and validity study of the chinese version of the tilburg frailty assessment scale. J Nurs. (2013) 16:1–4. doi: 10.3969/j.issn.1008-9969.2013.16.001
22. Zhang Z, Wan Z, Zhu Y, Zhang L, Zhang L, and Wan H. Prevalence of malnutrition comparing NRS2002, MUST, and PG-SGA with the GLIM criteria in adults with cancer: A multi-center study. Nutrition. (2021) 83:111072. doi: 10.1016/j.nut.2020.111072
23. Xiao SY. Theoretical basis and research application of Social Support Rating Scale. J Clin Psychiatry. (1994) 2:98–100.
24. Zigmond AS and Snaith RP. The hospital anxiety and depression scale. Acta Psychiatr Scand. (1983) 67:361–70. doi: 10.1111/j.1600-0447.1983.tb09716.x
25. Lawton MP and Brody EM. Assessment of older people: self-maintaining and instrumental activities of daily living. Gerontologist. (1969) 9:179–86. doi: 10.1093/geront/9.3_Part_1.179
26. Pansarasa O, Pistono C, Davin A, Bordoni M, Mimmi MC, Guaita A, et al. Altered immune system in frailty: Genetics and diet may influence inflammation. Ageing Res Rev. (2019) 54:100935. doi: 10.1016/j.arr.2019.100935
27. Guo Y, Miao X, Jiang X, Xu T, and Xu Qin. Meta-analysis of factors influencing frailty in cancer patients. Chin Gen Pract. (2023) 26:989–96. doi: 10.12114/j.issn.1007-9572.2022.0773
28. Katayama O, Lee S, Bae S, Makino K, Chiba I, Harada K, et al. The association between social activity and physical frailty among community-dwelling older adults in Japan. BMC Geriatr. (2022) 22:870. doi: 10.1186/s12877-022-03563-w
29. Mandelblatt JS, Zhou X, Small BJ, Ahn J, Zhai W, Ahles T, et al. Deficit accumulation frailty trajectories of older breast cancer survivors and non-cancer controls: the thinking and living with cancer study. J Natl Cancer Ins. (2021) 113:1053–64. doi: 10.1093/jnci/djab003
30. Fan J, Yu C, Guo Y, Bian Z, Sun Z, Yang L, et al. Frailty index and all-cause and cause-specific mortality in Chinese adults: a prospective cohort study. Lancet Public Health. (2020) 5:e650–60. doi: 10.1016/S2468-2667(20)30113-4
31. Qi X, Li Y, Hu J, Meng L, Zeng P, Shi J, et al. Prevalence of social frailty and its associated factors in the older Chinese population: a national cross-sectional study. BMC Geriatr. (2023) 23:532. doi: 10.1186/s12877-023-04241-1
32. Chen F, Yi P, Mao N, Luo J, and Cai D. Analysis of the current situation and influencing factors of frailty in elderly patients with lung cancer. J Nurs. (2020) 27:7–11. doi: 10.16460/j.issn1008-9969.2020.15.007
33. Feng LN, He J, Feng LX, Li Y, Li J, and Chen C. Symptoms, symptom clusters and associated factors among cancer patients receiving immune checkpoint inhibitor therapy: A cross-sectional survey. Eur J Oncol Nurs. (2023) 63:102288. doi: 10.1016/j.ejon.2023.102288
Keywords: cancer, immune checkpoint inhibitors, immunotherapy, frailty, trajectories, influencing factors
Citation: Zhu W, Ji J and Yang Y (2025) Frailty trajectories and their determinants in cancer patients undergoing immunotherapy: a prospective longitudinal study. Front. Oncol. 15:1684827. doi: 10.3389/fonc.2025.1684827
Received: 13 August 2025; Accepted: 31 October 2025;
Published: 21 November 2025.
Edited by:
Katarzyna Milana Broczek, Polish Society of Gerontology, PolandReviewed by:
Daisuke Morinaga, Hokkaido University Hospital, JapanSujay Srinivas, Bharath Hospital, India
Copyright © 2025 Zhu, Ji and Yang. This is an open-access article distributed under the terms of the Creative Commons Attribution License (CC BY). The use, distribution or reproduction in other forums is permitted, provided the original author(s) and the copyright owner(s) are credited and that the original publication in this journal is cited, in accordance with accepted academic practice. No use, distribution or reproduction is permitted which does not comply with these terms.
*Correspondence: Yiqun Yang, NTkyNDM2NjgwQHFxLmNvbQ==
†These authors have contributed equally to this work