 Tingting Liu1,2,3†Zhiqing Zhang1,2,3†
 Yuan Liu1,2,3Yu Su1,2,3Qun Yu1,2,3Chungao Li1,2,3Xiangchuang Kong1,2,3
 Jie Zhao1,2,3Shuo Huang1,2,3
 Chuansheng Zheng1,2,3
 Wenjun Wu1,2,3*
 Lixia Wang1,2,3*
- 1Department of Radiology, Union Hospital, Tongji Medical College, Huazhong University of Science and Technology, Wuhan, China
- 2Hubei Province Key Laboratory of Molecular Imaging, Wuhan, China
- 3Hubei Provincial Clinical Research Center for Precision Radiology & Interventional Medicine, Wuhan, China
Objective: To investigate the application value of integrating contrast-enhanced magnetic resonance neurography (CE-MRN) with contrast-enhanced T1-weighted imaging (CE-T1WI) to improve the simultaneous imaging of nerves and tumors in the head and neck.
Materials and methods: A retrospective study of 31 patients (14 neurogenic, 17 non-neurogenic) with pathologically confirmed peripheral nerve tumors (2017–2024) was conducted. All underwent 3.0 T MRI, assessed by two blinded radiologists. Tumor involvement patterns, enhancement features, MRI signs, and normalized nerve signal intensity were analyzed. Diagnostic confidence and lesion conspicuity were compared across CE-MRN, CE-T1WI, and fusion images. Statistical analysis included Mann-Whitney U test and interobserver agreement (Kappa/ICC).
Results: Interobserver agreement was moderate to excellent (Kappa/ICC: 0.47-0.93). Focal involvement dominated in neurogenic tumors (92.9% vs. 52.9% diffuse in non-neurogenic, p=0.002). Traditional MRI signs: “dumbbell sign” was more frequent in neurogenic tumors (78.6% vs. 11.8%, p<0.001), while “effacement of fat plane” was common in non-neurogenic (70.6% vs. 0%, p<0.001). Novel CE-MRN signs: “enhanced target sign” (28.6% vs. 0%, p=0.032) and “nerve tail sign” (57.1% vs. 11.8%, p=0.018) were neurogenic markers, whereas “nerve effacing sign” was non-neurogenic (76.5% vs. 35.7%, p=0.033). Affected nerves showed higher signal intensity than contralateral nerves (p<0.05). Fusion images matched CE-MRN in diagnostic confidence and surpassed CE-T1WI in conspicuity (p<0.001).
Conclusion: Image fusion technology addressed the limitations of CE-MRN in lesion visualization, thereby enhancing diagnostic confidence. The novel signs and nerve signal alterations observed in CE-MRN provide visual evidence for the accurate diagnosis and differentiation of head and neck tumors.
Introduction
The accurate diagnosis and differentiation of peripheral nerve tumors in the head and neck region represent a significant challenge within the field of clinical neuroimaging. Primary neurogenic tumors, included schwannomas and neurofibromas, as well as head and neck malignancies, such as nasopharyngeal carcinoma, adenocystic carcinoma and lymphoma, which frequently involve peripheral nerves, demonstrate marked differences in biological behavior, treatment strategies, and prognostic outcomes. Among the secondary peripheral nerve tumors, perineural invasion (PNI) and perineural spread (PNS) serve as key pathological phenotypes for malignant tumors invading nerves, which are strongly associated with unfavorable prognosis (1, 2). Approximately 30%–40% of patients have already progressed to the advanced stage by the time neurological symptoms become apparent. A missed diagnosis of nerve involvement places patients at a higher risk of recurrence and poorer prognosis (3, 4). Although histological examination serves as the gold standard for PNI and PNS, pretreatment detection of nerve involvement still predominantly rely on imaging techniques. Consequently, there is an urgent requirement for a highly sensitive and specific non-invasive visualization method to fulfill unmet clinical needs.
In the domain of neuroimaging, conventional imaging techniques possess distinct clinical significance while also presenting opportunities for improvement. Ultrasound enables dynamic observation of nerve bundle structures; however, their penetration depth restrict their application in deep nerve imaging (5). CT can depict bone structure involvement, yet their soft tissue contrast is suboptimal. 18F-FDG PET/CT is helpful for detecting abnormal glucose metabolism in nerve damage regions and aiding disease classification, but its spatial resolution is insufficient to visualizing neural structures (6). Conventional MRI, characterized by its superior soft tissue contrast and spatial resolution, has emerged as the primary imaging modality for tumor imaging (7). However, it still lacks the capability to directly visualize nerves. MRI diagnosis of PNI/PNS often depends on indirect signs, including the occupying and blurring of the perineural fat plane, as well as abnormal enhancement along nerve regions, which may be influenced by partial volume effects and the expertise level of the clinicians. Recently, the advancement of magnetic resonance neurography (MRN), particularly contrast-enhanced magnetic resonance neurography (CE-MRN), has substantially improved the visualization of peripheral nerves and their small branches. This development has also introduced novel indicators for assessing nerve involvement, potentially enabling direct detection of peripheral nerve tumors (7–10).
Previous research has largely focused on one imaging method, but multisequence image fusion and rendering technologies have provided new perspectives for comprehensive evaluation on neuro-oncological conditions. Ensle F et al. found that fusion of DESS and enhanced STIR sequences enables the preservation of both spatial details and tissue contrast derived from the characteristics of both sequence, thereby providing optimal nerve visualization (11). Xu Z et al. integrated MRA and MRN images, revealing the anatomical relationship between brachial plexus neuropathy and associated vascular abnormalities, thus providing multi-dimensional imaging evidence for clinical decision-making in treatment (12). He A et al. applied heatmap color rendering technology in MRN, which substantially enhanced the visualization of lumbosacral plexus neuropathy. This advancement particularly bolstered diagnostic confidence among less experienced physicians and effectively reduced inter-observer variability in subjective assessment (13). These advancements provided valuable insights for addressing the limitation of CE-MRI in poorly displaying the contour of enhanced tumor parenchyma, as enhancement shows diffused decreased signal intensity on CE-MRI images (14).
Therefore, we hypothesize that image fusion technology of CE-MRN and contrast-enhanced T1-weighted imaging(CE-T1WI) will enhance the identification of nerve involvement by tumors. This study aims to compare the differences in classical MRI signs and novel CE-MRN signs, as well as nerve signal changes between neurogenic and non-neurogenic tumors. Additionally, this study also seeks to evaluate whether fusion images provide superior performance compared to single-sequence images in improving diagnostic confidence and lesion conspicuity for head and neck tumors.
Materials and methods
Subject
This study was a retrospective study conducted in accordance with the principles of the Declaration of Helsinki and approved by the Ethics Committee of our hospital (UHCT241287), informed consent from patients was waived. The Pathology Report System and Picture Archiving and Communication System (PACS, Carestream, Shanghai, China) was researched between February 2017 and June 2024. Inclusion criteria included: 1) patients who underwent both routine MRI and CE-MRN examinations; 2) imaging reports indicating space-occupying lesions involving peripheral nerves; 3) pathological confirmation obtained via biopsy or surgery. Exclusion criteria included: 1) images that could not be reconstructed for evaluation due to severe artifacts; 2) incomplete imaging data. A total of 4,987 patients who underwent CE-MRN examinations were screened. Patients without reported peripheral nerve involvement (n=4,415), without pathological confirmation (n=538), and with poor image quality (n=3) were excluded. Ultimately, 31 patients with complete imaging data and confirmed peripheral nerve tumors were included. Patients were divided into two groups based on pathological results: the neurogenic tumor group (n=14) and the non-neurogenic tumor group involving peripheral nerves (n=17) (Figure 1).
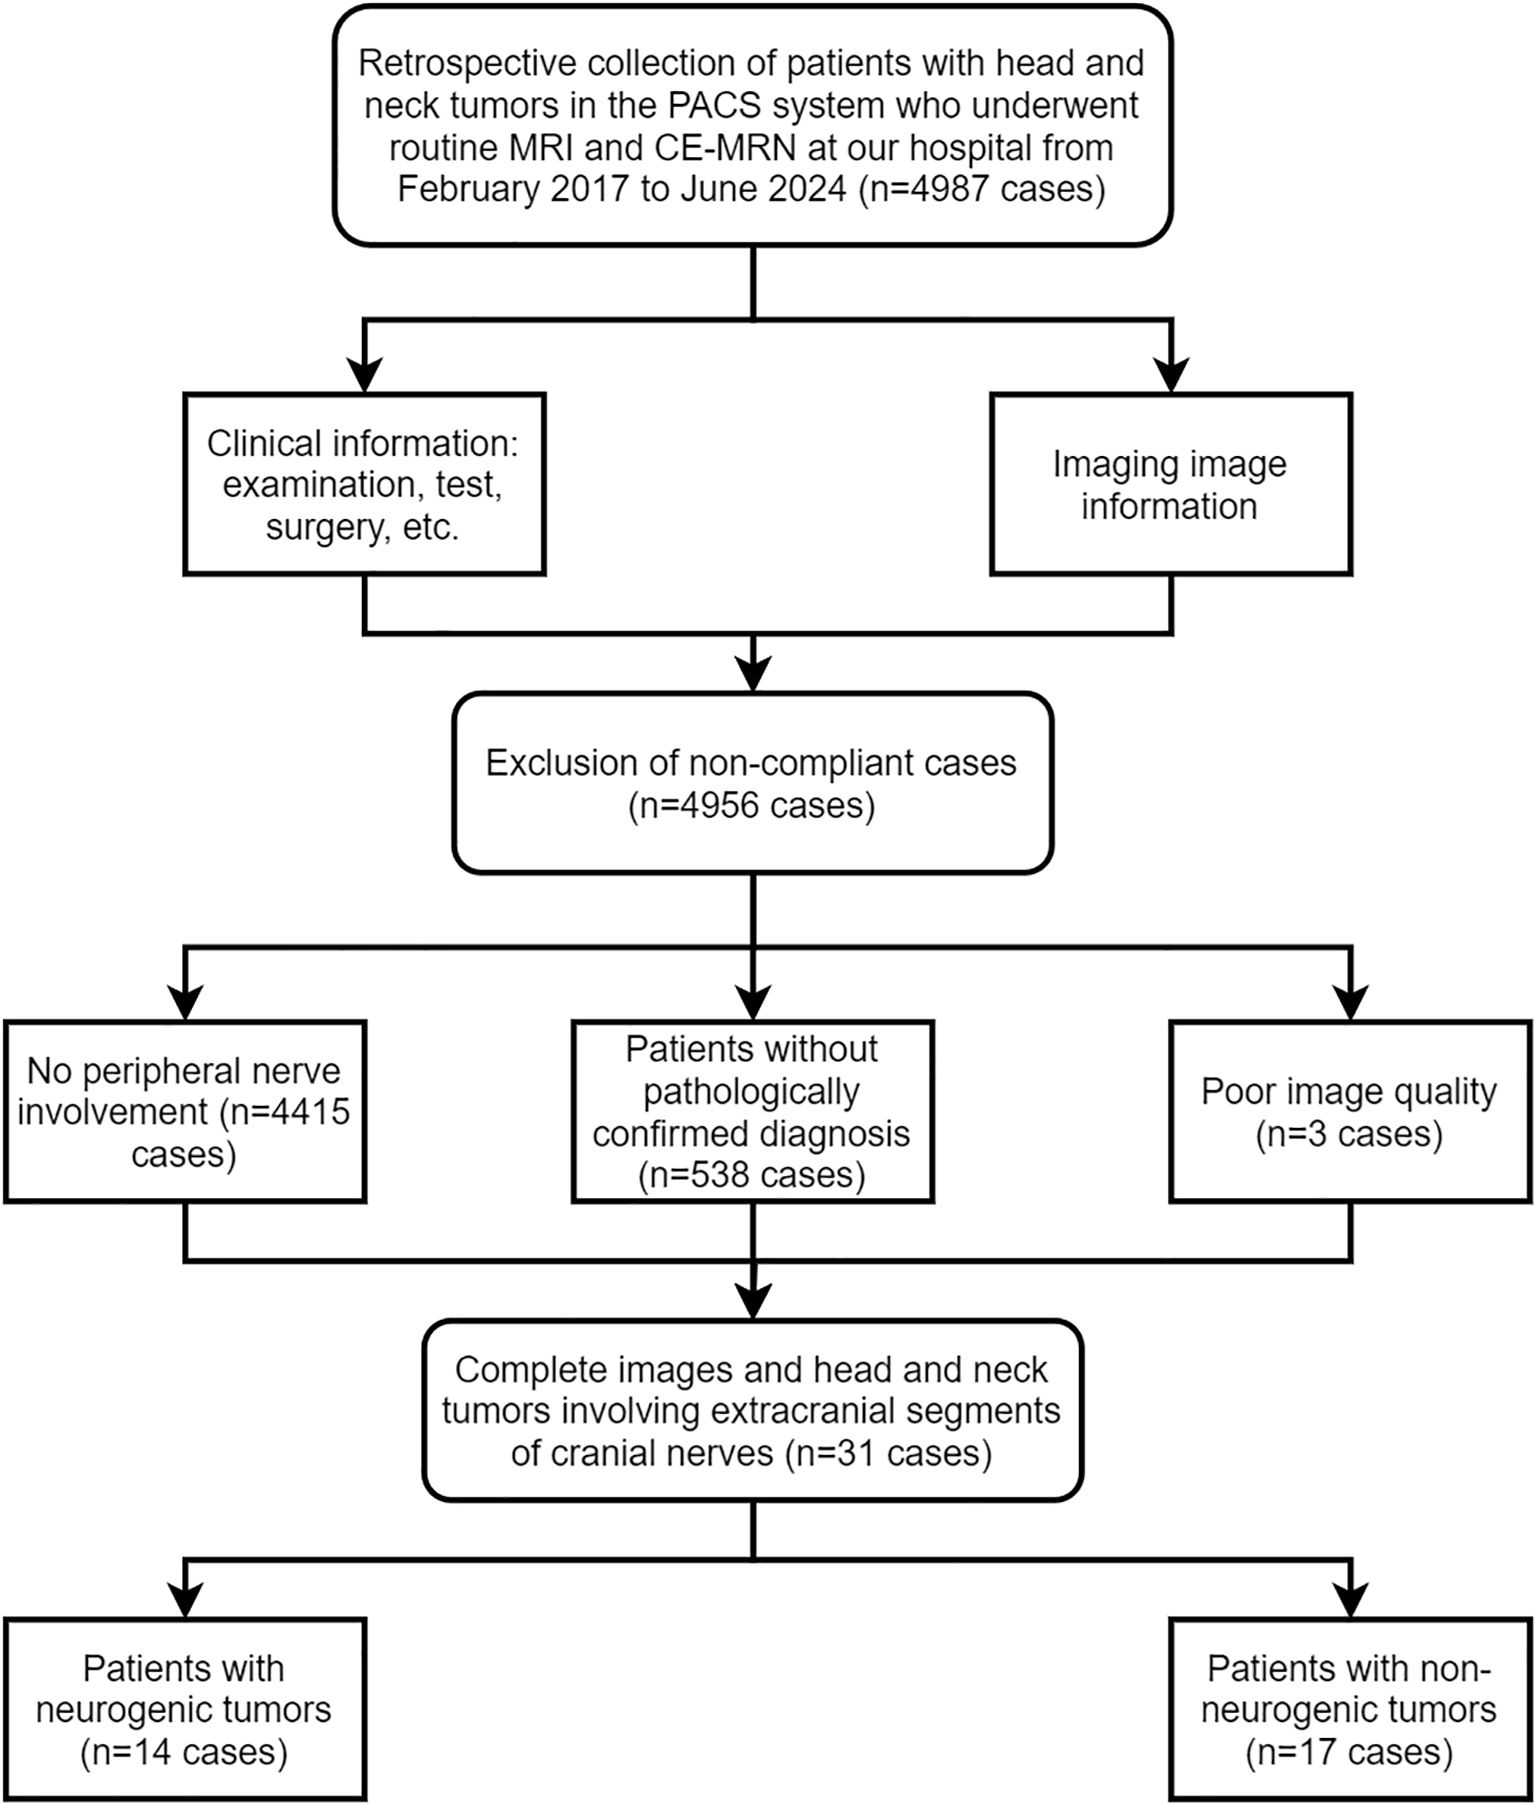
Figure 1. Flowchart.
MRI imaging protocol
All examinations were performed using 3.0 T MRI systems (Philips Ingenia CX, Best, Netherlands, or Siemens Healthcare, Skyra, Erlangen, Germany). Head and neck nerve imaging was performed using a 20-channel head and neck combined coil. The MRI protocol included: axial T1-weighted imaging (T1WI), axial T2-weighted imaging (T2WI), axial T2 FLAIR, axial CE-T1WI, coronal CE-T1WI, and coronal CE-MRN (Philips: 3D NerveView sequence; Siemens: T2 STIR SPACE sequence). The contrast agent (Magnevist; Bayer AG, Leverkusen, Germany) was administered via an intravenous catheter at a flow rate of 1.5 mL/s (dose: 0.3 mL/kg), followed by 15 mL of saline at the same rate. The CE-MRN sequence was initiated 1–1.5 minutes post-injection. The specific parameters for CE-T1WI and CE-MRN are outlined as Table 1.
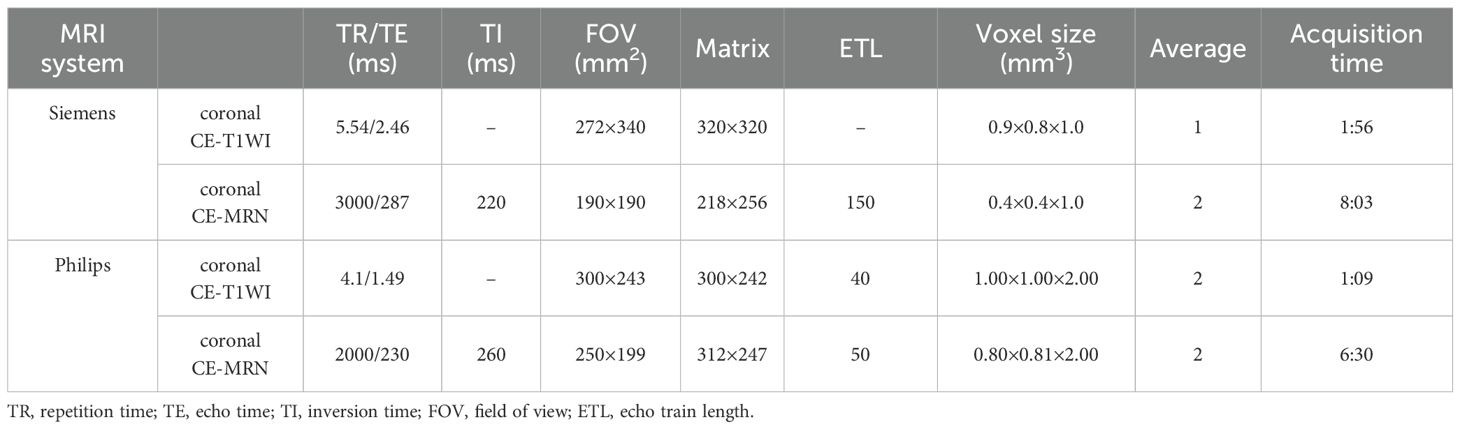
Table 1. Imaging parameters of coronal CE-T1WI and CE-MRN.
MRI imaging assessment
The initial qualitative assessment and basic measurements on the selected images were performed by two radiologists with 8 and 3 years of neuroimaging experience, respectively, under blinded conditions using RadiAnt DICOM Viewer (Medixant, Poland, version 5). Three-dimensional images were reconstructed using maximum intensity projection (MIP) and multi-planar reconstruction (MPR). The assessment included: patterns of involved nerves (mono nerve/multiple nerves; focal/multifocal/diffuse), enhancement (none, homogeneous, heterogeneous, periphery); nerve morphological and signal changes (hypertrophy or atrophy, signal increase or decrease); classical MRI signs (target sign, tail sign, dumbbell sign, effacemant of fat space); and novel CE-MRN signs defined in a previous study (enhanced target sign, nerve effacing sign, nerve compressing sign, nerve tail sign) (14). The final results were determined through a consensus reached by two radiologists.
Quantification of nerve signal intensity
In the CE-MRN sequence, both neurogenic and non-neurogenic tumors showed increased signal intensity in some distal nerves. Two trained neuroradiologists measured the signal intensity of the distal nerves on both affected and contralateral side. Then the nerve signal intensity was normalized relative to the signal of adjacent muscles. The signal intensity ratio of nerve-to-muscle (SInerve/muscle) was compared the involved distal nerves and the contralateral uninvolved nerves.
Assessment of diagnostic confidence and lesion visibility
The ITK-SNAP toolkit (ITK, Insight Segmentation Toolkit, version 3.8.0) was used to fuse coronal CE-MRN and CE-T1WI images. The images were first co-registered using rigid or affine transformation. Subsequently, the CE-T1WI was set as the base image, and the CE-MRN was imported in overlay mode. Optimal visual fusion was achieved by adjusting the opacity and applying a color map. Diagnostic confidence and lesion conspicuity were evaluated using a 4-point scale. The diagnostic confidence scoring criteria were as follows: 0 = unable to determine the relationship between the lesion and the nerve; 1 = low confidence (suggesting an uncertain inference of the relationship); 2 = moderate confidence (indicating a probable inference of the relationship); 3 = high confidence (clear visualization of the nerve and explicit delineation of its relationship with the lesion). The assessment of lesion conspicuity was conducted by evaluating the clarity of the lesion contour and used the following scoring criteria: 0 = unable to discern the lesion contour; 1 = less than 50% of the lesion contour is visible; 2 = more than 50% of the lesion contour is visible; 3 = the complete lesion contour can be fully determined.
Statistical analysis
All data were analyzed using SPSS (version 25.0; IBM Corp.; Chicago, IL, USA). The normality of continuous data between the neurogenic and non-neurogenic tumor groups was tested using the Shapiro-Wilk (S-W) method. Data with normal distribution were expressed as mean ± standard deviation (Mean ± SD). For non-normally distributed data, the median (interquartile range) was used. Categorical variables were compared using the chi-square test or Fisher’s exact probability test. Intergroup consistency was assessed using Cohen’s Kappa (for qualitative data) and intraclass correlation coefficient (ICC, for quantitative data), with the following criteria: 0.81–1.00: excellent, 0.61–0.80: good, 0.41–0.60: moderate, 0.21–0.40: fair, 0.00–0.20: poor. Intergroup comparisons of diagnostic confidence and lesion conspicuity scores (between CE-T1WI and CE-MRN, between CE-T1WI and fused images, and between CE-MRN and fused images) were performed using the Mann-Whitney U test. Multiple comparisons were adjusted using the Bonferroni method, with p-values automatically adjusted. A p-value < 0.05 was considered statistically significant.
Results
Demographic and clinical characteristics
There were no significant differences between the neurogenic tumor group and the non-neurogenic tumor group in terms of mean age, gender, or number of involved nerves (p > 0.05 for all). Tumors in the neurogenic group were predominantly focal lesions (92.9%), whereas those in the non-neurogenic group were predominantly diffuse (52.9%), with a significant difference (p = 0.002). More detailed information can be found in Table 2.
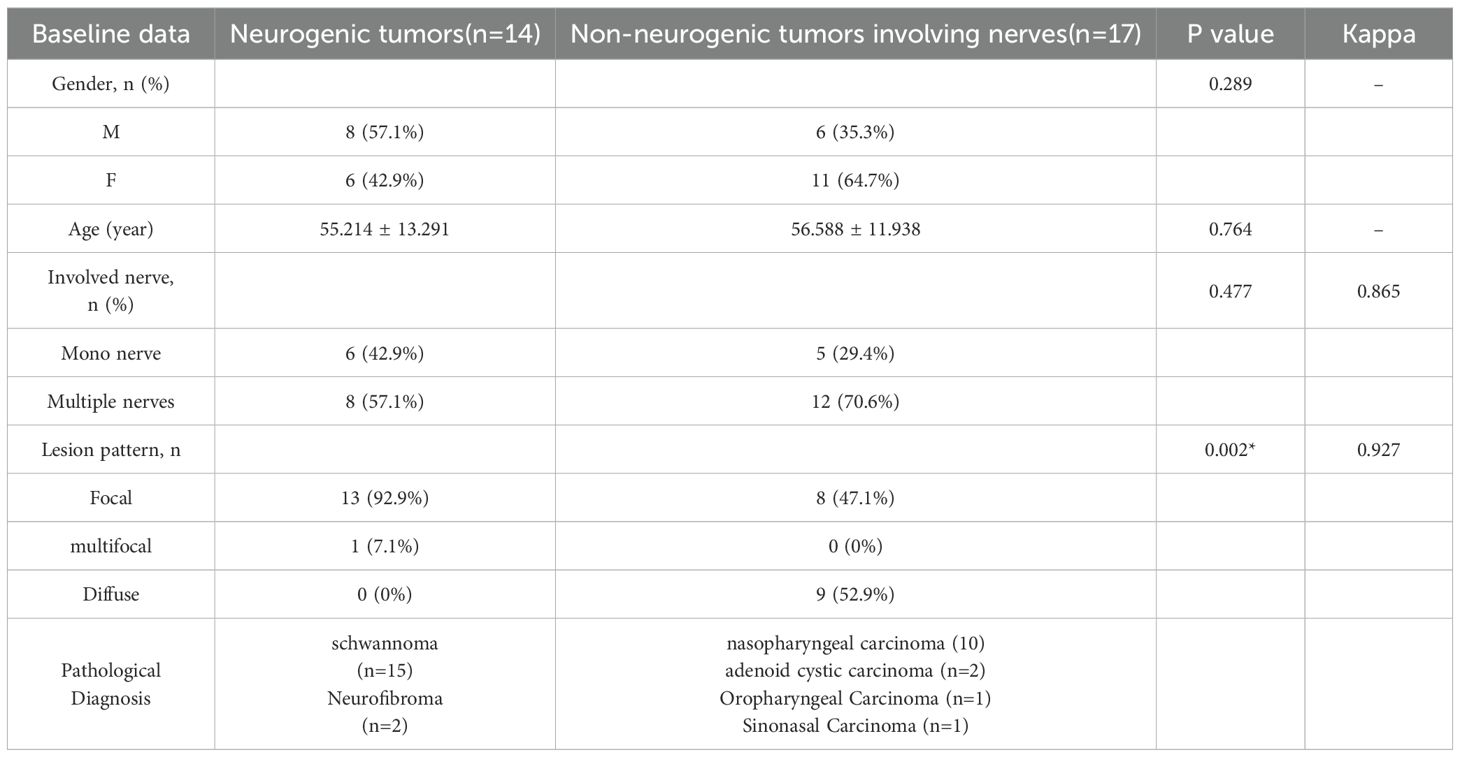
Table 2. Demographic and clinical characteristics.
Inter-reader agreement
In terms of MRI signs identification, the Kappa values for conventional MRI signs ranged from 0.47 to 0.93 (moderate to excellent); for CE-MRN signs, the Kappa values ranged from 0.65 to 1.00 (good to excellent). Regarding inter-reader agreement in diagnostic confidence scores, the Kappa value for CE-T1WI was 0.54 (moderate), and 0.77 (good). for CE-MRN. Inter-reader consistency for lesion conspicuity scores showed Kappa values of 0.77 (good) for CE-T1WI and 0.77 (good) for CE-MRN. The highest consistency was observed for diagnostic confidence (Kappa = 0.89) and lesion visibility (Kappa = 0.87) in fused images. Additionally, the inter-reader reliability in nerve signal measurements was good (ICC > 0.800).Observers showed good to excellent agreement on the findings across different models of MR scanners (ICC > 0.765) (Supplementary Table S1).
Comparison of MRI manifestations between neurogenic and non-neurogenic groups
In terms of nerve involvement pattern, the neurogenic group predominantly exhibited focal involvement (92.9%), while the non-neurogenic group predominantly exhibited diffuse involvement (52.9%), with a statistically significant difference (p=0.002). Classical MRI findings showed a significantly higher incidence of the “dumbbell sign” in the neurogenic group compared to the non-neurogenic group (78.6% vs. 11.8%, p < 0.001). The “effacement of the fat plane” was exclusively observed in the non-neurogenic group, albeit with a relatively lower incidence (29.4%) (p < 0.001)(Table 3). Among the novel CE-MRN signs, the “enhanced target sign” (p=0.032) and “nerve tail sign” (p=0.018) were more common in the neurogenic group (Figure 2). Conversely, the incidence of the “nerve effacing sign” was more frequently observed in the non-neurogenic group (76.5% vs. 35.7%, p=0.033), which may indicate a malignant trend (Figure 3). No significant differences were noted between the neurogenic and non-neurogenic groups regarding enhancement patterns, nerve signal and morphology (Table 4).
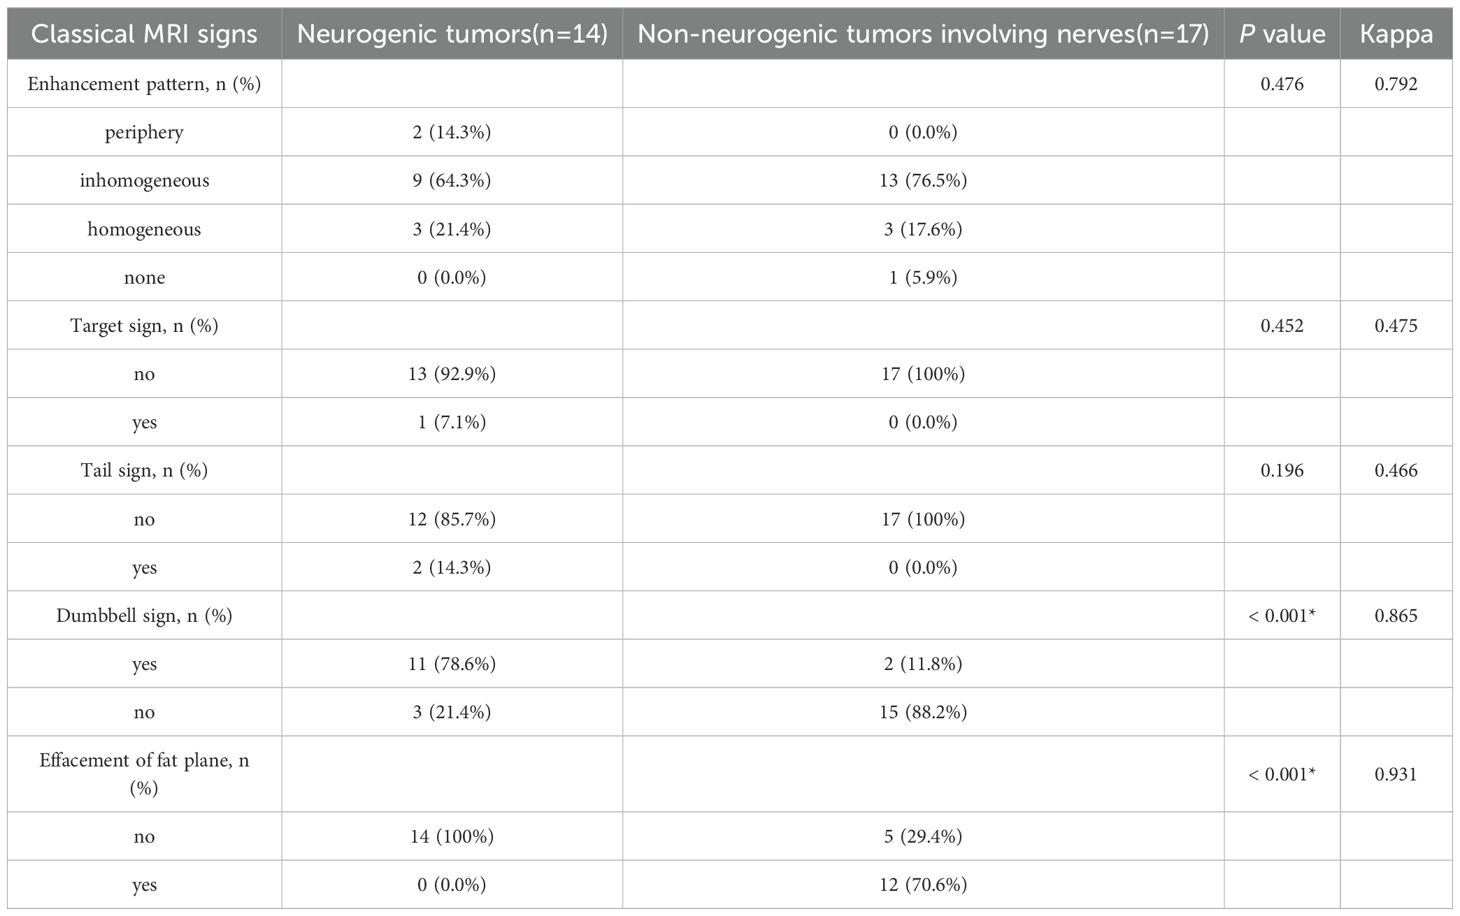
Table 3. Comparison of the incidence of classical MRI signs between the neurogenic tumor group and the non-neurogenic tumor group.
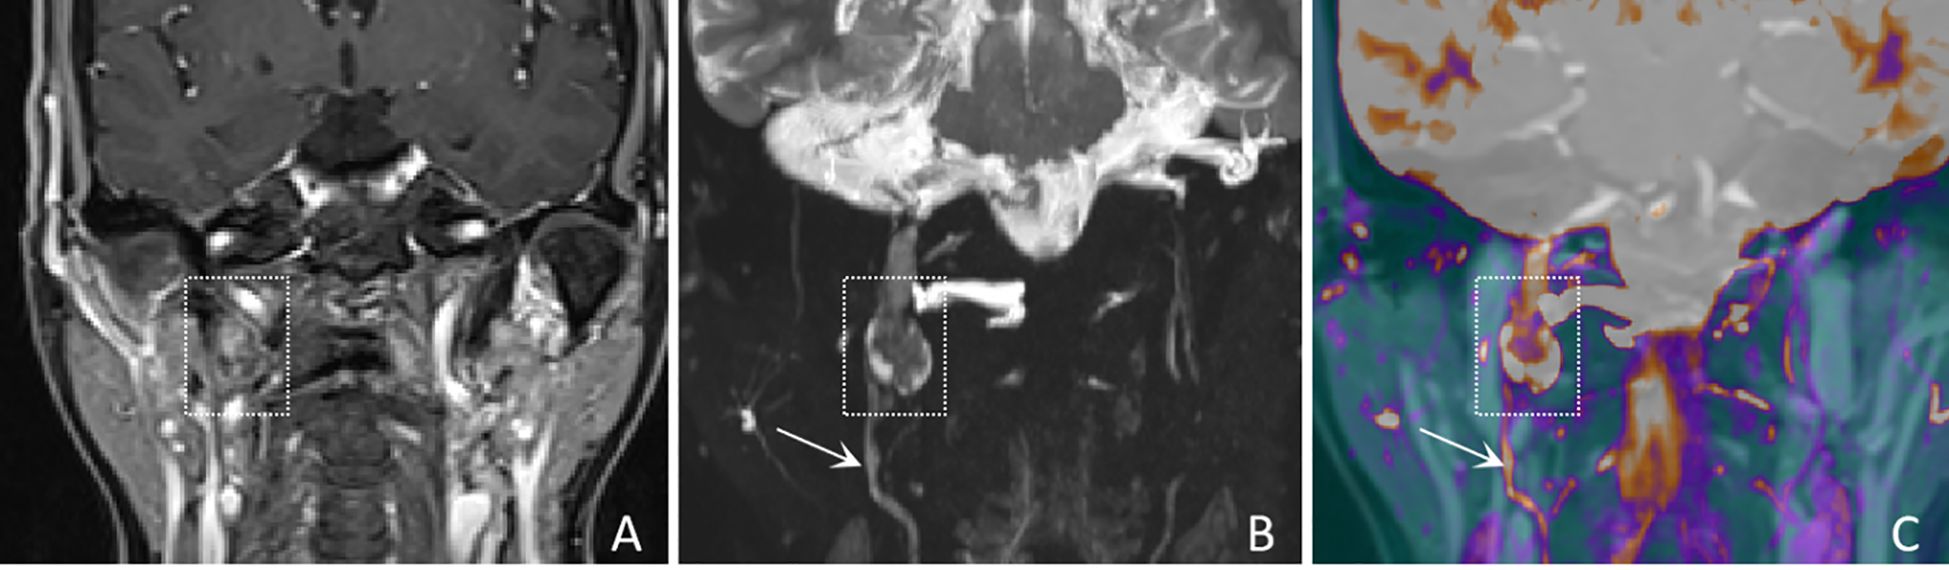
Figure 2. A 61-years-old female with a schwannoma of the right glossopharyngeal nerve, showing “enhanced target sign” and “nerve tail sign”. (A) A coronal CE-T1WI image shows a nodule inferior to the right jugular foramen, exhibiting heterogeneous enhancement (white dashed boxes), with complete obscuration of the nerve. (B) A coronal CE-MRN image shows a central low signal intensity and peripheral high signal intensity, referred to as the “enhancement target sign” (white dashed box) and “nerve tail sign” (white arrow marked). (C) A coronal fused image more clearly shows the lesion (white dashed box) and the involved nerve (white arrow).
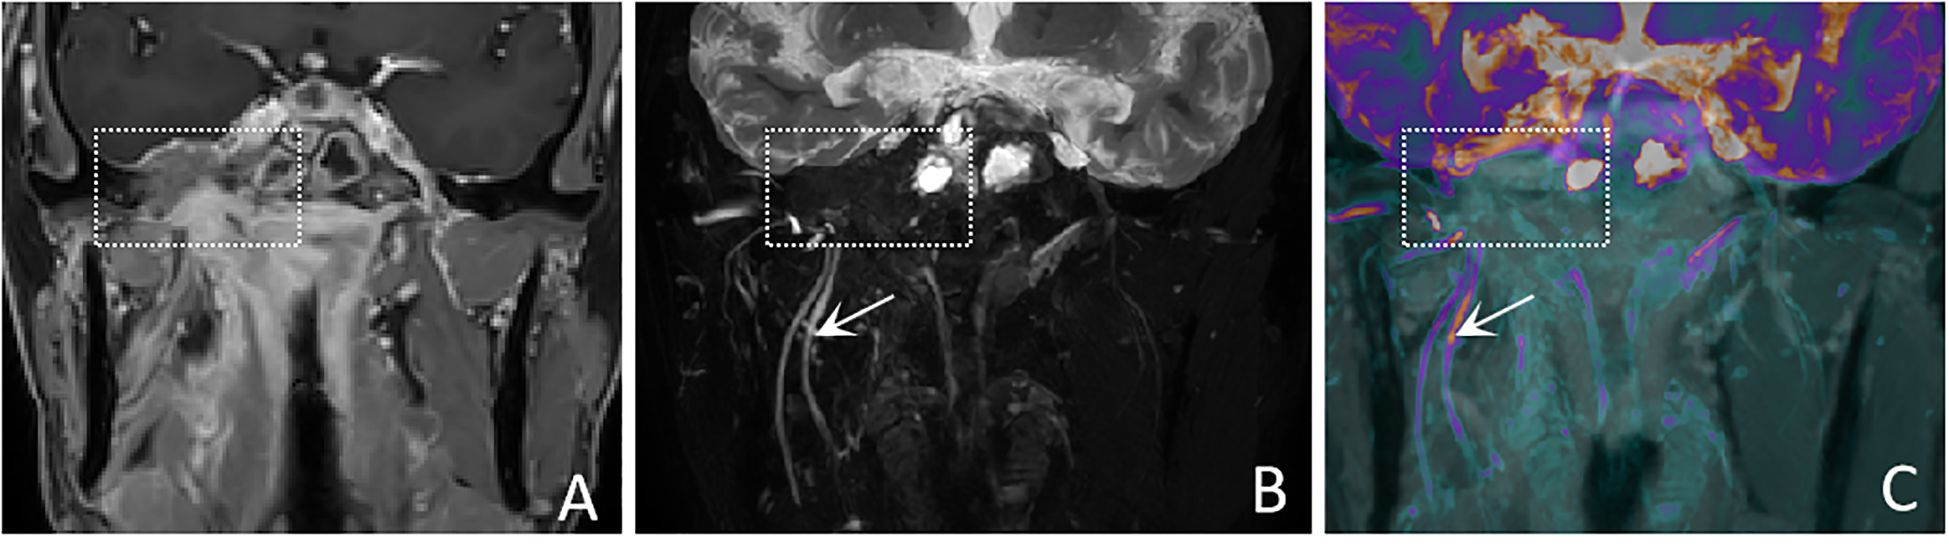
Figure 3. A 50-years-old male with nasopharyngeal carcinoma involving the right trigeminal nerve presents with the “nerve effacing sign”. (A) A Coronal CE-T1WI scan demonstrates diffuse enhancement in the parapharyngeal space and muscles, with invasion into the right side of the middle cranial fossa. (white dashed boxes) However, the trigeminal nerve and its branches are not visualized. (B) A coronal CE-MRN image shows diffuse signal decrease in the region of the mandibular nerve., indicative of the “nerve effacing sign” (white dashed box). Additionally, the right inferior alveolar nerve and lingual nerve are thickened and exhibit significantly increased signal intensity (white arrows). (C) A coronal fused image simultaneously displays the lesion (white dashed box) as well as the involved trigeminal nerve and its branches (white arrows).
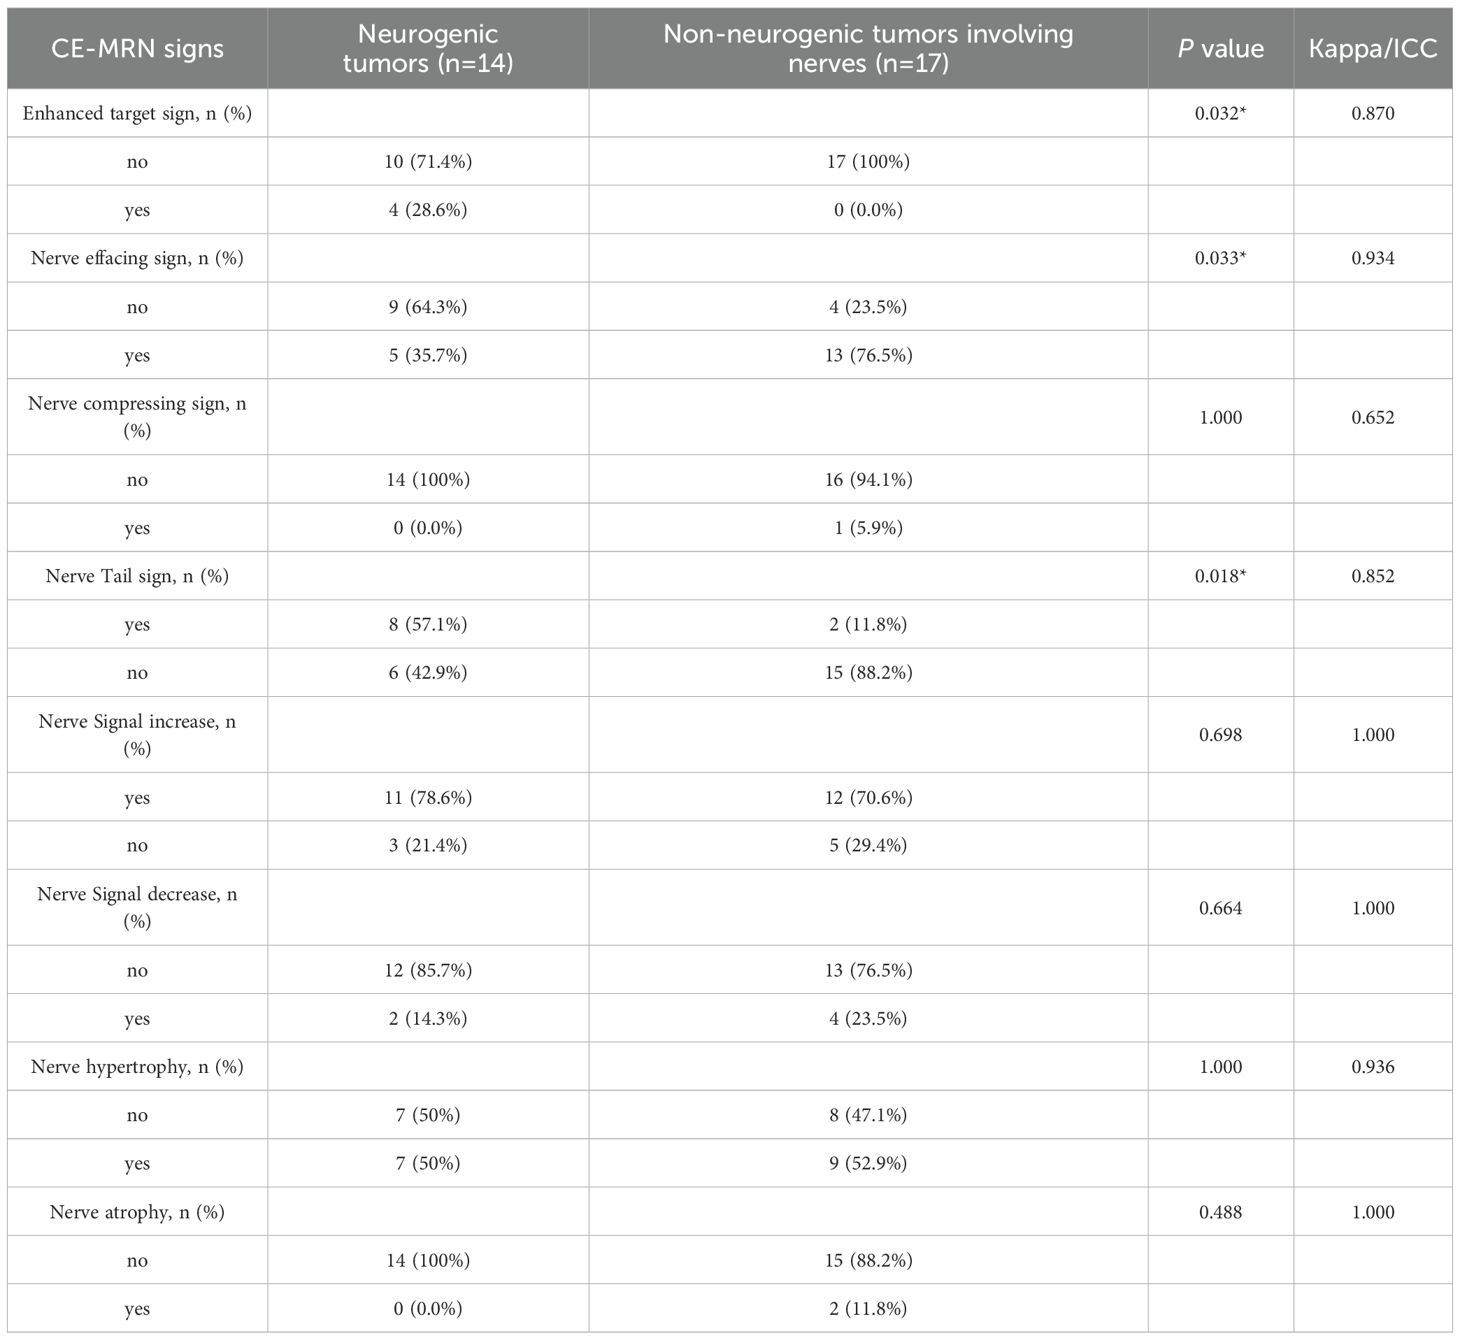
Table 4. Comparison of the incidence of novel CE-MRN signs between the neurogenic tumor group and the non-neurogenic tumor group.
Comparison of signal intensity between affected nerves and unaffected nerves
The SInerve/muscle was significantly higher than that of contralateral uninvolved nerves/adjacent muscles (p < 0.001) (Figure 4).
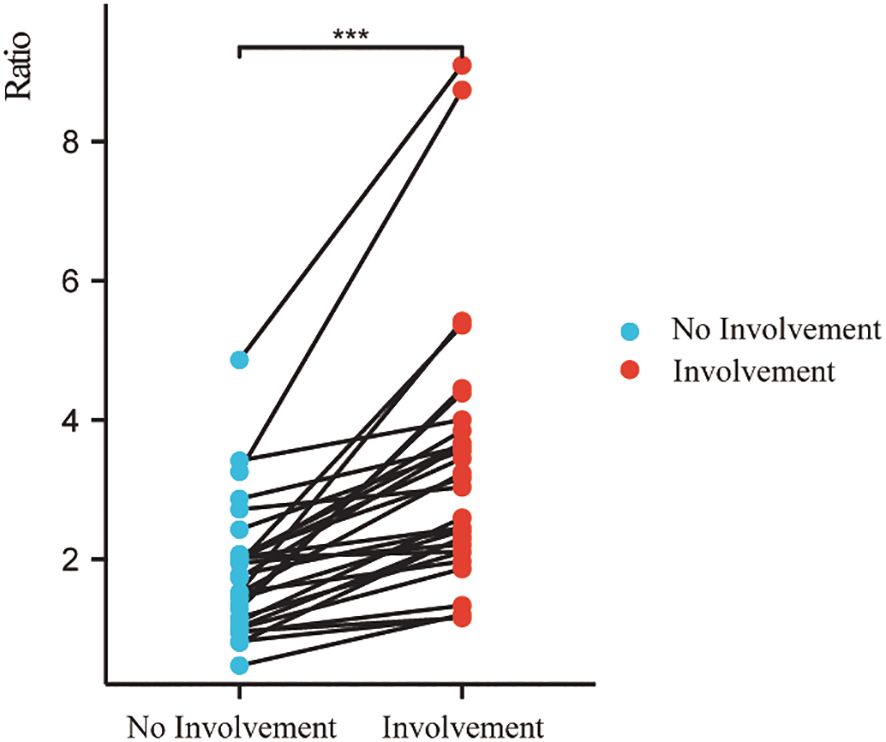
Figure 4. Signal intensity ratio of involved nerves was significantly higher than that of uninvolved nerves. (***p < 0.001).
Comparison of diagnostic confidence and lesion conspicuity between CE-T1WI, CE-MRN, and fused imaging
In both neurogenic and non-neurogenic groups, as well as across all subjects, CE-MRN and fused imaging demonstrated significantly higher diagnostic confidence scores compared to CE-T1WI when identifying the relationship between lesions and nerves (p < 0.001). However, the lesion conspicuity scores of CE-MRN were markly lower than those of CE-T1WI and fused imaging (p < 0.01) (Figure 5).
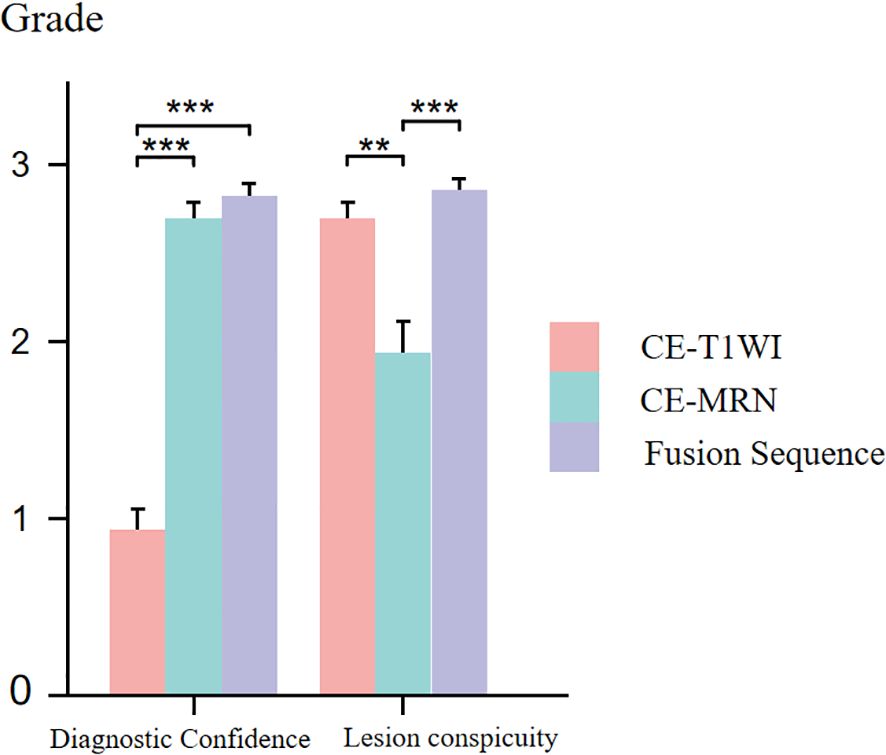
Figure 5. Comparison of diagnostic confidence and lesion visualization between CE-T1WI, CE-MRN and fused imaging. (**p < 0.01, ***p < 0.001).
Discussion
CE-MRN demonstrates significant advantages in visualizing peripheral nerves but exhibits limitations in depicting solid tumor lesions. Present research concerning head and neck neuroimaging is chiefly concerned with dental surgery, nerve injury, or trauma and inflammatory conditions, and it predominantly uses 3D reconstruction instead of image fusion (15, 16). In this study, creatively using image fusion technology, we fused CE-T1WI and CE-MRN images to display both the enhanced tumor parenchyma and involved nerves, thereby achieving simultaneous imaging. This approach significantly improves diagnostic confidence for head and neck peripheral nerve tumors. Additionally, through a comparative analysis of the imaging characteristics between neurogenic and non-neurogenic tumors, we identified significant differences in nerve involvement patterns and MRI findings. We further elucidated the diagnostic value of both classical MRI signs and novel CE-MRN signs, including “enhanced target sign” “nerve tail sign” and “nerve effacing sign”, as well as nerve signal changes in distinguishing neurogenic and non-neurogenic tumors involving nerves in the head and neck region.
This study reveals that nerves are mainly affected focally in neurogenic tumors, whereas affected diffusely in the non-neurogenic malignancies. observation aligns with the localized expansive growth characteristics of benign neurogenic tumors such as schwannomas, and also reflects the pathological characteristics of malignant tumors spreading along the perineural spaces (17–19). In the novel CE-MRN signs (14), the “Enhanced target sign” manifests as a central region of low signal intensity surrounded by a peripheral region of high signal intensity. The underlying formation mechanism may be related to the differential enhancement between the Antoni A zone (cell-dense zone) and the Antoni B zone (mucous-like matrix zone) in schwannomas (20). The “nerve tail sign” serves as a direct imaging marker for neurogenic tumors by directly demonstrates the anatomical continuity between the tumor and the host nerve (21). Additionally, the “nerve effacing sign” may serve as an indicator of malignant tumors with PNS. The solid components of the tumor, characterized by their abundant blood vascularity and contrast agent penetration, exhibit a diffuse signal reduction on CE-MRN. This imaging finding mimics the appearance of affected nerves being incorporated into the tumor mass (22). The novel series of signs offers a new perspective for assessing nerve involvement and tumor features.
It is worth noting that some neurogenic tumors also exhibit the “nerve effacing sign”. We speculate that certain neurogenic tumors may present with marginal enhancement, causing the truncated host nerves at the tumor margins on CE-MRN images. This phenomenon contrasts with the signal reduction observed in non-neurogenic malignancies on CE-MRN images, yet both represent examples of the “negative enhancement” effect of paramagnetic contrast agents on T2-weighted images (23). This study also found that the signal intensity of the affected distal nerves was generally increased compared to the unaffected nerves (24). This could be associated with secondary alterations following nerve injury such as edema, demyelination, and Wallerian degeneration. Previous studies have demonstrated that the signal intensity of injured nerves varies with the progression of different phases. Specifically, during the acute and subacute phases, factors such as edema, demyelination, and Wallerian degeneration may contribute to an increase in signal intensity. In contrast, during the chronic phase, the formation of fibrosis may result in a decrease in signal intensity (25–27).
CE-MRN leverages the T2 shortening effect of paramagnetic contrast agents, and integrates 3D high-resolution T2-weighted inversion recovery sequences to effectively suppress background signals originating from blood vessels, muscles, salivary gland and lymph nodes, thereby significantly enhancing the visualization of nerves (8–10, 28). This imaging technique relies on the existence of the blood-nerve barrier (BNB), which prevents the penetration of contrast agent, thereby maintaining relatively high signal intensity in nerves. However, the processes of tumor tissue neoangiogenesis and BNB disruption facilitate contrast agent penetration, which in turn reduces T2 signal intensity (29), creating high contrast between tumors and nerves. However, this characteristic of CE-MRN can be considered a double-edged sword, as it enhances nerve visibility simultaneously diminishing the delineation of tumor contours. CE-T1WI always clearly displays the solid enhancement components of tumors. The fusion of CE-T1WI and CE-MRN can simultaneously preserve nerve contrast and tumor visibility, facilitating the identification of anatomical relationship between tumors and nerves. This approach not only reduces diagnostic uncertainty but also increases interpreter confidence. In surgical planning for neuro-adjacent tumors, it provides intuitive spatial guidance for optimizing surgical trajectories and minimizing intraoperative nerve injury. For malignancies with neural invasion, the technique enables more precise radiotherapy target delineation, ensuring adequate tumor coverage while protecting critical neural structures. Ultimately, it offers an enhanced visual solution for managing neural tumors.
This study has certain limitations. Firstly, the small sample size and the variety of tumor types could reduce the statistical power. Furthermore, the fusion techniques now require manual registration, which is not only laborious but also subject to subjective bias; thus, In the next phase of our research, We are conducting a prospective cohort study while actively promoting CE-MRN and collecting multi-center cases for external validation, aiming to further evaluate and enhance the general applicability of our research methodology and conclusions. there is a need to develop automated fusion algorithms in the future to enhance efficiency. Future research could combine artificial intelligence algorithms to optimize image registration efficiency, integrate advanced technologies such as DTI and PET-MRI through multimodal integration, and explore multi-parameter quantitative models to improve diagnostic accuracy.
Conclusion
This study retrospectively analyzed MRI data from patients with neurogenic and non-neurogenic head and neck tumors involving cranial nerves. The results showed distinct imaging characteristics between the two types of tumors on conventional MRI and CE-MRN. Furthermore, the image fusion of CE-T1WI and CE-MRN significantly improved diagnostic confidence and lesion conspicuity, thereby providing a feasible method for simultaneous nerve-tumor visualization in the head and neck.
Data availability statement
The raw data supporting the conclusions of this article will be made available by the authors, without undue reservation.
Ethics statement
This study was a retrospective investigation conducted in accordance with the principles of the Declaration of Helsinki. The study protocol was approved by the Medical Ethics Committee of Union Hospital, Tongji Medical College, Huazhong University of Science and Technology, and was performed in compliance with all applicable local regulations and institutional requirements.
Author contributions
TL: Visualization, Project administration, Data curation, Formal analysis, Methodology, Validation, Supervision, Conceptualization, Writing – original draft, Software, Investigation. ZZ: Conceptualization, Validation, Data curation, Investigation, Writing – original draft, Software, Visualization. YL: Supervision, Data curation, Writing – original draft, Software, Methodology, Visualization. YS: Validation, Formal analysis, Writing – original draft, Project administration, Methodology, Software. QY: Formal analysis, Methodology, Writing – original draft, Project administration. CL: Formal analysis, Project administration, Validation, Writing – original draft. XK: Project administration, Validation, Investigation, Writing – original draft, Formal analysis, Visualization. JZ: Writing – original draft, Visualization, Validation, Formal analysis. SH: Writing – original draft, Validation, Methodology. CZ: Writing – original draft, Formal analysis, Resources, Funding acquisition, Writing – review & editing. WW: Writing – original draft, Validation, Conceptualization, Project administration, Data curation, Supervision, Methodology, Writing – review & editing, Investigation, Visualization, Formal analysis, Software. LW:Writing – original draft, Data curation, Supervision, Methodology, Conceptualization, Writing – review & editing, Investigation, Formal analysis, Resources, Visualization, Funding acquisition, Project administration.
Funding
The author(s) declare financial support was received for the research and/or publication of this article. Support for the research came from the Hubei Provincial Key R&D Program (Grant number: 2022BCA034) and the Hubei Provincial Health Commission Project (Grant number: WJ2025M130).
Conflict of interest
The authors declare that the research was conducted in the absence of any commercial or financial relationships that could be construed as a potential conflict of interest.
Generative AI statement
The author(s) declare that no Generative AI was used in the creation of this manuscript.
Any alternative text (alt text) provided alongside figures in this article has been generated by Frontiers with the support of artificial intelligence and reasonable efforts have been made to ensure accuracy, including review by the authors wherever possible. If you identify any issues, please contact us.
Publisher’s note
All claims expressed in this article are solely those of the authors and do not necessarily represent those of their affiliated organizations, or those of the publisher, the editors and the reviewers. Any product that may be evaluated in this article, or claim that may be made by its manufacturer, is not guaranteed or endorsed by the publisher.
Supplementary material
The Supplementary Material for this article can be found online at: https://www.frontiersin.org/articles/10.3389/fonc.2025.1692893/full#supplementary-material
Supplementary Table 1 | Inter-observer Consistency of CE-MRN Findings: A Comparison Between Different Scanner Models (Kappa).
Abbreviations
MRN, magnetic resonance neurography; CE-MRN, contrast-enhanced magnetic resonance neurography; CE-T1WI, contrast-enhanced T1-weighted imaging; PNS, perineural spread; PNI, perineural invasion; BNB, blood-nerve barrier; SInerve/muscle, signal intensity ratio of nerve-to-muscle; TR, repetition time; TE, echo time; TI, inversion time; FOV, field of view; ETL, echo train length; ICC, intraclass correlation coefficient; MIP, maximum intensity projection; MPR, multi-planar reconstruction; T1WI, T1-weighted imaging; T2WI, T2-weighted imaging.
References
1. Schmitd LB, Scanlon CS, and D’Silva NJ. Perineural invasion in head and neck cancer. J Dent Res. (2018) 97:742–50. doi: 10.1177/0022034518756297
2. Tu W, Gottumukkala RV, Schieda N, Lavallée L, Adam BA, and Silverman SG. Perineural invasion and spread in common abdominopelvic diseases: imaging diagnosis and clinical significance. Radiographics. (2023) 43:e220148. doi: 10.1148/rg.220148
3. Curati WL and Bydder GM. Magnetic resonance imaging: present position and future prospects. Eur J Cancer. (1996) 32A(4):589–92. doi: 10.1016/0959-8049(96)00008-1
4. Baulch J, Gandhi M, Sommerville J, and Panizza B. 3T MRI evaluation of large nerve perineural spread of head and neck cancers. J Med Imaging Radiat Oncol. (2015) 59(5):578–85. doi: 10.1111/1754-9485.12338
5. Foesleitner O, Kirchner M, Preisner F, Kronlage M, Godel T, Jende JME, et al. High-resolution US vs MR neurography for diagnosis of upper extremity peripheral nerve disorders. Radiology. (2025) 314:e232063. doi: 10.1148/radiol.232063
6. Ward RE, Dave N, Pai EL-L, Colbourn R, Banihashemi A, Nasta SD, et al. Methotrexate-associated peripheral neuropathy on 18F-FDG PET/CT and MRI masquerading as neurolymphomatosis. Clin Nucl Med. (2025). Available online at: https://pubmed.ncbi.nlm.nih.gov/40247463/.
7. Deshmukh S. Peripheral nerve imaging: MR neurography versus high-resolution US. Radiology. 314(3):e242775. doi: 10.1148/radiol.242775
8. Wang L, Niu Y, Kong X, Yu Q, Kong X, Lv Y, et al. The application of paramagnetic contrast-based T2 effect to 3D heavily T2W high-resolution MR imaging of the brachial plexus and its branches. Eur J Radiol. (2016) 85:578–84. doi: 10.1016/j.ejrad.2015.12.001
9. Wu W, Wu F, Liu D, Zheng C, Kong X, Shu S, et al. Visualization of the morphology and pathology of the peripheral branches of the cranial nerves using three-dimensional high-resolution high-contrast magnetic resonance neurography. Eur J Radiol. (2020) 132:109137. doi: 10.1016/j.ejrad.2020.109137
10. Wu W, Ding Y, Su Y, Wang Y, Liu T, Liu D, et al. Contrast-enhanced magnetic resonance neurography for diagnosing brachial plexopathy: improved visualization and additional imaging features. Sci Rep. (2024) 14:20758. doi: 10.1038/s41598-024-71554-5
11. Ensle F, Zecca F, Kerber B, Lohezic M, Wen Y, Kroschke J, et al. 3D MR Neurography of craniocervical nerves: comparing DESS and post-contrast STIR with deeplearning-based reconstruction at 1.5T. AJNR Am J Neuroradiol. (2025) 46(9):1908–16. doi: 10.3174/ajnr.A8750
12. Xu Z, Zhang T, Chen J, Liu Z, Wang T, Hu Y, et al. Combine contrast-enhanced 3D T2-weighted short inversion time inversion recovery MR neurography with MR angiography at 1.5 T in the assessment of brachial plexopathy. MAGMA. (2021) 34:229–39. doi: 10.1007/s10334-020-00867-z
13. He A, Ray G, Pezeshk P, Eajazi A, Karatas R, Rayer DAMA, et al. 3D color-rendered MR neurography heatmaps in visualizing normal lumbosacral (LS) plexus and increasing conspicuity of LS plexopathy. Eur Radiol. (2025) 35:1679–86. doi: 10.1007/s00330-024-11138-z
14. Wu W, Ding Y, Su Y, Wang Y, Liu T, Zhang Z, et al. Novel MRI signs for differentiating neurogenic and non-neurogenic peripheral nerve Tumors: Insights from Contrast-Enhanced magnetic resonance neurography. Eur J Radiol. (2025) 183:111894. doi: 10.1016/j.ejrad.2024.111894
15. Huang H, Yan Y, Jiang D, Zhao X, Cao D, and She D. Is 3T MR nerve-bone fusion imaging a viable alternative to MRI-CBCT to identify the relationship between the inferior alveolar nerve and mandibular third molar. Clin Oral Investig. (2024) 28:256. doi: 10.1007/s00784-024-05649-8
16. Al-Haj Husain A, Stadlinger B, Winklhofer S, Müller M, Piccirelli M, and Valdec S. Mandibular third molar surgery: intraosseous localization of the inferior alveolar nerve using 3D double-echo steady-state MRI (3D-DESS). Diagnostics (Basel). (2021) 11:1245. doi: 10.3390/diagnostics11071245
17. Urban T, Lim R, Merker VL, Muzikansky A, Harris GJ, Kassarjian A, et al. Anatomic and metabolic evaluation of peripheral nerve sheath tumors in patients with neurofibromatosis 1 using whole-body MRI and (18)F-FDG PET fusion. Clin Nucl Med. (2014) 39:e301–307. doi: 10.1097/RLU.0b013e3182a757d3
18. Single-cell RNA sequencing reveals ECM remodeling-tumor stiffness-FAK as a key driver of vestibular schwannoma progression. (Accessed July 31, 2025).
19. Kwiecien C, Workman AD, Wilensky J, Lerner DK, Rathi VK, Douglas JE, et al. Longer-term surveillance imaging and endoscopy critical for majority of patients in detection of sinonasal Malignancy recurrence. Int Forum Allergy Rhinol. (2024) 14:1739–45. doi: 10.1002/alr.23412
20. Debs P, Fayad LM, and Ahlawat S. MR neurography of peripheral nerve tumors and tumor-mimics. Semin Roentgenol. (2022) 57:232–40. doi: 10.1053/j.ro.2022.01.008
21. Lefebvre G and Le Corroller T. Ultrasound and MR imaging of peripheral nerve tumors: the state of the art. Skeletal Radiol. (2023) 52:405–19. doi: 10.1007/s00256-022-04087-5
22. Caldemeyer KS, Mathews VP, Righi PD, and Smith RR. Imaging features and clinical significance of perineural spread or extension of head and neck tumors. Radiographics. (1998) 18:97–110; quiz 147. doi: 10.1148/radiographics.18.1.9460111
23. Wang Y, Wu W, Kang J, Su Y, Liu T, Zhao J, et al. Combination of morphological and multiparametric MR neurography enhances carpal tunnel syndrome diagnosis and evaluation. Sci Rep. (2025) 15:184. doi: 10.1038/s41598-024-84489-8
24. Antil N, ElGuindy Y, and Lutz AM. Do not forget the brachial plexus-prevalence of distal brachial plexus pathology on routine shoulder MRI. Eur Radiol. (2021) 31:3555–63. doi: 10.1007/s00330-020-07476-3
25. Endocytosis-associated patterns in nerve regeneration after peripheral nerve injury. (Accessed July 31, 2025).
26. Peripheral nerve injury, scarring, and recovery. Available online at: https://sci-hub.ru//downloads/2020-02-28/98/wang2018.pdfnavpanes=0&view=FitH (Accessed July 31, 2025).
27. Sorby-Adams AJ, Marcoionni AM, Dempsey ER, Woenig JA, and Turner RJ. The role of neurogenic inflammation in blood-brain barrier disruption and development of cerebral oedema following acute central nervous system (CNS) injury. Int J Mol Sci. (2017) 18:1788. doi: 10.3390/ijms18081788
28. Casselman J, van der Cruyssen F, Vanhove F, Peeters R, Hermans R, Politis C, et al. 3D CRANI, a novel MR neurography sequence, can reliable visualise the extraforaminal cranial and occipital nerves. Eur Radiol. (2023) 33:2861–70. doi: 10.1007/s00330-022-09269-2
29. Biology of the human blood-nerve barrier in health and disease. Available online at: https://sci-hub.ru//downloads/2020-07-11/6f/ubogu2020.pdfnavpanes=0&view=FitH (Accessed July 31, 2025).
Keywords: contrast-enhanced magnetic resonance neuroimaging, peripheral nerve tumors, image fusion technology, neurogenic tumors, non-neurogenic tumors
Citation: Liu T, Zhang Z, Liu Y, Su Y, Yu Q, Li C, Kong X, Zhao J, Huang S, Zheng C, Wu W and Wang L (2025) Fusion of contrast-enhanced magnetic resonance neurography and T1-weighted imaging improves simultaneous nerve-tumor visualization in head and neck lesions. Front. Oncol. 15:1692893. doi: 10.3389/fonc.2025.1692893
Received: 03 September 2025; Accepted: 06 October 2025;
Published: 22 October 2025.
Edited by:
Min Wu, Sichuan University, ChinaReviewed by:
Lihua Yuan, Nanjing Drum Tower Hospital, ChinaMahboube Sadat Hosseini, Shahid Beheshti University, Iran
Copyright © 2025 Liu, Zhang, Liu, Su, Yu, Li, Kong, Zhao, Huang, Zheng, Wu and Wang. This is an open-access article distributed under the terms of the Creative Commons Attribution License (CC BY). The use, distribution or reproduction in other forums is permitted, provided the original author(s) and the copyright owner(s) are credited and that the original publication in this journal is cited, in accordance with accepted academic practice. No use, distribution or reproduction is permitted which does not comply with these terms.
*Correspondence: Wenjun Wu, d3VoYW5fd3V3akAxNjMuY29t; Lixia Wang, bGlzYTIwMDM2MjdfMUAxNjMuY29t
†These authors have contributed equally to this work