 Yuyang Wang1,2,3†Shanshan Jiang1,2,3†Yanjie Yang1,2†Yi Li1,2,3Zhiying Li4Ziqiao Lei1,2,3*
 Xiangchuang Kong1,2,3*
 Guofeng Zhou1,2,3*
- 1Department of Radiology, Union Hospital, Tongji Medical College, Huazhong University of Science and Technology, Wuhan, China
- 2Hubei Provincial Clinical Research Center for Precision Radiology and Interventional Medicine, Wuhan, China
- 3Hubei Key Laboratory of Molecular Imaging, Wuhan, China
- 4Department of Gastrointestinal Surgery, Union Hospital, Tongji Medical College, Huazhong University of Science and Technology, Wuhan, China
Background: Gastric cancer remains a leading cause of cancer-related mortality. While immune checkpoint inhibitors (ICIs) have emerged as promising therapies, their efficacy is hindered by the lack of robust patient-centric biomarkers. CT-derived extracellular volume fraction (ECV) has emerged as a novel approach for non-invasive quantification of the extracellular matrix (ECM). This study assesses the predictive value of ECV, a non-invasive imaging biomarker, in gastric cancer patients receiving programmed death receptor-1 (PD-1) inhibitors.
Methods: A retrospective study was conducted on 101 gastric adenocarcinoma patients (stage III: n = 47; stage IV: n = 54) treated with PD-1 inhibitors at Wuhan Union Hospital from June 21, 2020 to January 3, 2024. The patients were stratified into high- and low-ECV groups using X-tile software. Survival outcomes were compared using Kaplan–Meier curves and log-rank tests. Cox regression analyses identified independent prognostic factors. Two predictive models were developed and evaluated via receiver operating characteristic (ROC) curves and area under the curve (AUC), with internal validation using 1,000 bootstrap iterations.
Results: Kaplan–Meier survival curves indicated that the ECV-higher group had shorter progression-free survival (PFS) (P < 0.001) and overall survival (OS) (P < 0.001) than the ECV-lower group. Multivariate Cox regression analysis confirmed that high CT-ECV was independently associated with worse PFS and OS (PFS: HR = 2.716, 95% CI: 1.432–5.152, P = 0.002 and OS: HR = 2.593, 95% CI: 1.322–5.084, P = 0.006).
Conclusion: CT-derived ECV may serve as an independent predictor of long-term survival in gastric cancer patients undergoing immunotherapy.
Introduction
Gastric cancer is the fifth most common malignant tumor worldwide, with the 2024 statistics showing over 960,000 new cases annually and its ranking as the fifth leading cause of cancer-related deaths (1). In recent years, immune checkpoint inhibitors (ICIs), such as programmed cell death ligand-1 (PD-L1)/programmed death receptor-1 (PD-1) inhibitors, have significantly improved the survival outcomes for some advanced gastric cancer patients. However, existing biomarkers like PD-L1 expression, microsatellite instability (MSI), and Epstein–Barr virus (EBV) infection status, while partially predictive of therapeutic efficacy, exhibit high heterogeneity in expression influenced by tumor histotype, individual genetic background, and dynamic microenvironment changes (2). This results in most patients failing to benefit from immunotherapy, with some potentially experiencing worsened conditions due to immune-related adverse events (irAEs). Therefore, identifying novel biomarkers that overcome heterogeneity limitations has become an urgent need to optimize precision stratification in gastric cancer immunotherapy.
The extracellular matrix (ECM), a three-dimensional macromolecular network composed of collagens, proteoglycans/glycosaminoglycans, elastin, fibronectin, laminins, several other glycoproteins, and various molecules (cytokines, growth factors, and hormones) (3), is essential for cellular functions including proliferation, migration, and differentiation through cell–ECM interactions (4). As a dynamic structure present in all tissues, ECM not only provides structural integrity but also maintains homeostasis through continuous remodeling in response to environmental stimuli (5, 6). Dysregulated ECM remodeling accelerates disease progression and tumor-associated ECM alterations promote tumor growth through tumor-stromal signaling, while increased matrix stiffness facilitates tumor invasion. This vicious cycle creates dense ECM barriers around tumor cells that physically impede drug penetration, reducing therapeutic efficacy (7, 8).
Traditional ECM assessment relying on invasive biopsy staining techniques (e.g., Masson staining) suffers from limitations in dynamic monitoring. Recently, radiomics-based extracellular volume fraction (ECV) technology has emerged as a novel approach for noninvasive ECM quantification. By calculating the distribution differences of intravenous contrast agents (e.g., iodinated contrast) in extracellular spaces, ECV indirectly reflects the ECM fibrosis degree and spatial distribution (9). Originally developed for cardiac fibrosis assessment (10), ECV has demonstrated value in evaluating liver cirrhosis and pancreatic fibrosis and predicting tumor regression grade after neoadjuvant therapy in gastric cancer and postoperative pancreatic complications (11–13). Multiple studies have validated ECV as a quantitative biomarker for ECM assessment in various solid tumors (14–18). Although ECV’s potential in gastric cancer has gained attention (4, 19–23), its clinical translational value for predicting immunotherapy outcomes remains unclear. This study proposes using contrast-enhanced computed tomography (CECT) to measure ECV, aiming to quantify gastric cancer ECM fibrosis as a reflection of suppressive tumor immune microenvironment status, thereby predicting survival benefits from PD-1/PD-L1 inhibitor therapy.
Methods
Patients
A total of 195 patients with gastric adenocarcinoma who received PD-1 inhibitor immunotherapy at Wuhan Union Hospital between June 21, 2020 and January 3, 2024 were initially enrolled. All enrolled patients were treated with anti-PD-1 immunotherapy. The vast majority received it in combination with standard first-line chemotherapy. The anti-PD-1 inhibitors used in this cohort included nivolumab, pembrolizumab, sintilimab, tislelizumab, camrelizumab, toripalimab, and envafolimab. The chemotherapy regimens consisted of XELOX (capecitabine and oxaliplatin), SOX (S-1 and oxaliplatin), or FOLFOX (leucovorin, fluorouracil, and oxaliplatin). The choice of therapeutic regimen was determined by the treating oncologist based on contemporary clinical guidelines and the patient’s individual condition. The exclusion criteria were as follows: (a) prior or planned curative-intent gastrectomy, (b) prior neoadjuvant therapy before surgery, (c) iodine contrast allergy, (d) inadequate gastrointestinal preparation leading to unclear tumor visualization, and (e) absent or poor contrast enhancement. Ultimately, 101 patients who underwent CECT before immunotherapy were included for analysis. Clinical and biochemical data were collected retrospectively. These included age, sex, hematocrit levels, and serum tumor markers, specifically carbohydrate antigen 19-9 (CA19-9) and carcinoembryonic antigen (CEA). Laboratory values were obtained from routine blood tests performed within 7 days of the CT scan. The study adhered to the principles of the Declaration of Helsinki and was approved by the Medical Ethics Committee of Wuhan Union Hospital. Written informed consent was waived due to the retrospective nature of the study.
Image acquisition
All patients provided written informed consent for abdominal CECT. Before scanning, an 8-h fasting period and iodine allergy screening were required. Abdominal imaging was performed using a 128-detector-row CT scanner (Siemens SOMATOM Definition AS+, Erlangen, Germany) with standardized parameters: tube voltage of 120 kV, automated tube current modulation, 1.5 mm slice thickness and interval, and 512 × 512 acquisition matrix. The patients were positioned supine, and nonionic iodinated contrast (350 mgI/mL) was administered via the antecubital vein at a flow rate of 2 to 3 mL/s. Contrast-enhanced images were acquired during the arterial phase (25–30 s post-injection), portal venous phase (50–60 s), and equilibrium phase (acquired at a fixed delay of 180 s post-injection). A research study has revealed that when estimating the ECV, the equilibrium phase at 180 s represents a good balance between the clinical workflow and technical success (24).
Image analysis
Two radiologists blinded to clinicopathological data (except tumor location) independently measured attenuation values on unenhanced CT and equilibrium-phase CECT. Regions of interest (ROIs) were manually placed within the tumor and the aorta at the same anatomical level (Figure 1). The extracellular volume fraction (ECV) was calculated using the following formula:
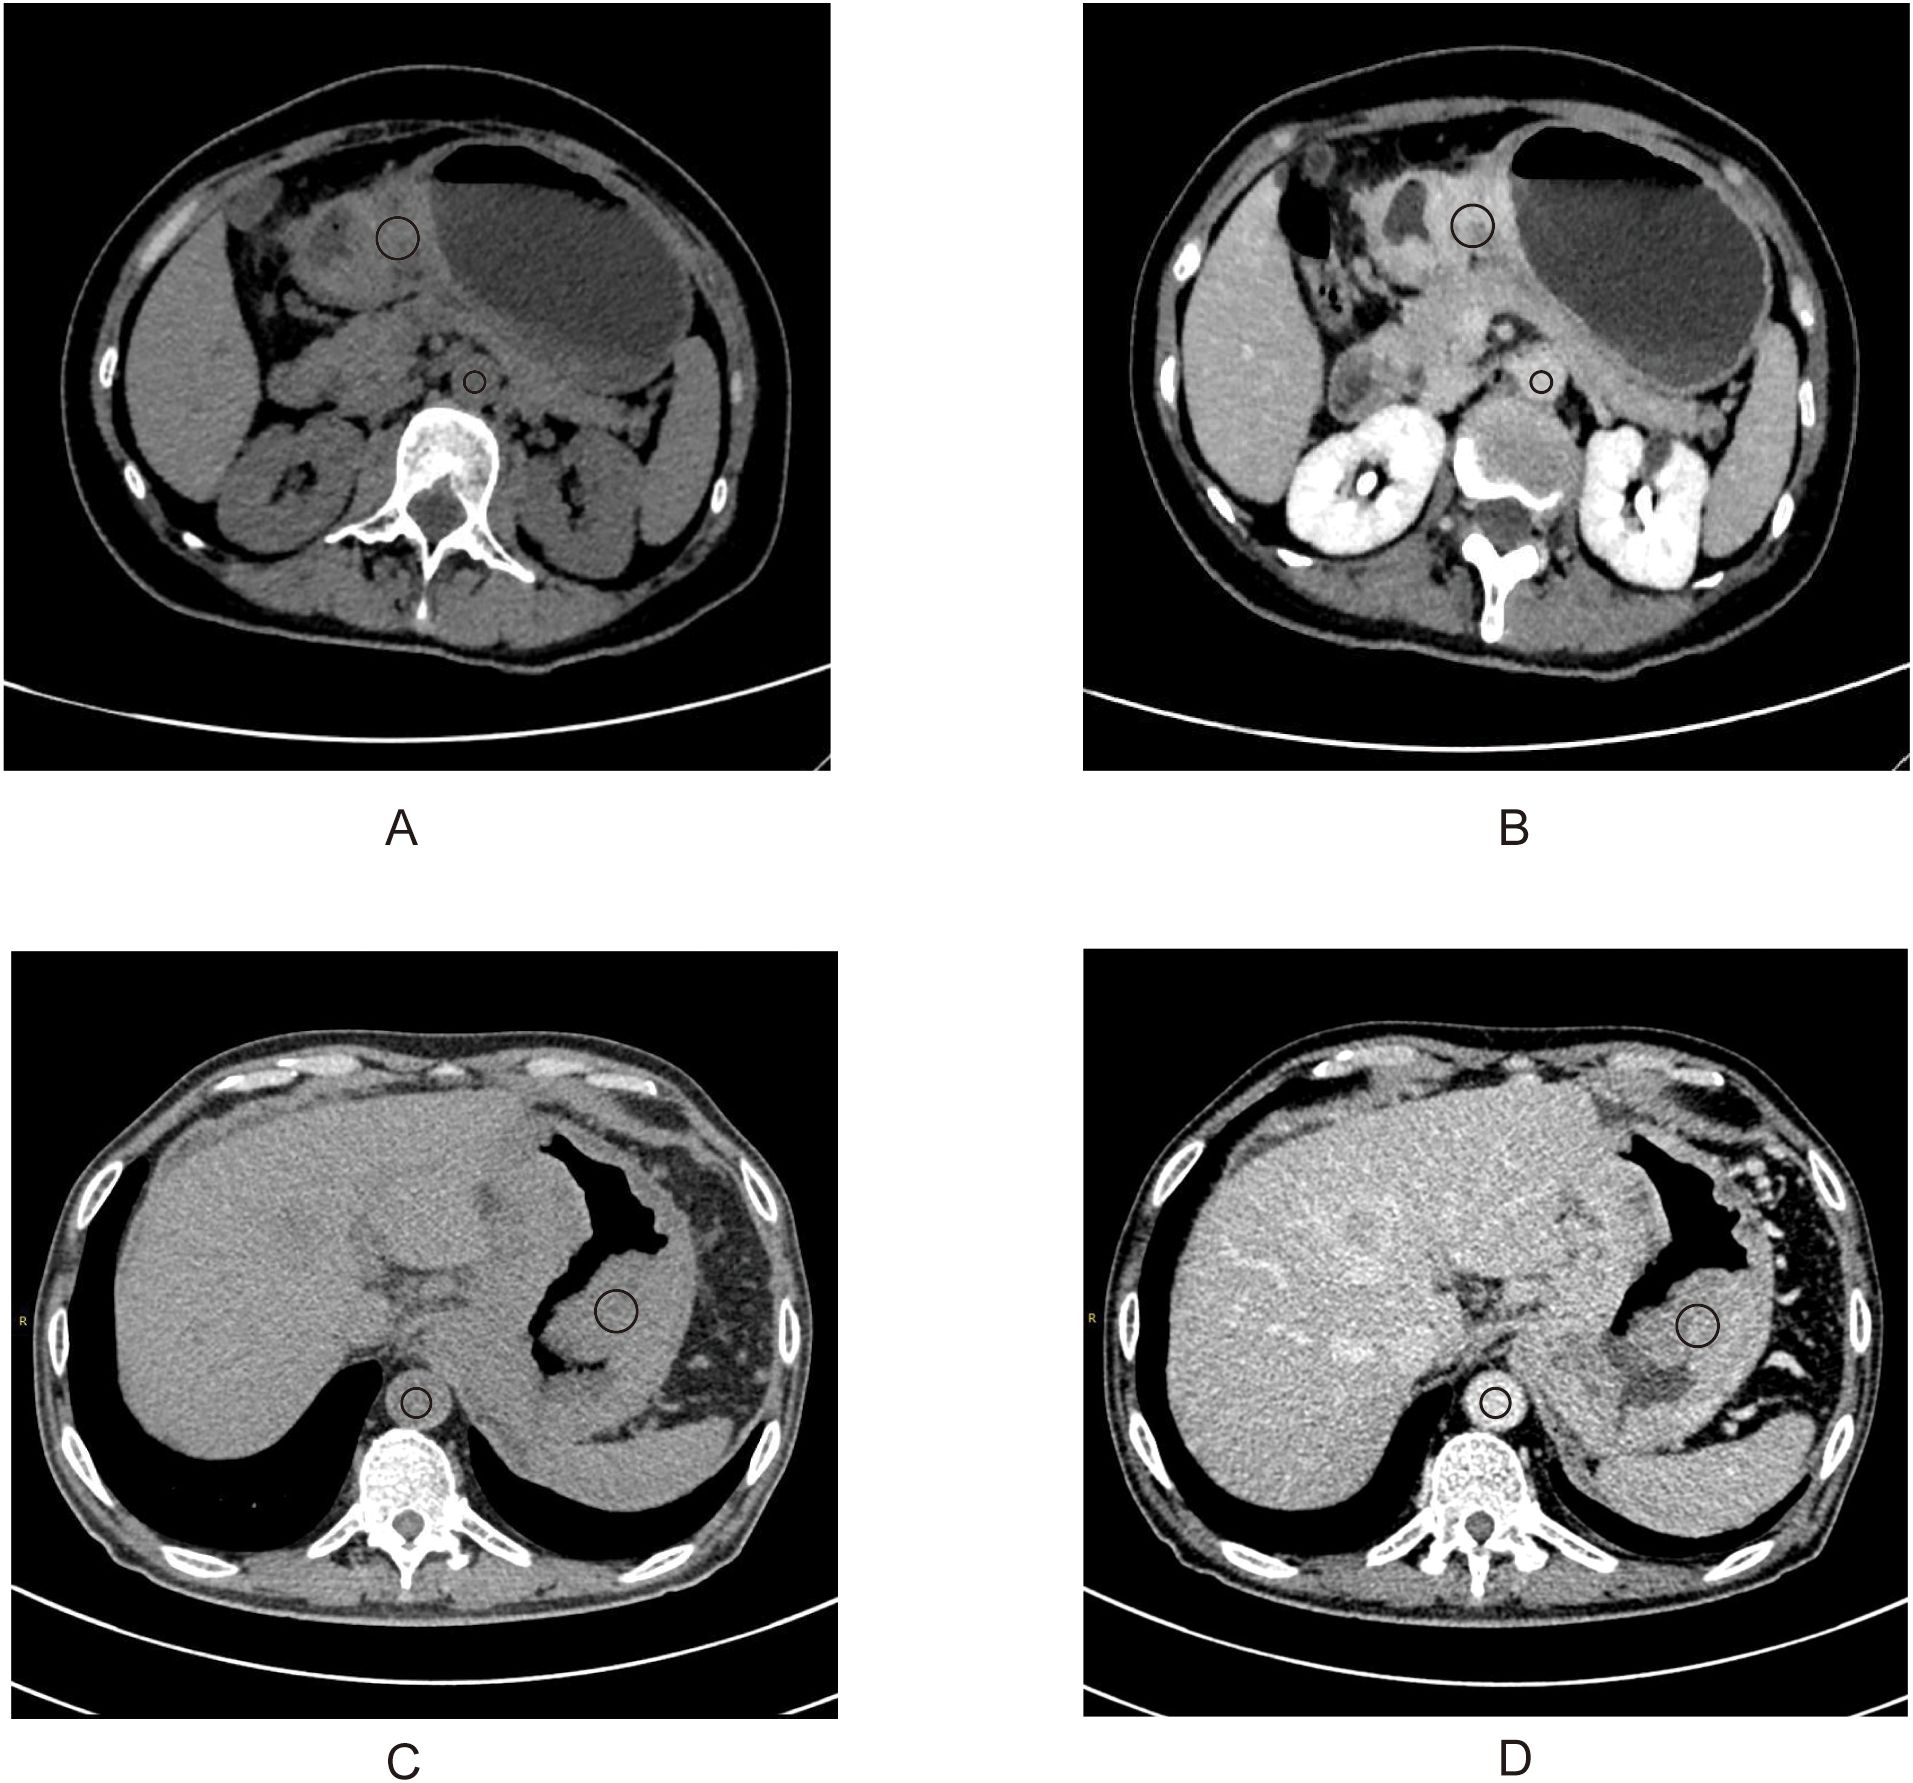
Figure 1. A 50-year-old woman with stage III gastric adenocarcinoma (A, B) and a 63-year-old man with stage IV gastric adenocarcinoma (C, D). Axial unenhanced (A, C); equilibrium-phase contrast-enhanced (B, D). The tumor extracellular volume fractions were 31.8% and 35.8%, respectively.
where ΔHUtumor and ΔHUaorta are the HU in the equilibrium phase minus the HU before the contrast agent administration of the tumor and the aorta, respectively (20). The final ECV value used for analysis was the average of the two radiologists’ measurements.
Endpoints of the study
The primary endpoint was overall survival (OS), defined as the time from the start of immunotherapy to death or the end of follow-up in cancer patients. The secondary endpoint was progression-free survival (PFS), defined as the time from the start of treatment to disease progression or death from any cause.
Statistical analysis
To evaluate the consistency of ECV measurements between two radiologists, we employed Bland–Altman analysis and the intraclass correlation coefficient (ICC). An ICC >0.90 was considered indicative of excellent consistency (25). Using X-tile (https://medicine.yale.edu/lab/rimm/research/software/) to get the optimal cutoff values (33.1), the patients were divided into high- and low-ECV groups. X-tile employs an enumeration method that systematically tests all possible values of the continuous variable as candidate cutoff thresholds. A log-rank test was subsequently applied to compare survival curves between the stratified groups, and the cutoff point yielding the smallest p-value was selected as the optimal threshold (26). Normally distributed continuous variables were compared using Student’s t-test and expressed as mean ± standard deviation (SD). Categorical variables were analyzed via chi-square or Fisher’s exact tests and reported as percentages (n, %). The PFS and OS between the high- and low-ECV groups were compared using log-rank test and visualized with Kaplan–Meier curves. Univariate and multivariate Cox regression analyses identified prognostic factors, with variables showing p < 0.05 in univariate analysis included in the multivariate model. The results were reported as hazard ratios (HRs) with 95% confidence intervals (CIs). Subgroup analyses were conducted to explore the consistency of the ECV effect. Two predictive models were constructed: model 1 included clinical stage, age group, and sex, while model 2 encompassed all variables from model 1 plus ECV stratification. The predictive performance was evaluated using ROC curves and AUC. Internal validation of AUC values was conducted using a bootstrap resampling method with 1,000 iterations. Statistical significance was defined as p < 0.05. Analyses were performed using SPSS 27.0 (IBM Corp.) and R 4.4.2 (R Foundation for Statistical Computing).
Results
Interobserver agreement of ECV measurements
The Bland–Altman analysis demonstrated excellent agreement between two radiologists in CT-ECV quantification (Supplementary Figure S1). The mean bias was 0.82 units (95% CI: 0.12–1.53), with 95% limits of agreement (LoA) ranging from -6.20 to +7.85. Approximately 95% of data points fell within the LoA, confirming high measurement reproducibility. This was further supported by an ICC of 0.971 (95% CI: 0.957–0.981) for average measures, indicating good consistency.
Patients’ baseline characteristics
A total of 101 gastric adenocarcinoma patients were included in this study. The average age was 59.3 ± 11.9 years, with 66% being male. Based on the ECV indices and using X-tile, the optimal cutoff values were determined (33.1). There were 48 patients in the low-ECV group (<33.1) and 53 patients in the high-ECV group (≥33.1). No significant differences were observed in age, sex distribution, clinical stage, tumor location, tumor markers, HCT, BMI, risk factors, or other comorbidities (Table 1).
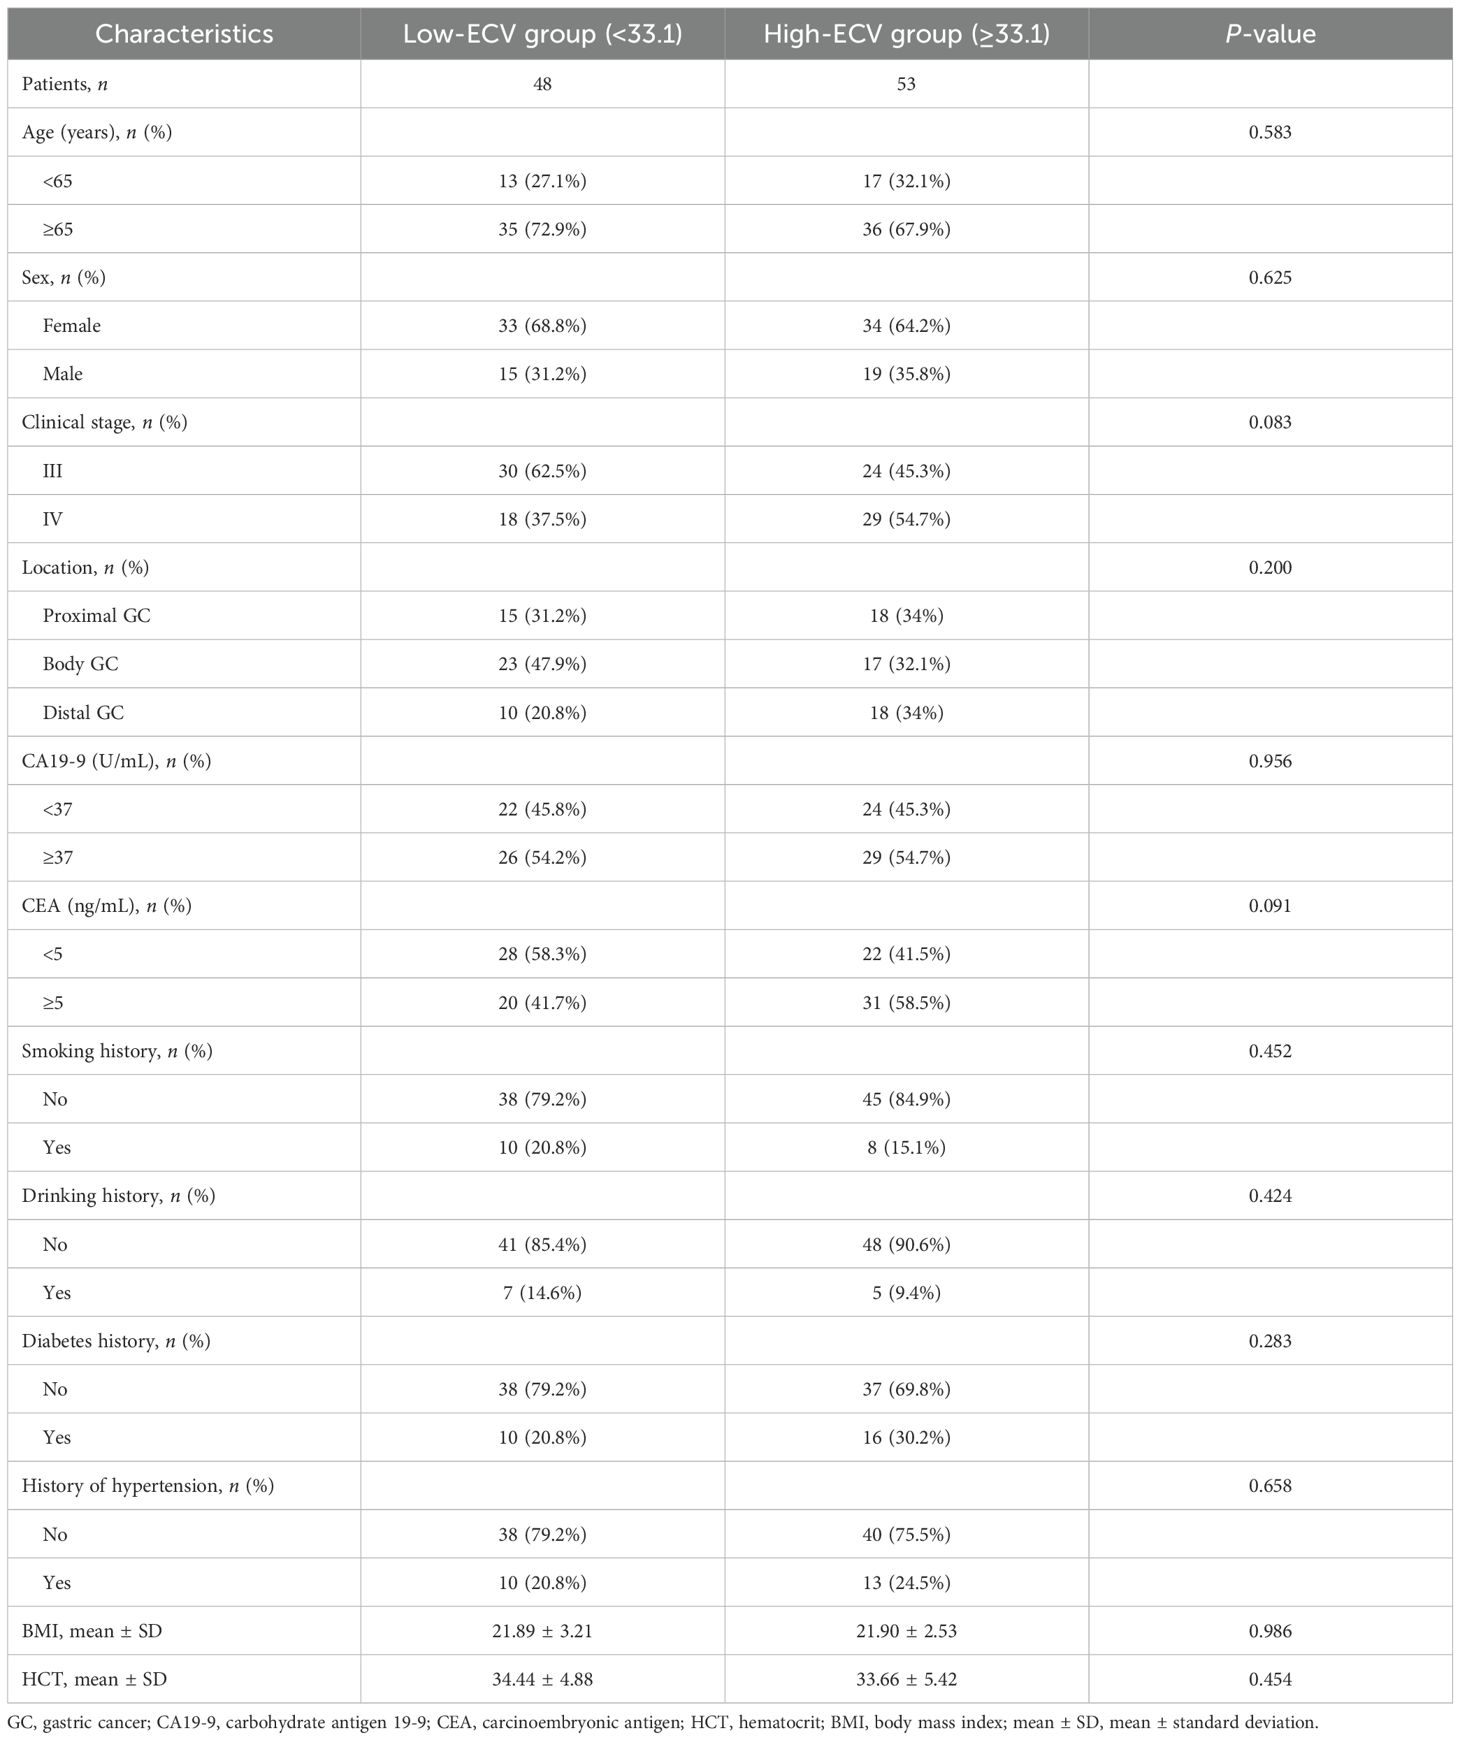
Table 1. Baseline characteristics of patients.
Survival analysis
Kaplan–Meier survival curves of PFS and OS were conducted between the two groups. The log-rank tests indicated that the ECV-higher group had a shorter PFS (P < 0.001) and OS (P < 0.001) than the ECV-lower group (Figures 2A, B).
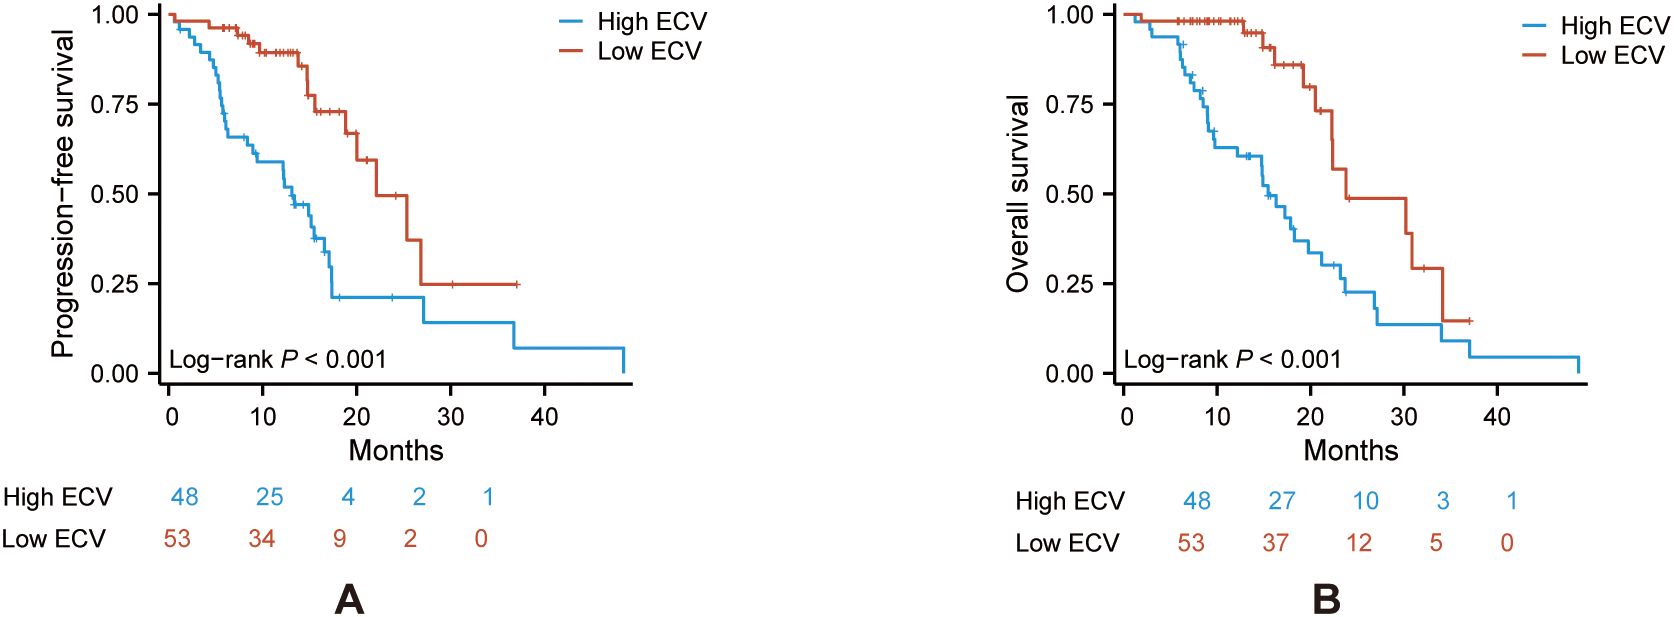
Figure 2. Kaplan–Meier curve of PFS (A) and OS (B) in the ECV-lower group (red) and ECV-higher group (blue). Analyses were conducted using log-rank tests. ECV, extracellular volume fraction; PFS, progression-free survival; OS, overall survival.
Cox regression analysis and subgroup analysis
Univariate analysis showed that high ECV significantly predicted a shorter progression-free survival (PFS: HR = 3.194, 95% CI: 1.702–5.993, P < 0.001), and clinical stage IV was associated with reduced PFS (HR = 3.078, 95% CI: 1.660–5.707, P < 0.001). For OS, high ECV and clinical stage IV showed a stronger prognostic value (HR = 3.220, 95% CI: 1.665–6.230, P < 0.001; HR = 3.501, 95% CI: 1.872–6.549, P < 0.001).
Multivariate analysis showed that high ECV independently predicted shorter PFS (HR = 2.716, 95% CI: 1.432–5.152, P = 0.002) and OS (HR = 2.593, 95% CI: 1.322–5.084, P = 0.006). Similarly, clinical stage IV remained significantly linked to both shorter PFS (HR = 2.573, 95% CI: 1.377–4.808, P = 0.003) and poorer OS (HR = 2.881, 95% CI: 1.524–5.448, P = 0.001) (Tables 2, 3).
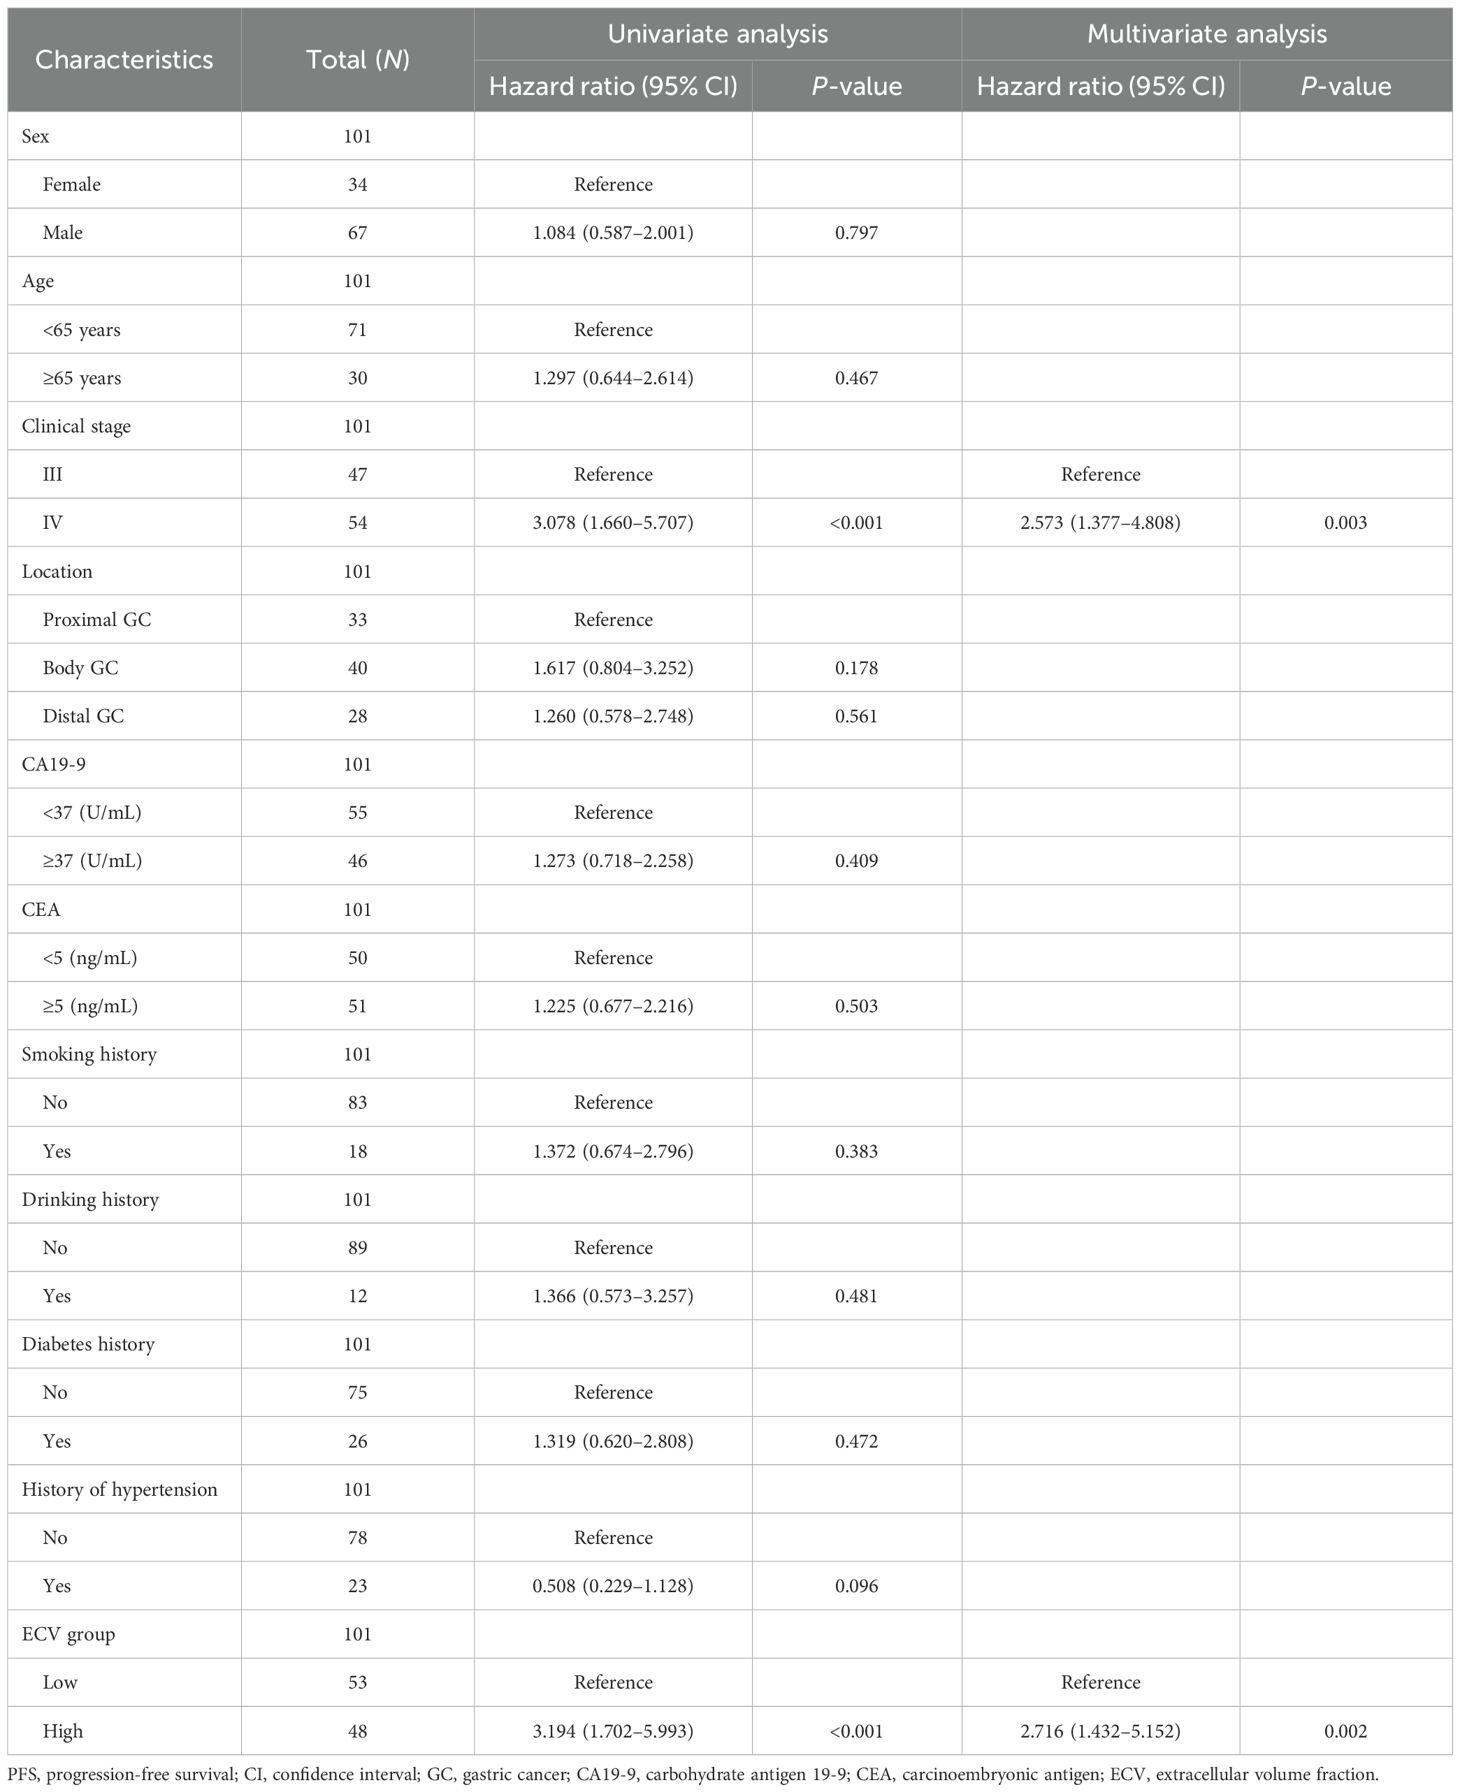
Table 2. Univariate and multivariate Cox proportional hazards analyses for PFS.
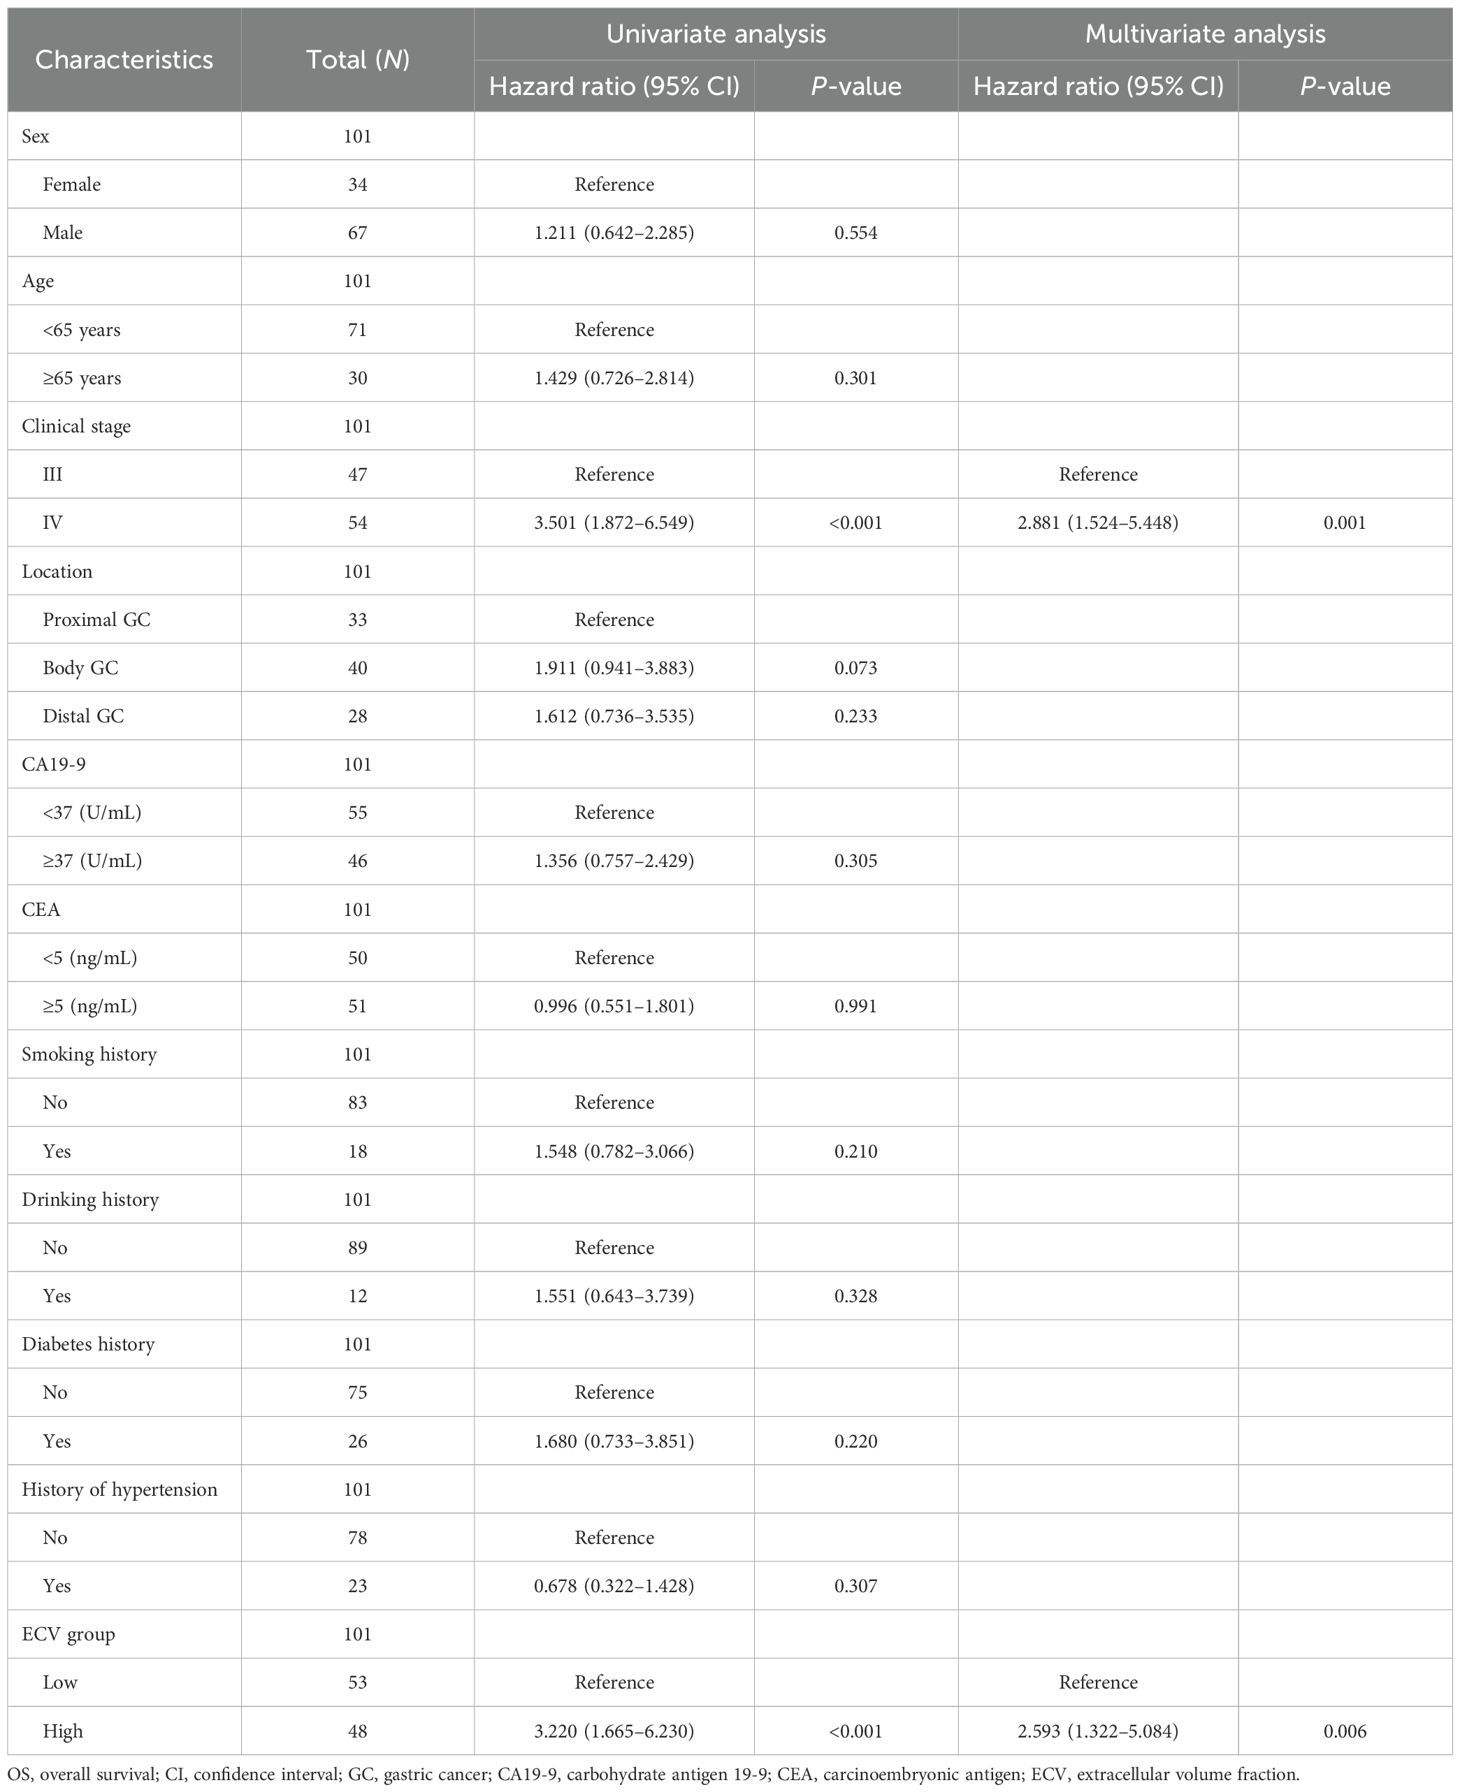
Table 3. Univariate and multivariate Cox proportional hazards analyses for OS.
We performed a subgroup analysis of patients based on baseline characteristics and observed relatively consistent results for PFS and OS, and the hazard ratios for each subgroup were derived from the univariate Cox model. Forest plots revealed a uniformly increased risk in high-ECV patients across all subgroups, both in PFS and OS (Figures 3, 4). The association between high ECV and worse survival was consistent within both stage III and stage IV subgroups. No significant heterogeneity of ECV effect was observed (all P for interaction >0.05), supporting the robustness of ECV as a universal predictor.
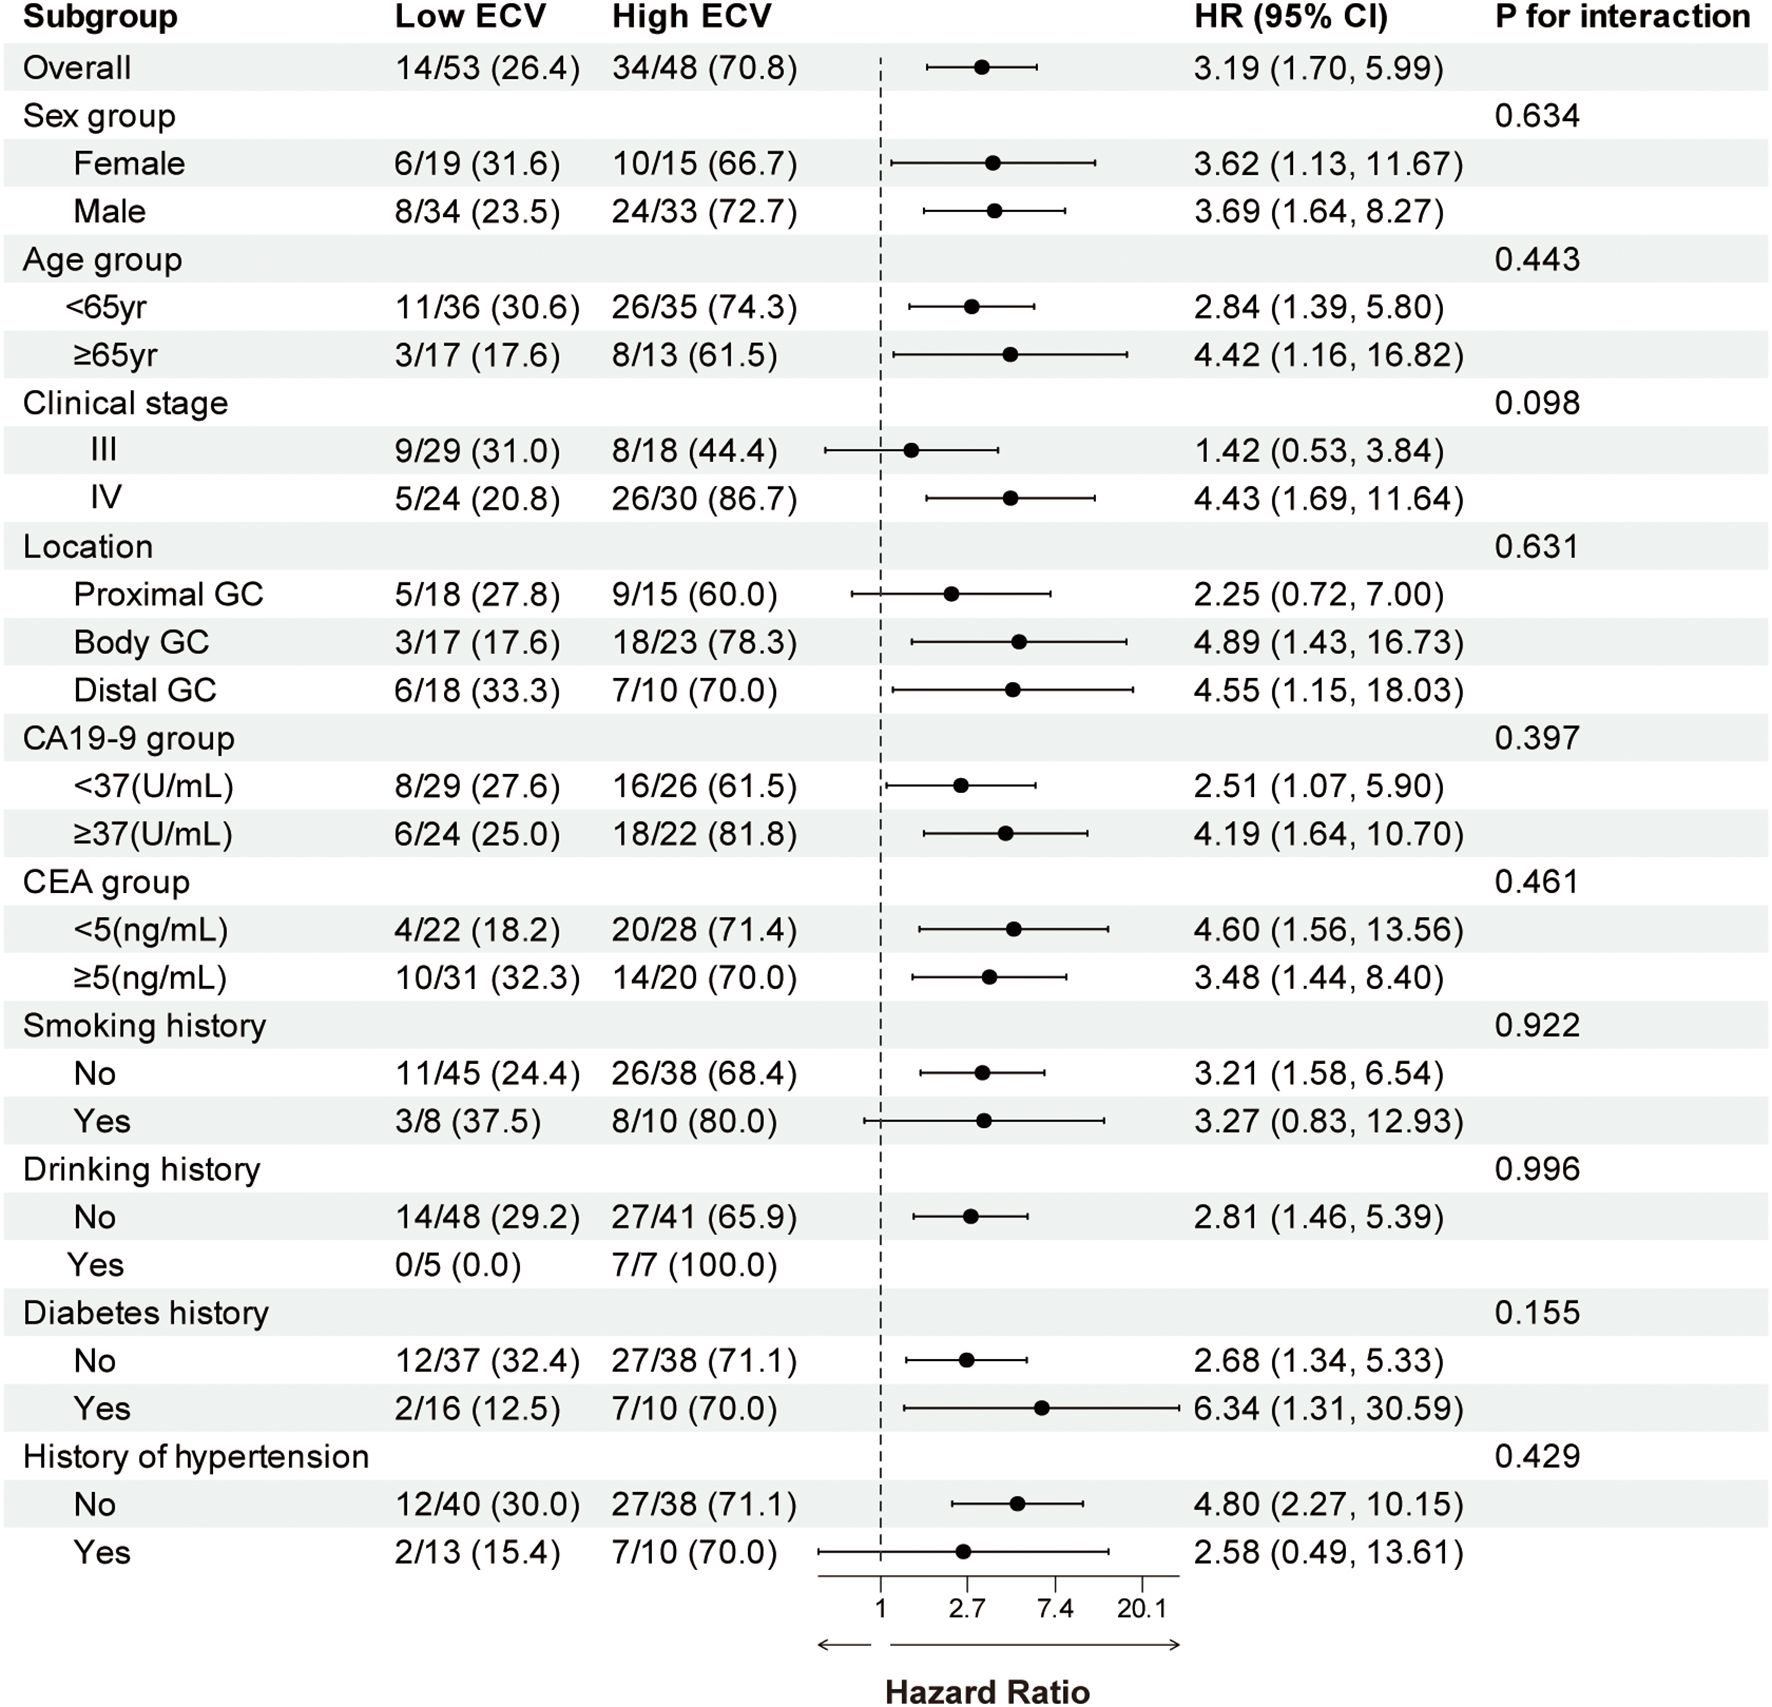
Figure 3. Forest plot of subgroup analysis in progression-free survival between the ECV-lower group and ECV-higher group. The dashed line indicates a hazard ratio of 1. ECV, extracellular volume fraction; HR, hazard ratio; CI, confidence interval; GC, gastric cancer; CA19-9, carbohydrate antigen 19-9; CEA, carcinoembryonic antigen.
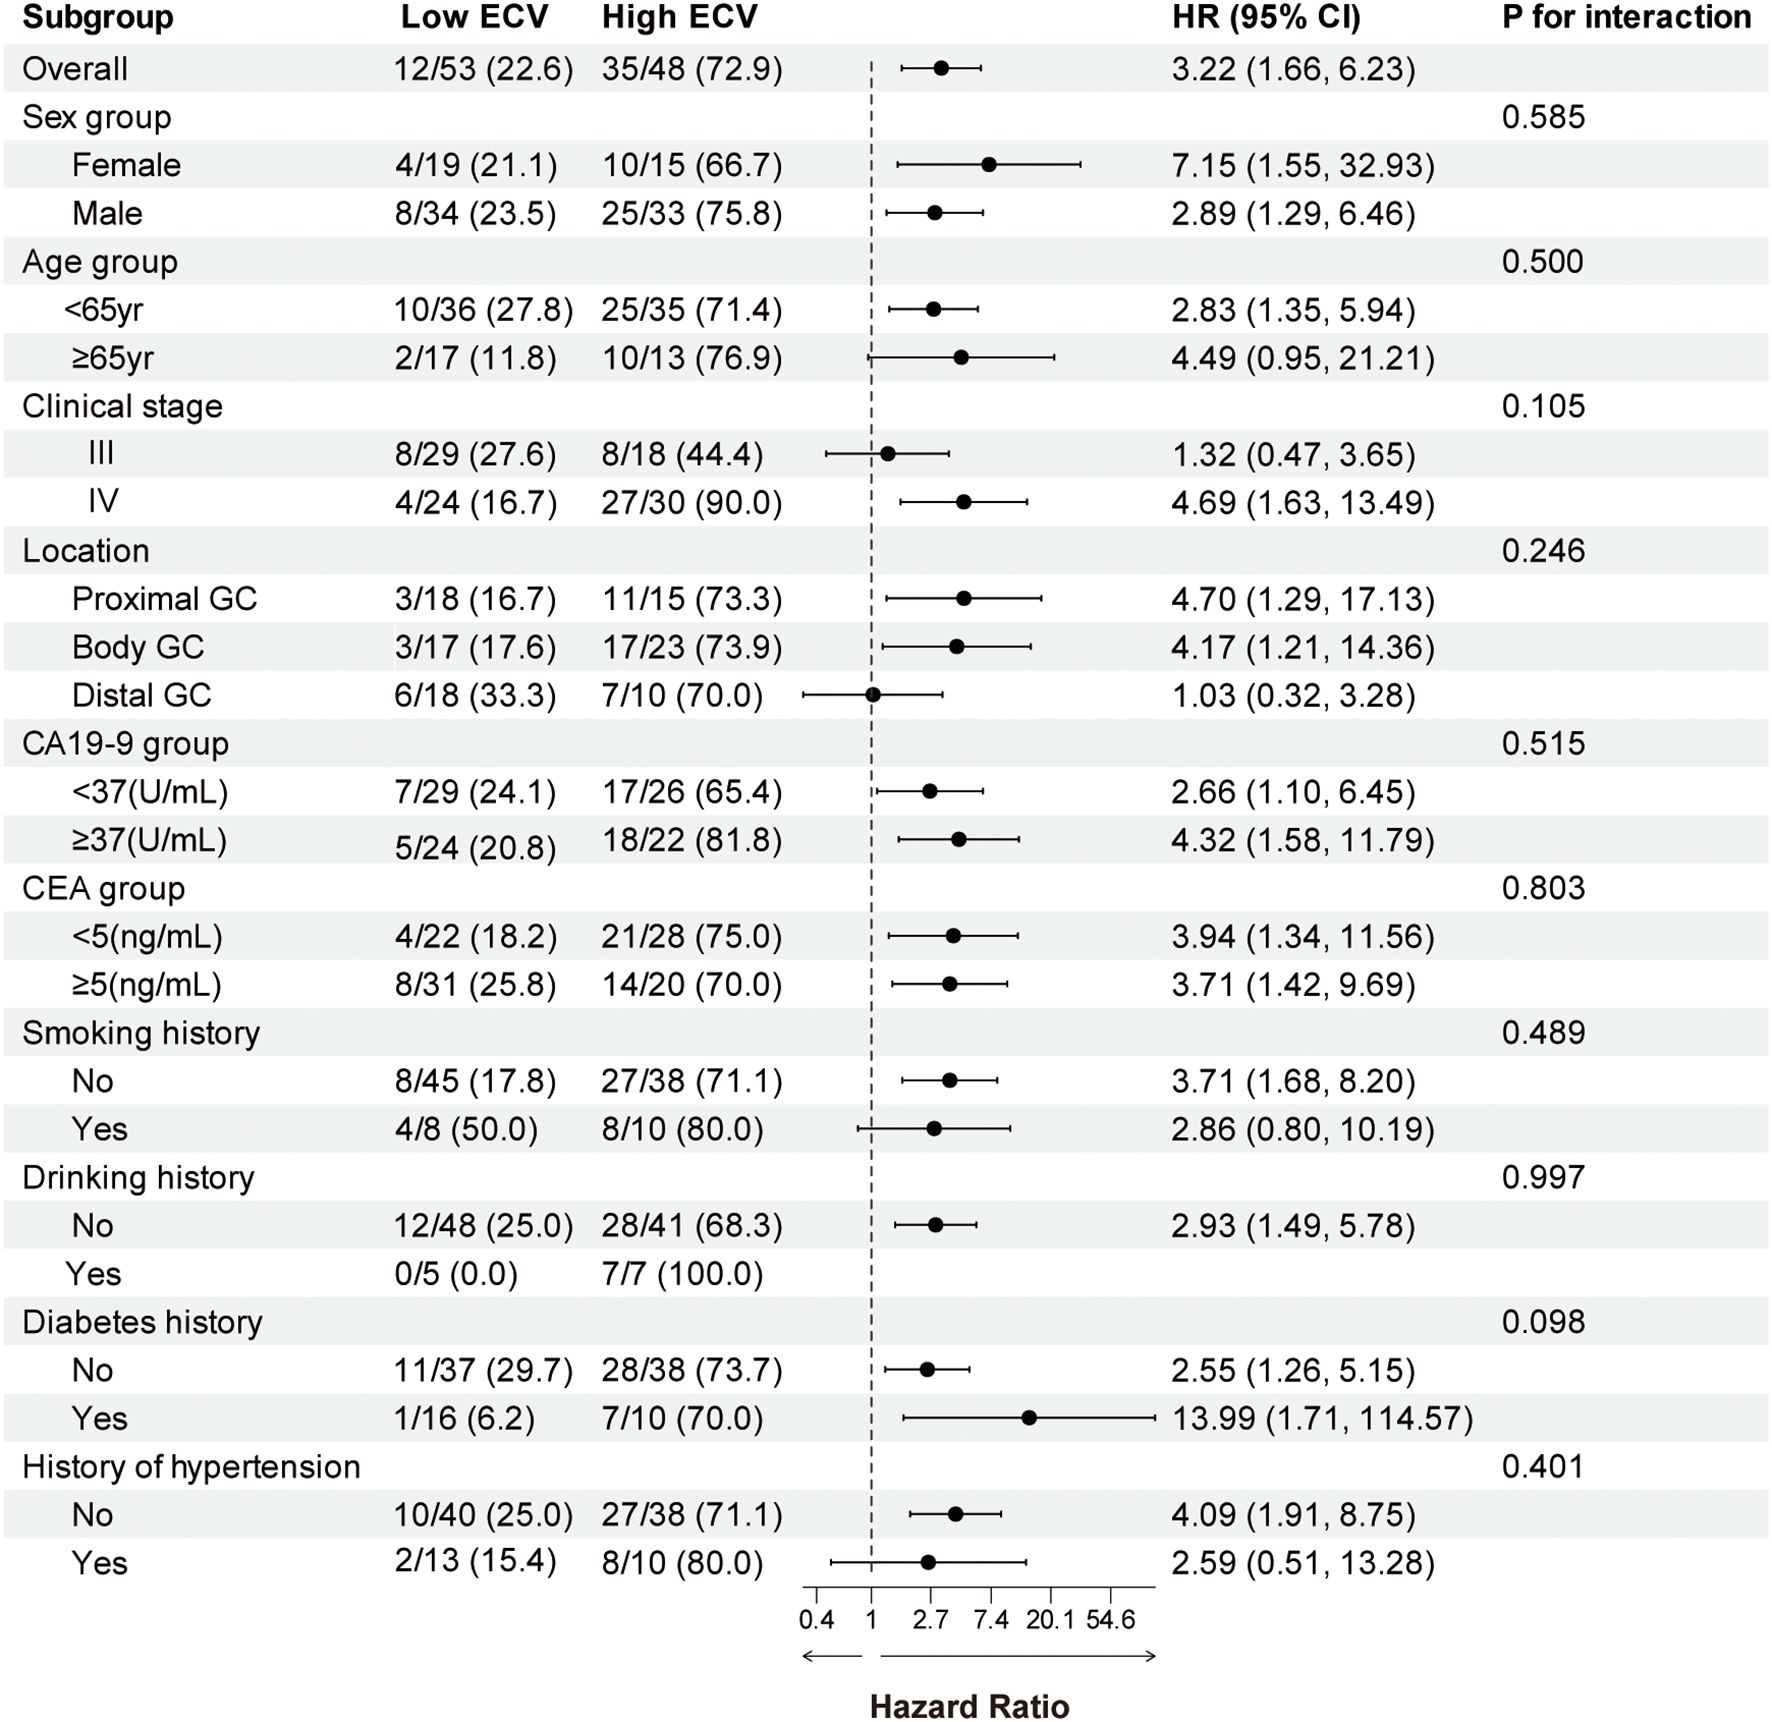
Figure 4. Forest plot of subgroup analysis in overall survival between the ECV-lower group and ECV-higher group. The dashed line indicates a hazard ratio of 1. ECV, extracellular volume fraction; HR, hazard ratio; CI, confidence interval; GC, gastric cancer; CA19-9, carbohydrate antigen 19-9; CEA, carcinoembryonic antigen.
Combination of multiple indicators for predicting disease progression and survival outcomes
ROC curves demonstrated the predictive ability at 1-year survival rate of the combination of clinical stage with ECV for PFS and OS. For PFS prediction (Figure 5A), the combined model (model 2: clinical stage, age group, sex, and ECV group) demonstrated superior discriminative ability compared to model 1 (clinical stage, age group, and sex), with AUC values of 0.739 (95% CI: 0.614–0.865) versus 0.712 (95% CI: 0.587–0.836). Similarly, in OS prediction (Figure 5B), the integration of ECV (model 2) significantly improved predictive accuracy compared to model 1, demonstrated by an increase in AUC from 0.736 (95% CI: 0.588–0.885) to 0.806 (95% CI: 0.697–0.914). To further assess the robustness and internal validity of the prognostic models, we performed bootstrap resampling (B = 1,000) to estimate the time-dependent AUCs and their 95% CIs at 1-year follow-up. Internal validation of the ROC curves was performed using bootstrap resampling with 1,000 iterations. The internally validated results consistently confirmed the superior performance of model 2 compared to model 1 (Supplementary Figures S2, S3). For OS prediction, the 1-year AUC of model 1 was 0.772 (95% CI: 0.636–0.892); for model 2, the 1-year AUC was 0.835 (95% CI: 0.728–0.932). For PFS prediction, the 1-year AUC of model 1 was 0.734 (95% CI: 0.611–0.848); for model 2, the 1-year AUC was 0.774 (95% CI: 0.646–0.886). These findings suggest that the inclusion of ECV enhanced the discriminative ability of the clinical model and that the results remained stable after internal validation using bootstrap methods.
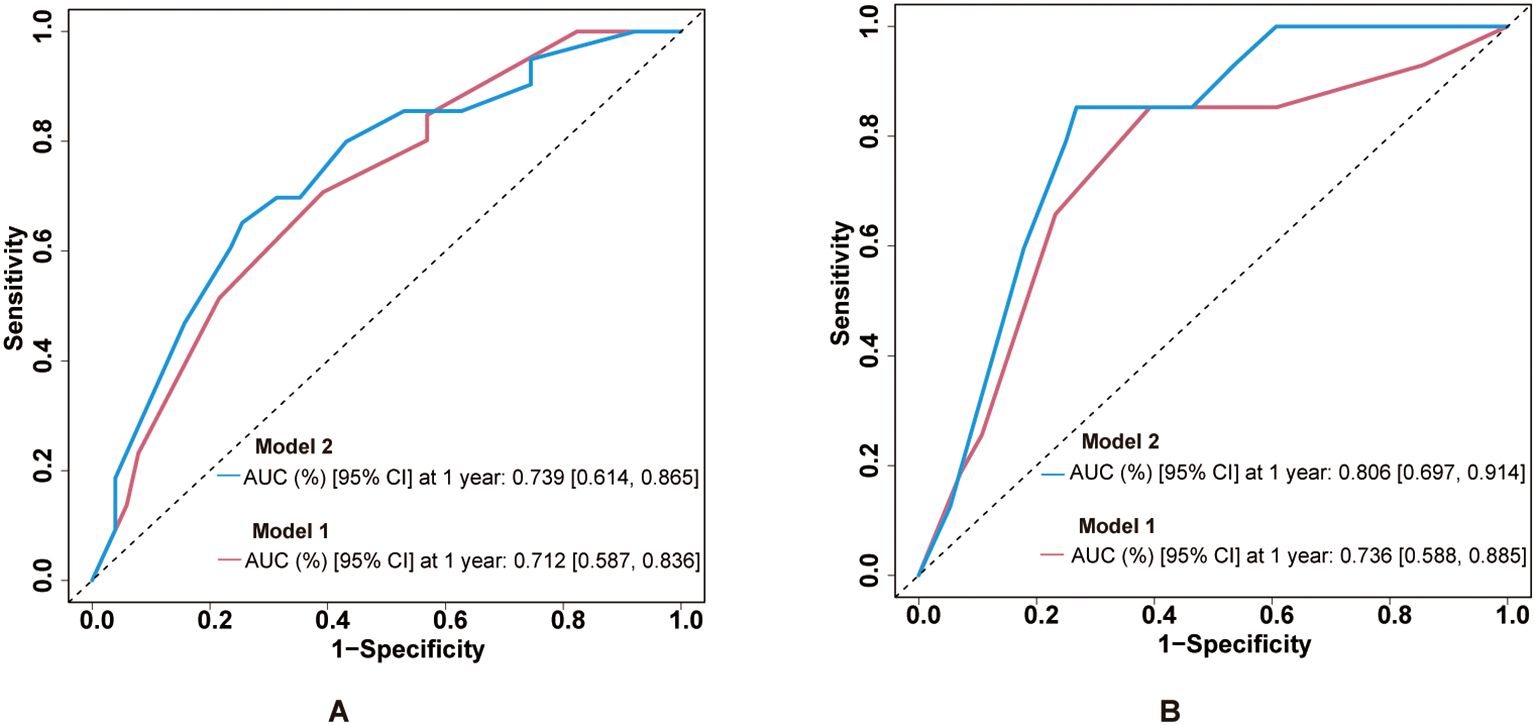
Figure 5. Predictive performance of ECV-integrated models. (A) ROC curves for PFS prediction comparing model 1 and model 2. AUC values are shown in the legend. (B) ROC curves for OS prediction with the same model comparisons. ECV, extracellular volume fraction; ROC, receiver operating characteristic; AUC, area under the curve; PFS, progression-free survival; OS, overall survival.
Discussion
ECV has traditionally been used to assess fibrosis in organs such as the heart, liver, and pancreas (10, 12, 13), but its role in gastric cancer has rarely been explored. In this retrospective study, we were the first to investigate the prognostic value of ECV in gastric cancer patients receiving immunotherapy. Multivariate Cox regression analysis, which adjusted for the influence of clinical stage, confirmed that high CT-ECV was independently associated with worse PFS (HR = 2.716, 95% CI: 1.432–5.152, P = 0.002) and OS (HR = 2.593, 95% CI: 1.322–5.084, P = 0.006). Moreover, integrating ECV into a clinical-stage-based prognostic model improved its predictive performance. The combined model demonstrated higher area under the ROC curve values (PFS: AUC = 0.739, 95% CI: 0.614–0.865; OS: AUC = 0.806, 95% CI: 0.697–0.914), supporting the added prognostic value of ECV. Internal validation using bootstrap resampling (B = 1,000) confirmed the consistency and robustness of the combined model, further reinforcing the credibility of our findings. Collectively, these results suggest that ECV may serve as a noninvasive imaging biomarker, with potential utility in predicting immunotherapy outcomes.
Of the existing biomarkers for gastric cancer immunotherapy, such as PD-L1 expression, MSI, tumor mutational burden (TMB), EBV status, liquid biopsy, and emerging multi-omics approaches, many have significantly improved the precision of predicting immunotherapy efficacy. However, the clinical utility of these biomarkers is constrained by several factors, including spatial and temporal heterogeneity, sampling bias, invasiveness of tissue acquisition, dynamic changes in PD-L1 expression, the high cost and technical complexity associated with genomic profiling like TMB, as well as the poor interpretability and inherent complexity of radiomics models (27). Even emerging non-invasive methods such as liquid biopsy face challenges related to sensitivity, specificity, and the potential for false-positive results (28). In contrast, the CT-ECV framework evaluated in this study utilizes standard contrast-enhanced CT scans, making it a non-invasive, readily accessible, and cost-effective tool. More importantly, ECV provides unique biological insight by directly quantifying a fundamental and functionally critical aspect of the tumor microenvironment (TME)—the fibrotic extracellular matrix (ECM). As our results and the discussed mechanisms suggest, a high ECV likely reflects a stroma-rich, immunosuppressive TME characterized by dense physical barriers that impede immune cell infiltration and drug delivery (29). Therefore, although ECV, like any novel biomarker, requires further validation in larger cohorts, it is not intended to replace existing markers but rather to serve as a highly practical and complementary biomarker.
Increased stiffness of the ECM is considered a key factor in promoting an immunosuppressive tumor microenvironment. It can stimulate M2 macrophage polarization through mechanotransduction pathways and induce the release of immunosuppressive cytokines. Additionally, ECM stiffening contributes to tissue hypoxia and activates the HIF-α signaling pathway, collectively leading to an immunosuppressive and T-cell-exhausted microenvironment. Furthermore, the dense structure of the ECM not only forms a physical barrier that limits immune cell infiltration into the tumor but also exerts mechanical tension that activates mechanosensitive signaling pathways. As a result, T-cell migration is restricted, and anti-PD-1 antibodies may have difficulty penetrating into the tumor core, ultimately compromising the efficacy of immunotherapy (30–32). The tumor microenvironment, particularly the stromal component, plays a crucial part in GC progression. Previous studies have demonstrated that tumor-associated stroma plays an active role in tumor invasion and metastasis and that GC with high stromal content are associated with worse prognosis compared to those with low stromal content (33–35). Moreover, it has been reported that collagen density modulates the activity of tumor-infiltrating T cells, with high collagen density leading to reduced T-cell proliferation and impaired cytotoxic function, ultimately promoting immune escape by tumor cells (36). Consistent with previous findings in postoperative gastric cancer, elevated CT-derived ECV has been shown to reflect stromal-rich tumor microenvironments that may facilitate tumor progression and resistance (23). Our study extends this concept into the immunotherapy setting. ECV, a noninvasive imaging biomarker, serves as an indirect indicator of the amount and spatial distribution of ECM within the tumor tissue, which may explain the poorer prognosis observed in patients with high ECV undergoing immunotherapy (9). Interestingly, in some cancers such as pancreatic adenocarcinoma, higher ECV has been associated with better drug distribution and longer survival (16, 37). These divergent associations may be explained by fundamental differences in the biological nature of the tumor stroma across cancer types coupled with the distinct mechanisms of action of different therapeutic regimens. We propose that this paradox hinges on a fundamental question: does the treatment strategy actively attack the stromal barrier, or must it bypass it? In pancreatic cancer, cornerstone chemotherapies (e.g., nab-paclitaxel plus gemcitabine) function as stroma-depleting agents, physically breaking down the fibrotic barrier (38). Here a high baseline ECV may simply mark a larger, more susceptible target for chemotherapy regimen. However, in the context of immunotherapy, this phenomenon does not necessarily translate into improved therapeutic outcomes. PD-1 inhibitors do not dismantle the barrier but require T-cells to traverse it. Thus, an elevated ECV may indicate a denser stromal architecture, restricted T-cell migration, and enhanced immunosuppression, which could counteract the potential benefits of increased drug dispersion. This comparison highlights that ECV quantifies a dynamic interface whose impact is determined by the therapy applied. These findings suggest that further mechanistic studies and external validation are warranted in diverse cancer types and immune phenotypes to better understand the complex relationship between ECV and immunotherapy response.
This study has several limitations. First, being a retrospective single-center study, the findings may be subject to selection bias and limited generalizability despite the use of strict inclusion criteria. Second, the relatively small sample size restricted the statistical power of some subgroup analyses, although we performed internal validation using bootstrap methods to enhance reliability. Third, ECV was measured based on conventional single-energy CT rather than dual-energy or spectral CT, which may introduce variability; however, standardized imaging protocols and ROI selection helped minimize this issue. Lastly, external validation in independent cohorts was not conducted, and prospective multicenter studies are warranted to confirm the generalizability and clinical applicability of our model. In conclusion, CT-derived ECV may serve as an independent prognostic factor in gastric cancer patients treated with immunotherapy. As a noninvasive imaging biomarker, ECV holds promise for risk stratification and therapeutic decision-making in this patient population and warrants further validation in clinical practice.
Conclusion
This retrospective cohort study of gastric cancer patients undergoing immunotherapy demonstrated that contrast-enhanced CT-derived ECV may serve as an independent predictor for both PFS and OS patients with low ECV who exhibited improved PFS and OS compared to those with high ECV.
Data availability statement
The raw data supporting the conclusions of this article will be made available by the authors, without undue reservation.
Ethics statement
The studies involving humans were approved by Ethics Committee of Union Hospital, Tongji Medical College, Huazhong University of Science and Technology. The studies were conducted in accordance with the local legislation and institutional requirements. Written informed consent for participation was not required from the participants or the participants’ legal guardians/next of kin in accordance with the national legislation and institutional requirements.
Author contributions
YYW: Formal analysis, Writing – original draft, Conceptualization, Software. SSJ: Software, Data curation, Formal analysis, Writing – original draft. YJY: Data curation, Formal analysis, Writing – original draft, Software. YL: Data curation, Writing – original draft, Investigation. ZYL: Data curation, Writing – original draft, Investigation. ZQL: Supervision, Writing – review & editing, Visualization. XCK: Supervision, Writing – review & editing, Visualization. GFZ: Visualization, Supervision, Conceptualization, Writing – review & editing.
Funding
The author(s) declare that no financial support was received for the research, and/or publication of this article.
Acknowledgments
We are profoundly grateful to the clinical investigators and study participants whose crucial contributions have been instrumental in driving this scientific project forward.
Conflict of interest
The authors declare that the research was conducted in the absence of any commercial or financial relationships that could be construed as a potential conflict of interest.
Generative AI statement
The author(s) declare that no Generative AI was used in the creation of this manuscript.
Any alternative text (alt text) provided alongside figures in this article has been generated by Frontiers with the support of artificial intelligence and reasonable efforts have been made to ensure accuracy, including review by the authors wherever possible. If you identify any issues, please contact us.
Publisher’s note
All claims expressed in this article are solely those of the authors and do not necessarily represent those of their affiliated organizations, or those of the publisher, the editors and the reviewers. Any product that may be evaluated in this article, or claim that may be made by its manufacturer, is not guaranteed or endorsed by the publisher.
Supplementary material
The Supplementary Material for this article can be found online at: https://www.frontiersin.org/articles/10.3389/fonc.2025.1698065/full#supplementary-material
Abbreviations
ICIs, immune checkpoint inhibitors; ECV, extracellular volume fraction; ECM, extracellular matrix; PD-1, programmed death receptor-1; ROC, receiver operating characteristic; AUC, area under the curve; PD-L1, programmed cell death ligand-1; MSI, microsatellite instability; EBV, Epstein–Barr virus; irAEs, immune-related adverse events; CECT, contrast-enhanced computed tomography; CA19-9, carbohydrate antigen 19-9; CEA, carcinoembryonic antigen; ROIs, regions of interest; ICC, intraclass correlation coefficient; SD, standard deviation; PFS, progression-free survival; OS, overall survival; HRs, hazard ratios;CIs, confidence intervals.
References
1. Tan N, Wu H, Cao M, Yang F, Yan X, He S, et al. Global, regional, and national burden of early-onset gastric cancer. Cancer Biol Med. (2024) 21:667–78. doi: 10.20892/j.issn.2095-3941.2024.0159
2. Guan WL, He Y, and Xu RH. Gastric cancer treatment: recent progress and future perspectives. J Hematol Oncol. (2023) 16:57. doi: 10.1186/s13045-023-01451-3
3. Theocharis AD, Skandalis SS, Gialeli C, and Karamanos NK. Extracellular matrix structure. Adv Drug Del Rev. (2016) 97:4–27. doi: 10.1016/j.addr.2015.11.001
4. Moreira AM, Pereira J, Melo S, Fernandes MS, Carneiro P, Seruca R, et al. The extracellular matrix: an accomplice in gastric cancer development and progression. Cells. (2020) 9:394. doi: 10.3390/cells9020394
5. Bonnans C, Chou J, and Werb Z. Remodelling the extracellular matrix in development and disease. Nat Rev Mol Cell Biol. (2014) 15:786–801. doi: 10.1038/nrm3904
6. Mouw JK, Ou G, and Weaver VM. Extracellular matrix assembly: a multiscale deconstruction. Nat Rev Mol Cell Biol. (2014) 15:771–85. doi: 10.1038/nrm3902
7. Fleming JM, Yeyeodu ST, McLaughlin A, Schuman D, and Taylor DK. In situ drug delivery to breast cancer-associated extracellular matrix. ACS Chem Biol. (2018) 13:2825–40. doi: 10.1021/acschembio.8b00396
8. Majo S, Courtois S, Souleyreau W, Bikfalvi A, and Auguste P. Impact of extracellular matrix components to renal cell carcinoma behavior. Front Oncol. (2020) 10:625. doi: 10.3389/fonc.2020.00625
9. Gerber BL. Assessment of the extracellular matrix by CT extracellular volume fraction. JACC Cardiovasc Imag. (2024) 17:529–32. doi: 10.1016/j.jcmg.2023.11.011
10. Nacif MS, Kawel N, Lee JJ, Chen X, Yao J, Zavodni A, et al. Interstitial myocardial fibrosis assessed as extracellular volume fraction with low-radiation-dose cardiac CT. Radiology. (2012) 264:876–83. doi: 10.1148/radiol.12112458
11. Chen Y, Jiang J, Yan C, Jiang J, Shi B, Xu Z, et al. Prediction of tumor regression grade in far-advanced gastric cancer after preoperative immuno-chemotherapy using dual-energy CT-derived extracellular volume fraction. Eur Radiol. (2025) 35:93–104. doi: 10.1007/s00330-024-10737-0
12. Tago K, Tsukada J, Sudo N, Shibutani K, Okada M, Abe H, et al. Comparison between CT volumetry and extracellular volume fraction using liver dynamic CT for the predictive ability of liver fibrosis in patients with hepatocellular carcinoma. Eur Radiol. (2022) 32:7555–65. doi: 10.1007/s00330-022-08852-x
13. Sofue K, Ueshima E, Masuda A, Shirakawa S, Zen Y, Ueno Y, et al. Estimation of pancreatic fibrosis and prediction of postoperative pancreatic fistula using extracellular volume fraction in multiphasic contrast-enhanced CT. Eur Radiol. (2022) 32:1770–80. doi: 10.1007/s00330-021-08255-4
14. Lohi J, Leivo I, Oivula J, Lehto VP, and Virtanen I. Extracellular matrix in renal cell carcinomas. Histol Histopathol. (1998) 13:785–96. doi: 10.14670/HH-13.785
15. Luo Y, Liu L, Liu D, Shen H, Wang X, Fan C, et al. Extracellular volume fraction determined by equilibrium contrast-enhanced CT for the prediction of the pathological complete response to neoadjuvant chemoradiotherapy for locally advanced rectal cancer. Eur Radiol. (2023) 33:4042–51. doi: 10.1007/s00330-022-09307-z
16. Fukukura Y, Kumagae Y, Higashi R, Hakamada H, Takumi K, Maemura K, et al. Extracellular volume fraction determined by equilibrium contrast-enhanced multidetector computed tomography as a prognostic factor in unresectable pancreatic adenocarcinoma treated with chemotherapy. Eur Radiol. (2019) 29:353–61. doi: 10.1007/s00330-018-5570-4
17. Iwaya H, Fukukura Y, Hashimoto S, Tanoue S, Kawahira M, Hinokuchi M, et al. Prognostic significance of extracellular volume fraction with equilibrium contrast-enhanced computed tomography for pancreatic neuroendocrine neoplasms. Pancreatology. (2021) 21:779–86. doi: 10.1016/j.pan.2021.02.020
18. Jiang X, Ma Q, Zhou T, Feng Q, Yang W, Zhou X, et al. Extracellular volume fraction as a potential predictor to differentiate lung cancer from benign lung lesions with dual-layer detector spectral CT. Quant Imaging Med Surg. (2023) 13:8121–31. doi: 10.21037/qims-23-736
19. Yoshida K, Yamaguchi K, Okumura N, Tanahashi T, and Kodera Y. Is conversion therapy possible in stage IV gastric cancer: the proposal of new biological categories of classification. Gastric Can. (2016) 19:329–38. doi: 10.1007/s10120-015-0575-z
20. Nishimuta Y, Tsurumaru D, Fujita N, Kai S, Maehara J, Ushijima Y, et al. CT-derived extracellular volume fraction as a predictive marker for postoperative recurrence in pStage II–III gastric cancer. Eur Radiol. (2025). Available at: https://doi.org/10.1007/s00330-025-11765-0.
21. Liu Y, Li C, Lu Y, Liu C, and Yang W. Tumor microenvironment-mediated immune tolerance in development and treatment of gastric cancer. Front Immunol. (2022) 13:1016817. doi: 10.3389/fimmu.2022.1016817
22. Chen Y, Jiang J, Yan C, Jiang J, Shi B, Xu X, et al. Prediction of tumor regression grade in far-advanced gastric cancer after preoperative immuno-chemotherapy using dual-energy CT-derived extracellular volume fraction. Eur Radiol. (2025) 35(1):93–104. doi: 10.1038/bjc.2013.415
23. Yusuke N, Daisuke T, Nobuhiro F, Satohiro K, Junki M, Yasuhiro U, et al. CT-derived extracellular volume fraction as a predictive marker for postoperative recurrence in pStage II–III gastric cancer. Eur Radiol. (2025). doi: 10.1007/s00330-025-11765-0
24. Yoon JH, Lee JM, Klotz E, Jeon JH, Lee KB, Han JK, et al. Estimation of hepatic extracellular volume fraction using multiphasic liver computed tomography for hepatic fibrosis grading. Invest Radiol. (2015) 50:290. doi: 10.1097/RLI.0000000000000123
25. Benchoufi M, Matzner-Lober E, Molinari N, Jannot AS, and Soyer P. Interobserver agreement issues in radiology. Diagn Intervent Imag. (2020) 101:639–41. doi: 10.1016/j.diii.2020.09.001
26. Camp RL, Dolled-Filhart M, and Rimm DL. X-tile: a new bio-informatics tool for biomarker assessment and outcome-based cut-point optimization. Clin Cancer Res. (2004) 10:7252–9. doi: 10.1158/1078-0432.CCR-04-0713
27. Hou W, Zhao Y, and Zhu H. Predictive biomarkers for immunotherapy in gastric cancer: current status and emerging prospects. Int J Mol Sci. (2023) 24:15321. doi: 10.3390/ijms242015321
28. Nikanjam M, Kato S, and Kurzrock R. Liquid biopsy: current technology and clinical applications. J Hematol Oncol. (2022) :15:131. doi: 10.1186/s13045-022-01351-y
29. Prakash J and Shaked Y. The interplay between extracellular matrix remodeling and cancer therapeutics. Cancer Discov. (2024) 14:1375–88. doi: 10.1158/2159-8290.CD-24-0002
30. Yuan Z, Li Y, Zhang S, Wang X, Dou H, Yu X, et al. Extracellular matrix remodeling in tumor progression and immune escape: from mechanisms to treatments. Mol Can. (2023) 22:48. doi: 10.1186/s12943-023-01744-8
31. Naik A and Leask A. Tumor-associated fibrosis impairs the response to immunotherapy. Matrix Biol. (2023) 119:125–40. doi: 10.1016/j.matbio.2023.04.002
32. Brahimi-Horn MC, Chiche J, and Pouysségur J. Hypoxia and cancer. J Mol Med. (2007) 85:1301–7. doi: 10.1007/s00109-007-0281-3
33. Aurello P, Berardi G, Giulitti D, Palumbo A, Tierno SM, Nigri G, et al. Tumor-Stroma Ratio is an independent predictor for overall survival and disease free survival in gastric cancer patients. Surgeon. (2017) 15:329–35. doi: 10.1016/j.surge.2017.05.007
34. Peng C, Liu J, Yang G, and Li Y. The tumor-stromal ratio as a strong prognosticator for advanced gastric cancer patients: proposal of a new TSNM staging system. J Gastroenterol. (2018) 53:606–17. doi: 10.1007/s00535-017-1379-1
35. Wu J, Liang C, Chen M, and Su W. Association between tumor-stroma ratio and prognosis in solid tumor patients: a systematic review and meta-analysis. Oncotarget. (2016) 7:68954–65. doi: 10.18632/oncotarget.12135
36. Kuczek DE, Larsen AMH, Thorseth ML, Carretta M, Kalvisa A, Siersbæk MS, et al. Collagen density regulates the activity of tumor-infiltrating T cells. J immunother Can. (2019) 7:68. doi: 10.1186/s40425-019-0556-6
37. Fukukura Y, Kumagae Y, Higashi R, Hakamada H, Nakajo M, Maemura K, et al. Extracellular volume fraction determined by equilibrium contrast-enhanced dual-energy CT as a prognostic factor in patients with stage IV pancreatic ductal adenocarcinoma. Eur Radiol. (2020) 30:1679–89. doi: 10.1007/s00330-019-06517-w
Keywords: gastric cancer, immunotherapy, PD-1 inhibitors, biomarkers, extracellular volume fraction, extracellular matrix, contrast-enhanced CT
Citation: Wang Y, Jiang S, Yang Y, Li Y, Li Z, Lei Z, Kong X and Zhou G (2025) Prediction of long-term survival in gastric cancer patients after immunotherapy based on CT-derived extracellular volume fraction. Front. Oncol. 15:1698065. doi: 10.3389/fonc.2025.1698065
Received: 03 September 2025; Accepted: 07 November 2025; Revised: 25 October 2025;
Published: 28 November 2025.
Edited by:
Xi Wang, The Chinese University of Hong Kong, Hong Kong SAR, ChinaReviewed by:
Junmeng Li, Henan Provincial People’s Hospital, ChinaXiang-Xu Wang, Air Force Medical University, China
Copyright © 2025 Wang, Jiang, Yang, Li, Li, Lei, Kong and Zhou. This is an open-access article distributed under the terms of the Creative Commons Attribution License (CC BY). The use, distribution or reproduction in other forums is permitted, provided the original author(s) and the copyright owner(s) are credited and that the original publication in this journal is cited, in accordance with accepted academic practice. No use, distribution or reproduction is permitted which does not comply with these terms.
*Correspondence: Ziqiao Lei, emlxaWFvX2xlaUBodXN0LmVkdS5jbg==; Xiangchuang Kong, aG9uZ2tlODBAaHVzdC5lZHUuY24=; Guofeng Zhou, WmhvdWd1b2Zlbmc2OUAxMjYuY29t
†These authors have contributed equally to this work