 Jiali Li1†
 Zihang Zeng
 Yong He
- 1Department of Nuclear Medicine, Zhongnan Hospital of Wuhan University, Wuhan, China
- 2Department of Radiation and Medical Oncology, Zhongnan Hospital of Wuhan University, Wuhan, China
Objective: This study aims to develop 10 machine learning models based on positron emission tomography/computed tomography (PET/CT) radiomic features to predict epidermal growth factor receptor (EGFR) mutations in non-small cell lung cancer (NSCLC) patients and to identify risk factors contributing to model misclassification.
Methods: This study included 277 NSCLC patients from Zhongnan Hospital, Wuhan University, who underwent pretreatment 18F-FDG PET/CT and EGFR mutation testing. A PET/CT signature (PCS)-nomogram was developed by comparing 10 machine learning algorithms for EGFR prediction. Leave-one-out cross-validation generated model-specific EGFR mutation probabilities for individual patients, and performance disparities were analyzed across clinical subgroups. Model performance was assessed using the receiver operating characteristic curve, Youden’s index, decision curve analysis, and DeLong’s test.
Results: The PCS-nomogram model, constructed using the partial least squares generalized linear models (plsRglm) algorithm, achieved optimal performance in predicting EGFR mutations in NSCLC patients (training cohort: area under the curve [AUC] = 0.80; validation cohort: AUC = 0.82). Smoking history caused statistically significant performance deterioration in seven of 10 machine learning models (|ΔYouden’s index| ≥ 0.1). The PCS model demonstrated higher predictive performance in never-smokers than in smokers (AUC = 0.90 vs. 0.64; p < 0.05).
Conclusion: A plsRglm-based PCS-nomogram model was proposed for the noninvasive prediction of EGFR mutations in NSCLC patients. Compared with smokers, radiomics-based EGFR mutation prediction demonstrated superior performance in never-smokers.
Introduction
Lung cancer remains the leading cause of cancer-related morbidity and mortality worldwide, with non-small cell lung cancer (NSCLC) accounting for approximately 85% of all cases (1, 2). The advent of targeted therapies has substantially improved the prognosis of patients harboring epidermal growth factor receptor (EGFR) mutations, with EGFR tyrosine kinase inhibitors (TKIs) providing markedly longer progression-free survival compared with chemotherapy (18.9 months vs. 6.3 months) in NSCLC patients (3, 4). Currently, EGFR mutation testing relies on tissue biopsy specimens. However, this approach is invasive, costly, and often limited by tissue availability, posing challenges for routine genetic testing. These limitations highlight the need for reliable, noninvasive methods to determine EGFR mutation status.
18F-fluorodeoxyglucose (18F-FDG) positron emission tomography/computed tomography (PET/CT) is a widely used imaging modality for the diagnosis and staging of NSCLC (5, 6). By combining anatomical and metabolic information, PET/CT provides unique insights into tumor biology (7). With advancements in radiomics and machine learning algorithms, researchers have introduced a new paradigm of “from imaging to molecular diagnosis” (8, 9).
Recent studies have explored radiomics models derived from PET, CT, or integrated PET/CT data to predict EGFR mutation status; however, their predictive performance has been inconsistent, with reported areas under the curve (AUCs) ranging from 0.58 to 0.94 (10–12). This instability poses significant challenges to clinical application and may be attributed to heterogeneity in patient populations and imaging protocols (13, 14). Such variability also arises from differences in feature selection strategies. Although these studies help explain heterogeneity in overall model performance, the specific clinical and tumor-related factors contributing to model misclassification at the individual patient level remain largely unexplored. Identifying these determinants is crucial for understanding sources of predictive variability and for delineating patient subpopulations most suitable for radiomics-based EGFR prediction.
In this study, we developed a PET/CT signature (PCS)-nomogram model using 10 machine learning approaches to noninvasively predict EGFR mutation status in NSCLC patients. Crucially, we investigated the essential clinical determinants of predictive failures and identified a specific patient subpopulation with enhanced suitability for radiomics-based EGFR prediction.
Materials and methods
Patient selection
This retrospective study was approved by the Institutional Review Board of Zhongnan Hospital of Wuhan University and conducted in accordance with the Declaration of Helsinki. Informed consent was waived due to the study’s retrospective nature. This study included patients pathologically diagnosed with NSCLC who underwent EGFR mutation testing and 18F-FDG PET/CT prior to therapy at Zhongnan Hospital of Wuhan University between January 2017 and August 2023. Initially, 388 patients were collected, of whom 277 met the inclusion criteria and were enrolled. Inclusion criteria were as follows (1): age ≥ 18 years old (2); histologically confirmed NSCLC via surgery or biopsy (3); genetic testing for EGFR mutation status; and (4) 18F-FDG PET/CT examination performed within 2 weeks prior to initial treatment. Exclusion criteria were as follows (1): pathological confirmation only by pleural effusion (17 cases) (2); 18F-FDG PET/CT scans performed after therapy (15 cases) (3); mild or extensive pleural effusion (54 cases) (4); segmental or extensive atelectasis (19 cases) (5); bullous emphysema (two cases); and (6) diffuse pulmonary nodules without a dominant primary lesion (four cases). The 277 participants were randomly divided into training (n = 194) and validation (n = 83) cohorts at a ratio of 7:3. The workflow of patient selection is shown in Figure 1.
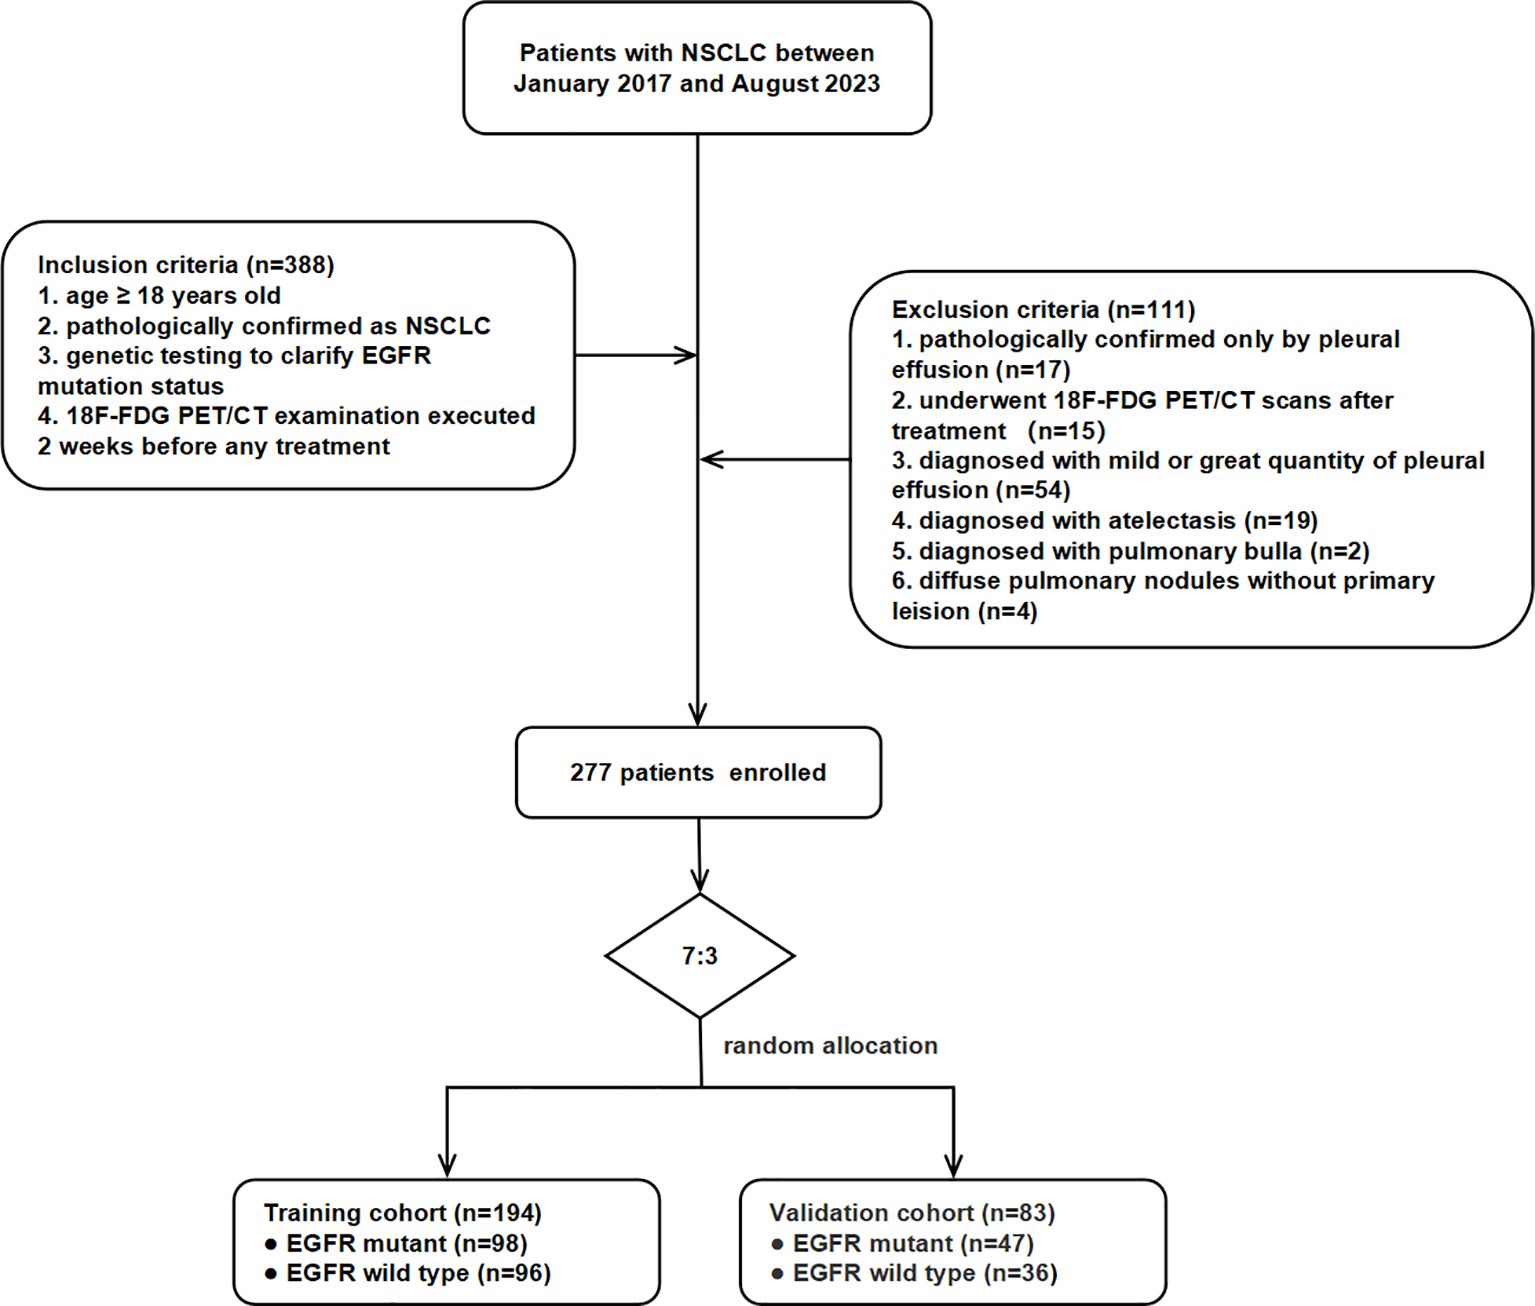
Figure 1. Patient inclusion and exclusion flowchart.
EGFR mutation detection
Histological specimens were obtained via surgery, biopsy, or endobronchial ultrasound-guided transbronchial needle aspiration puncture. EGFR mutation status was determined using amplification refractory mutation system polymerase chain reaction or high-throughput sequencing. EGFR mutations encompass a wide spectrum of subtypes, including exon 19 deletions, exon 21 L858R, exon 20 insertions, exon 18 G719X, and various compound mutations. Since other EGFR mutation subtypes had relatively few positive cases, except for exon 19 deletions and exon 21 L858R, all samples harboring missense mutations, insertions, or deletions on exons 18–21 were classified as EGFR mutant to minimize class imbalance introduced by excessive subdivision. The remaining samples were classified as EGFR wild-type.
PET/CT image acquisition
All participants underwent 18F-FDG PET/CT examination following a standardized imaging protocol. 18F-FDG (radiochemical purity of > 95%) was purchased from HTA Co., Ltd. (Wuhan, China). Participants fasted for at least 6 h to ensure blood glucose levels < 11.0 mmol/L and were intravenously injected with 18F-FDG at 3.70 MBq/kg. Imaging was performed using a Siemens Biograph mCT PET/CT scanner (Siemens Healthineers, Erlangen, Germany) after a 60 min ± 5 min uptake period at rest. Low-dose CT scans were acquired with a 2-mm slice thickness (matrix 512 × 512) for attenuation correction. PET images were acquired in three-dimensional (3D) mode with six to eight bed positions (2.5 min per bed, 2 mm thickness, matrix 200 × 200) and reconstructed using the TrueX and ultra-high-definition PET algorithms embedded in the MMWP workstation.
Image segmentation and feature extraction
Image segmentation and feature extraction were performed using the PyRadiomics package (15) implemented in 3D Slicer software (version 5.5.0) by two radiologists with over 3 years of experience. Prior to segmentation, PET and CT images were registered using the SlicerElastix module with the “generic rigid” method. Semiautomatic contouring of the primary tumor volume of interest (VOI) was then conducted on PET/CT fusion images. CT images were displayed with a lung window (WL = − 600 HU, WW = 1,500 HU), and regions with standardized uptake values (SUV) ≥ 40% of SUVmax were defined as VOIs. Manual adjustment was applied when the lesion was adjacent to the mediastinum or chest wall.
Prior to feature extraction, both PET and CT images and their corresponding masks were resampled to an isotropic voxel size of 2.0 mm3 × 2.0 mm3 × 2.0 mm3 using B-spline interpolation for images and nearest-neighbor interpolation for masks to ensure spatial consistency. Wavelet decomposition was applied to the resampled images to enhance multiscale textural representation. Radiomic features were extracted separately from PET (bin width = 0.4) and CT (bin width = 25) images. Extracted features included shape (2D and 3D), first-order statistics, and texture features based on the Gray Level Co-occurrence Matrix (GLCM), Gray Level Dependence Matrix (GLDM), Gray Level Run Length Matrix (GLRLM), Gray Level Size Zone Matrix (GLSZM), and Neighboring Gray Tone Difference Matrix (NGTDM).
Radiomics feature selection and PCS development
Radiomics feature selection was performed using a four-step approach. First, intraclass correlation coefficients (ICCs) were calculated to assess interobserver reproducibility, and features with ICC > 0.8 were retained. Subsequent steps were conducted in the training cohort (n = 194). Second, univariate analysis was applied using Student’s t-tests or Mann–Whitney U tests, depending on normality; features with an adjusted p < 0.20 were retained and standardized by Z-score transformation. Third, the least absolute shrinkage and selection operator (LASSO) logistic regression was used to identify predictive features with nonzero coefficients, with AUC serving as the evaluation metric during cross-validation. Finally, features with high correlation (Pearson’s r > 0.6) were removed to minimize redundancy.
The selected radiomics features were then used to develop predictive models with 10 machine learning algorithms in the training cohort: partial least squares generalized linear models (plsRglm), NaiveBayes, Ridge, gradient boost machine (GBM), support vector machine (SVM), linear discriminant analysis (LDA), LASSO (16), elastic-net (Enet), generalized linear models with boosting (glmBoost), and extreme gradient boosting (XGBoost) (16–20). Model performance was evaluated using AUC, accuracy, sensitivity, specificity, negative predictive value, and positive predictive value. AUCs were compared using the DeLong test.
Clinical feature selection
Clinical features were screened through a four-step process within the training cohort. Before feature selection, categorical clinical features were preprocessed. Binary categorical features (e.g., gender, smoking history) were encoded as 0/1. Ordinal features, including the American Joint Committee on Cancer (AJCC) stage, were encoded as ordered integers reflecting disease severity. The feature selection pipeline was then conducted. First, univariate analyses (Student’s t-test or Mann–Whitney U test for continuous features; Chi-square test for categorical features) were conducted to identify candidates with p < 0.05. Second, LASSO logistic regression was performed to identify features with nonzero coefficients. Third, interfeature correlations were examined using Pearson’s correlation (continuous) or Spearman’s correlation (categorical), and features with |r| ≥ 0.6 were removed. Finally, features with both p < 0.05 in univariate logistic regression and p < 0.20 in multivariable logistic regression were retained for nomogram construction.
Construction and evaluation of PCS-nomogram
A PCS-nomogram was developed by integrating the PCS and selected clinical features using logistic regression to predict EGFR mutation status. Calibration curves were plotted to assess the agreement between predicted and observed mutation status, while decision curve analysis (DCA) was performed to evaluate clinical benefits across different threshold probabilities.
Leave-one-out cross-validation
Leave-one-out cross-validation (LOOCV), a type of cross-validation, was applied to evaluate the model performance, in which each sample was used once as a validation case while the remaining samples served as the training set. To identify clinical risk factors for prediction failure, LOOCV was performed across the entire cohort (n = 277) to calculate the accuracy of the radiomics-based model for each of the 10 machine-learning algorithms.
Statistical analysis
All statistical analyses were performed using R software (version 4.3.3). Continuous variables were compared using Student’s t-test or the Mann–Whitney U test, while categorical variables were analyzed with the Chi-square test. Multiple testing was corrected using the Benjamini–Hochberg method. Machine learning models were implemented using the R packages “plsRglm”, “Glmnet”, “gbm”, “MASS”, “mboost”, and “xgboost”. ROC curves, calibration curves, and DCA plots were generated with the “pROC”, “rms”, and “rmda” packages, respectively. Triangular correlation plots were created using “linkET”, and other plots were generated with “ggplot”. A two-sided p < 0.05 was considered statistically significant.
Results
Patient characteristics
A total of 277 patients meeting the inclusion criteria were randomly assigned to the training (n = 194/277, 70%; mean age, 63.33 ± 10.22) and validation cohorts (n = 83/277, 30%; mean age, 62.41 ± 10.27). No significant differences were observed between the cohorts in terms of age, gender, smoking history, AJCC stage, and pathological type (all p >0.05). The prevalence of EGFR mutation was balanced, with 98 (50.52%) and 47 (56.62%) positive cases in the training and validation cohorts, respectively (p > 0.05). Patient clinical characteristics are summarized in Table 1.
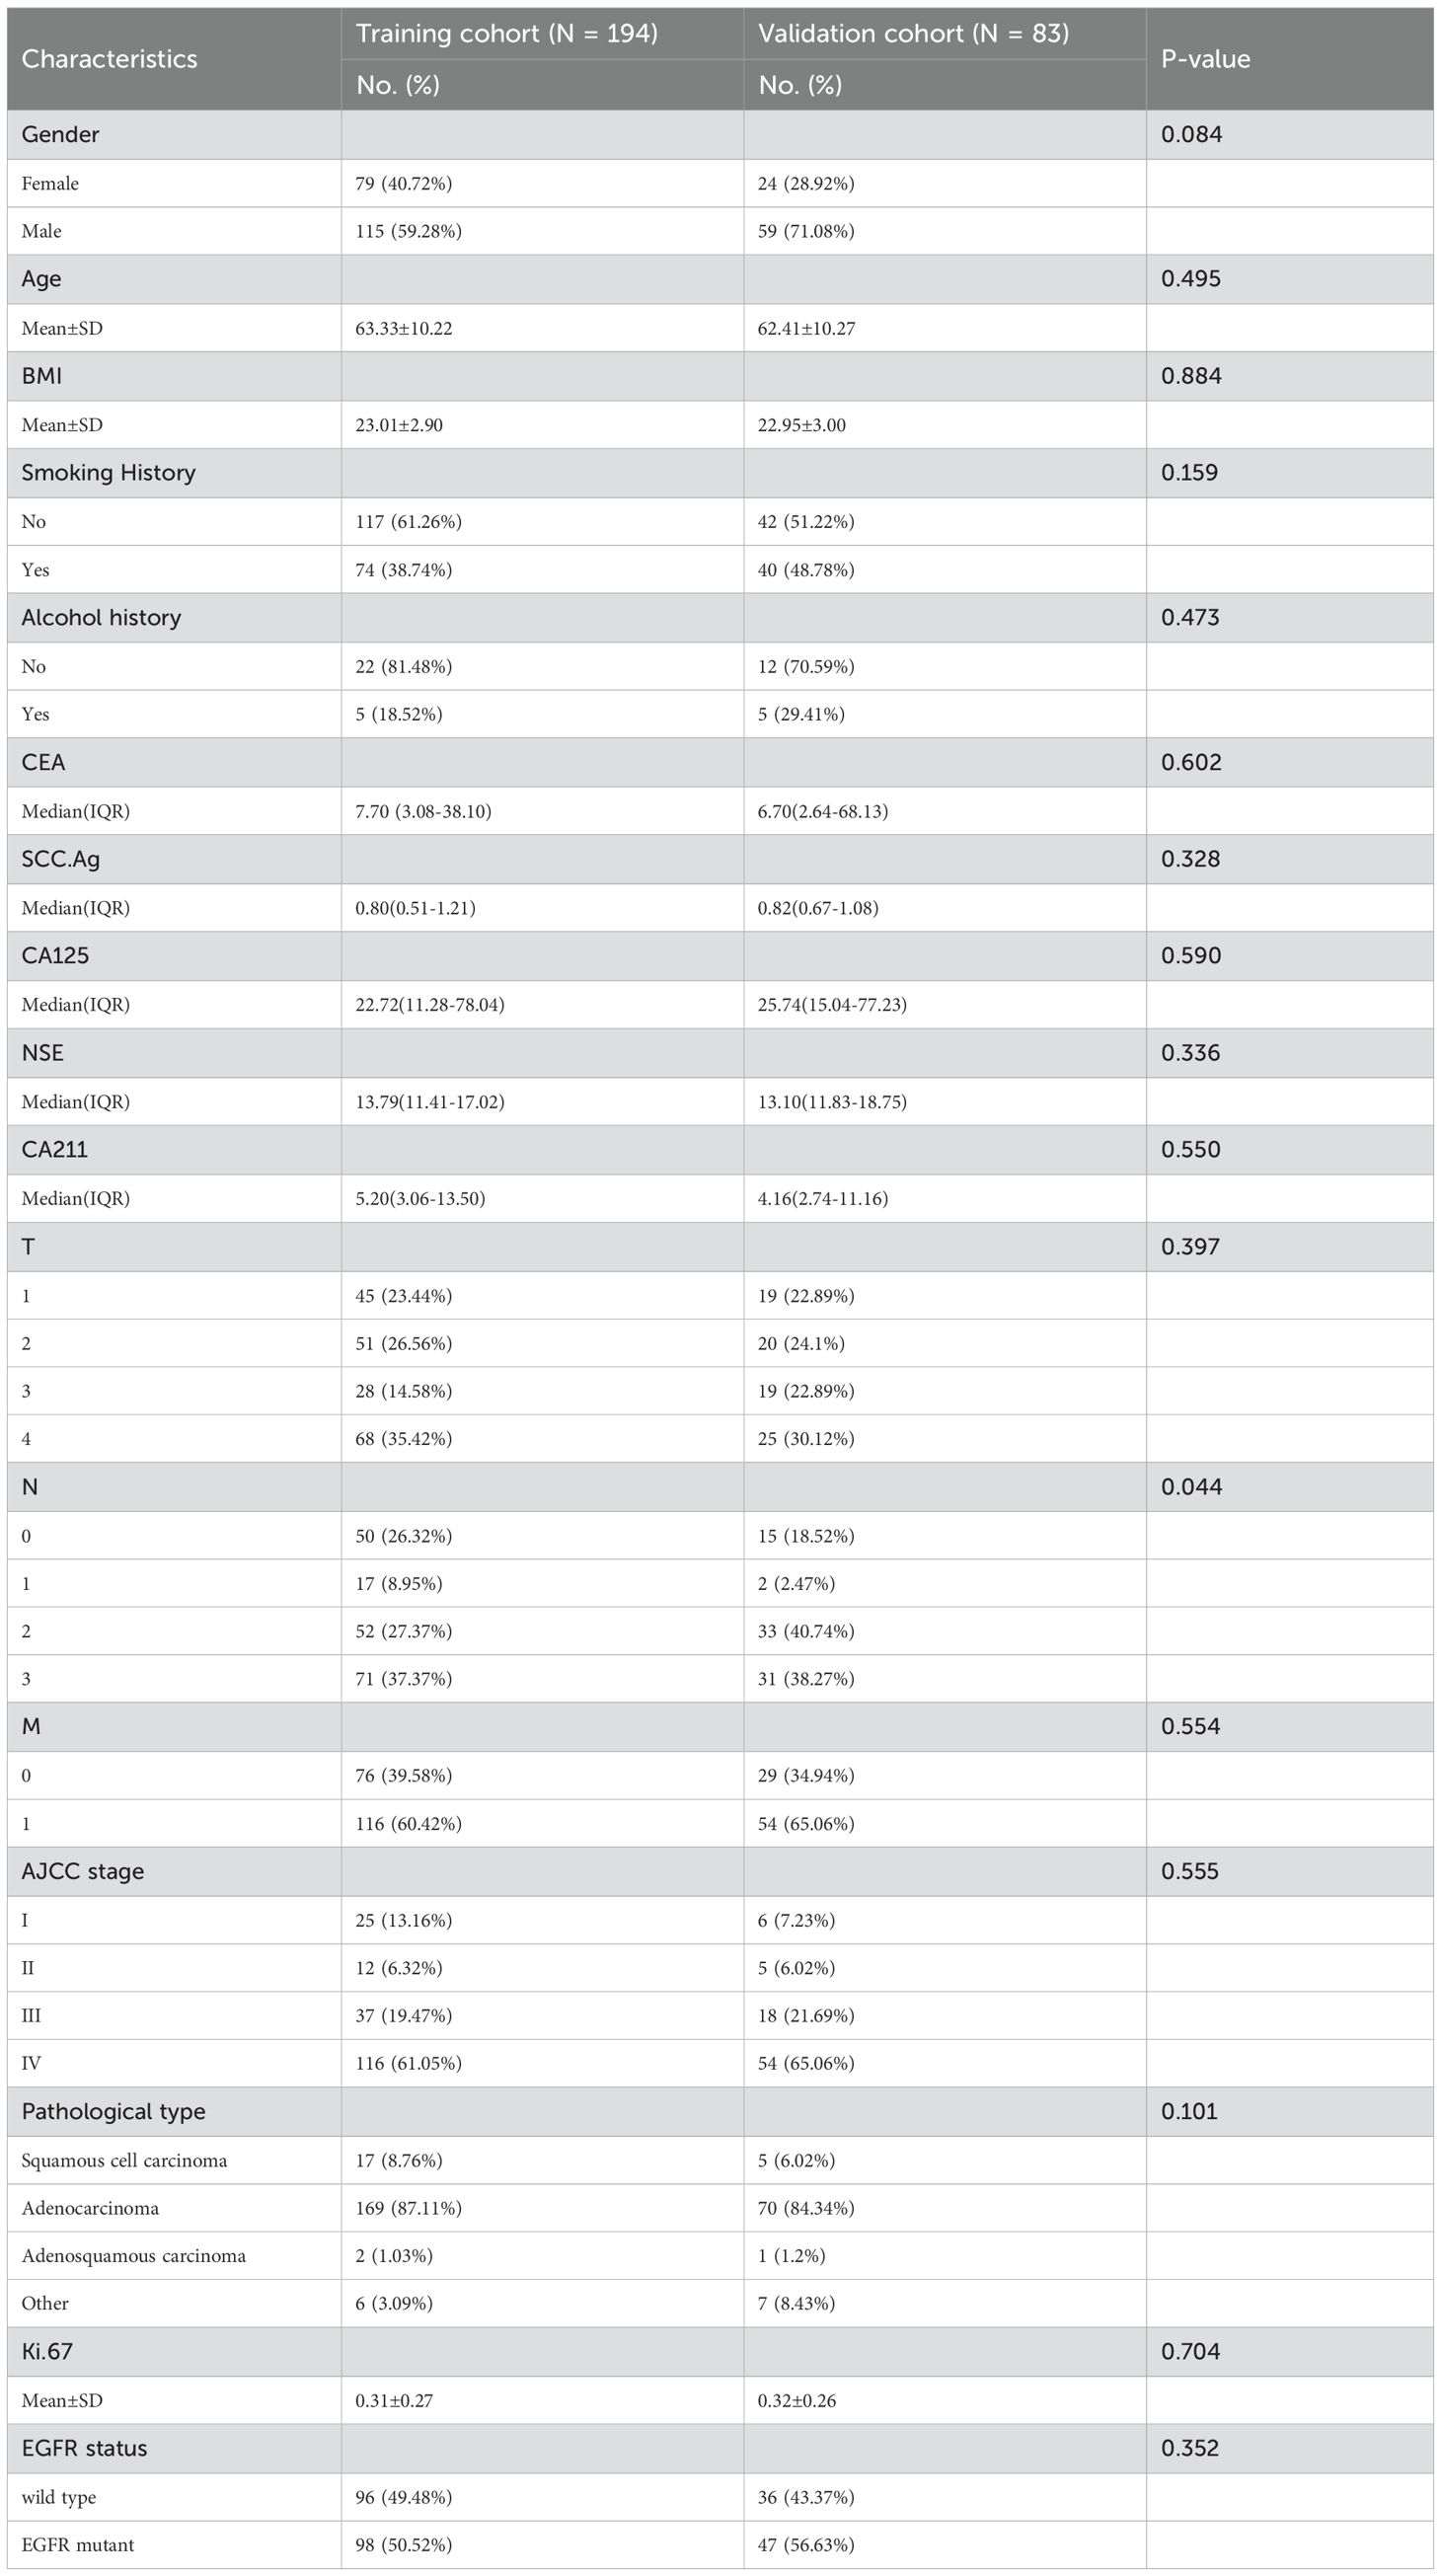
Table 1. Clinical characteristics of lung cancer patients in the training and validation cohorts.
PET/CT feature extraction and selection
The study workflow is illustrated in Figure 2. A total of 851 PET features and 851 CT features were independently extracted from the images by two experienced radiologists. Feature reproducibility was assessed using the intraclass correlation coefficient (ICC), and 566 PET (66.5%) and 580 CT (68.2%) features with excellent reliability (ICC > 0.8) were retained for further analysis. Univariate analysis using Student’s t-test or Mann–Whitney U test identified 158 PET and 16 CT features with p < 0.2, which were then subjected to LASSO regression to select the optimal feature combination for model construction (Supplementary Figure S1). Highly correlated features (Pearson’s correlation coefficient > 0.6) were excluded to reduce redundancy. Ultimately, 10 PET and nine CT features were selected (Table 2). The chord diagram demonstrated the absence of significant collinearity among the selected PET (Figure 3A) and CT (Figure 3B) radiomic features. Notably, PET features P3 (original_glszm_ZoneEntropy) and P6 (wavelet-LHL_gldm_SmallDependenceEmphasis), as well as CT features C3 (wavelet-LLH_glszm_SmallAreaEmphasis) and C4 (wavelet-LHH_gldm_DependenceEntropy), exhibited the highest coefficient weights related to EGFR mutation (Figures 3C, D, Table 2).
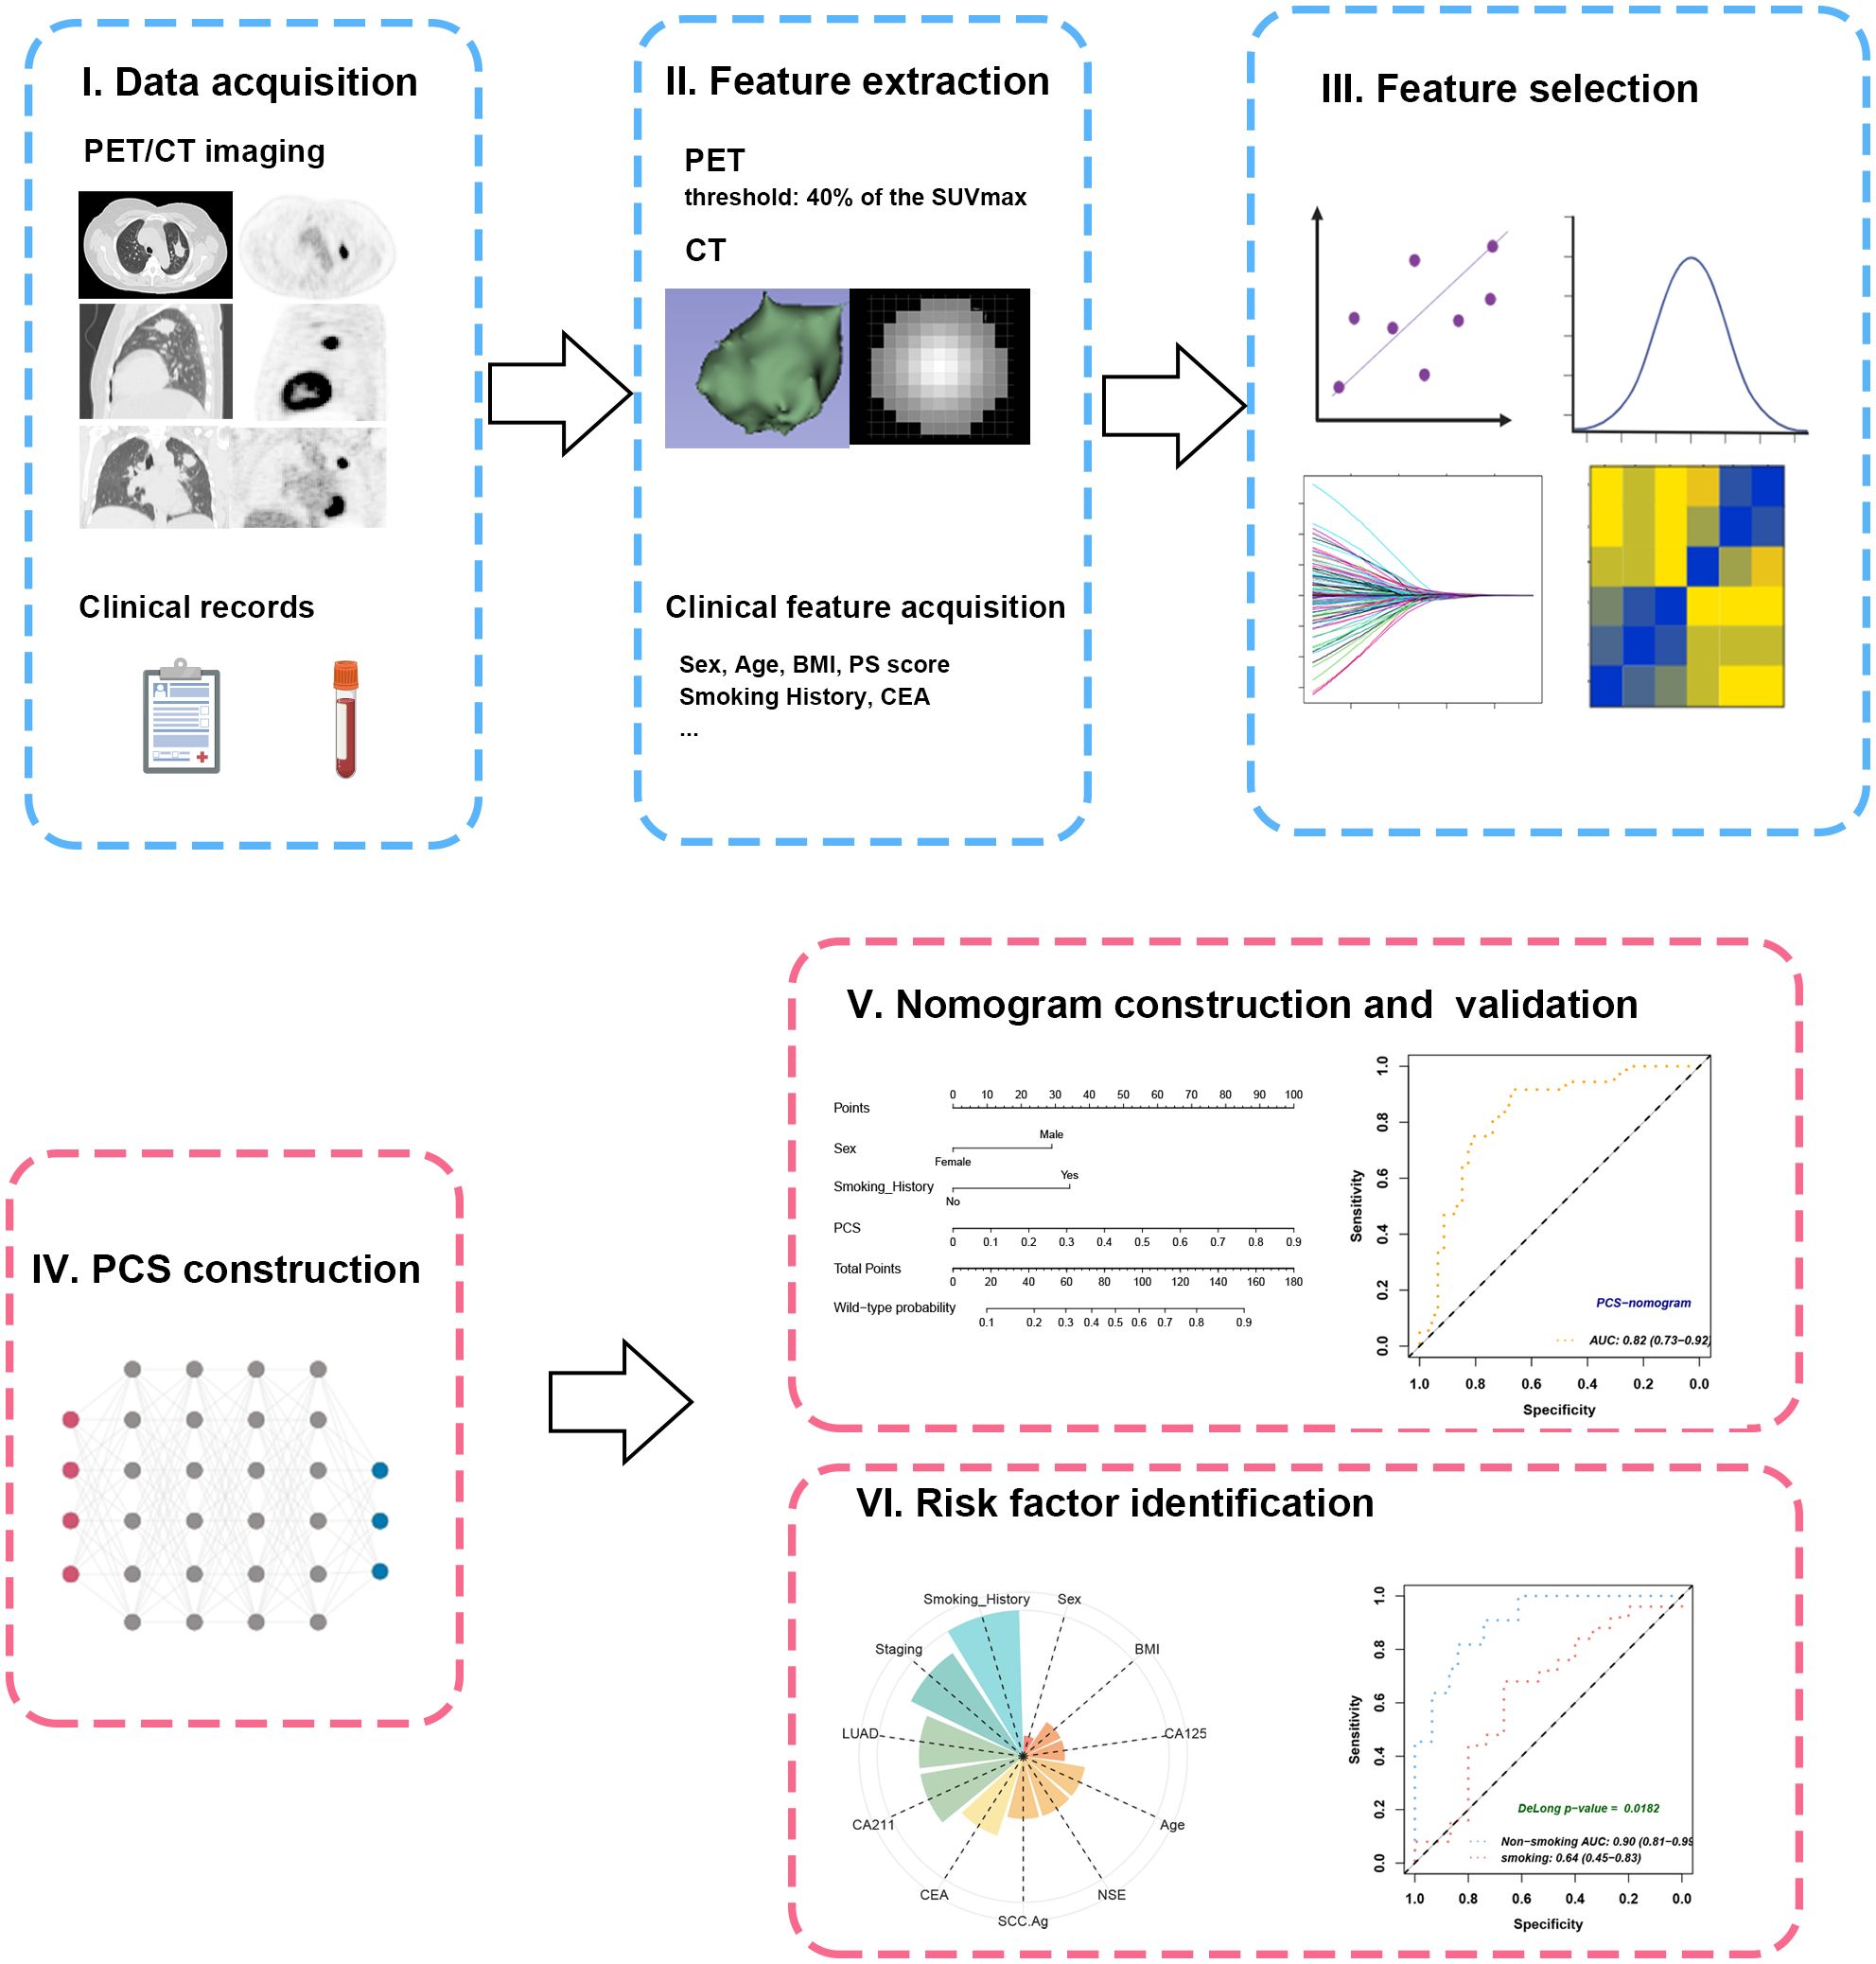
Figure 2. Workflow of study design. (I) The PET/CT imaging and clinical records of the included patients were collected and subjected to feature extraction. (II) The VOIs were semiautomatically contoured at the threshold of 40% of SUVmax. (III) Feature selection was enforced through ICC, U-test, LASSO, and Pearson’s correlation. (IV) The PCS was developed from combined radiomics by plsRglm. (V) The PCS was further integrated with significant clinical features to create a PCS-nomogram. (VI) Subgroup analyses revealed the impacts of different clinical characteristics on PCS. VOI, volume of interest; SUVmax, maximal standard uptake value; ICC, intraclass correlation coefficient; PCS, PET/CT signature.
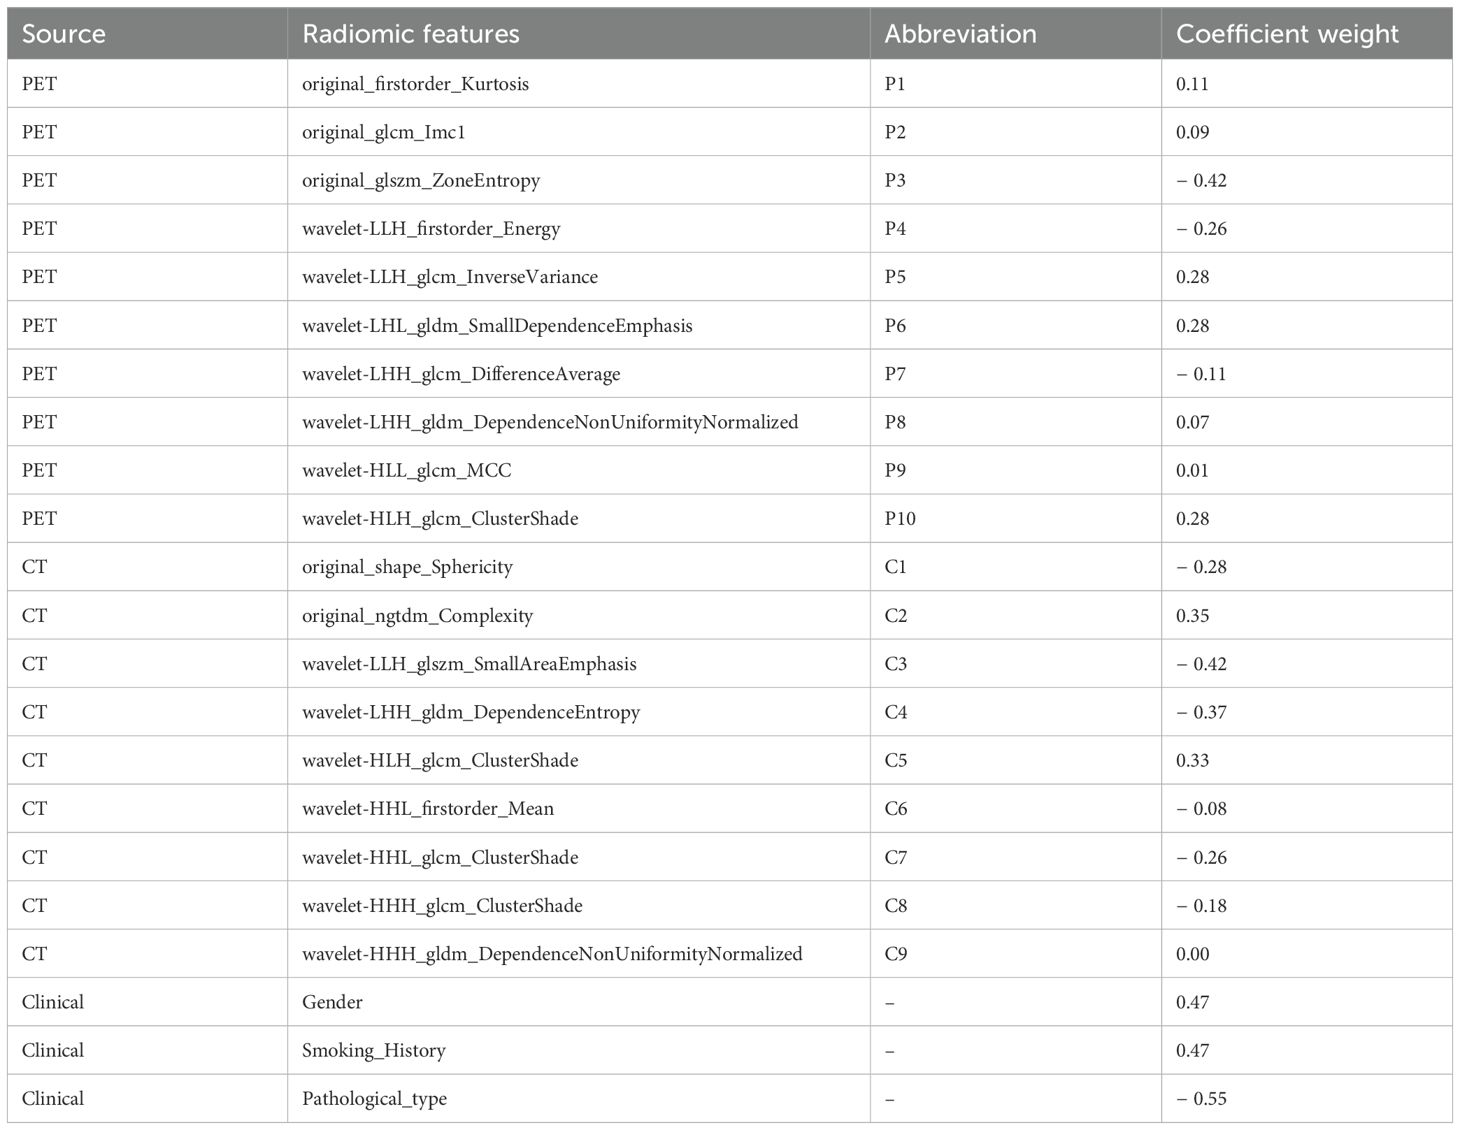
Table 2. The coefficient weights of the selected features used for the radiomics-based model in LASSO regression.
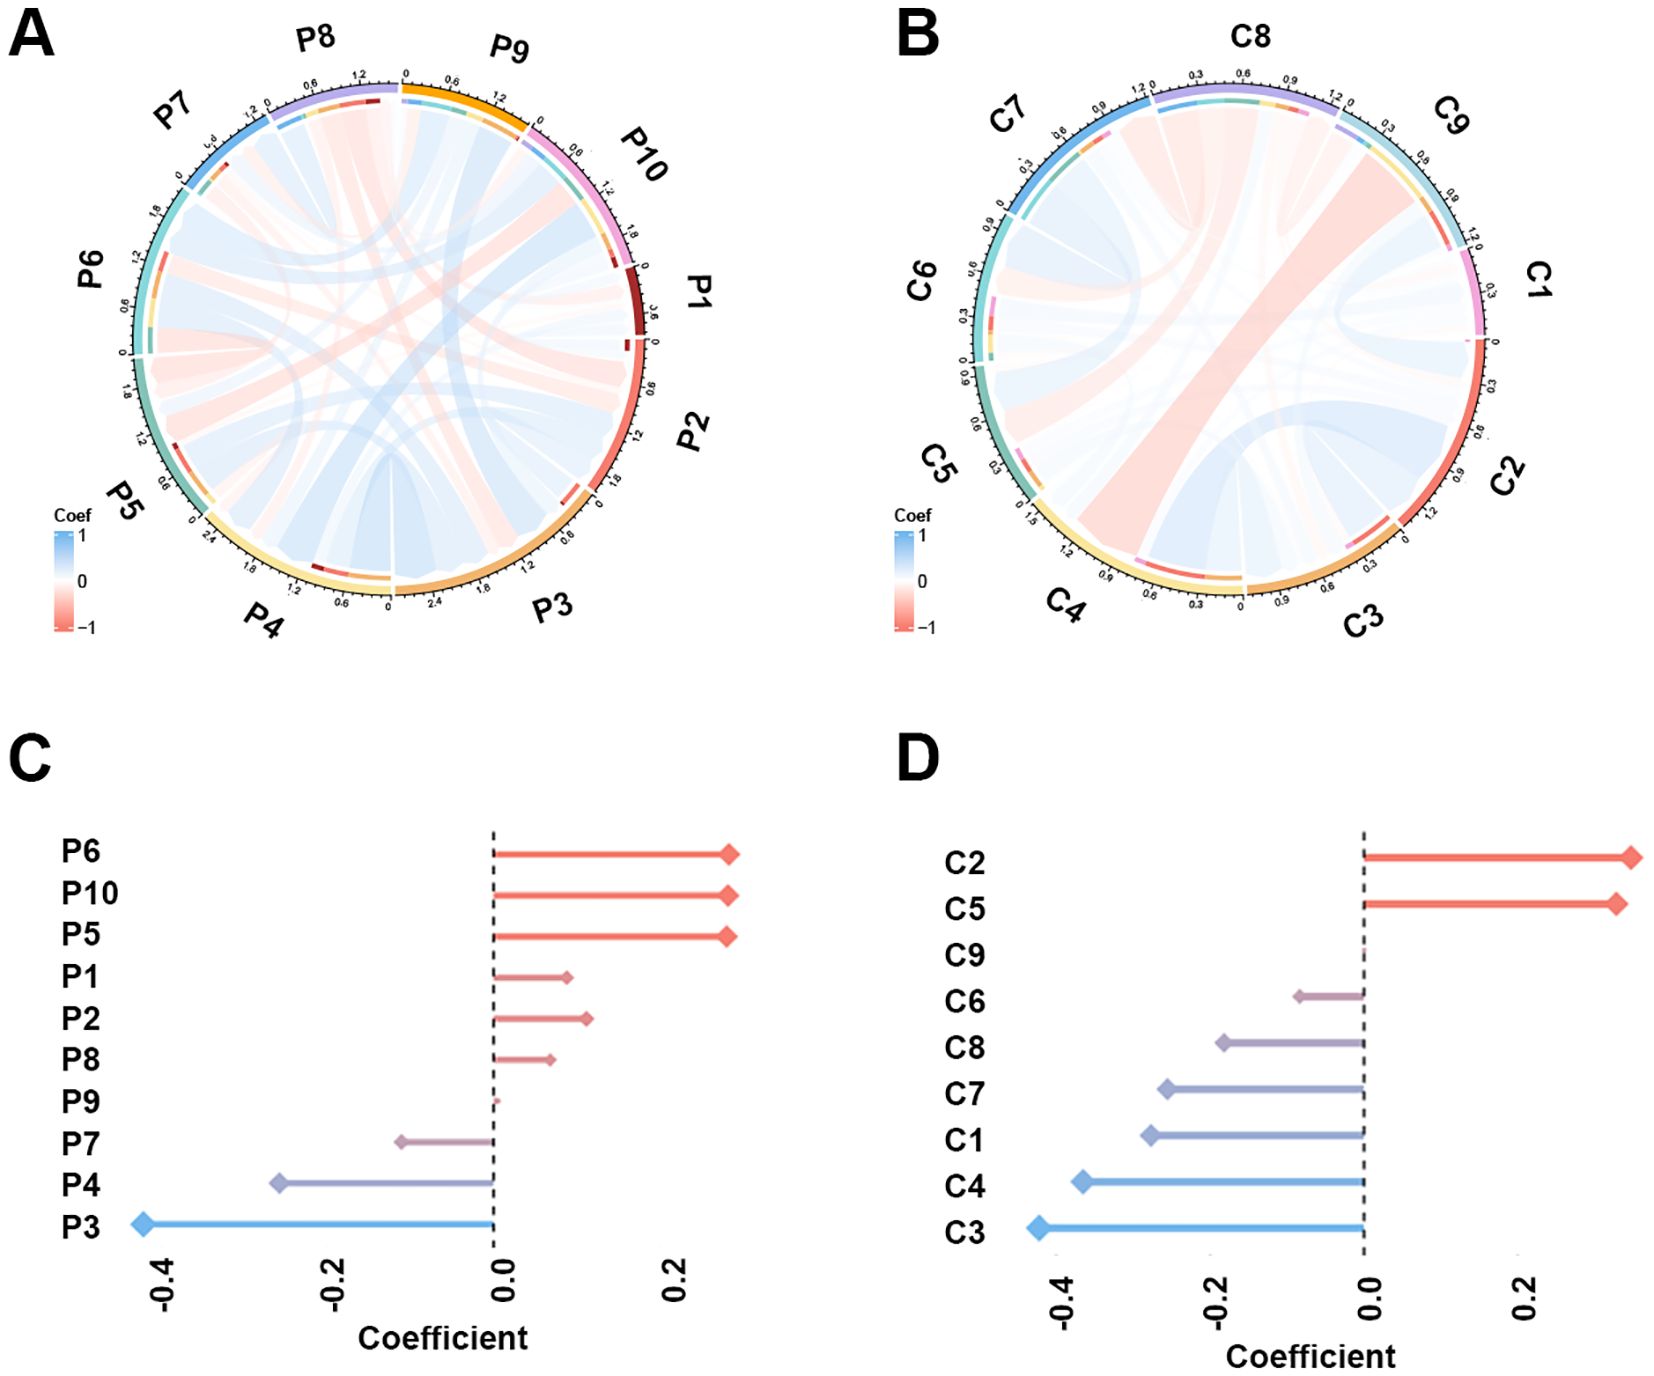
Figure 3. The Pearson’s correlation and LASSO coefficient weight of the selected 10 PET features and nine CT features. (A) Chord plot of the correlation between PET features. Color represents Pearson’s correlation coefficient. (B) Chord plot of the correlation between CT features. (C) LASSO coefficient weight of each PET feature. The dependent variable in the LASSO regression was EGFR mutation. (D) LASSO coefficient weight of each CT feature.
Performance of 10 radiomics-based machine learning models in predicting EGFR mutations
Ten state-of-the-art machine learning algorithms, including plsRglm, NaiveBayes, Ridge, GBM, SVM, LDA, LASSO, Enet, glmBoost, and XGBoost, were benchmarked to identify the optimal predictive model for EGFR mutation in NSCLC patients. Among these, the plsRglm algorithm achieved the best performance. Radar plots illustrated the AUCs of all models in the training and validation cohorts based on PET features (Figures 4A, B, Supplementary Table S1). The plsRglm-based PET model achieved an AUC of 0.68 (95% confidence interval [CI]: 0.56–0.79) in the validation cohort (Figure 4C). Similarly, models were constructed based on CT features (Figures 4D, E, Supplementary Table S2), with the plsRglm-based CT model achieving optimal classification performance (AUC = 0.73; 95% CI: 0.63–0.84; Figure 4F). Dual-modality PET/CT models (PCS models) integrating the selected PET and CT features were further developed (Figure 4G, Table 3). The plsRglm-based PCS model demonstrated the highest performance in the validation cohort (AUC = 0.78; 95% CI: 0.68–0.88; Figure 4H). Moreover, the integrated PET/CT model significantly outperformed the PET-only model (DeLong test, p < 0.05) and showed a trend toward better performance compared with the CT-only model (DeLong test, p = 0.093).
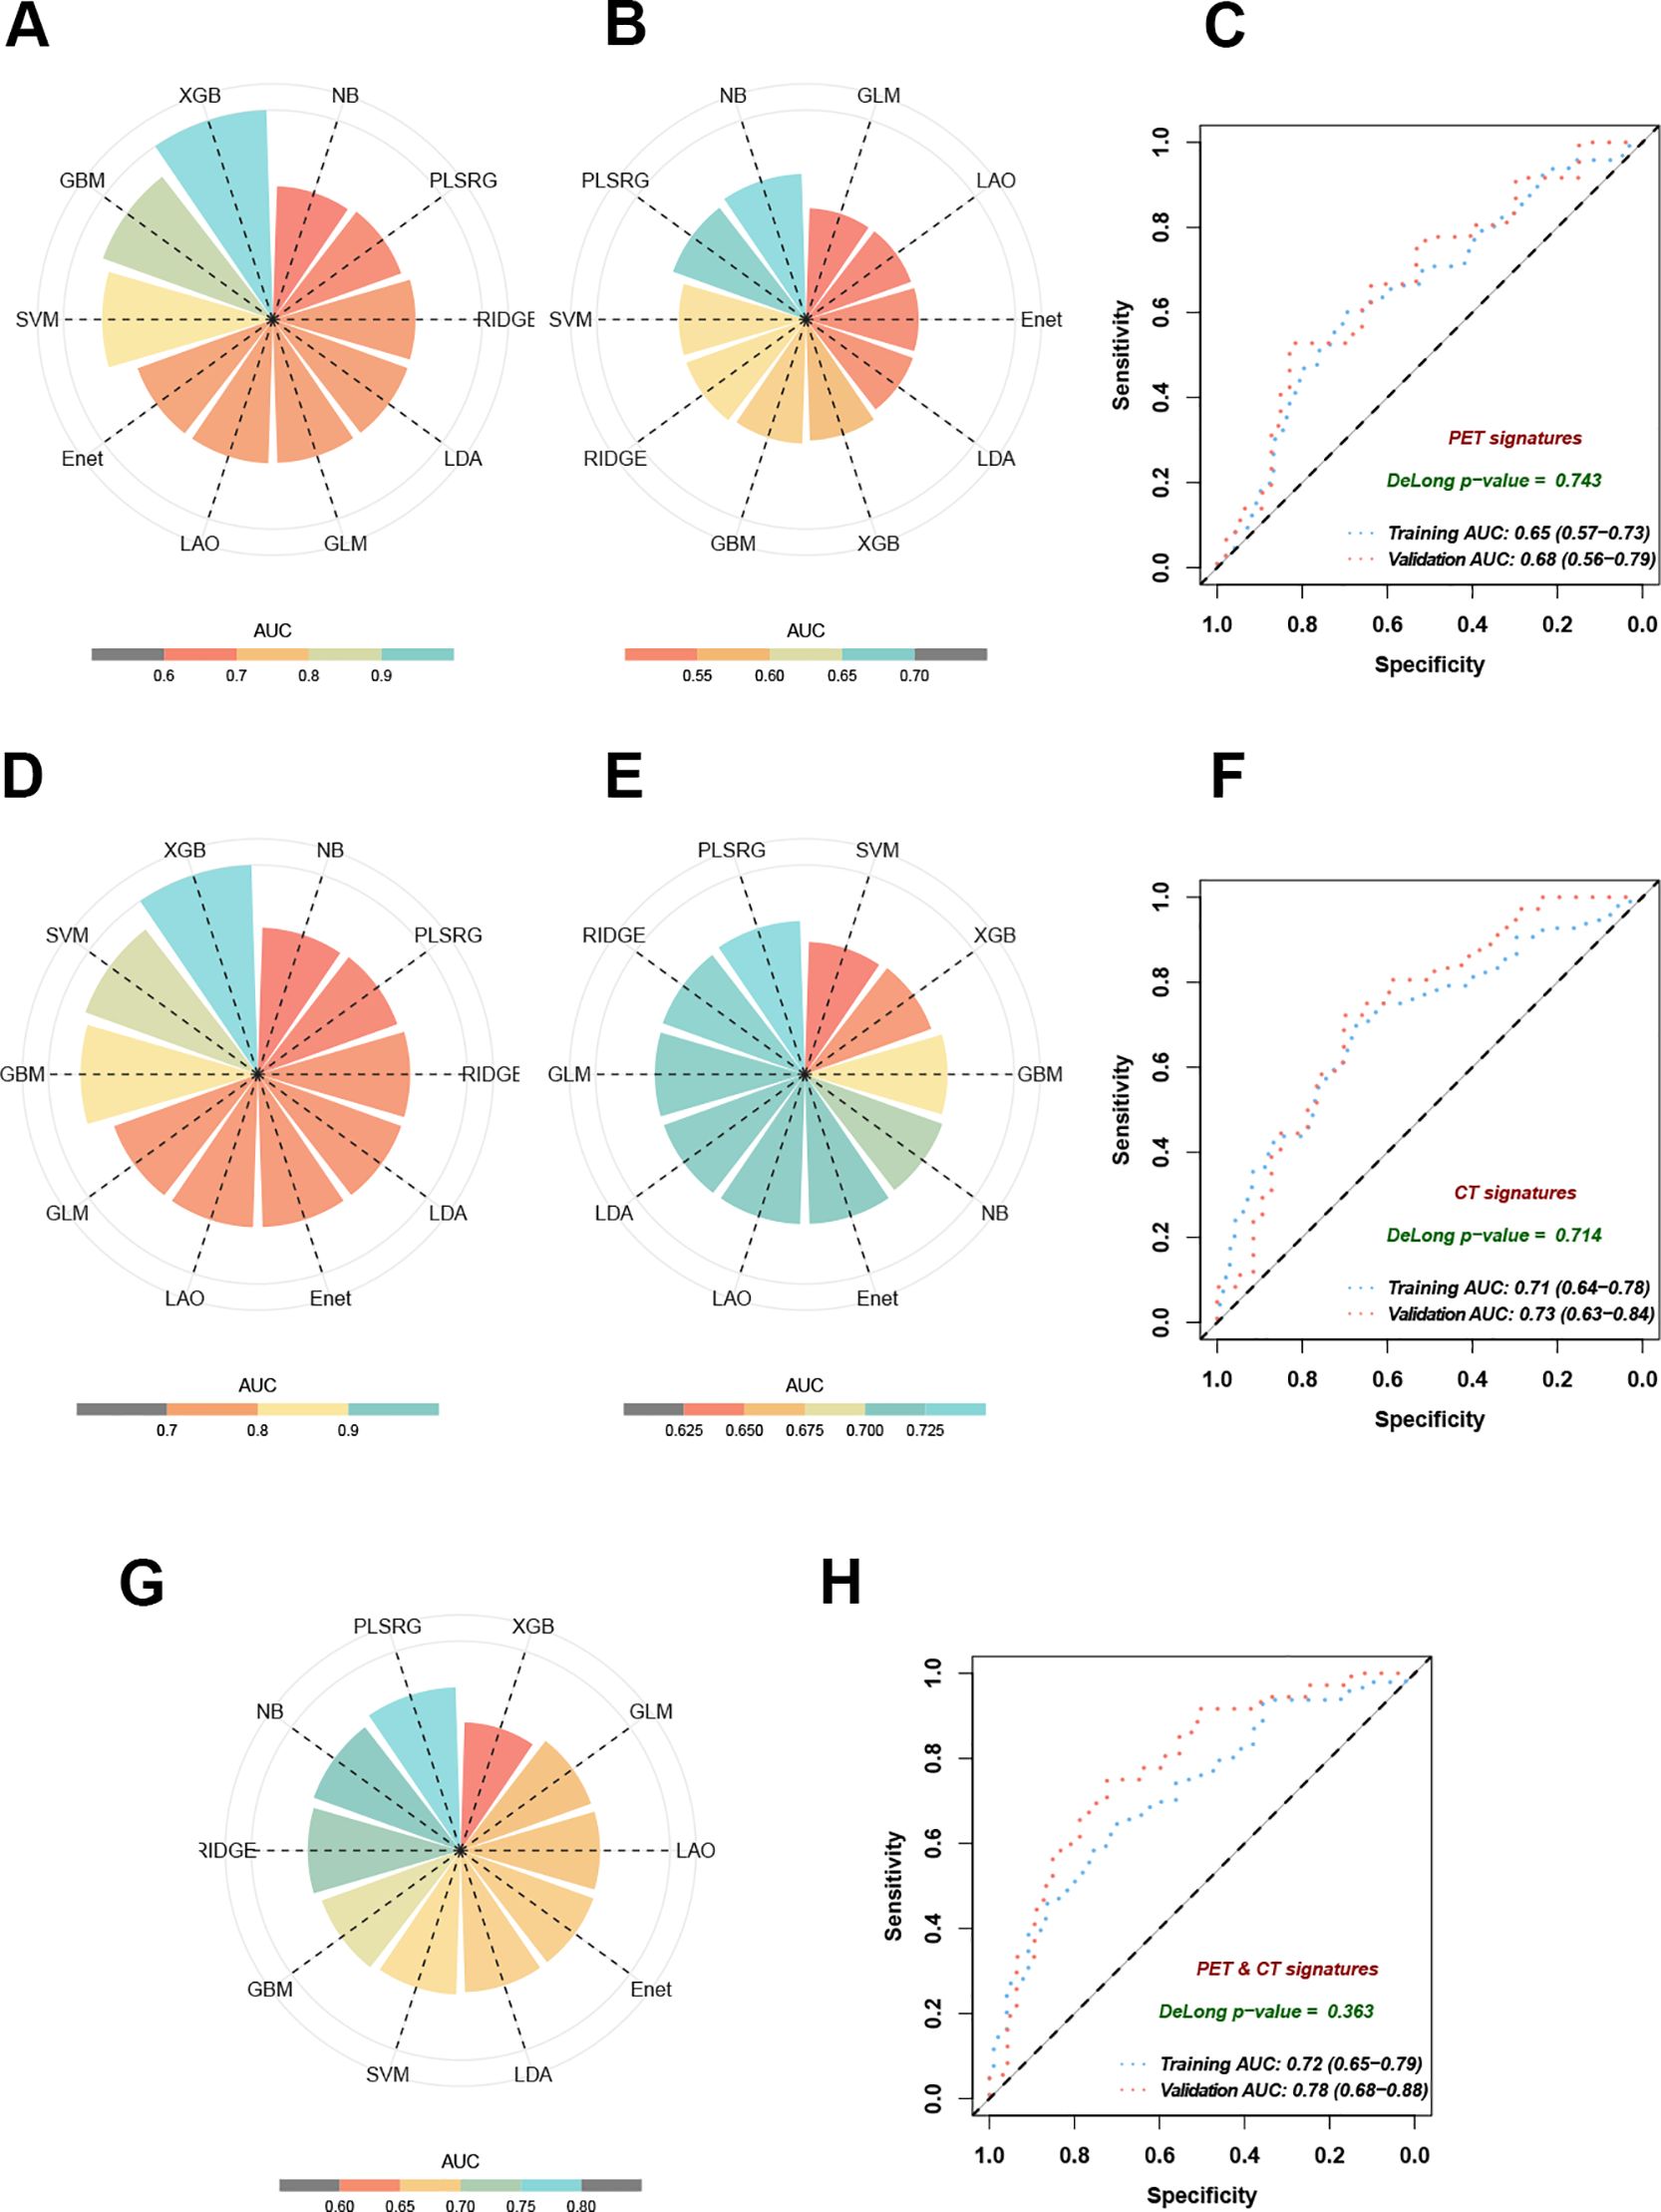
Figure 4. Performance of 10 machine learning algorithms on training and validation datasets. (A) AUC in training cohorts based on selected PET features. (B) AUC in validation cohorts based on selected PET features. (C) The ROC curves demonstrated the model performance established with the plsRglm algorithm in training and validation cohorts based on selected PET features. (D) AUC in training cohorts based on selected CT features. (E) AUC in validation cohorts based on selected CT features. (F) The ROC curves demonstrate the model performance established with the plsRglm algorithm in training and validation cohorts based on selected CT features. (G) AUC in validation cohorts based on the plsRglm-based PCS model. (H) The ROC curves demonstrated the PCS model’s performance in training and validation cohorts.
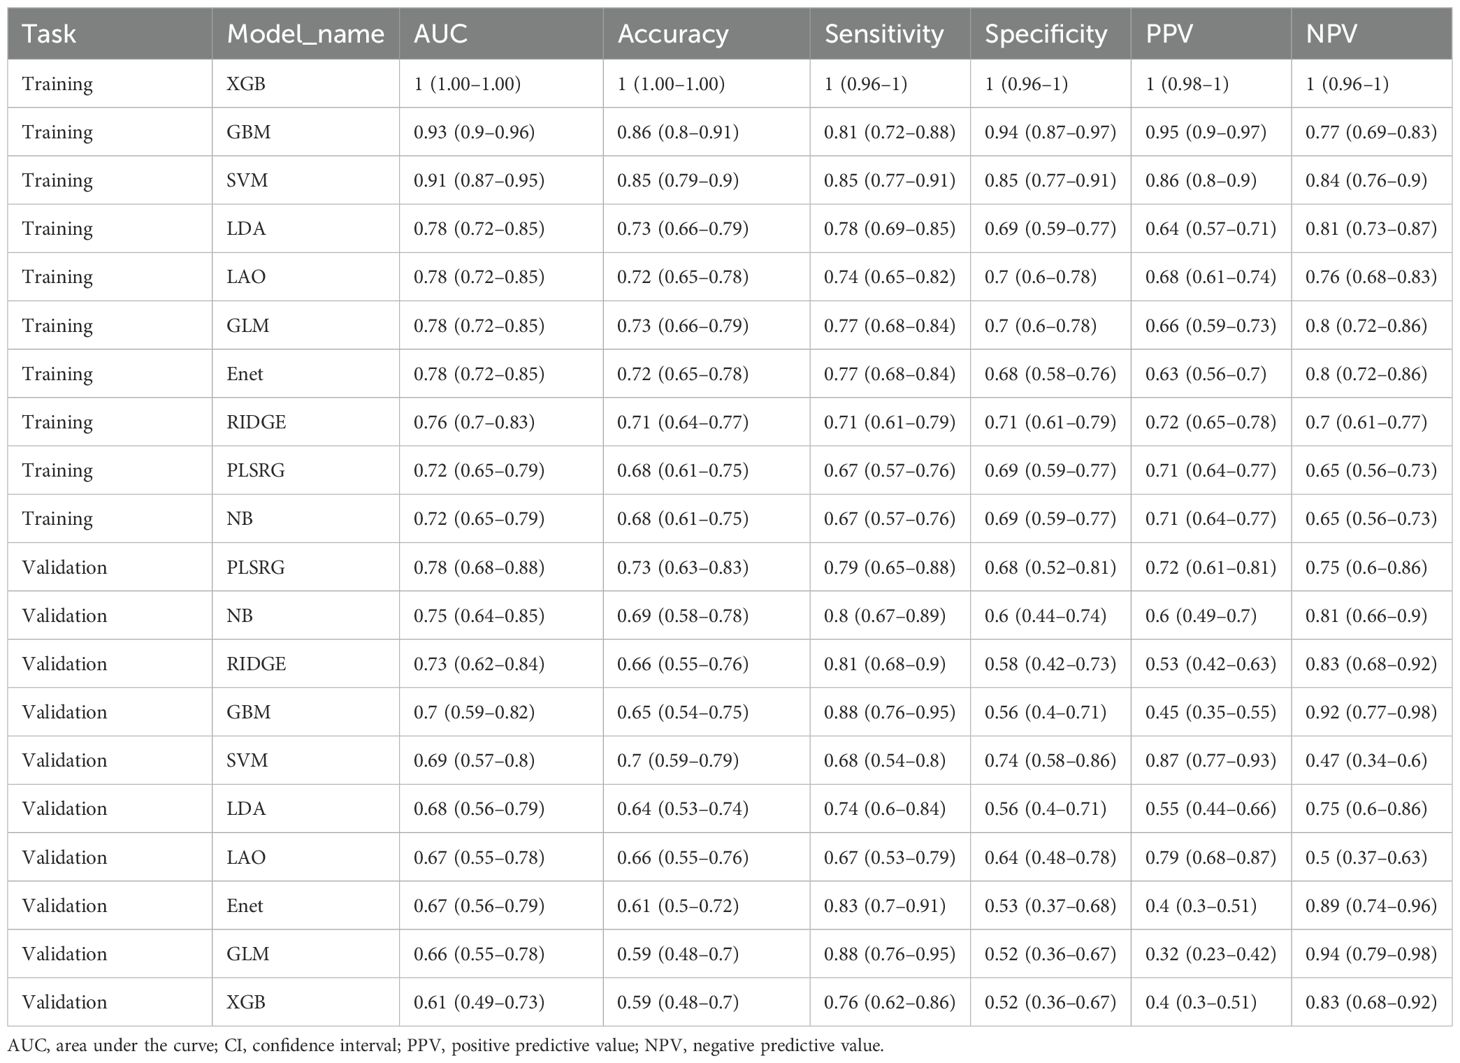
Table 3. The diagnostic performance of 10 different radiomics-based models in predicting EGFR mutation status in the training and validation cohorts.
Establishment and validation of the PCS-nomogram
Clinical features are closely associated with patients’ EGFR mutation status (21). To improve predictive accuracy, key clinical features were incorporated into the PCS model. Gender, smoking history, and pathological type were identified through LASSO regression (Table 2), with gender and smoking history further confirmed as key predictors of EGFR mutation in univariate and multivariable logistic regression analyses (Table 4). A PCS-nomogram integrating the PCS and these clinical features was developed (Figure 5A). In the validation cohort, the model achieved an AUC of 0.82 (95% CI: 0.73–0.92; Figure 5B). Calibration plots demonstrated good agreement between predicted and observed EGFR mutation probabilities (Figure 5C), and decision curve analysis indicated a clinically meaningful net benefit (Figure 5D). Triangular correlation plots revealed significant associations between the PCS-nomogram and key radiomic features (R > 0.1, p < 0.05; Figures 5E, F).
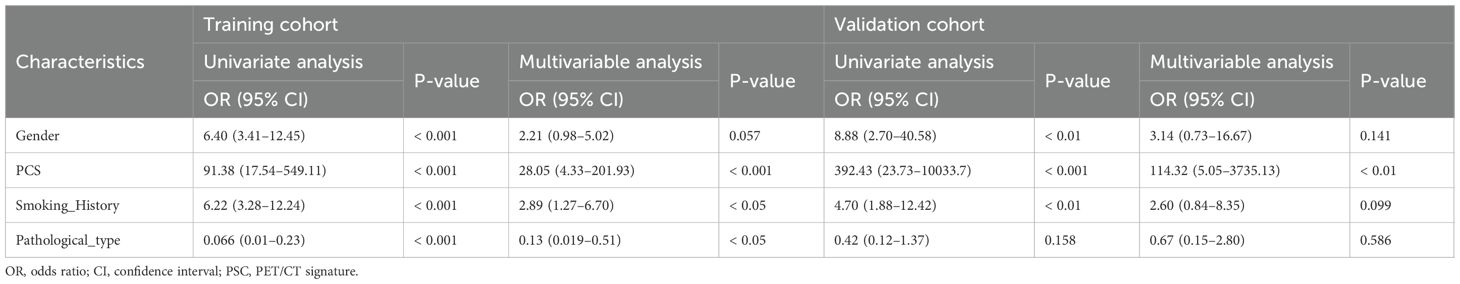
Table 4. Univariate and multivariable logistic regression of PSC-nomogram.
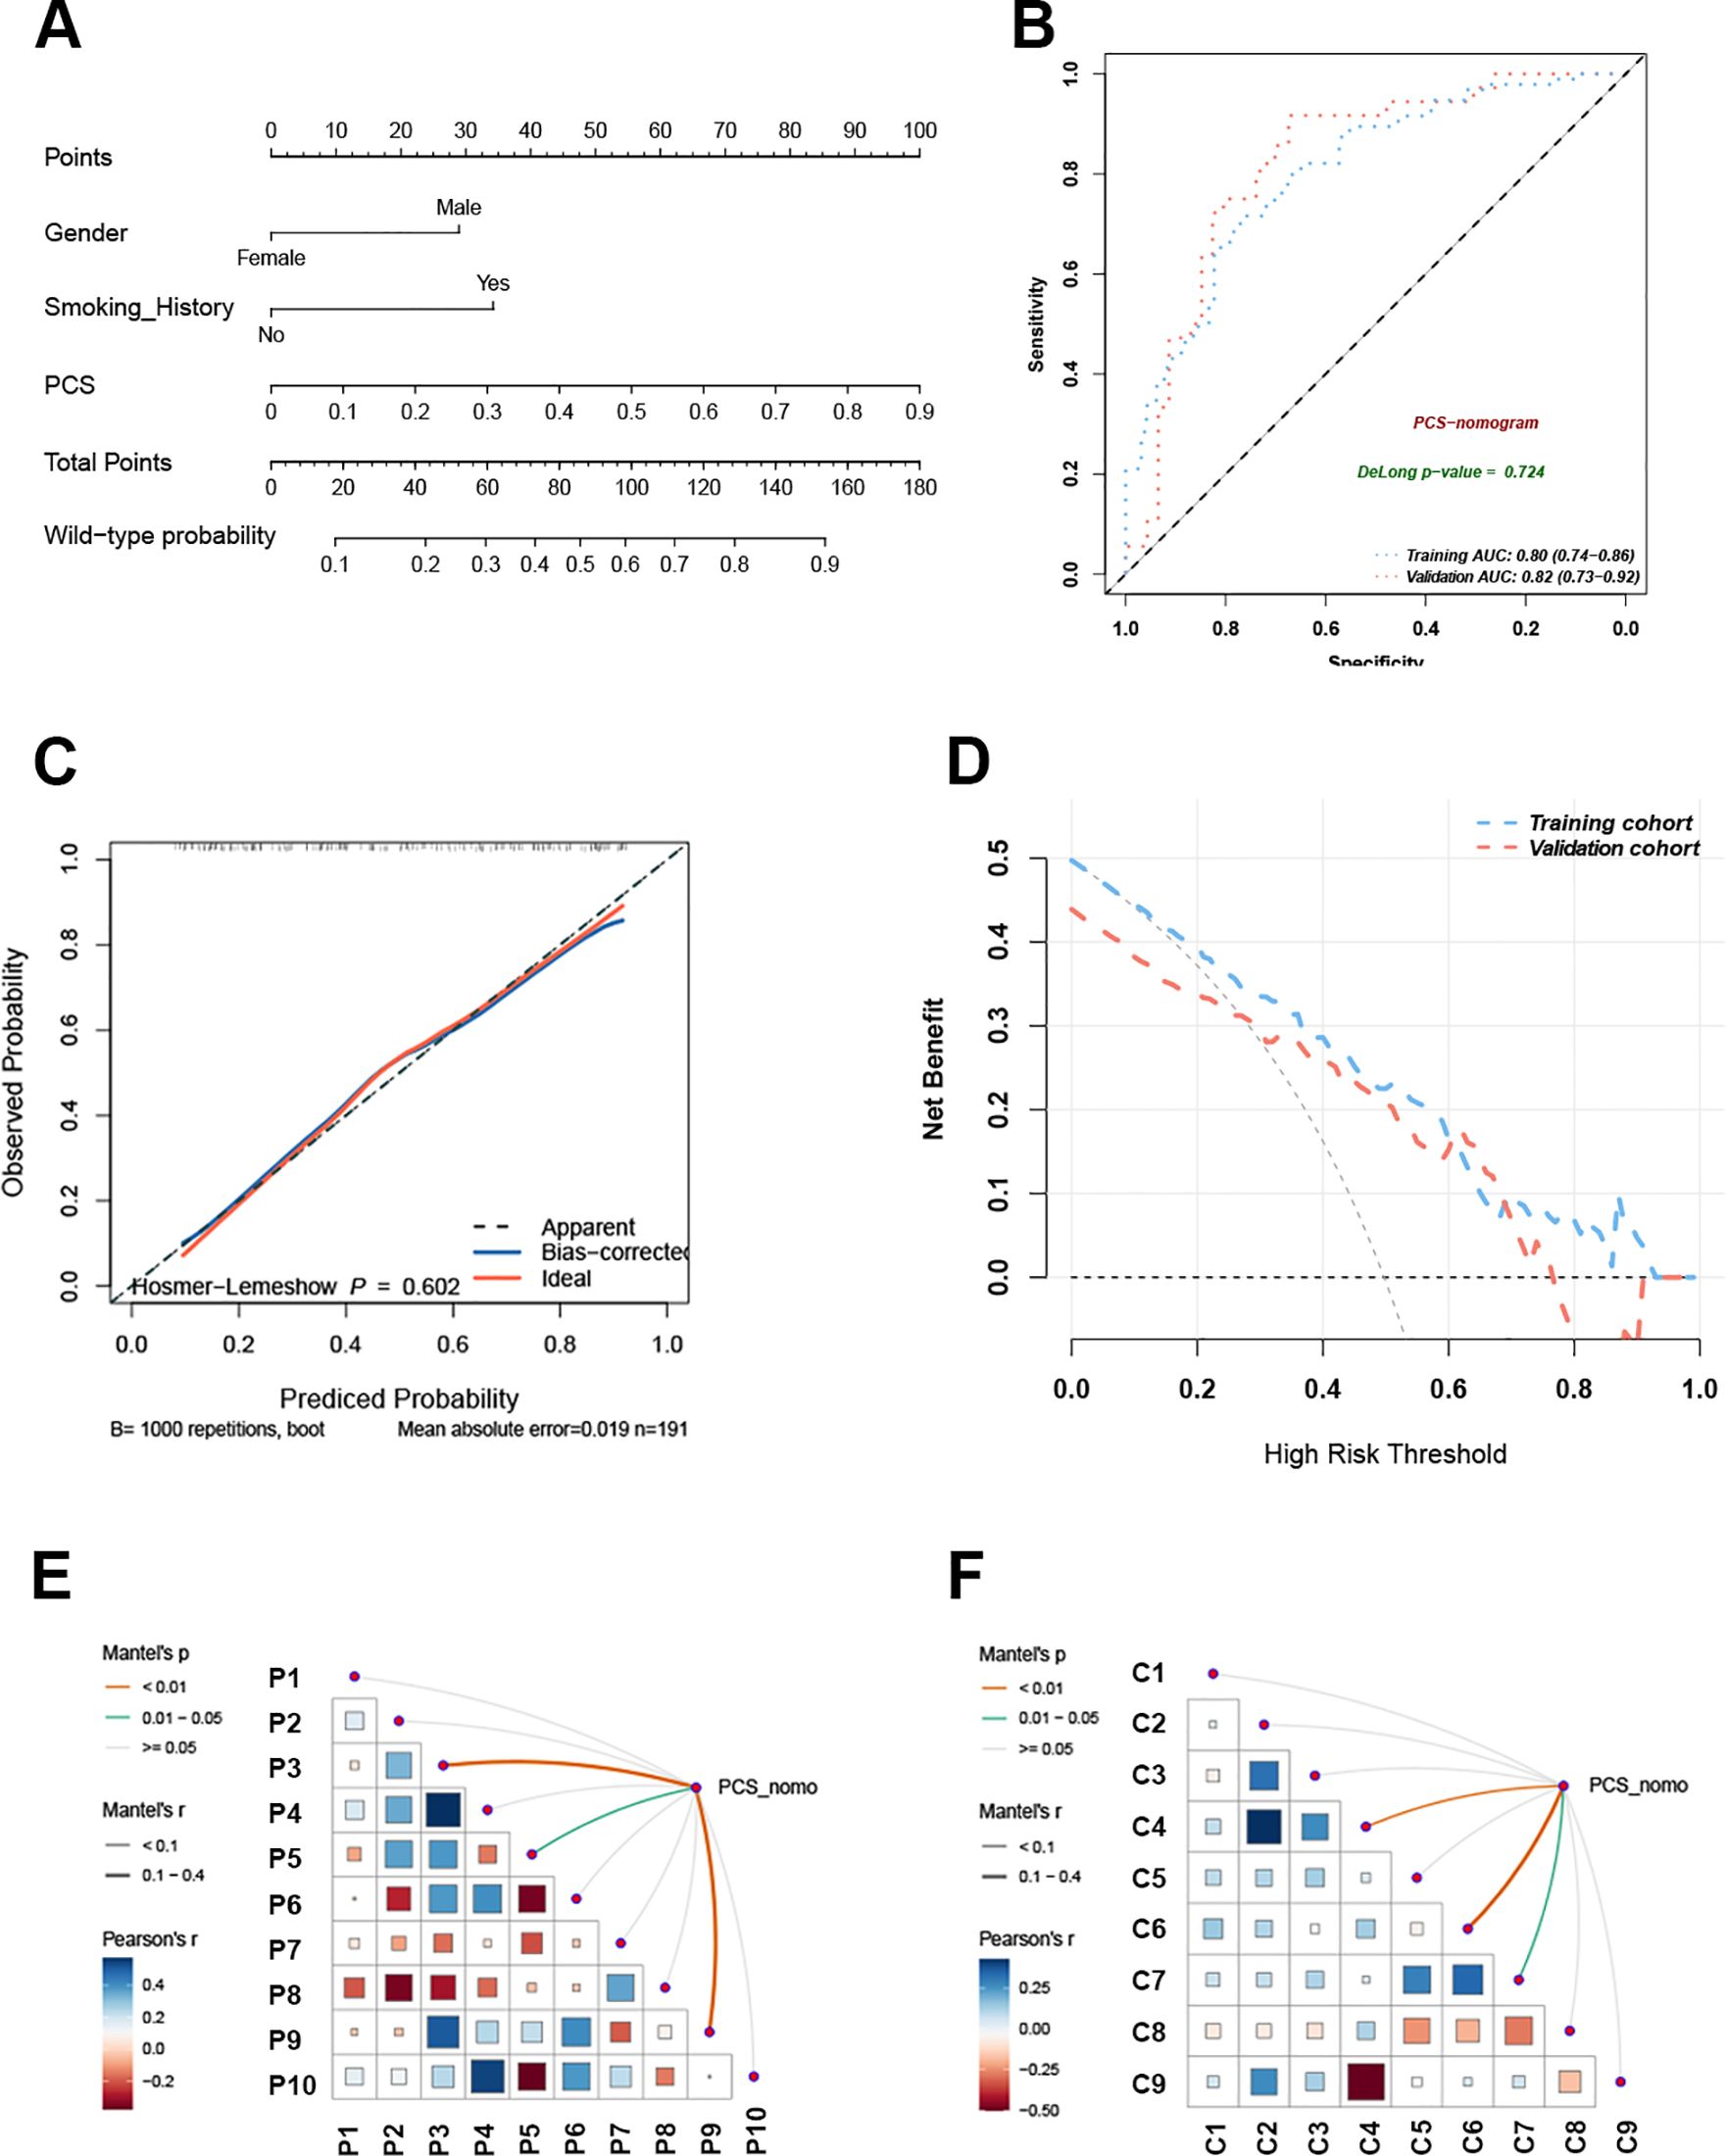
Figure 5. The PCS-nomogram model demonstrated outstanding capability in predicting EGFR mutations. (A) The nomogram model incorporates clinical features and PCS scores for predicting EGFR mutations in NSCLC patients. (B) The ROC curves of the PCS-nomogram model in the training and validation cohorts. (C) The calibration curve of the PCS-nomogram. (D) The DCA curves depict the net benefit at each decision threshold probability. (E) The triangular plot exhibits the correlation between PET features. (F) The triangular plot exhibits the correlation between CT features. PCS, PET/CT signature; ROC, receiver operating characteristic; DCA, decision curve analysis.
Identification of risk factors for prediction failure
To assess prediction accuracy at the individual level, EGFR mutation probabilities for each patient were obtained using the PCS model across 10 machine learning algorithms via LOOCV. The plsRglm algorithm exhibited the highest concordance between predicted and observed EGFR status (Figure 6A).
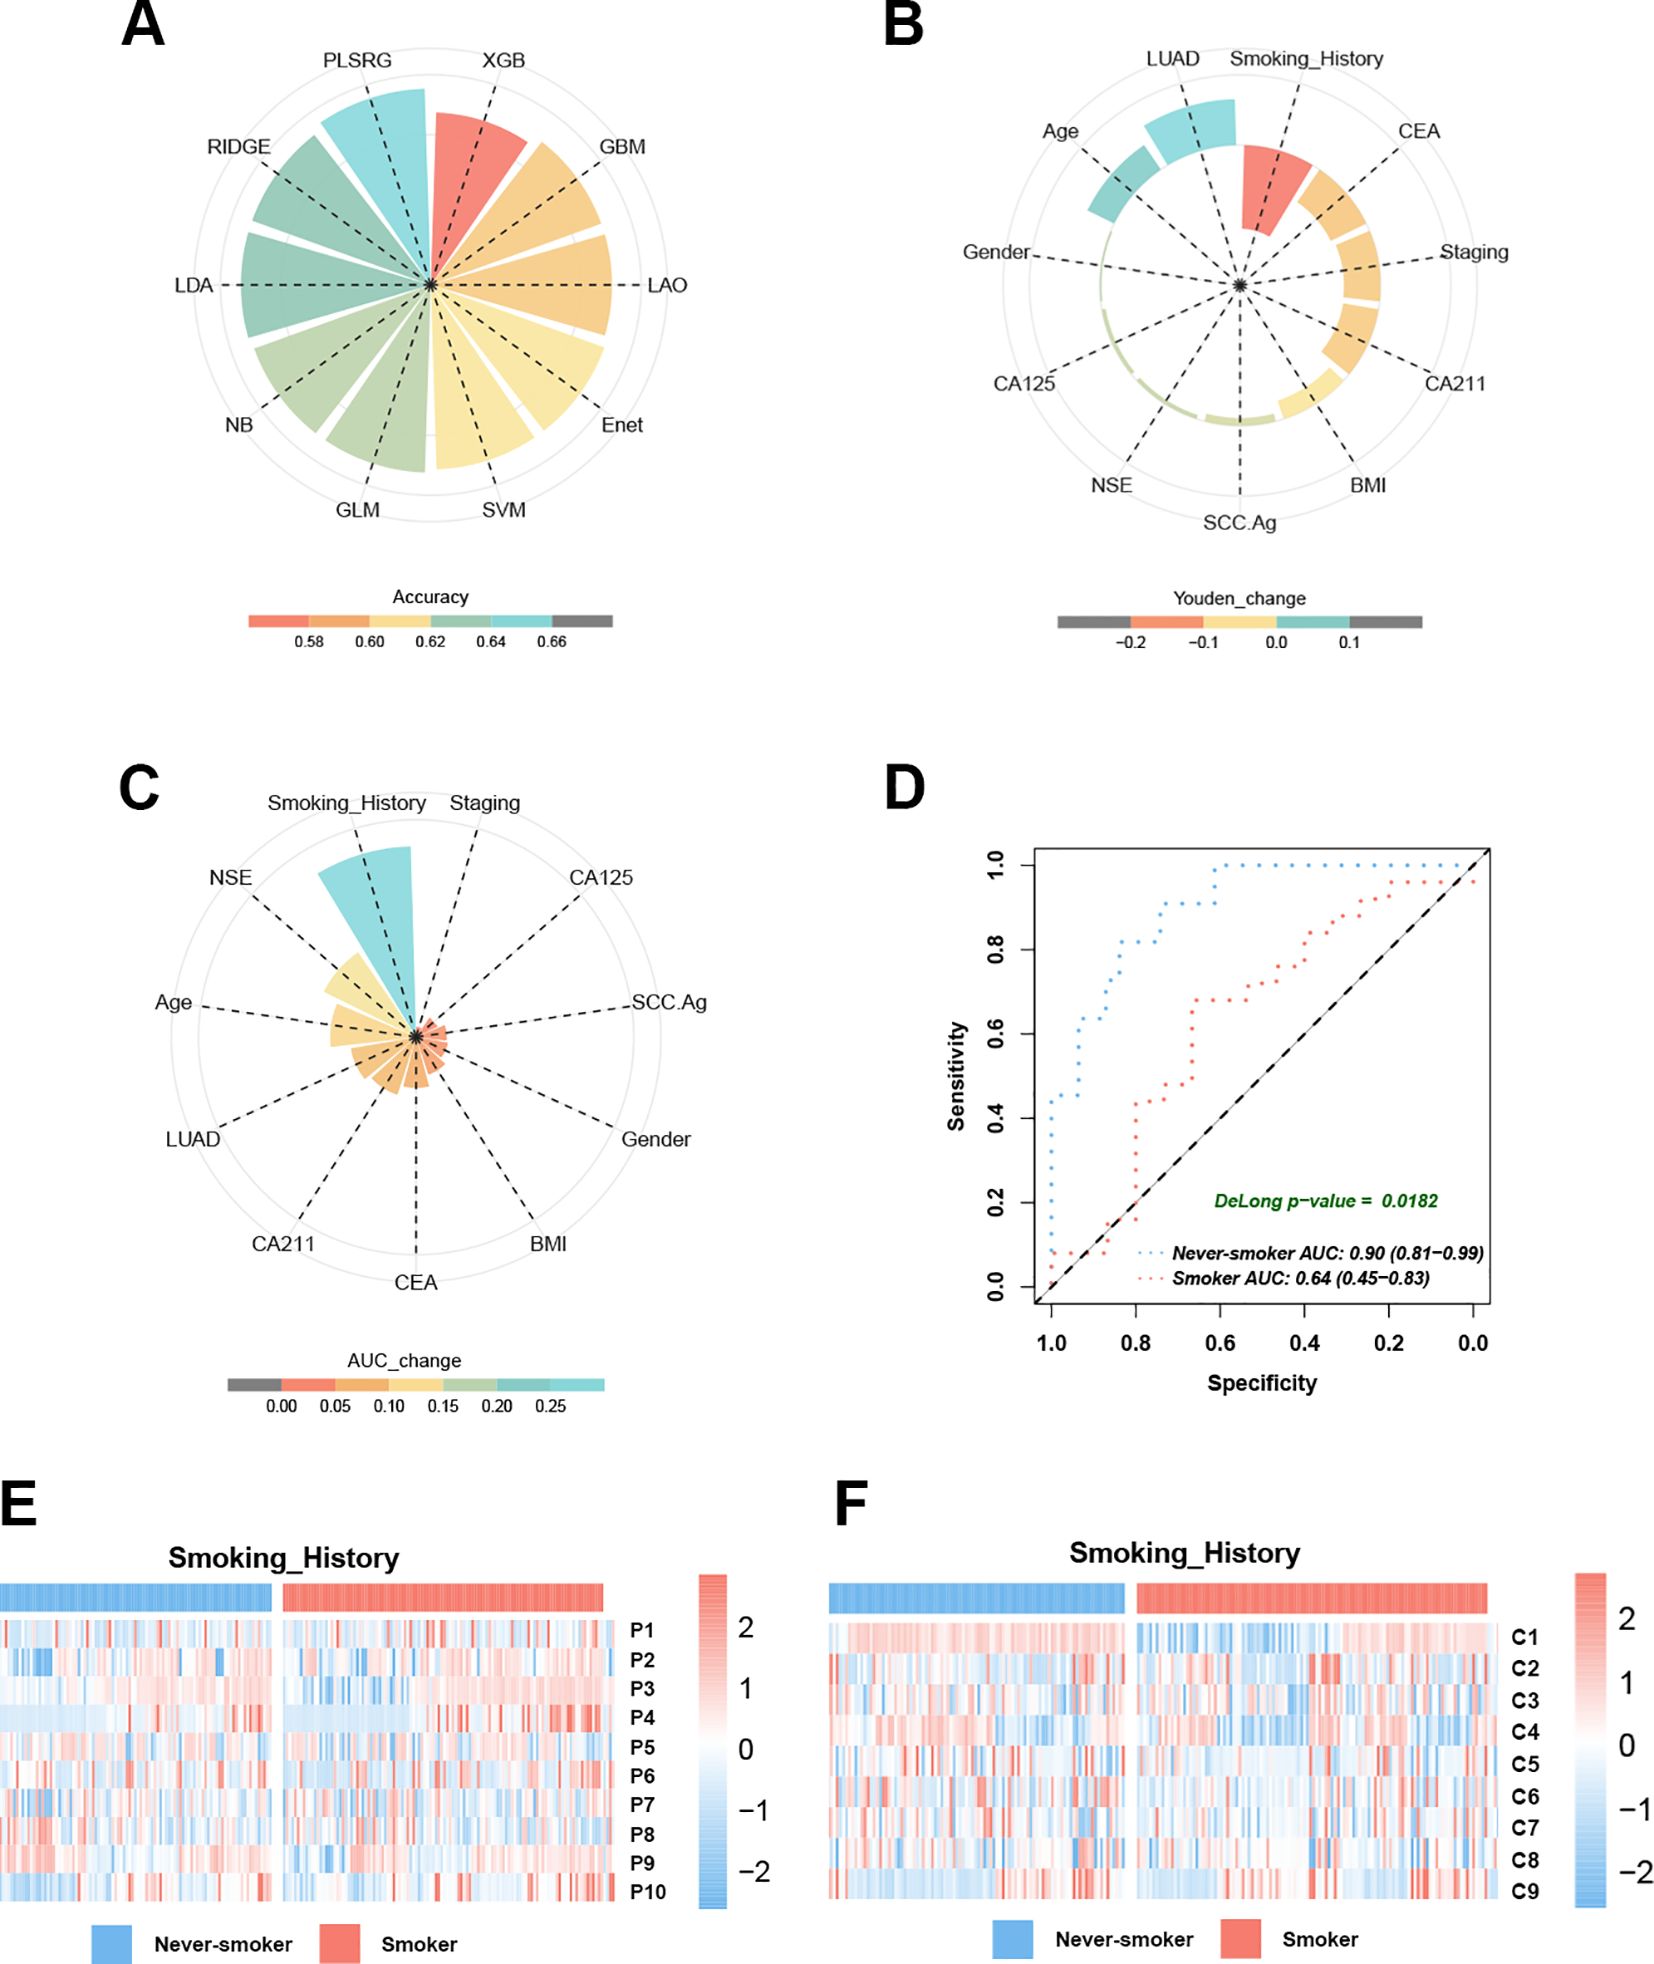
Figure 6. Smoking history emerges as a critical determinant influencing EGFR prediction model performance. (A) The pie chart demonstrates the accuracy of 10 machine learning techniques calculated by LOOCV. (B) Smoking history dominates the PCS model performance decline in Youden’s index. (C) Smoking history dominates the PCS model performance decline in the AUC. (D) The AUC curves of the PCS model for predicting EGFR mutation in smokers and never-smokers with NSCLC. (E) Heatmaps reveal the different distribution modules of PET features between smokers and never-smokers. (F) Heatmaps reveal the different distribution modules of CT features between smokers and never-smokers.
The 11 baseline clinical characteristics were dichotomized using median-based cutoffs to identify factors associated with model misclassification. Systematic comparison of Youden’s index across subgroups indicated that smoking history had the largest impact (mean reduction = 0.18; Figure 6B). Predictive performance was significantly reduced in smokers, with seven of 10 models showing Youden’s index decreases ≥ 0.1 compared with never-smokers (Supplementary Figure S2). In the validation cohort, the PCS model achieved a lower AUC in smokers (AUC = 0.64, 95% CI: 0.45–0.83) than in never-smokers (AUC = 0.90, 95% CI: 0.81–0.99; ΔAUC = 0.26, Figure 6C; DeLong test, p < 0.05, Figure 6D). In contrast, other baseline characteristics—including age, gender, BMI, histological subtype, tumor marker levels, and clinical stage—had limited effects on the AUC of EGFR mutation prediction. Heatmap analysis revealed significant differences in PET and CT feature distributions between smokers and never-smokers (Figures 6E, F; Table 5), suggesting that smoking modulates PET/CT radiomic feature patterns. Collectively, these findings indicated that never-smokers represent the optimal population for radiomics-based EGFR mutation prediction in NSCLC.
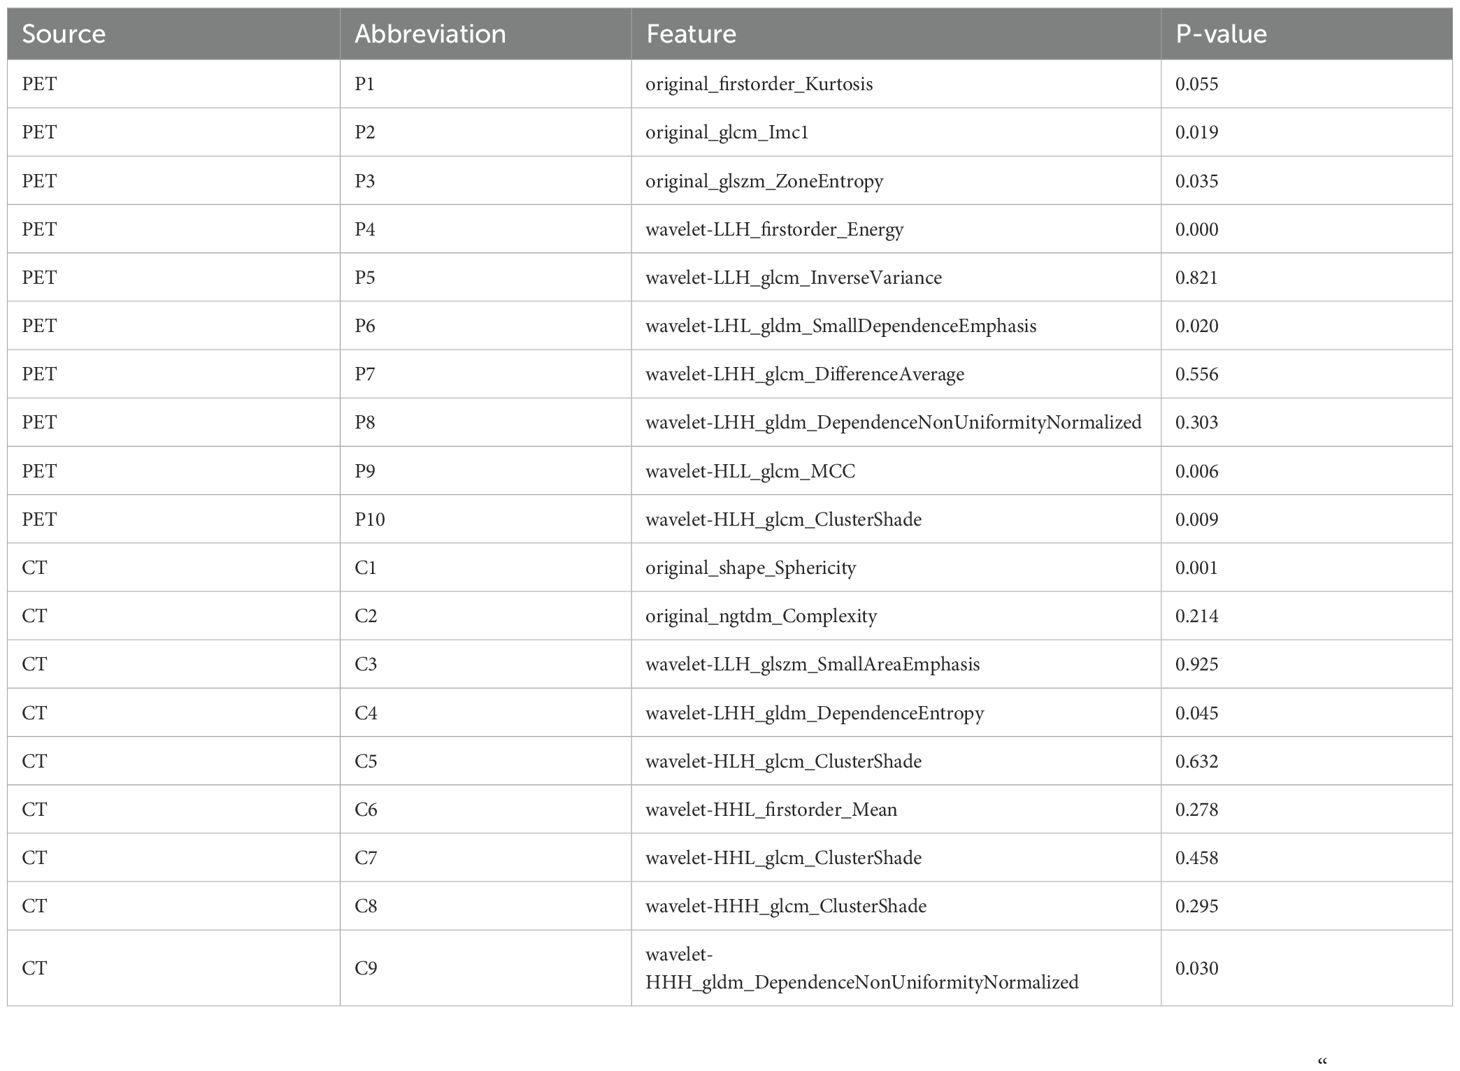
Table 5. The distribution of PET and CT features in patients with/without smoking history.
Discussion
In this study, we developed a PCS model based on 18F-FDG PET/CT radiomic features to predict EGFR mutation status in NSCLC, through a comprehensive evaluation of 10 machine learning algorithms. Key clinical factors influencing model misclassification were identified to define the optimal patient population for radiomics-based prediction. Furthermore, integrating clinical variables into a PCS-nomogram enhanced predictive accuracy and facilitated the clinical translation of imaging-to-molecular profiling approaches.
The LASSO regression coefficients indicated that EGFR-mutant tumors exhibited significantly elevated glucose metabolism, greater CT image heterogeneity, and higher sphericity compared with wild-type tumors, consistent with previous observations (11, 22–25). From a tumor biology perspective, these characteristics may stem from the ability of EGFR mutations to amplify downstream signaling cascades, particularly MEK/ERK and PI3K/AKT/mTOR pathways (26, 27). Activation of these pathways promotes tumor proliferation while increasing cellular glucose uptake (28, 29). In addition, EGFR-driven tumorigenesis has been associated with dysregulated angiogenesis, leading to regional necrosis due to insufficient oxygen perfusion, which manifests as heterogeneous CT patterns (30). Consistent with previous quantitative shape analysis (25), our findings revealed that EGFR-mutated lung carcinoma exhibited significantly higher sphericity indices than wild-type tumors, providing an additional morphological biomarker for predicting EGFR mutation status.
The 10 commonly used machine learning algorithms in current radiomics research (31–33) were systematically evaluated in our study, and plsRglm was identified as the optimal approach, forming the basis of the PCS model. In both training and validation cohorts, the dual-modality PET/CT model achieved significantly higher AUCs than the PET-only model (p < 0.05) and marginally higher AUCs than the CT-only models, consistent with a previous report (25). Similarly, a meta-analysis by Nguyen et al. reported comparable results, including 35 studies evaluating artificial intelligence-based radiomics models for predicting EGFR mutations in NSCLC (34). Notably, CT-based radiomics models alone demonstrated reasonably good predictive performance for EGFR mutation status (35, 36). Therefore, PET/CT-based models should be regarded as complementary tools that may provide additional value in patients who already undergo PET/CT for staging or follow-up, owing to the fact that PET/CT use remains limited by cost and accessibility.
We further demonstrated that combining the PCS with clinical characteristics improved the prediction of EGFR mutation status in lung cancer patients, particularly when incorporating gender and smoking history. Epidemiological studies have reported that EGFR mutations occur in 40%–50% of nonsmoking NSCLC patients compared to 10%–15% in smokers, confirming smoking status as an independent predictive factor for EGFR mutations (37, 38). Similarly, gender-associated differences have been documented, with Asian women with NSCLC exhibiting higher EGFR mutation rates (50%–60%) than men (20%–30%) (39, 40). Notably, the association between smoking history and EGFR mutations was stronger than that of gender (39, 40), consistent with the greater weight assigned to smoking in our PCS-nomogram scoring system.
Most importantly, we identified smoking status as the key determinant factor influencing the performance of imaging-based prediction models. Compared to other clinical characteristics, including histologic type, age, gender, and tumor biomarkers, smoking status had the greatest impact on model performance, as reflected by changes in the Youden’s index. Specifically, the predictive accuracy of imaging models was markedly lower in smokers than in never-smokers within the PCS model. This discrepancy was primarily attributable to the heterogeneity of imaging features between the two populations rather than differences in EGFR mutation prevalence (28.95% vs. 68.55%). Using a LOOCV strategy, each patient’s prediction was generated from a model trained on the remaining 276 samples, in which the EGFR mutation rate remained approximately 52.3%, consistent with that of the overall cohort. Mechanistically, several factors may explain why PET/CT-based EGFR mutation prediction models perform less effectively in smokers. First, previous studies have reported that smoking induces alternative mutations, including KRAS and TP53, through DNA damage mechanisms (41), which may produce distinct imaging features that obscure EGFR-related signatures. Second, smokers frequently present with comorbid pulmonary pathologies such as emphysema, chronic obstructive pulmonary disease, inflammation, and fibrosis (42), which can interfere with imaging biomarkers associated with EGFR mutations and further reduce model accuracy. Therefore, we recommend that future radiomics models for EGFR prediction consider restricting inclusion criteria based on smoking status to improve predictive validity.
Accurate integration of imaging and clinical features is critical in radiomics-based prediction studies. A recent review highlighted the strengths and limitations of different fusion strategies in this context (43). Early fusion, which combines imaging and clinical variables at the model training stage, can enhance predictive performance when sample size is sufficient and feature dimensions are balanced; however, in moderate-sized cohorts with a large imbalance between imaging and clinical features, it may lead to overfitting and obscure clinically meaningful predictors (44). In contrast, late fusion develops separate models for each modality and integrates their outputs at the decision level, offering greater interpretability and flexibility (45, 46). In the present study, given the moderate sample size and the disparity between imaging and clinical features, we adopted a more appropriate late fusion framework, which was confirmed to outperform early fusion strategy in multiple comparative studies under similar conditions (47–49). This approach also allowed independent analysis of clinical factors, enabling the identification of key contributors to model misclassification and the precise definition of the optimal patient population for machine learning-based EGFR mutation prediction.
Our study has several limitations. First, this was a single-center study, limiting sample diversity. External validation using multicenter cohorts is required to enhance model generalizability and robustness. The designation of smoking as a determinant factor of model performance also requires validation in larger cohorts. Second, preclinical studies have developed EGFR-targeted radiotracers, such as 18F-MPG, which may offer more specific mutation-related imaging features than conventional FDG PET/CT, providing greater precision for radiomics-based characterization of EGFR status (50, 51). Finally, the PCS-nomogram workflow involves multiple steps, including VOI delineation and feature extraction, necessitating integration into standardized clinical software to facilitate broader implementation.
In summary, our PCS-nomogram demonstrated the potential to noninvasively and accurately predict EGFR mutation status in NSCLC patients using baseline PET/CT imaging combined with clinical characteristics. This model could serve as a valuable complementary tool for patients with insufficient biopsy samples or contraindications to invasive procedures. Moreover, our findings revealed that radiomics-based prediction was more reliable in never-smokers, whereas smoking history acted as a major confounding factor contributing to prediction failure. These insights advance the clinical application of “imaging-to-molecular diagnosis”, guide patient selection, and hold promise for translation into clinical benefits.
Data availability statement
The original contributions presented in the study are included in the article/Supplementary Material. Further inquiries can be directed to the corresponding author.
Ethics statement
The studies involving humans were approved by Institutional Review Board of Zhongnan Hospital of Wuhan University. The studies were conducted in accordance with the local legislation and institutional requirements. The ethics committee/institutional review board waived the requirement of written informed consent for participation from the participants or the participants’ legal guardians/next of kin because this retrospective study analyzed existing clinical and imaging data that were anonymized prior to analysis and posed no additional risk to participants. The waiver was reviewed and approved by the Institutional Review Board of Zhongnan Hospital, Wuhan University, in accordance with national legislation and institutional requirements.
Author contributions
JL: Conceptualization, Formal analysis, Validation, Writing – original draft, Data curation, Methodology. ZZ: Formal analysis, Methodology, Software, Writing – review & editing, Validation, Visualization. JC: Software, Supervision, Writing – review & editing. TF: Data curation, Resources, Writing – review & editing. HL: Data curation, Resources, Writing – review & editing. YH: Conceptualization, Writing – review & editing.
Funding
The author(s) declare that no financial support was received for the research and/or publication of this article.
Conflict of interest
The authors declare that the research was conducted in the absence of any commercial or financial relationships that could be construed as a potential conflict of interest.
Generative AI statement
The author(s) declare that no Generative AI was used in the creation of this manuscript.
Any alternative text (alt text) provided alongside figures in this article has been generated by Frontiers with the support of artificial intelligence and reasonable efforts have been made to ensure accuracy, including review by the authors wherever possible. If you identify any issues, please contact us.
Publisher’s note
All claims expressed in this article are solely those of the authors and do not necessarily represent those of their affiliated organizations, or those of the publisher, the editors and the reviewers. Any product that may be evaluated in this article, or claim that may be made by its manufacturer, is not guaranteed or endorsed by the publisher.
Supplementary material
The Supplementary Material for this article can be found online at: https://www.frontiersin.org/articles/10.3389/fonc.2025.1702905/full#supplementary-material
Abbreviations
EGFR, epidermal growth factor receptor; NSCLC, non-small cell lung cancer; EGFR-TKI, epidermal growth factor receptor-tyrosine kinase inhibitor; 18F-FDG, 18F-fluorodeoxyglucose; PET, positron emission tomography; CT, computed tomography; PCS, PET/CT signature; AUC, area under the curve; VOI, volume of interest; ROC, receiver operating characteristic; SUV, standard uptake value; ICC, intraclass correlation coefficient; LOOCV, leave-one-out cross-validation; LASSO, least absolute shrinkage and selection operator.
References
1. Bray F, Laversanne M, Sung H, Ferlay J, Siegel RL, Soerjomataram I, et al. Global cancer statistics 2022: globocan estimates of incidence and mortality worldwide for 36 cancers in 185 countries. CA Cancer J Clin. (2024) 74:229–63. doi: 10.3322/caac.21834
2. Sung H, Ferlay J, Siegel RL, Laversanne M, Soerjomataram I, Jemal A, et al. Global cancer statistics 2020: globocan estimates of incidence and mortality worldwide for 36 cancers in 185 countries. CA Cancer J Clin. (2021) 71:209–49. doi: 10.3322/caac.21660
3. Mok TS, Wu YL, Thongprasert S, Yang CH, Chu DT, Saijo N, et al. Gefitinib or carboplatin-paclitaxel in pulmonary adenocarcinoma. N Engl J Med. (2009) 361:947–57. doi: 10.1056/NEJMoa0810699
4. Soria JC, Ohe Y, Vansteenkiste J, Reungwetwattana T, Chewaskulyong B, Lee KH, et al. Osimertinib in untreated egfr-mutated advanced non-small-cell lung cancer. N Engl J Med. (2018) 378:113–25. doi: 10.1056/NEJMoa1713137
5. Chen WM, Chen M, Hsu JG, Lee TS, Shia BC, and Wu SY. Use of preoperative fdg pet/ct and survival of patients with resectable non-small cell lung cancer. Radiology. (2022) 305:219–27. doi: 10.1148/radiol.212798
6. Lee SW and Kim SJ. Is delayed image of 18f-fdg pet/ct necessary for mediastinal lymph node staging in non-small cell lung cancer patients? Clin Nucl Med. (2022) 47:414–21. doi: 10.1097/rlu.0000000000004110
7. Hughes DJ, Subesinghe M, Taylor B, Bille A, Spicer J, Papa S, et al. (18)F fdg pet/ct and novel molecular imaging for directing immunotherapy in cancer. Radiology. (2022) 304:246–64. doi: 10.1148/radiol.212481
8. Mu W, Jiang L, Zhang J, Shi Y, Gray JE, Tunali I, et al. Non-invasive decision support for nsclc treatment using pet/ct radiomics. Nat Commun. (2020) 11:5228. doi: 10.1038/s41467-020-19116-x
9. Salehjahromi M, Karpinets TV, Sujit SJ, Qayati M, Chen P, Aminu M, et al. Synthetic pet from ct improves diagnosis and prognosis for lung cancer: proof of concept. Cell Rep Med. (2024) 5:101463. doi: 10.1016/j.xcrm.2024.101463
10. Wang S, Yu H, Gan Y, Wu Z, Li E, Li X, et al. Mining whole-lung information by artificial intelligence for predicting egfr genotype and targeted therapy response in lung cancer: A multicohort study. Lancet Digit Health. (2022) 4:e309–e19. doi: 10.1016/s2589-7500(22)00024-3
11. Rossi G, Barabino E, Fedeli A, Ficarra G, Coco S, Russo A, et al. Radiomic detection of egfr mutations in nsclc. Cancer Res. (2021) 81:724–31. doi: 10.1158/0008-5472.Can-20-0999
12. Hasegawa M, Sakai F, Ishikawa R, Kimura F, Ishida H, and Kobayashi K. Ct features of epidermal growth factor receptor-mutated adenocarcinoma of the lung: comparison with nonmutated adenocarcinoma. J Thorac Oncol. (2016) 11:819–26. doi: 10.1016/j.jtho.2016.02.010
13. Horvat N, Papanikolaou N, and Koh DM. Radiomics beyond the hype: A critical evaluation toward oncologic clinical use. Radiol Artif Intell. (2024) 6:e230437. doi: 10.1148/ryai.230437
14. Chen M, Copley SJ, Viola P, Lu H, and Aboagye EO. Radiomics and artificial intelligence for precision medicine in lung cancer treatment. Semin Cancer Biol. (2023) 93:97–113. doi: 10.1016/j.semcancer.2023.05.004
15. van Griethuysen JJM, Fedorov A, Parmar C, Hosny A, Aucoin N, Narayan V, et al. Computational radiomics system to decode the radiographic phenotype. Cancer Res. (2017) 77:e104–e7. doi: 10.1158/0008-5472.Can-17-0339
16. Friedman J, Hastie T, and Tibshirani R. Regularization paths for generalized linear models via coordinate descent. J Stat Softw. (2010) 33:1–22. doi: 10.18637/jss.v033.i01
17. Bastien P, Vinzi VE, and Tenenhaus M. Pls generalised linear regression. Comput Stat Data Anal. (2005) 48:17–46. doi: 10.1016/j.csda.2004.02.005
18. Kuhn M. Building predictive models in R using the caret package. J Stat Software. (2008) 28:1–26. doi: 10.18637/jss.v028.i05
19. Xu L, Raitoharju J, Iosifidis A, and Gabbouj M. Saliency-based multilabel linear discriminant analysis. IEEE Trans Cybern. (2022) 52:10200–13. doi: 10.1109/tcyb.2021.3069338
20. Hofner B, Mayr A, Robinzonov N, and Schmid M. Model-based boosting in R: A hands-on tutorial using the R package mboost. Comput Stat. (2014) 29:3–35. doi: 10.1007/s00180-012-0382-5
21. Tavernari D, Borgeaud M, Liu X, Parikh K, Le X, Ciriello G, et al. Decoding the clinical and molecular signatures of egfr common, compound, and uncommon mutations in nsclc: A brief report. J Thorac Oncol. (2025) 20:500–6. doi: 10.1016/j.jtho.2024.12.012
22. Ko KH, Hsu HH, Huang TW, Gao HW, Shen DH, Chang WC, et al. Value of 18F-fdg uptake on pet/ct and cea level to predict epidermal growth factor receptor mutations in pulmonary adenocarcinoma. Eur J Nucl Med Mol Imaging. (2014) 41:1889–97. doi: 10.1007/s00259-014-2802-y
23. Liu Y, Kim J, Qu F, Liu S, Wang H, Balagurunathan Y, et al. Ct features associated with epidermal growth factor receptor mutation status in patients with lung adenocarcinoma. Radiology. (2016) 280:271–80. doi: 10.1148/radiol.2016151455
24. Yip SS, Kim J, Coroller TP, Parmar C, Velazquez ER, Huynh E, et al. Associations between somatic mutations and metabolic imaging phenotypes in non-small cell lung cancer. J Nucl Med. (2017) 58:569–76. doi: 10.2967/jnumed.116.181826
25. Zhang J, Zhao X, Zhao Y, Zhang J, Zhang Z, Wang J, et al. Value of pre-therapy 18f-fdg pet/ct radiomics in predicting egfr mutation status in patients with non-small cell lung cancer. Eur J Nucl Med Mol Imaging. (2020) 47:1137–46. doi: 10.1007/s00259-019-04592-1
26. Gong L, Shu J, Chen X, Pan H, Chen G, Bi Y, et al. Deptor inhibits lung tumorigenesis by inactivating the egfr-mtor signals. Cancer Lett. (2021) 519:263–76. doi: 10.1016/j.canlet.2021.07.031
27. Yang R, Zhang G, Meng Z, Wang L, Li Y, Li H, et al. Gdh1-catalytic glutaminolysis feedback activate egfr/pi3k/akt pathway and reprogram glioblastoma metabolism. Neuro Oncol. (2024) 27(3):668–81. doi: 10.1093/neuonc/noae222
28. Alzahrani AS. Pi3k/akt/mtor inhibitors in cancer: at the bench and bedside. Semin Cancer Biol. (2019) 59:125–32. doi: 10.1016/j.semcancer.2019.07.009
29. Cretella D, Ravelli A, Fumarola C, La Monica S, Digiacomo G, Cavazzoni A, et al. The anti-tumor efficacy of cdk4/6 inhibition is enhanced by the combination with pi3k/akt/mtor inhibitors through impairment of glucose metabolism in tnbc cells. J Exp Clin Cancer Res. (2018) 37:72. doi: 10.1186/s13046-018-0741-3
30. Nilsson MB, Robichaux J, Herynk MH, Cascone T, Le X, Elamin Y, et al. Altered regulation of hif-1α in naive- and drug-resistant egfr-mutant nsclc: implications for a vascular endothelial growth factor-dependent phenotype. J Thorac Oncol. (2021) 16:439–51. doi: 10.1016/j.jtho.2020.11.022
31. Liu Z, Wang S, Dong D, Wei J, Fang C, Zhou X, et al. The applications of radiomics in precision diagnosis and treatment of oncology: opportunities and challenges. Theranostics. (2019) 9:1303–22. doi: 10.7150/thno.30309
32. Gillies RJ, Kinahan PE, and Hricak H. Radiomics: images are more than pictures, they are data. Radiology. (2016) 278:563–77. doi: 10.1148/radiol.2015151169
33. Shur JD, Doran SJ, Kumar S, Ap Dafydd D, Downey K, O'Connor JPB, et al. Radiomics in oncology: A practical guide. Radiographics. (2021) 41:1717–32. doi: 10.1148/rg.2021210037
34. Nguyen HS, Ho DKN, Nguyen NN, Tran HM, Tam KW, and Le NQK. Predicting egfr mutation status in non-small cell lung cancer using artificial intelligence: A systematic review and meta-analysis. Acad Radiol. (2024) 31:660–83. doi: 10.1016/j.acra.2023.03.040
35. Fuster-Matanzo A, Picó-Peris A, Bellvís-Bataller F, Jimenez-Pastor A, Weiss GJ, Martí-Bonmatí L, et al. Prediction of oncogene mutation status in non-small cell lung cancer: A systematic review and meta-analysis with a special focus on artificial intelligence-based methods. Eur Radiol. (2025). doi: 10.1007/s00330-025-11962-x
36. Chen J, Chen A, Yang S, Liu J, Xie C, and Jiang H. Accuracy of machine learning in preoperative identification of genetic mutation status in lung cancer: A systematic review and meta-analysis. Radiother Oncol. (2024) 196:110325. doi: 10.1016/j.radonc.2024.110325
37. Belani N, Liang K, Fradley M, Judd J, and Borghaei H. How to treat egfr-mutated non-small cell lung cancer. JACC CardioOncol. (2023) 5:542–5. doi: 10.1016/j.jaccao.2023.04.005
38. Schuster S. A new solution concept for the ultimatum game leading to the golden ratio. Sci Rep. (2017) 7:5642. doi: 10.1038/s41598-017-05122-5
39. Midha A, Dearden S, and McCormack R. Egfr mutation incidence in non-small-cell lung cancer of adenocarcinoma histology: A systematic review and global map by ethnicity (Mutmapii). Am J Cancer Res. (2015) 5:2892–911.
40. Shi Y, Au JS, Thongprasert S, Srinivasan S, Tsai CM, Khoa MT, et al. A prospective, molecular epidemiology study of egfr mutations in asian patients with advanced non-small-cell lung cancer of adenocarcinoma histology (Pioneer). J Thorac Oncol. (2014) 9:154–62. doi: 10.1097/jto.0000000000000033
41. de Bruin EC, McGranahan N, Mitter R, Salm M, Wedge DC, Yates L, et al. Spatial and temporal diversity in genomic instability processes defines lung cancer evolution. Science. (2014) 346:251–6. doi: 10.1126/science.1253462
42. Oh AS, Strand M, Pratte K, Regan EA, Humphries S, Crapo JD, et al. Visual emphysema at chest ct in gold stage 0 cigarette smokers predicts disease progression: results from the copdgene study. Radiology. (2020) 296:641–9. doi: 10.1148/radiol.2020192429
43. Yuxin Z, Xiaobo L, Changjun Z, Hao P, Zhonglong Z, Jun C, et al. A review of cancer data fusion methods based on deep learning. Inf Fusion. (2024) 108:102361. doi: 10.1016/j.inffus.2024.102361
44. Gadzicki K, Khamsehashari R, and Zetzsche C eds. (2020). Early Vs Late Fusion in Multimodal Convolutional Neural Networks, in: 2020 IEEE 23rd International Conference on Information Fusion (FUSION), Rustenburg, South Africa, 2020 pp. 1–6. doi: 10.23919/FUSION45008.2020.9190246
45. Mehri-kakavand G, Mdletshe S, Amini M, and Wang A. Multimodal radiomics fusion for predicting postoperative recurrence in nsclc patients. J Cancer Res Clin Oncol. (2025) 151:261. doi: 10.1007/s00432-025-06311-w
46. Wenlun W, Hui L, Zhouyi Z, Chenyang X, Dongmin W, Wenming L, et al. Comparing three-dimensional and two-dimensional deep-learning, radiomics, and fusion models for predicting occult lymph node metastasis in laryngeal squamous cell carcinoma based on ct imaging: A multicentre, retrospective, diagnostic study. eClinicalMedicine. (2024) 67:102385. doi: 10.1016/j.eclinm.2023.102385
47. Li W, Li Y, Wang L, Yang M, Iikubo M, Huang N, et al. Evaluating fusion models for predicting occult lymph node metastasis in tongue squamous cell carcinoma. Eur Radiol. (2025) 35:5228–38. doi: 10.1007/s00330-025-11473-9
48. Li Z, Qin Y, Liao X, Wang E, Cai R, Pan Y, et al. Comparison of clinical, radiomics, deep learning, and fusion models for predicting early recurrence in locally advanced rectal cancer based on multiparametric mri: A multicenter study. Eur J Radiol. (2025) 189:112173. doi: 10.1016/j.ejrad.2025.112173
49. Zhang W, Zhao X, Meng L, Lu L, Guo J, Cheng M, et al. A multicentre comparative analysis of radiomics, deep-learning, and fusion models for predicting postpartum hemorrhage. Acad Radiol. (2025) 32:5930–9. doi: 10.1016/j.acra.2025.05.068
50. Sun X, Xiao Z, Chen G, Han Z, Liu Y, Zhang C, et al. A pet imaging approach for determining egfr mutation status for improved lung cancer patient management. Sci Transl Med. (2018) 10(431). doi: 10.1126/scitranslmed.aan8840
Keywords: EGFR mutation, misclassification, non-small cell lung cancer, 18F-FDG PET/CT, radiomics
Citation: Li J, Zeng Z, Chen J, Fang T, Liu H and He Y (2025) Risk factors for misclassification in predicting EGFR mutation status using PET/CT imaging in non-small cell lung cancer patients. Front. Oncol. 15:1702905. doi: 10.3389/fonc.2025.1702905
Received: 10 September 2025; Accepted: 14 November 2025; Revised: 04 November 2025;
Published: 03 December 2025.
Edited by:
Sunyi Zheng, Tianjin Medical University Cancer Institute and Hospital, ChinaReviewed by:
Xiaonan Shao, Third Affiliated Hospital of Soochow University, ChinaAlmudena Fuster, Quibim, Spain
Copyright © 2025 Li, Zeng, Chen, Fang, Liu and He. This is an open-access article distributed under the terms of the Creative Commons Attribution License (CC BY). The use, distribution or reproduction in other forums is permitted, provided the original author(s) and the copyright owner(s) are credited and that the original publication in this journal is cited, in accordance with accepted academic practice. No use, distribution or reproduction is permitted which does not comply with these terms.
*Correspondence: Yong He, aGV5b25nQHdodS5lZHUuY24=
†These authors have contributed equally to this work