 Gaolei Ma1†
 Lijie Ma
 Yuan Zhang
 Zhiyuan Yao
- 1Department of radiotherapy, Xuzhou First People’s Hospital, Xuzhou, Jiangsu, China
- 2Department of Pulmonary and Critical Care Medicine, Affiliated Hospital of Xuzhou Medical University, Xuzhou, Jiangsu, China
- 3First school of Clinical Medical, Gansu University of Chinese Medicine, Lanzhou, Gansu, China
- 4Department of Oncology, Affiliated Hospital of Xuzhou Medical University, Xuzhou, Jiangsu, China
Background: Lung cancer remains the leading cause of cancer incidence and mortality worldwide. Non-small cell lung cancer (NSCLC) accounts for approximately 80%–85% of cases, and the majority of patients are diagnosed at an advanced stage with poor prognosis. Immune checkpoint inhibitors (ICIs) combined with chemotherapy have become the standard first-line treatment for advanced NSCLC, significantly improving survival outcomes. However, considerable inter-individual variability in treatment response persists, underscoring the urgent need for novel predictive biomarkers. Systemic inflammation and immune status are closely associated with immunotherapy efficacy. Lymphocytes play a critical role as effector cells in antitumor immunity, while high-density lipoprotein (HDL), beyond its role in lipid metabolism, also exerts anti-inflammatory and immunomodulatory functions. The lymphocyte-to-HDL ratio (LHR), a composite indicator integrating immune and metabolic status, has demonstrated prognostic value in several malignancies. Nevertheless, its predictive significance in advanced NSCLC patients receiving chemo-immunotherapy remains unclear. This study aims to evaluate the prognostic value of LHR for long-term outcomes in this population, thereby providing insights for individualized treatment strategies.
Aim: To investigate the predictive value of the lymphocyte-to-high-density lipoprotein ratio (LHR) for long-term outcomes in patients with advanced non-small cell lung cancer (NSCLC) receiving chemo-immunotherapy, and to evaluate its potential as a convenient and cost-effective biomarker for guiding individualized clinical treatment.
Methods: This single-center retrospective study included 287 patients with advanced non-small cell lung cancer (NSCLC) who received first-line treatment with immune checkpoint inhibitors (ICIs) combined with platinum-based chemotherapy. Pretreatment lymphocyte-to-high-density lipoprotein ratio (LHR) levels were calculated, and the optimal cutoff value was determined using receiver operating characteristic (ROC) curve analysis. Univariate and multivariate Cox proportional hazards regression analyses were performed to identify independent prognostic factors associated with progression-free survival (PFS) and overall survival (OS). Based on these factors, a nomogram prediction model was developed. Variable selection was guided by clinical relevance, routine applicability, and data availability. Model performance was evaluated using the concordance index (C-index), area under the ROC curve (AUC), and calibration plots.
Results: Based on the optimal cutoff value determined by ROC curve analysis, 287 patients with advanced NSCLC were stratified into a low LHR group (<35.3) and a high LHR group (≥35.3). The median progression-free survival (PFS) was significantly longer in the low LHR group compared with the high LHR group (17.00 [14.00–22.00] vs. 11.80 [9.80–14.50] months; p = 0.028). Similarly, the median overall survival (OS) was 24.00 (21.00–29.00) months in the low LHR group and 18.00 (16.00–20.00) months in the high LHR group (p < 0.001). The objective response rate (ORR) and disease control rate (DCR) were also higher in the low LHR group than in the high LHR group (ORR: 48.92% vs. 35.81%, p = 0.025; DCR: 87.77% vs. 78.38%, p = 0.035). Multivariate Cox regression analysis identified LHR, PD-L1 expression, distant metastasis, and carcinoembryonic antigen (CEA) as independent prognostic factors for both PFS and OS (all p < 0.05). A nomogram prediction model for PFS and OS was subsequently developed based on these factors. In the training cohort, the C-index of the PFS model was 0.73 (95% CI: 0.69–0.78), with an internal validation C-index of 0.78 (95% CI: 0.71–0.85), indicating good discriminative ability. The AUCs for 6- and 12-month PFS prediction were 0.82 (95% CI: 0.76–0.89) and 0.86 (95% CI: 0.75–0.96) in the training cohort, and 0.87 (95% CI: 0.80–0.93) and 0.89 (95% CI: 0.81–0.97) in the validation cohort, respectively. For OS prediction, the C-index values were 0.80 (95% CI: 0.76–0.84) in the training cohort and 0.82 (95% CI: 0.77–0.86) in the validation cohort. The model demonstrated high accuracy in predicting OS at 12, 18, and 24 months: training cohort AUCs of 0.81 (95% CI: 0.74–0.89), 0.85 (95% CI: 0.74–0.91), and 0.94 (95% CI: 0.90–0.98), and validation cohort AUCs of 0.89 (95% CI: 0.80–0.98), 0.88 (95% CI: 0.80–0.96), and 0.82 (95% CI: 0.71–0.93), respectively. Calibration plots showed strong agreement between predicted and observed outcomes, confirming the model’s robustness and clinical applicability.
Conclusion: This study demonstrated that the lymphocyte-to-high-density lipoprotein ratio (LHR) is an independent predictor of long-term outcomes in patients with advanced NSCLC receiving chemo-immunotherapy. A low LHR was associated with improved progression-free survival, overall survival, and higher objective response and disease control rates. The nomogram model incorporating LHR showed favorable predictive accuracy and clinical applicability.
Introduction
Lung cancer is the leading cause of cancer-related morbidity and mortality worldwide, with non-small cell lung cancer (NSCLC) accounting for approximately 80%–85% of all cases (1). Most patients are diagnosed at an advanced stage, which is associated with limited treatment efficacy and poor prognosis (2). Although chemotherapy has long been the standard treatment for advanced NSCLC, its survival benefit is modest and frequently accompanied by substantial toxicity (3), underscoring the need for more effective therapeutic strategies.
The advent of immune checkpoint inhibitors (ICIs) has significantly improved survival outcomes in a subset of patients with advanced NSCLC (4). Nevertheless, considerable heterogeneity exists in treatment response, and reliable predictive tools to identify patients who would benefit most remain lacking (5). Currently, ICI-based chemo-immunotherapy regimens, such as pembrolizumab in combination with platinum-based chemotherapy, are established as the first-line standard of care, with proven survival benefits in large-scale clinical trials (6, 7). However, not all patients experience durable responses, and some develop resistance or disease progression during treatment. Identifying simple and cost-effective biomarkers to predict treatment efficacy is therefore an unmet clinical need.
Traditional biomarkers, including PD-L1 expression and tumor mutational burden (TMB), are widely used but are limited by factors such as sample heterogeneity, high cost, and inconsistent predictive reliability (8). Recently, immune-nutritional inflammatory biomarkers such as the neutrophil-to-lymphocyte ratio (NLR) and platelet-to-lymphocyte ratio (PLR) have gained attention for their prognostic value in cancer. However, these markers primarily reflect immune status and do not account for metabolic factors. Increasing evidence indicates that tumor progression is not only determined by intrinsic tumor biology but also by host-related factors, including systemic immune and metabolic status (9, 10). In this context, inflammation plays a pivotal role in antitumor immunity (11). Lymphocytes serve as crucial effector cells of the immune response (12), whereas high-density lipoprotein cholesterol (HDL-C), beyond its role in lipid metabolism, also exerts anti-inflammatory and immunomodulatory functions (13, 14).
The lymphocyte-to-HDL-C ratio (LHR) integrates immune function and metabolic status into a single biomarker and has demonstrated prognostic value in several malignancies, including gastric cancer, hepatocellular carcinoma, and colorectal cancer (15, 16). However, its predictive role in advanced NSCLC patients receiving chemo-immunotherapy remains largely unexplored.
Therefore, this study aimed to evaluate the prognostic significance of LHR in advanced NSCLC patients treated with chemo-immunotherapy, and to develop a nomogram model based on LHR and other prognostic factors. Our findings may provide a simple, cost-effective, and clinically applicable tool to guide individualized treatment and improve patient outcomes.
Materials and methods
Study design and patients
This single-center retrospective cohort study included patients with advanced non-small cell lung cancer (NSCLC) who were treated at the Affiliated Hospital of Xuzhou Medical University between January 2022 and December 2024. All patients received first-line therapy with pembrolizumab in combination with chemotherapy.
The inclusion criteria were as follows: (1) age >18 years; (2) pathologically confirmed NSCLC; (3) clinical stage III (unresectable) or stage IV disease at initial diagnosis; (4) receipt of at least two cycles of PD-1 inhibitor combined with chemotherapy; and (5) availability of complete medical records, including blood counts, inflammatory biomarkers, and imaging data during immunotherapy.
Exclusion criteria included: (1) concomitant allergic disorders, hematologic diseases, autoimmune diseases, or immunosuppressive conditions during treatment; (2) Eastern Cooperative Oncology Group performance status (ECOG PS) ≥2; (3) history of fever or infection within 1 month prior to treatment; (4) systemic corticosteroid therapy within 1 month prior to treatment; and (5) presence of known driver mutations, including EGFR, ALK, ROS1, or RET alterations.
A total of 287 patients meeting the above criteria were enrolled in this study. Ethical approval was obtained from the Ethics Committee of the Affiliated Hospital of Xuzhou Medical University (approval No. XYFY2024-KL097-01). As this was a retrospective study, the requirement for informed consent was waived by the committee.
Definition of LHR
The lymphocyte-to-high-density lipoprotein cholesterol ratio (LHR) was calculated as follows: LHR = lymphocyte count (cells/μL)/HDL-C level (mmol/L).
Fasting peripheral venous blood samples were collected from all patients within one week before treatment initiation. Lymphocyte counts were obtained using a routine hematology analyzer, with all samples processed under standard operating procedures to ensure accuracy. Serum HDL-C concentrations were measured using the conventional bromination method on a Beckman Coulter AU5800 biochemical analyzer, following internationally standardized protocols.
The optimal cutoff value of LHR was determined using receiver operating characteristic (ROC) curve analysis, with overall survival (OS) as the endpoint. The area under the curve (AUC) was 0.74 (95% CI: 0.68–0.80). By maximizing the product of sensitivity (78%) and specificity (66%), the optimal cutoff value of LHR was identified as 35.3.
Data collection
Data were collected from the hospital electronic medical record system and included clinical characteristics such as age, sex, smoking history, body mass index (BMI), and Eastern Cooperative Oncology Group performance status (ECOG PS). Peripheral blood samples were obtained within one week prior to initiation of antitumor therapy for biomarker assessment, including lymphocyte-to-high-density lipoprotein cholesterol ratio (LHR), carcinoembryonic antigen (CEA), carbohydrate antigen 125 (CA125), and squamous cell carcinoma antigen (SCC). LHR was calculated as the ratio of lymphocyte count to HDL-C level. Additional tumor-related variables included pathological subtype, programmed death-ligand 1 (PD-L1) expression, and the presence of distant metastasis.
Treatment regimen
All patients received standard first-line therapy consisting of pembrolizumab (200 mg, intravenous infusion) combined with platinum-based chemotherapy, administered every 3 weeks. Based on clinical response, the dosing interval for pembrolizumab could be adjusted to every 6 weeks, and treatment was continued until disease progression or unacceptable toxicity occurred.
For patients with adenocarcinoma, cisplatin (75 mg/m²) or carboplatin (AUC 5) was administered in combination with pemetrexed (500 mg/m²) for 4–6 cycles. For patients with squamous cell carcinoma, carboplatin (AUC 6) was administered with either paclitaxel (200 mg/m²) or nab-paclitaxel (100 mg/m²) for 4 cycles. Following 4–6 cycles of induction therapy, patients received pembrolizumab monotherapy as maintenance treatment every 3 weeks, continued until disease progression or the occurrence of intolerable adverse events.
All patients received standard supportive care during treatment, including anti-infective therapy, antiemetic prophylaxis, and supportive transfusion when necessary, to ensure treatment tolerability.
Evaluation
Treatment efficacy was assessed from the initiation of first-line chemo-immunotherapy, according to the Response Evaluation Criteria in Solid Tumors (RECIST, version 1.1). Tumor response was evaluated by computed tomography (CT) every 8–12 weeks until disease progression or death. Treatment responses were classified as complete response (CR), partial response (PR), stable disease (SD), or progressive disease (PD). To ensure accuracy and consistency of imaging evaluation, all CT scans were independently reviewed by two radiologists with more than three years of experience in oncologic imaging. In cases of disagreement, a third senior radiologist reviewed the scans, and consensus was reached.
Progression-free survival (PFS) was defined as the time from treatment initiation to disease progression or death from any cause. Overall survival (OS) was defined as the time from treatment initiation to death from any cause. Follow-up was conducted through electronic medical records and telephone contact. The last follow-up was performed in December 2024, and the median follow-up duration was 16 months.
Statistical analysis
All statistical analyses were performed using R software (version 4.5.1). Two-sided tests were applied, and a p-value <0.05 was considered statistically significant. Continuous variables were expressed as median with interquartile range (IQR) after non-normal distribution was confirmed by the Shapiro–Wilk test, and group comparisons were performed using the Mann–Whitney U test. Categorical variables were summarized as frequencies and percentages, and differences between groups were assessed using the χ² test or Fisher’s exact test as appropriate. Variance inflation factor (VIF) was calculated to assess multicollinearity among the variables included in the multivariate model. A VIF value <10 was considered acceptable, and no significant multicollinearity was found between LHR and its individual components (lymphocytes and HDL-C).
Receiver operating characteristic (ROC) curve analysis was conducted to evaluate the predictive value of LHR, with the area under the curve (AUC) calculated to assess diagnostic performance. The optimal cutoff value for LHR was determined by maximizing sensitivity and specificity, and was used to stratify patients for survival analysis. Progression-free survival (PFS) and overall survival (OS) were estimated using the Kaplan–Meier method, and survival differences between groups were compared with the log-rank test.
Univariate and multivariate Cox proportional hazards regression analyses were performed to identify independent prognostic factors for PFS and OS. Variables with p <0.05 in univariate analysis were included in the multivariate model. A nomogram was constructed based on significant prognostic factors, and model discrimination was assessed using Harrell’s concordance index (C-index). The predictive accuracy at different time points was evaluated by calculating time-dependent AUCs from ROC curves. Internal validation was conducted using bootstrap resampling with 1,000 iterations, and calibration plots were generated to assess the agreement between predicted and observed outcomes.
Results
Patient characteristics
This study retrospectively analyzed 287 patients with advanced NSCLC who received first-line chemo-immunotherapy at the Affiliated Hospital of Xuzhou Medical University between January 2022 and December 2024. Based on the optimal cutoff value of LHR determined by ROC curve analysis (Figure 1), patients were divided into two groups: a low LHR group (LHR < 35.3; n = 139) and a high LHR group (LHR ≥ 35.3; n = 148).
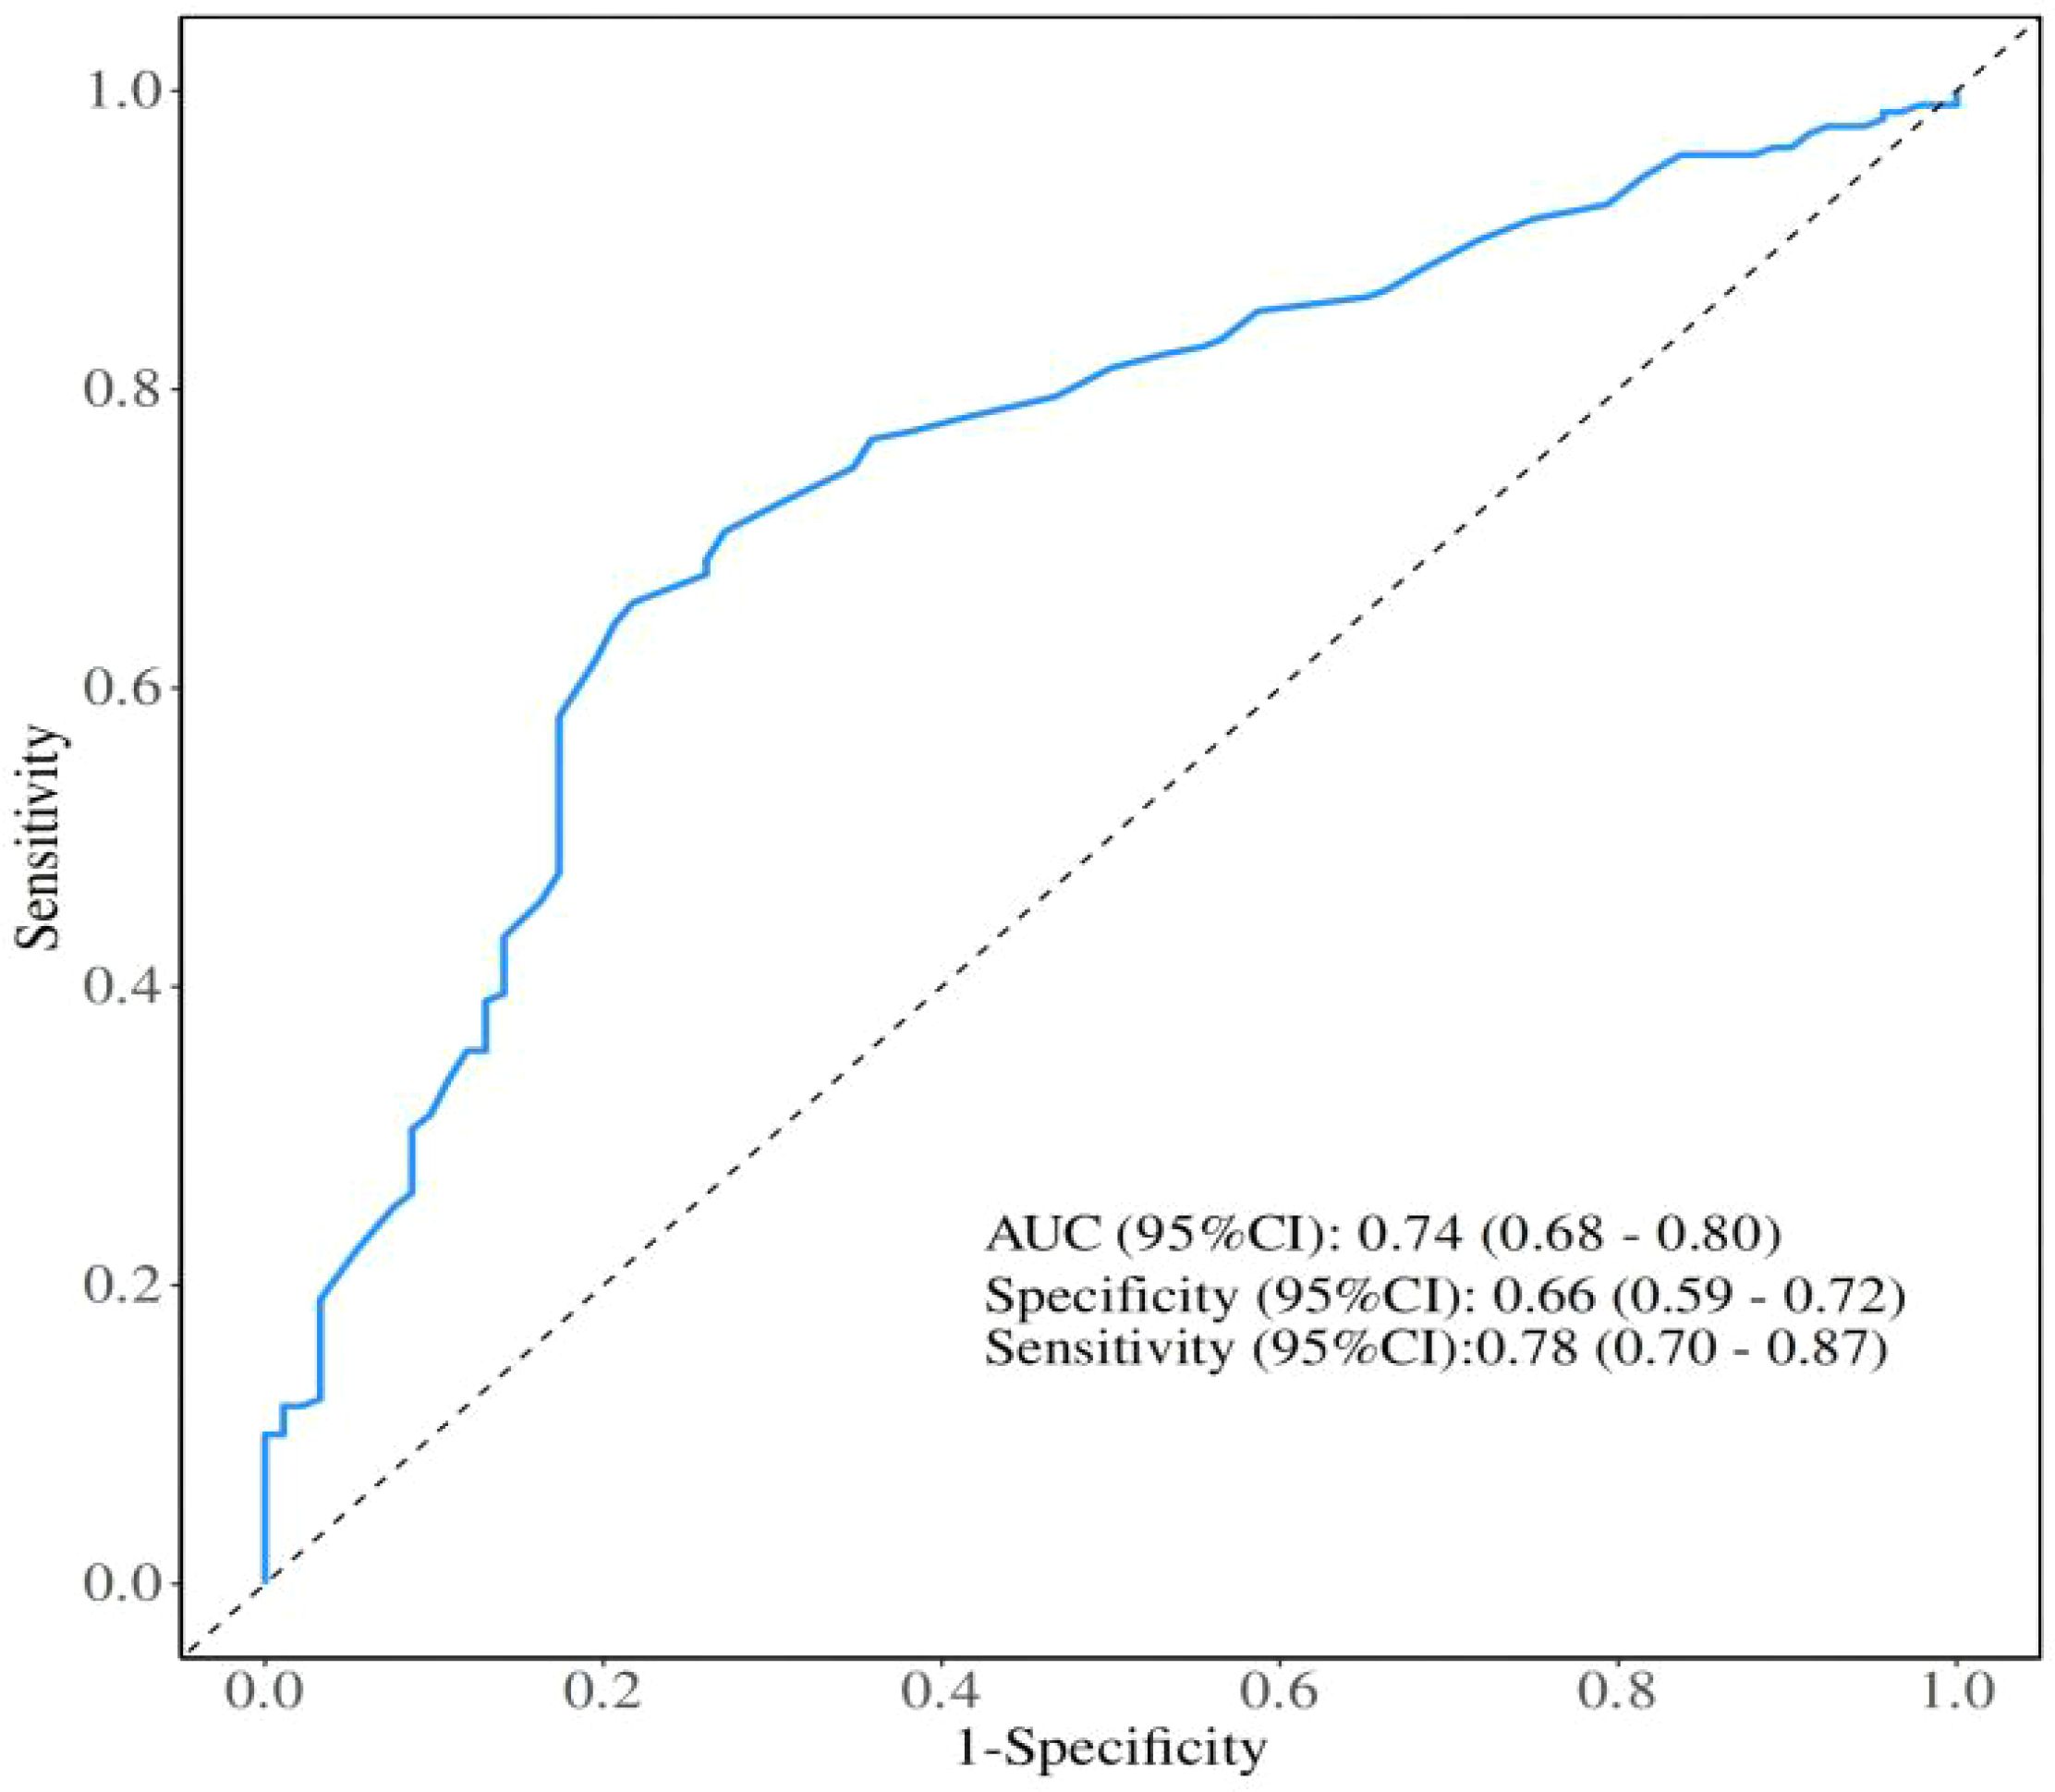
Figure 1. Receiver operating characteristics curve analysis based on Lymphocyte-to-High-Density Lipoprotein Ratio for overall survival. AUC, Area under the curve; CI, Confidence interval.
Baseline clinical and tumor characteristics of the study population are summarized in Table 1, including sex, age, history of hypertension and diabetes, pathological subtype, PD-L1 expression status, and presence of distant metastasis. Hematological parameters included lymphocyte count, HDL-C level, LHR, carcinoembryonic antigen (CEA), and squamous cell carcinoma antigen (SCCA). Significant differences were observed between the two groups in lymphocyte count, HDL-C level, and LHR (all p < 0.001), while no significant differences were noted for other clinical or tumor-related characteristics.
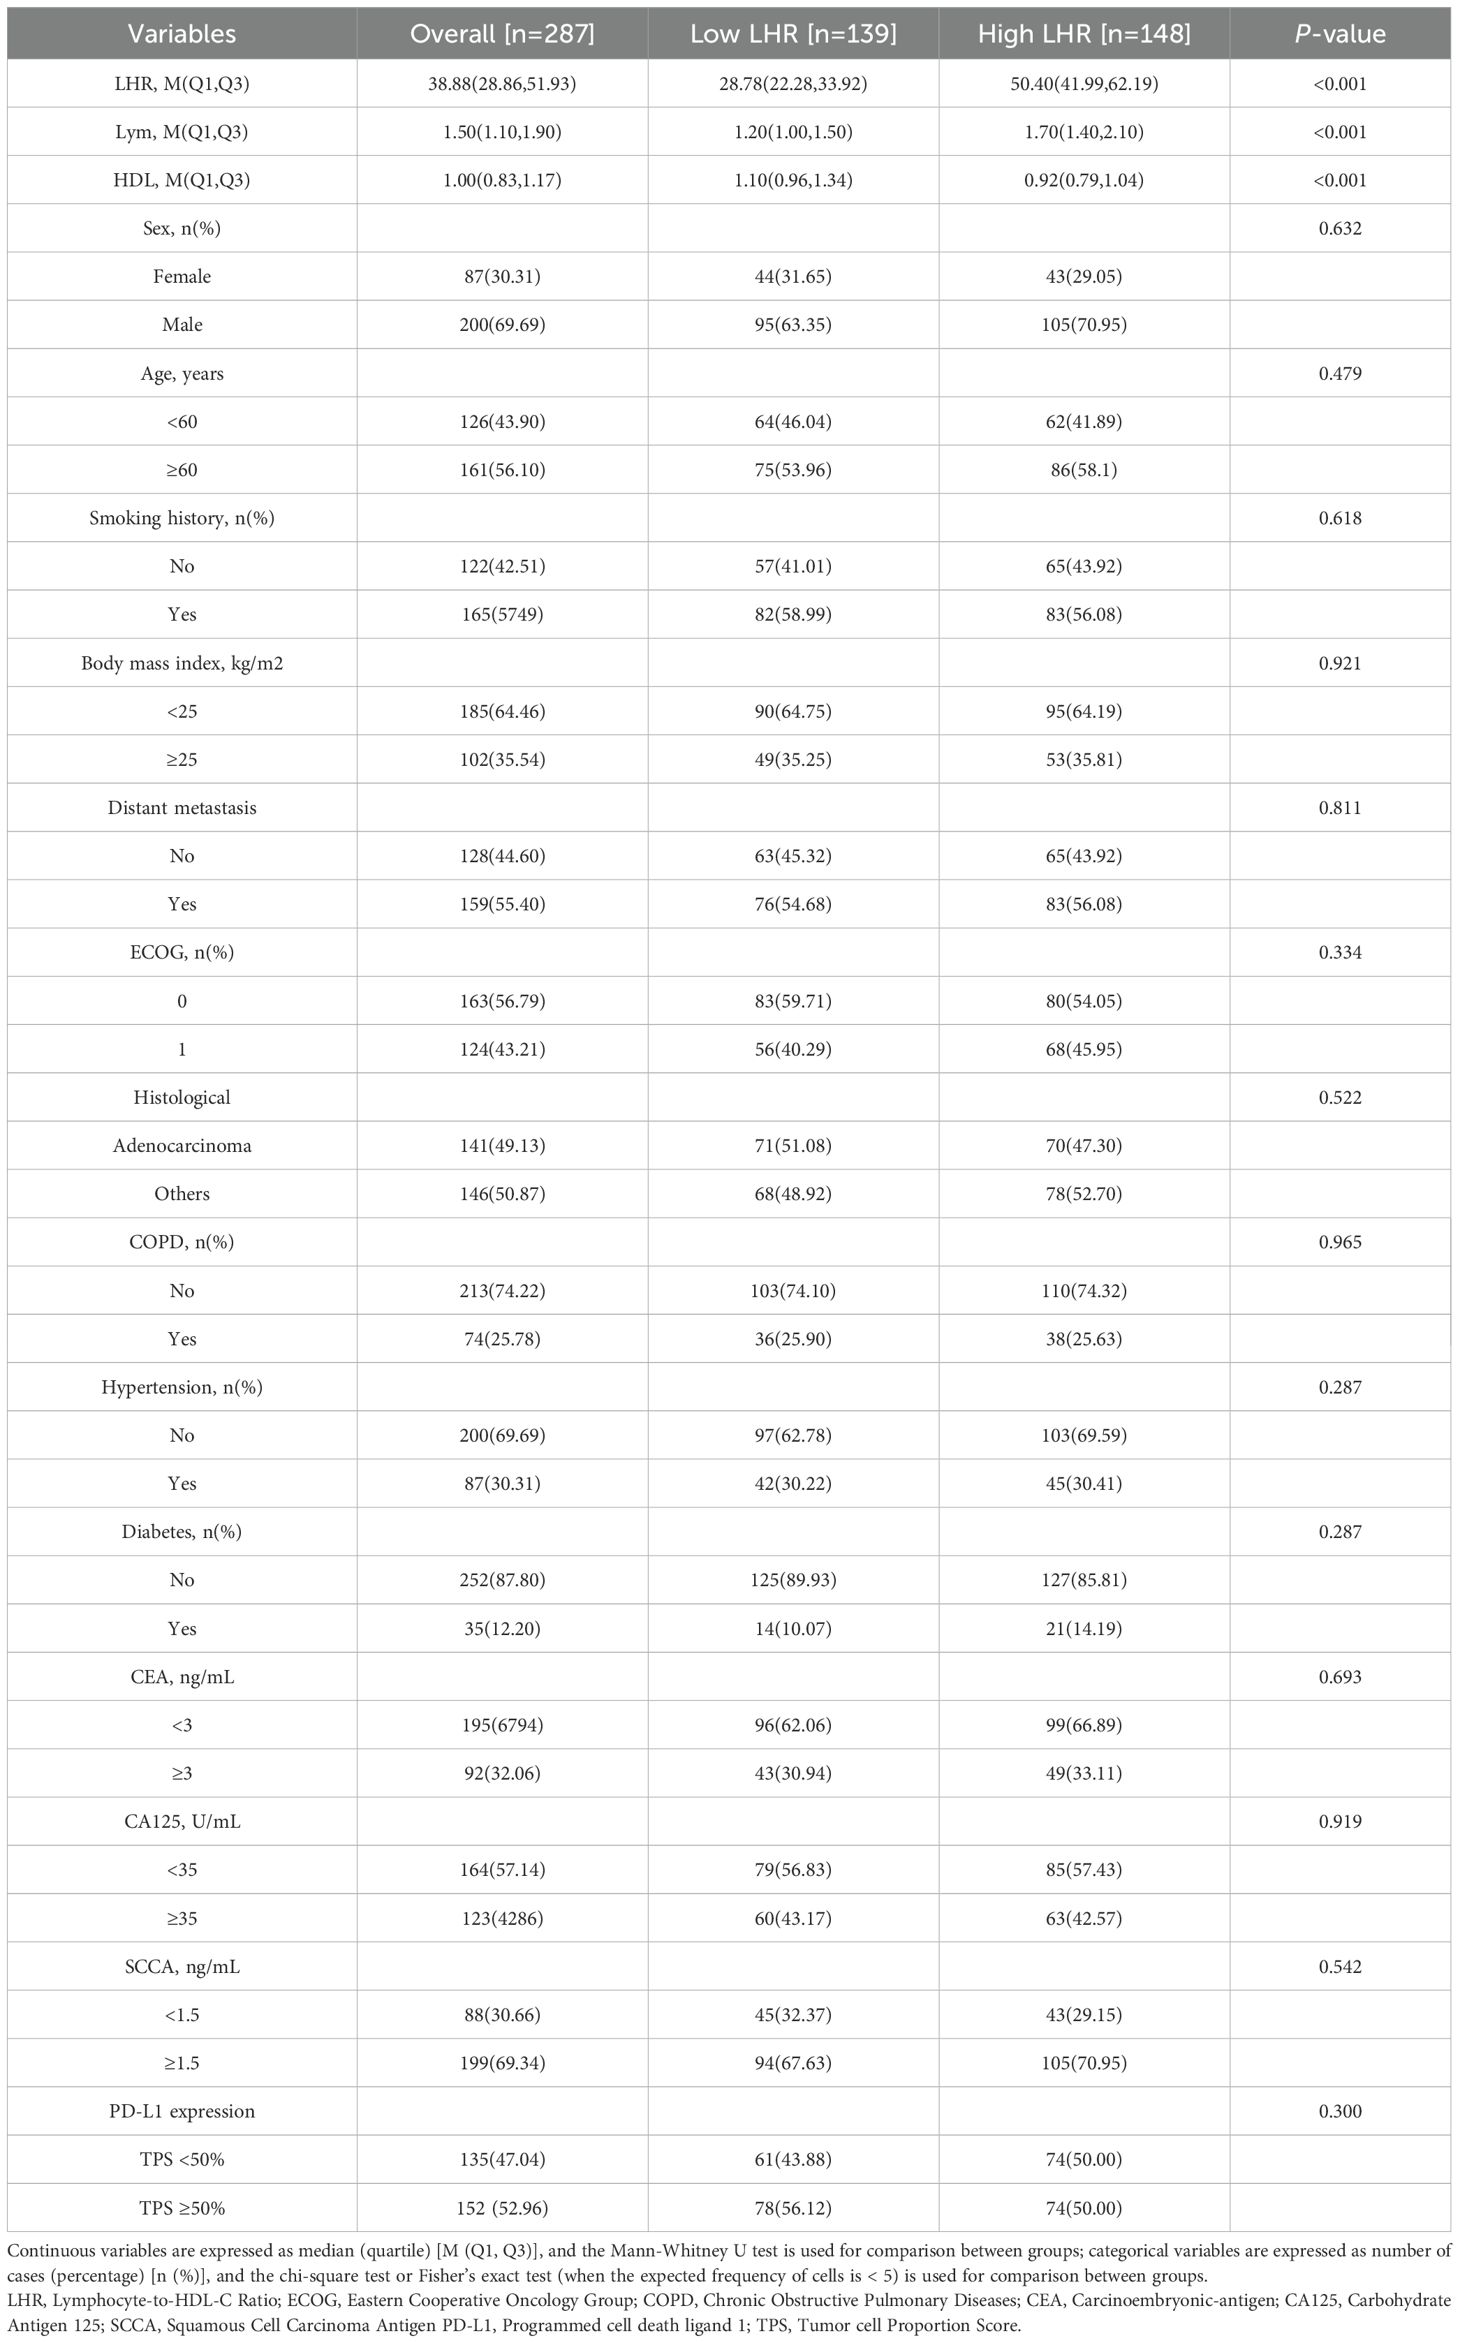
Table 1. Baseline characteristics of Lymphocyte-to-HDL-C Ratio < 35.3 and Lymphocyte-to-HDL-C Ratio ≥ 35.3, n (%).
Tumor response
Among the 287 patients with advanced NSCLC who received first-line chemo-immunotherapy, no complete responses (CR) were observed. In the low LHR group, 68 patients (48.92%) achieved partial response (PR), compared with 53 patients (35.81%) in the high LHR group. Stable disease (SD) was observed in 55 patients (39.57%) in the low LHR group and 63 patients (42.57%) in the high LHR group. In addition, progressive disease (PD) occurred in 16 patients (11.51%) in the low LHR group and 32 patients (21.62%) in the high LHR group.
The objective response rate (ORR) was significantly higher in the low LHR group compared with the high LHR group (48.92% vs. 35.81%; p = 0.025). Similarly, the disease control rate (DCR) was also superior in the low LHR group (87.77% vs. 78.38%; p = 0.035) (Table 2).
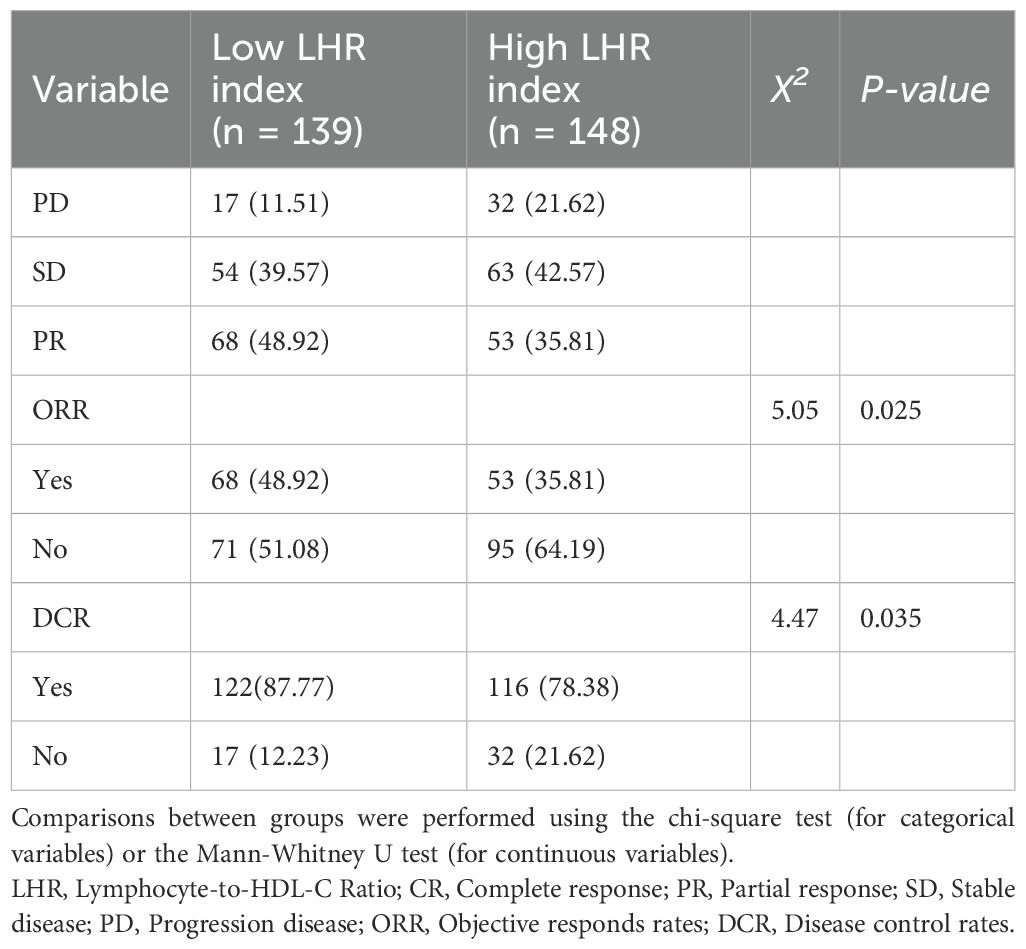
Table 2. Tumor responses of Lymphocyte-to-HDL-C Ratio < 35.3 and Lymphocyte-to-HDL-C Ratio ≥ 35.3, n (%).
Progression-free survival and overall survival
Kaplan–Meier survival analysis demonstrated that patients in the low LHR group had significantly better PFS and OS compared with those in the high LHR group. The median PFS was 17.00 months (95% CI: 14.00–22.00) in the low LHR group versus 11.80 months (95% CI: 9.80–14.50) in the high LHR group (p = 0.028) (Figure 2A). Similarly, the median OS was 24.00 months (95% CI: 21.00–29.00) in the low LHR group compared with 18.00 months (95% CI: 16.00–20.00) in the high LHR group (p < 0.001) (Figure 2B).
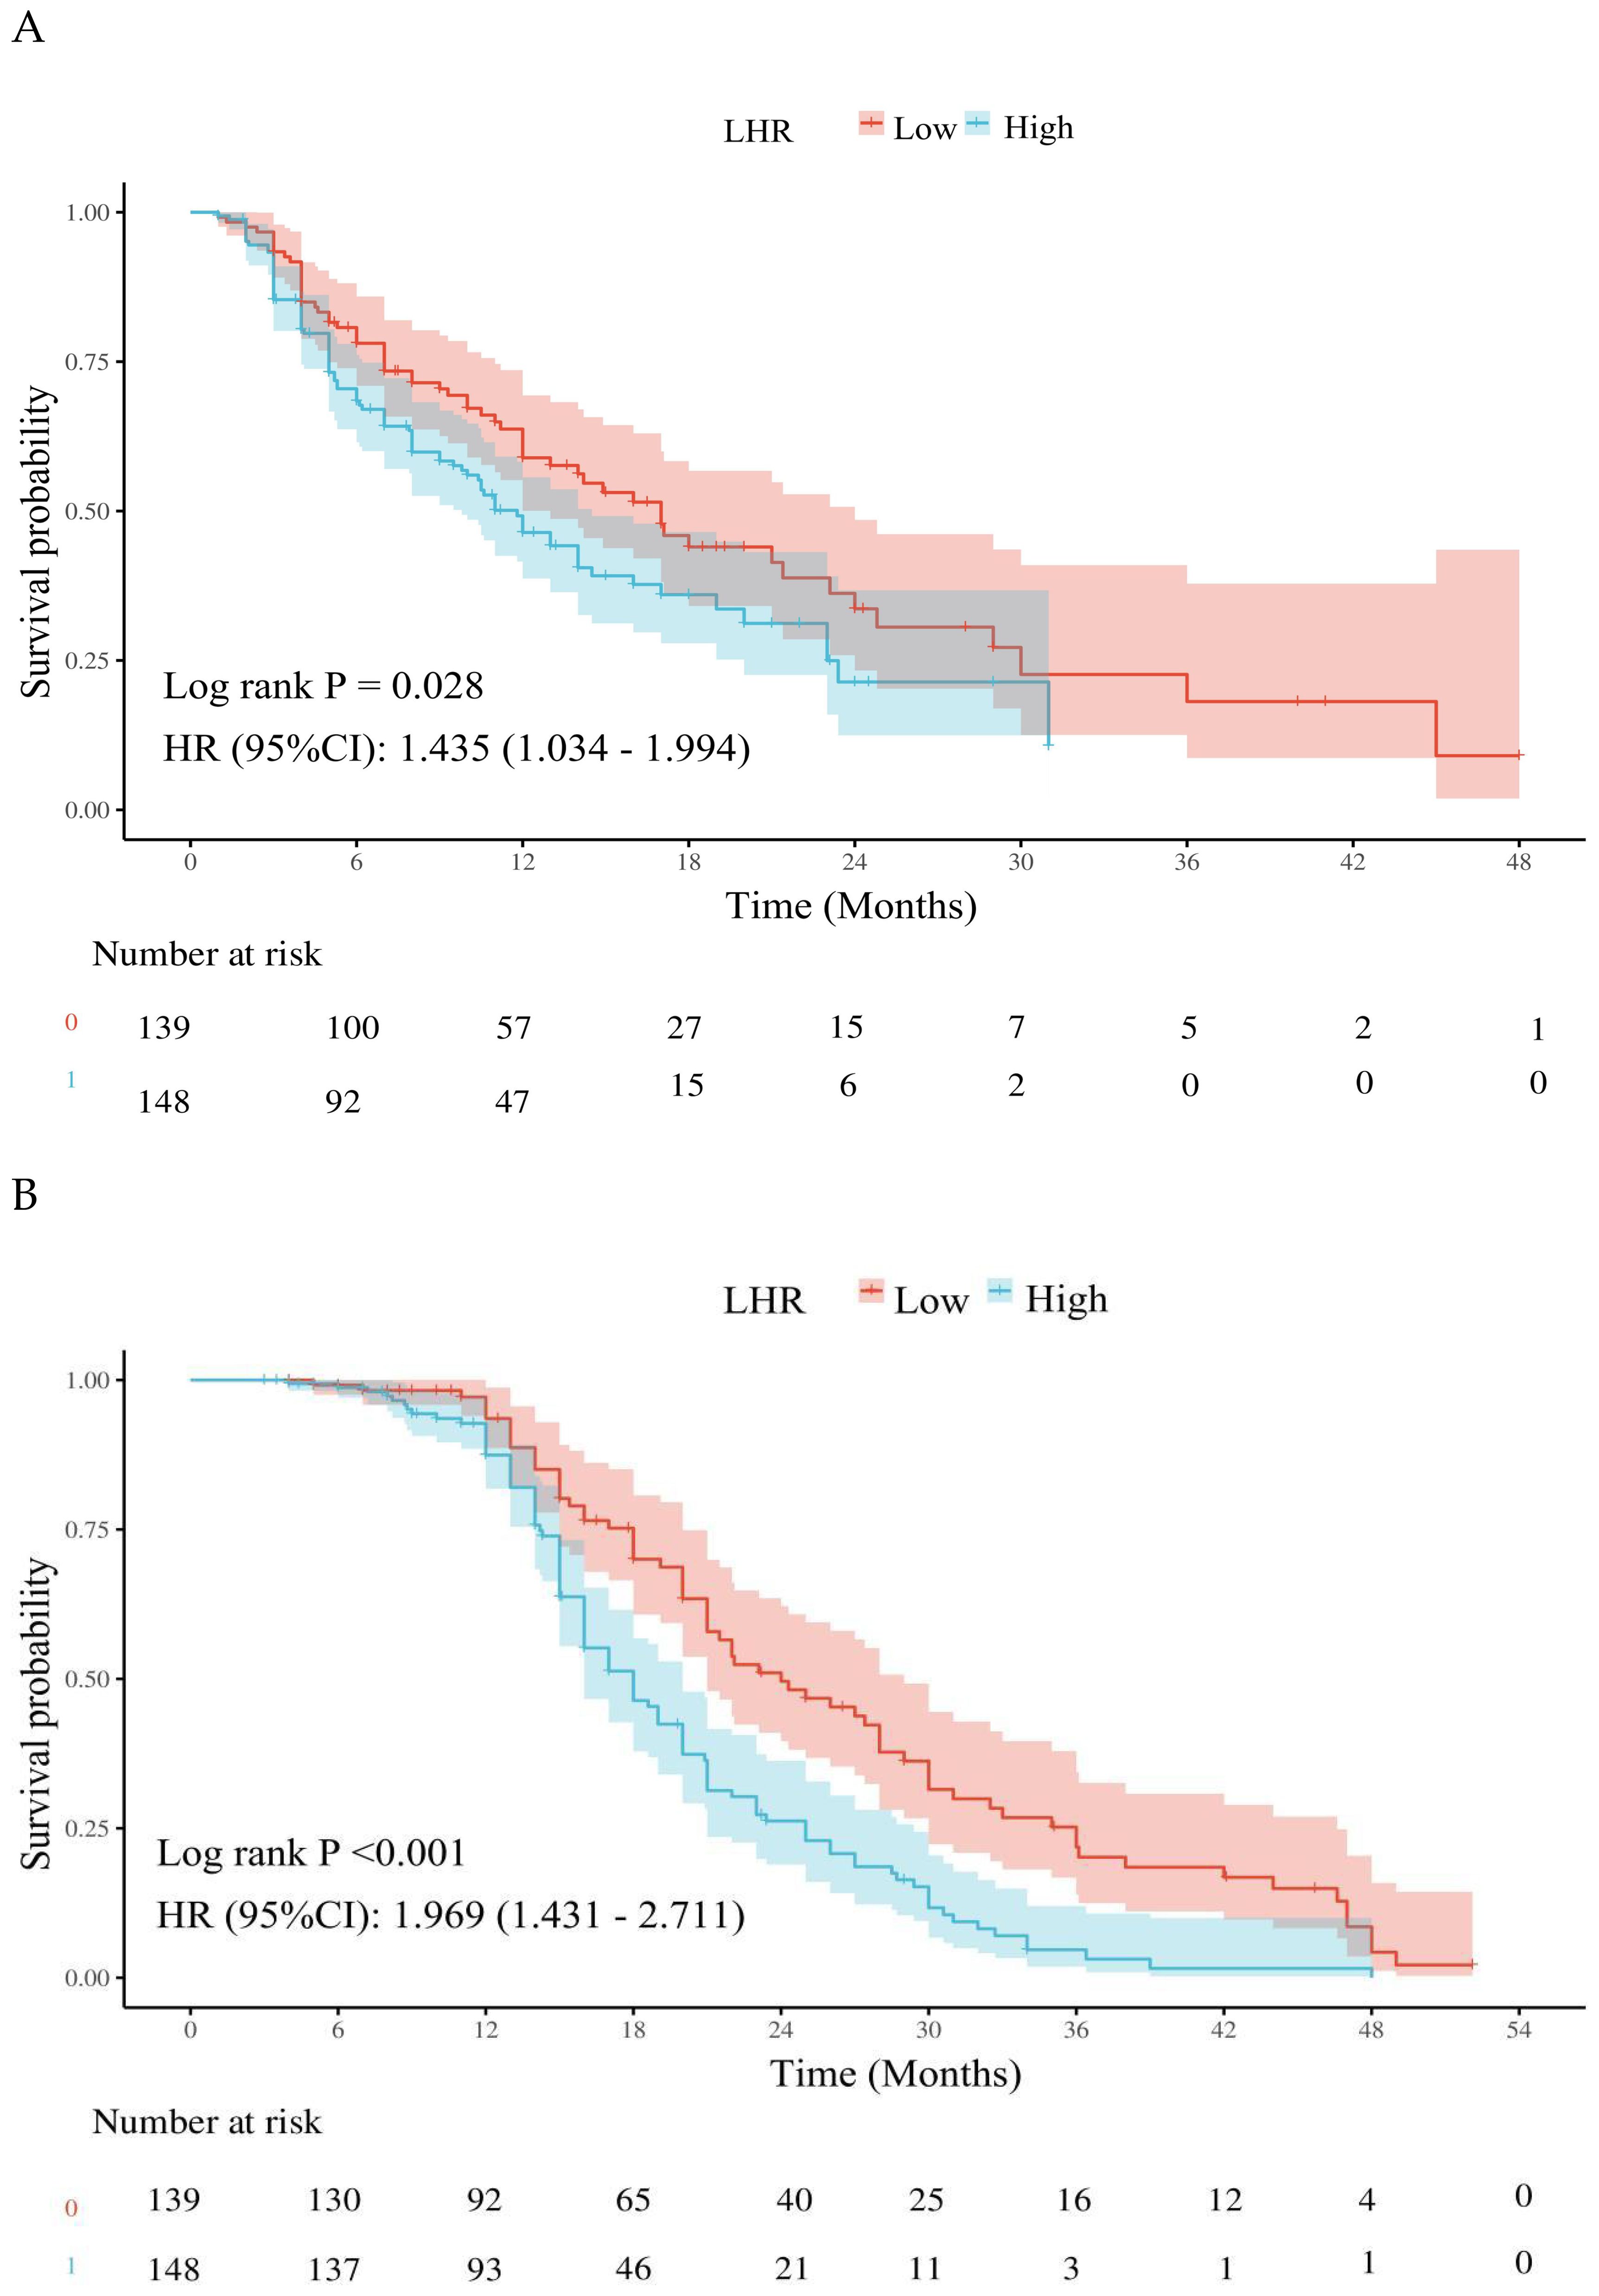
Figure 2. Effects of different lymphocyte-to-high-density lipoprotein ratio on the long-term prognosis of advanced non-Small cell lung cancer patients. (A) Kaplan-Meier plot of the LHR < 35.3 and LHR ≥ 35.3 groups; (B) Kaplan-Meier plot of overall survival in the LHR < 35.3 and LHR ≥ 35.3 groups. LHR, lymphocyte-to-high-density lipoprotein ratio; HR, Hazard ratio; CI, Confidence interval.
Cox regression analysis for PFS
To further evaluate the impact of clinical variables on PFS, univariate and multivariate Cox proportional hazards regression analyses were performed (Table 3). In univariate analysis, LHR, distant metastasis, carcinoembryonic antigen (CEA) level, and PD-L1 expression were significantly associated with PFS (all p < 0.05). Variables with p < 0.05 in the univariate analysis (LHR, distant metastasis, CEA, PD-L1 expression) were included in the multivariate Cox regression.
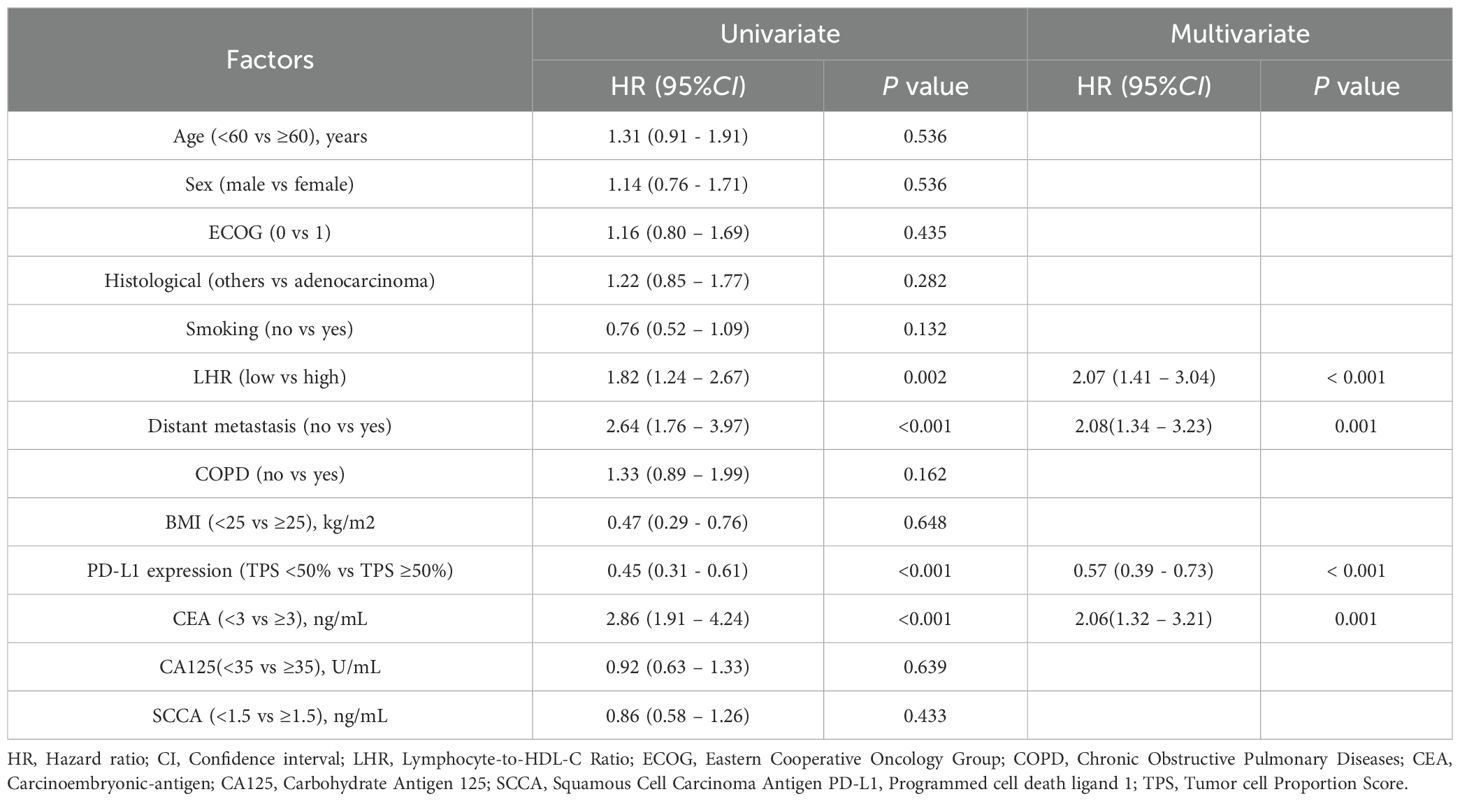
Table 3. Univariate and multivariate analyses of prognostic factors for progression-free survival.
Multivariate analysis identified high LHR (HR = 2.07, 95% CI: 1.41–3.04, p < 0.001), presence of distant metastasis (HR = 2.08, 95% CI: 1.34–3.23, p = 0.001), and elevated CEA level (HR = 2.06, 95% CI: 1.32–3.21, p = 0.001) as independent adverse prognostic factors for PFS. In contrast, high PD-L1 expression was significantly associated with longer PFS (HR = 0.57, 95% CI: 0.39–0.86, p = 0.006).
Cox regression analysis for OS
In the Cox regression analysis for OS (Table 4), univariate analysis demonstrated that LHR, distant metastasis, carcinoembryonic antigen (CEA) level, and PD-L1 expression were all significantly associated with OS (all p < 0.05).
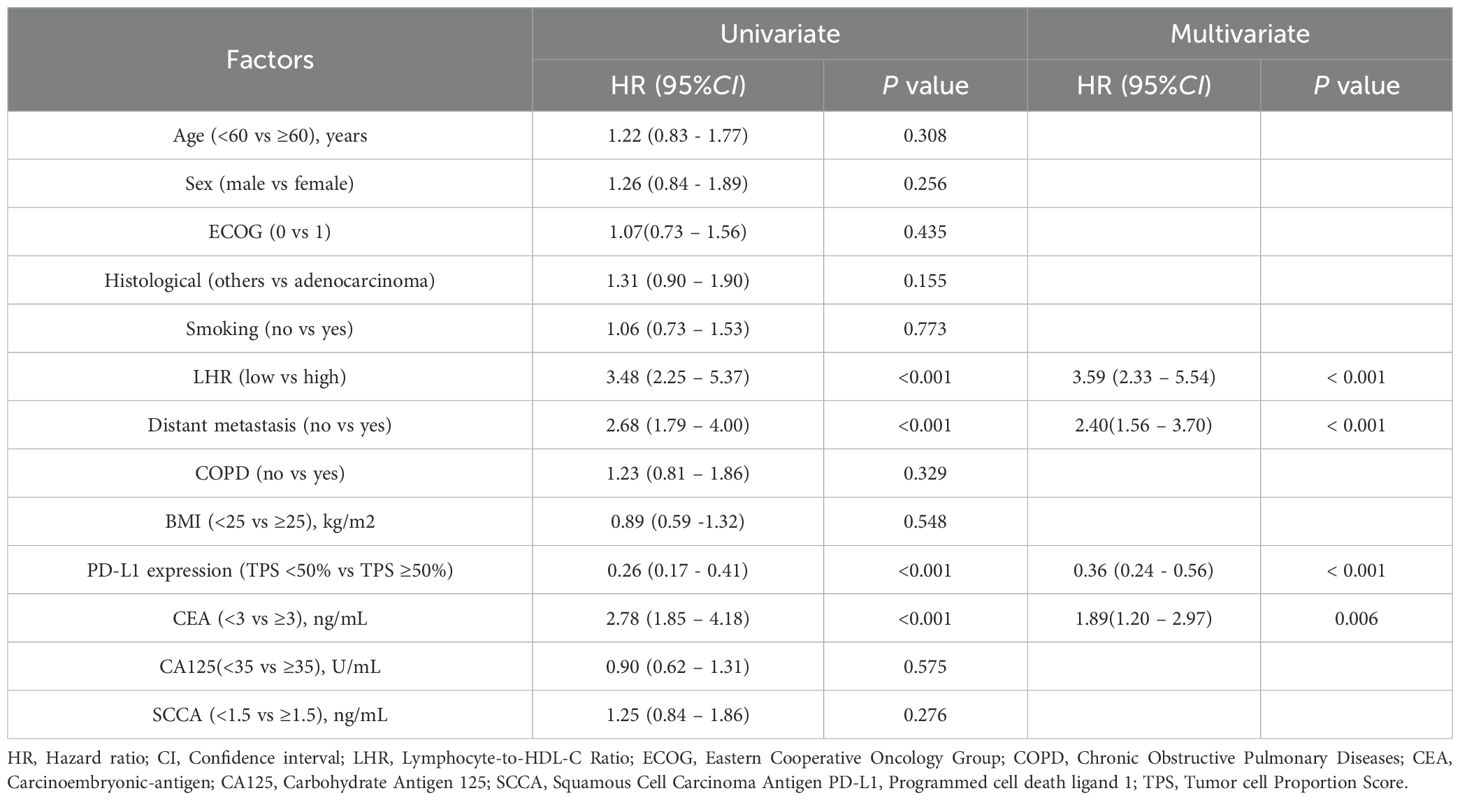
Table 4. Univariate and multivariate analyses of prognostic factors for overall survival.
Multivariate analysis further confirmed high LHR (HR = 3.59, 95% CI: 2.33–5.54, p < 0.001), presence of distant metastasis (HR = 2.40, 95% CI: 1.56–3.70, p < 0.001), and elevated CEA level (HR = 1.89, 95% CI: 1.20–2.97, p = 0.006) as independent adverse prognostic factors for OS. Conversely, high PD-L1 expression was significantly associated with prolonged OS (HR = 0.36, 95% CI: 0.24–0.56, p < 0.001).
Nomogram construction
In the multivariate Cox regression analysis, LHR, distant metastasis, CEA level, and PD-L1 expression were identified as independent prognostic factors for both PFS and OS. Based on these variables, a prognostic nomogram was constructed using the “rms” package in R software (version 4.5.1). The nomogram was developed by converting the regression coefficients (β values) derived from the Cox model into corresponding point scores, with higher scores assigned to variables exerting a stronger risk effect. For each patient, the individual scores of all variables were summed to generate a total score, which was then mapped to the estimated survival probabilities at specific time points.
Specifically, the PFS nomogram was constructed from these four independent prognostic factors (LHR, distant metastasis, CEA level, and PD-L1 expression) to predict the 6- and 12-month progression-free survival probabilities (Figure 3A). Similarly, the OS nomogram was developed using the same set of variables to predict 12-, 18-, and 24-month overall survival probabilities (Figure 3B).
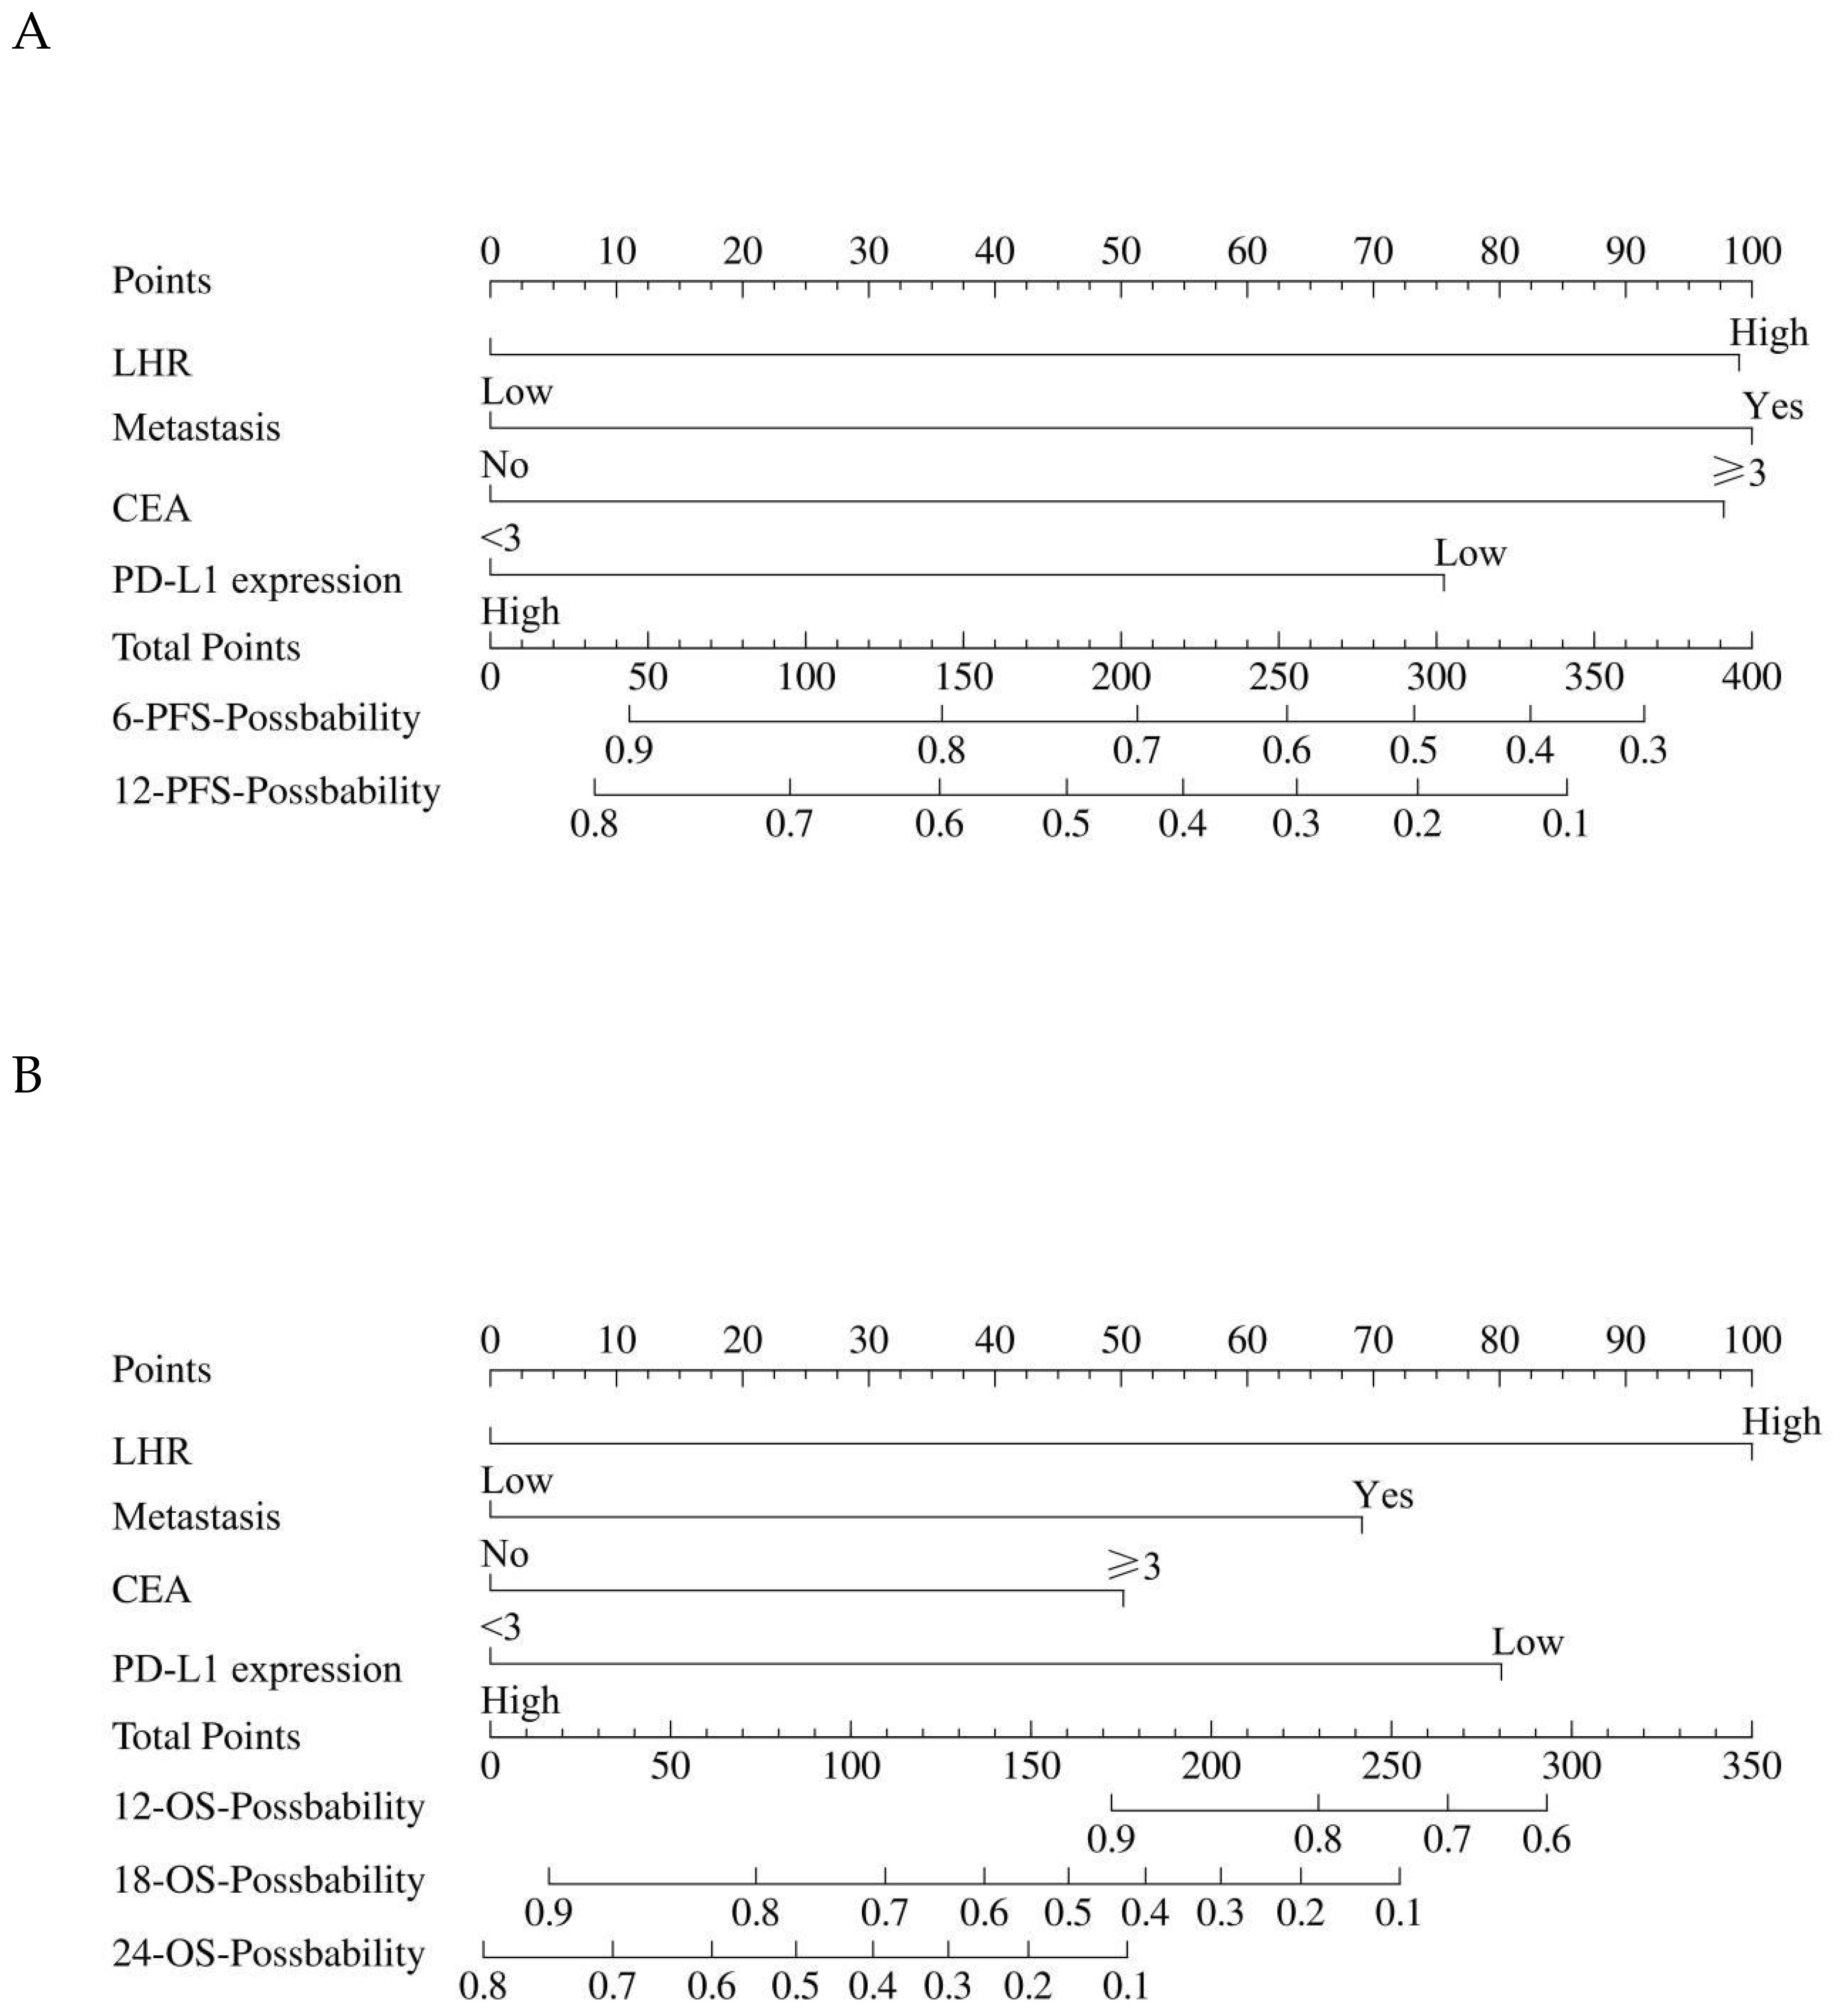
Figure 3. The construction of the nomogram. (A) The nomogram for predicting the 6-month and 12-month PFS. (B) The nomogram for predicting the 12-month, 18-month, and 24-month OS. The nomogram incorporates key prognostic factors such as LHR, distant metastasis, CEA level, and PD-L1 expression. To calculate the individual score, for each factor, find the corresponding point on the scale. Add the points for each factor to get the total score. This total score is then converted to a probability of PFS and OS using the corresponding line at the bottom of the nomogram. LHR, lymphocyte-to-high-density lipoprotein ratio; CEA, carcinoembryonic antigen; PFS, progression-free survival; OS, overall survival.
Model validation
In this study, the 287 patients were randomly divided into a training cohort (n = 200) and a validation cohort (n = 87) at a 7:3 ratio (Table 5). The nomogram model was constructed based on the training cohort and subsequently validated using internal validation. Internal validation was performed using bootstrap resampling with 1,000 iterations, and model performance was evaluated primarily through the concordance index (C-index), receiver operating characteristic (ROC) curve, and calibration curve.
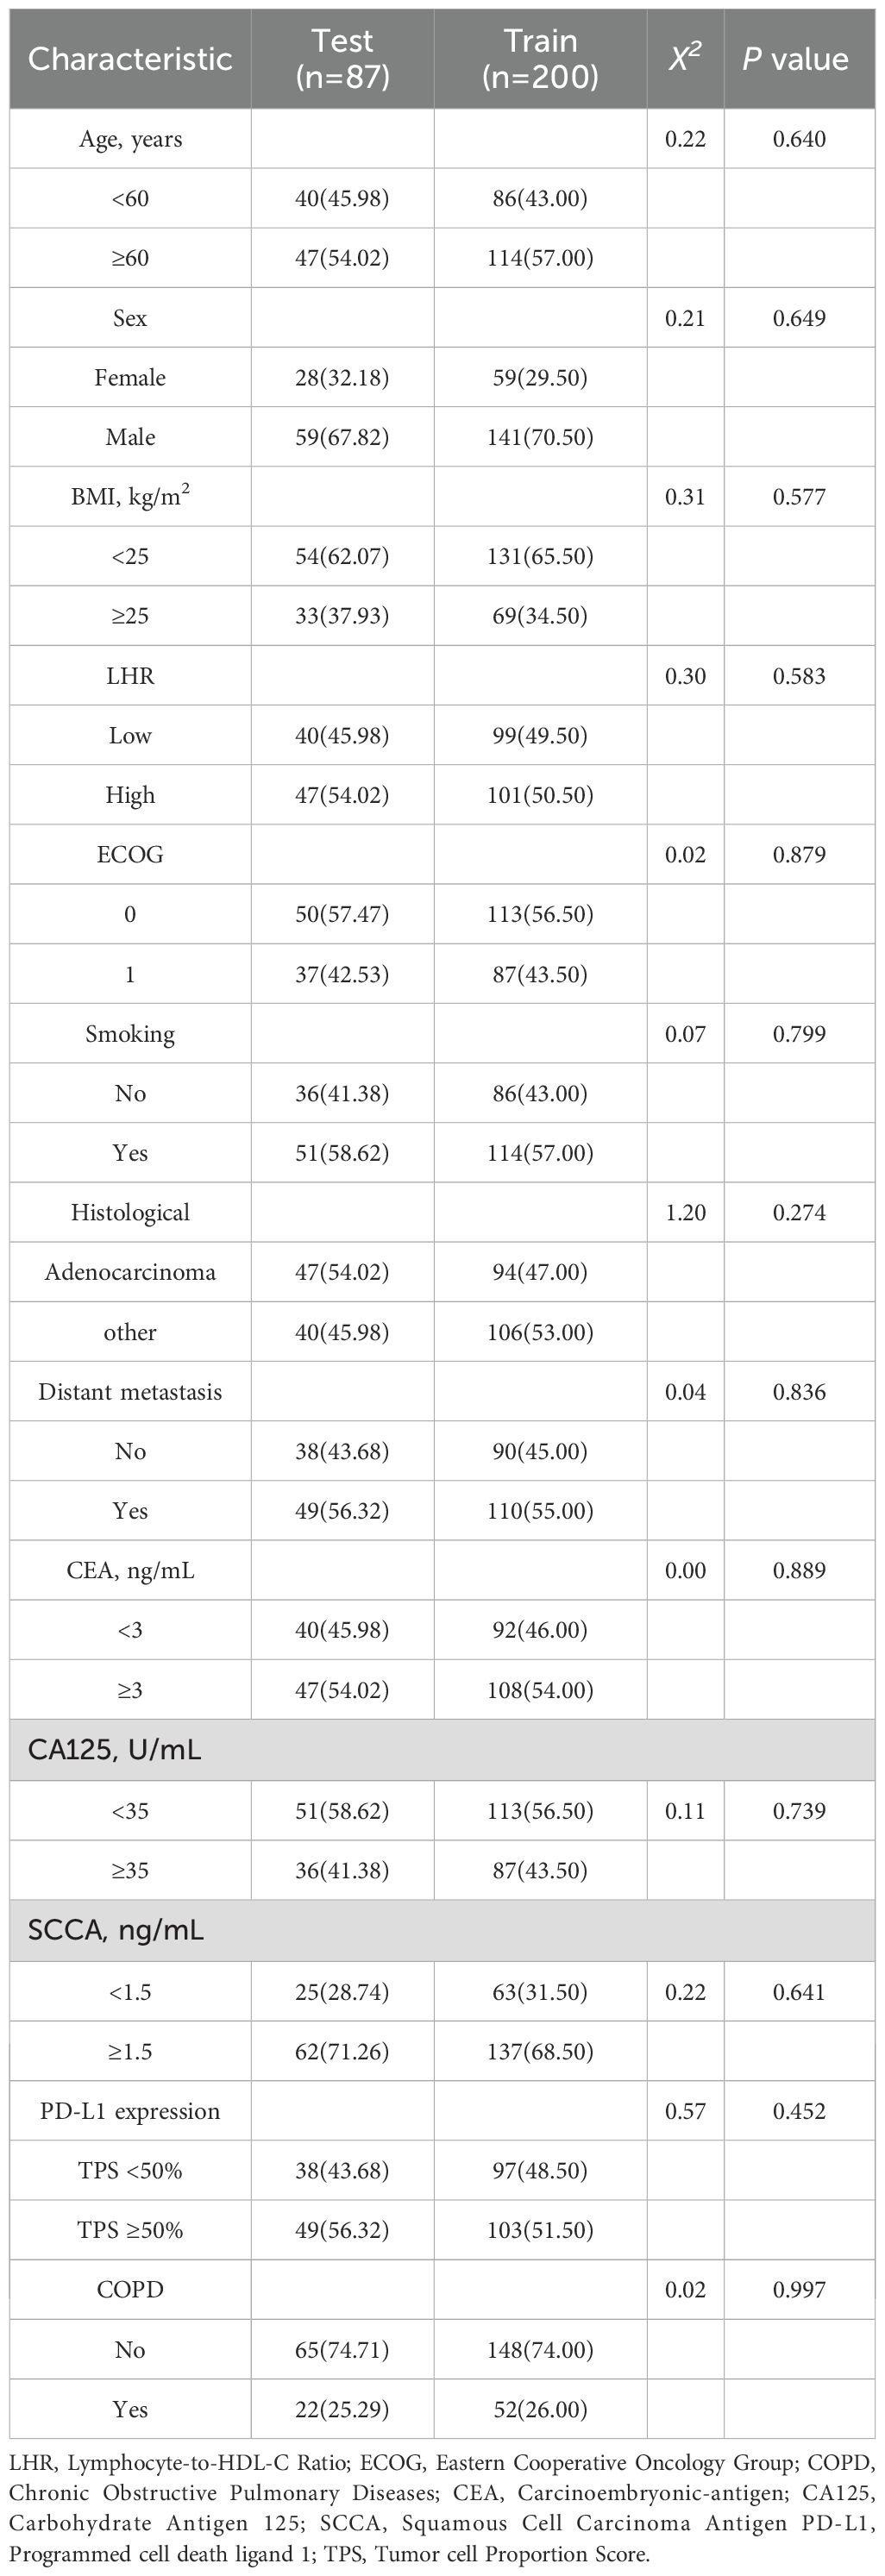
Table 5. Comparison of features between the training and validation sets, n (%).
In the training cohort, the C-index for the PFS prediction model was 0.73 (95% CI: 0.69–0.78), and 0.78 (95% CI: 0.71–0.85) in the validation cohort, indicating good discriminative ability. ROC analysis further confirmed the predictive performance of the model: in the training cohort, the AUC for 6-month and 12-month PFS prediction were 0.82 (95% CI: 0.76–0.89) and 0.86 (95% CI: 0.75–0.96), respectively (Figure 4A). In the validation cohort, the AUCs for 6-month and 12-month PFS prediction were 0.87 (95% CI: 0.80–0.93) and 0.89 (95% CI: 0.81–0.97), respectively (Figure 4B).
Figure 4. The evaluation of the nomogram for predicting Progression-free survival. (A) Graph showing the training set and validation set receiver operating characteristic (ROC) evaluation plots for 6-month prognostic prediction model; (B) Graph showing the training set and validation set ROC evaluation plots for 12-month prognostic prediction model. AUC, Area under the curve.
For OS prediction, the C-index values in the training and validation cohorts were 0.80 (95% CI: 0.76–0.84) and 0.82 (95% CI: 0.77–0.86), respectively, demonstrating high discriminative ability. The model maintained stable accuracy for predicting OS at 12, 18, and 24 months: in the training cohort, the AUCs were 0.81 (95% CI: 0.74–0.89), 0.85 (95% CI: 0.74–0.91), and 0.94 (95% CI: 0.90–0.98), respectively; in the validation cohort, the AUCs were 0.89 (95% CI: 0.80–0.98), 0.88 (95% CI: 0.80–0.96), and 0.82 (95% CI: 0.71–0.93), respectively (Figures 5A–C).
Figure 5. The evaluation of the nomogram for predicting Overall survival. (A) Graph showing the training set and validation set receiver operating characteristic (ROC) evaluation plots for 12-month prognostic prediction model; (B) Graph showing the training set and validation set ROC evaluation plots for 18-month prognostic prediction model.C: Graph showing the training set and validation set ROC evaluation plots for 24-month prognostic prediction model. AUC, Area under the curve.
Calibration curve analysis showed that the predicted survival probabilities were highly consistent with the observed outcomes, indicating that the nomogram model has good predictive accuracy and clinical applicability (Figures 6A–J).
Figure 6. Graph illustrating the calibration plots for a prognostic model. (A) Calibration plots for the training set 6-month Progression-free survival (PFS); (B) Calibration plots for the validation set 6-month PFS; (C) Calibration plots for the training set 12-month PFS; (D) Calibration plots for the validation set 12-month PFS; (E) Calibration plots for the training set 12-month Overall survival (OS); (F) Calibration plots for the validation set 12-month OS. (G) Calibration plots for the training set 18-month OS; (H) Calibration plots for the validation set 18-month OS. (I) Calibration plots for the training set 24-month OS; (J) Calibration plots for the validation set 24-month OS.
Adverse events
In this study cohort, the majority of patients tolerated chemo-immunotherapy well, with no cases of treatment discontinuation due to adverse events (Table 6). The most common adverse events included myelosuppression (23.0%), gastrointestinal reactions (22.7%), rash (16.7%), immune-related pneumonia (12.9%), hepatotoxicity (10.5%), renal and gastrointestinal reactions (4.5%), immune-related pneumonia (3.5%), rash (3.5%), nephrotoxicity (2.8%), hepatotoxicity (2.4%), and hypothyroidism (2.1%). Overall, adverse events were manageable and did not lead to treatment discontinuation. No significant differences were observed between the two groups in the incidence of adverse events (p > 0.05).
Table 6. Adverse events associated with pembrolizumab plus chemotherapy in lung cancer patients, n (%).
Discussion
This study is the first to validate the independent predictive value of the lymphocyte-to-high-density lipoprotein ratio (LHR) for long-term efficacy in advanced non-small cell lung cancer (NSCLC) patients receiving chemo-immunotherapy. We found that a low LHR was significantly associated with better progression-free survival (PFS) and overall survival (OS), as well as higher objective response rate (ORR) and disease control rate (DCR). Multivariate Cox regression analysis further confirmed that LHR, PD-L1 expression, distant metastasis, and carcinoembryonic antigen (CEA) level were independent prognostic factors for both PFS and OS. Based on these clinical variables, we developed nomogram models for both PFS and OS, which were internally validated to demonstrate good discriminatory power and clinical applicability. These findings provide valuable reference for individualized clinical treatment.
LHR, as a composite marker integrating immune response and metabolic status, reflects the complex interplay between the host immune environment and metabolic health. Lymphocytes, as key effector cells in the body’s antitumor immune response, directly influence the efficacy of immunotherapy (17). Higher lymphocyte counts generally indicate stronger immune surveillance and antitumor activity, which are crucial for the response to immune checkpoint inhibitors (18). At the same time, high-density lipoprotein cholesterol (HDL-C) plays an important role not only in lipid metabolism but also in anti-inflammatory, antioxidant, and immunomodulatory functions (19, 20). HDL-C exerts its effects by inhibiting the secretion of pro-inflammatory cytokines, modulating immune cell function, and reducing systemic inflammation, which indirectly affects the tumor microenvironment (13, 14). Previous studies have shown that low HDL-C levels are associated with higher levels of inflammation and immune escape mechanisms, which may contribute to poor response to immunotherapy (21–23).
Therefore, LHR not only integrates information on immune cell counts and metabolic function but also highlights the role of immune-metabolic imbalance in tumor progression. An elevated LHR reflects a decline in immune cell function and metabolic dysregulation. Immune cells activate key signaling pathways, such as PI3K/Akt, MAPK, and mTOR, through T-cell receptors (TCRs), which directly impact immune response and tumor clearance (24, 25). Meanwhile, HDL-C regulates immune cell membrane lipid composition and promotes anti-inflammatory responses, maintaining immune cell function and enhancing antitumor immunity (26, 27). Lower HDL-C levels weaken T-cell function and may promote immune suppression by tumor-associated macrophages, exacerbating immune escape (28, 29). The elevated LHR, through activation of pro-inflammatory pathways like NF-κB and JNK, further intensifies inflammation in the immune microenvironment, reducing the efficacy of immunotherapy (30–32).
Taken together, LHR serves as a robust indicator that integrates immune response and metabolic dysregulation, providing an effective early warning for tumor immunotherapy responses. The complex interplay between lymphopenia and low HDL-C levels reflects a dynamic immune-metabolic imbalance, which can severely affect tumor progression and response to therapy. This highlights the need for future research to explore the synergistic effect of these two components in greater detail, as well as the potential of LHR to predict therapeutic efficacy and guide personalized treatment strategies.
In recent years, the coupling of immunity and metabolism has become an important research focus in tumor immunology. Several studies have demonstrated that metabolic reprogramming of immune cells directly affects their function, particularly in T-cells and tumor-associated macrophages within the tumor microenvironment (33–35). At the same time, other immune-metabolic-related markers, such as the neutrophil-to-lymphocyte ratio (NLR) and platelet-to-lymphocyte ratio (PLR), have been used for prognosis assessment in various cancers, but their consistency and stability across different tumor types remain variable (36, 37). Compared to these markers, LHR has the advantage of integrating both immune cell quantity and metabolic status, offering a more comprehensive reflection of the immune-metabolic health status of patients. Although LHR has shown good prognostic predictive value in gastric cancer, colorectal cancer, and other malignancies (15), its application in advanced NSCLC treated with chemo-immunotherapy has not been fully explored. Our data indicate that LHR not only reflects the strength of tumor immune response but also serves as an important marker of tumor metabolic reprogramming, overcoming the limitations of traditional biomarkers such as PD-L1 and tumor mutational burden (TMB).
In clinical practice, the detection of LHR can serve as a simple, cost-effective, and easily operable biomarker to predict immune therapy responses in advanced NSCLC patients. The nomogram model based on LHR allows for individualized risk assessment prior to immunotherapy, aiding in patient stratification and treatment decisions. For example, patients with a low LHR typically show better responses to immunotherapy and may be prioritized for chemo-immunotherapy or immunotherapy monotherapy as maintenance treatment; whereas patients with a high LHR may require more intensive monitoring, enhanced supportive care, or alternative treatment strategies such as targeted therapy or chemotherapy. Furthermore, as a hematological marker, LHR is easy to monitor dynamically during treatment, helping to evaluate the effectiveness of immunotherapy and identify the onset of resistance. When combined with other immune therapy biomarkers (such as PD-L1 and TMB), LHR provides a more comprehensive risk assessment, supporting individualized treatment and precision medicine.
Although our study offers valuable insights within a single-center cohort, it is not without limitations. As a retrospective design, it is inherently prone to selection bias and confounding factors, particularly related to the sample selection and data collection process, which may affect the generalizability of the findings. Furthermore, the cutoff value for LHR was determined based on internal ROC curve analysis, and external validation is lacking. Additionally, only the baseline LHR was analyzed, and the prognostic value of its dynamic changes requires further exploration. Future studies should focus on larger, multi-center cohorts to further validate these findings. Second, this study only analyzed baseline LHR and did not investigate how its dynamic changes may affect treatment outcomes. Future research should explore the trend of LHR changes during immunotherapy and assess its potential for real-time monitoring and efficacy evaluation. Third, although we included key clinical variables such as PD-L1 expression, distant metastasis, and CEA, additional immune-metabolic interactions (e.g., immune cell subsets in the tumor microenvironment, metabolic enzymes) were not considered in the model. Incorporating these factors may further improve the accuracy and clinical applicability of the predictive model. In addition, we did not include the chemotherapy regimen in the multivariate analysis. The choice of chemotherapy agents was primarily based on histological subtype (pemetrexed-based regimens for adenocarcinoma and taxane-based regimens for squamous cell carcinoma), which minimized treatment heterogeneity across patients. Furthermore, there was no significant difference in the distribution of chemotherapy regimens between the high and low LHR groups, suggesting that the potential confounding effect of treatment imbalance was limited. However, the exclusion of chemotherapy-related variables remains a limitation of this study, and future large-scale prospective studies are needed to further validate the prognostic stability of LHR across different treatment subgroups. Finally, another limitation of this study is that we only analyzed baseline biomarker data obtained prior to the initiation of treatment, without accounting for the potential influence of dynamic biomarker changes during treatment. Such changes could provide valuable insights into treatment response and long-term prognosis, which warrant further exploration in future studies.
Future research should focus on the following directions: first, conduct multi-center, prospective studies to further validate the predictive performance of LHR in different patient populations; second, combine modern technologies (e.g., immunomics, metabolomics) to explore the mechanistic links between LHR and immunotherapy responses; and third, develop dynamic monitoring tools that combine LHR with other biomarkers to explore its potential as an early warning and intervention tool in immunotherapy. In addition, incorporating post-treatment biomarker evaluations will be essential to enhance our understanding of treatment response and long-term prognosis.
Conclusion
The lymphocyte-to-high-density lipoprotein ratio (LHR) is an independent predictor of long-term efficacy in advanced NSCLC patients receiving chemo-immunotherapy. A low LHR is associated with improved progression-free survival (PFS), overall survival (OS), and higher response rates. The LHR-based nomogram demonstrated strong predictive accuracy and clinical value. As a simple, cost-effective biomarker, LHR can enhance individualized risk stratification and inform treatment decisions for advanced NSCLC.
Data availability statement
The original contributions presented in the study are included in the article/supplementary material. Further inquiries can be directed to the corresponding authors.
Ethics statement
The studies involving humans were approved by This research was carried out following the Declaration of Helsinki and received approval from the Ethics Committee at the Affiliated Hospital of Xuzhou Medical University (approval No. XYFY2024-KL097-01). The studies were conducted in accordance with the local legislation and institutional requirements. The ethics committee/institutional review board waived the requirement of written informed consent for participation from the participants or the participants’ legal guardians/next of kin because Given the retrospective design of this investigation, the Ethics Committee of the Affiliated Hospital of Xuzhou Medical University granted us an exemption from obtaining written informed consent.
Author contributions
GM: Conceptualization, Data curation, Formal Analysis, Investigation, Methodology, Resources, Software, Supervision, Validation, Visualization, Writing – original draft, Writing – review & editing. LM: Conceptualization, Data curation, Formal Analysis, Investigation, Methodology, Software, Supervision, Validation, Visualization, Writing – original draft, Writing – review & editing. YuZ: Conceptualization, Data curation, Formal Analysis, Methodology, Software, Validation, Visualization, Writing – original draft, Writing – review & editing. YC: Conceptualization, Data curation, Formal Analysis, Methodology, Software, Validation, Writing – original draft, Writing – review & editing. YiZ: Conceptualization, Data curation, Formal Analysis, Methodology, Software, Validation, Writing – original draft, Writing – review & editing. WG: Conceptualization, Data curation, Formal Analysis, Methodology, Writing – original draft, Writing – review & editing. ZY: Conceptualization, Data curation, Formal Analysis, Investigation, Methodology, Project administration, Software, Supervision, Validation, Visualization, Writing – original draft, Writing – review & editing. GJ: Conceptualization, Data curation, Formal Analysis, Investigation, Methodology, Project administration, Resources, Software, Supervision, Validation, Visualization, Writing – original draft, Writing – review & editing.
Funding
The author(s) declare financial support was received for the research and/or publication of this article. This work was supported by funds from The Medical Innovation Project of Xuzhou Municipal Health Commission(XWKYHT20220096 to Ma GL)
Conflict of interest
The authors declare that the research was conducted in the absence of any commercial or financial relationships that could be construed as a potential conflict of interest.
Generative AI statement
The author(s) declare that no Generative AI was used in the creation of this manuscript.
Any alternative text (alt text) provided alongside figures in this article has been generated by Frontiers with the support of artificial intelligence and reasonable efforts have been made to ensure accuracy, including review by the authors wherever possible. If you identify any issues, please contact us.
Publisher’s note
All claims expressed in this article are solely those of the authors and do not necessarily represent those of their affiliated organizations, or those of the publisher, the editors and the reviewers. Any product that may be evaluated in this article, or claim that may be made by its manufacturer, is not guaranteed or endorsed by the publisher.
References
1. Siegel RL, Kratzer TB, Giaquinto AN, Sung H, and Jemal A. Cancer statistics, 2025. CA Cancer J Clin. (2025) 75:10–45. doi: 10.3322/caac.21871
2. Lahiri A, Maji A, Potdar PD, Singh N, Parikh P, Bisht B, et al. Lung cancer immunotherapy: progress, pitfalls, and promises. Mol Cancer. (2023) 22:40. doi: 10.1186/s12943-023-01740-y
3. Noonan KL, Ho C, Laskin J, and Murray N. The influence of the evolution of first-line chemotherapy on steadily improving survival in advanced non-small-cell lung cancer clinical trials. J Thorac Oncol. (2015) 10:1523–31. doi: 10.1097/JTO.0000000000000667
4. Sakamori Y, Kawachi H, Yamoto M, Fukao A, Terashita S, Watanabe K, et al. Improvement of survival outcomes in patients with advanced-stage non-small-cell lung cancer treated with chemotherapy: a retrospective cohort study evaluating the role of immune checkpoint inhibitors. J Thorac Dis. (2025) 17:4689–700. doi: 10.21037/jtd-2024-2202
5. Desai A and Peters S. Immunotherapy-based combinations in metastatic NSCLC. Cancer Treat Rev. (2023) 116:102545. doi: 10.1016/j.ctrv.2023.102545
6. Gadgeel S, Rodriguez-Abreu D, Speranza G, Esteban E, Felip E, Domine M, et al. Updated analysis from KEYNOTE-189: pembrolizumab or placebo plus pemetrexed and platinum for previously untreated metastatic nonsquamous non-small-cell lung cancer. J Clin Oncol. (2020) 38:1505–17. doi: 10.1200/JCO.19.03136
7. Novello S, Kowalski DM, Luft A, Gumus M, Vicente D, Mazieres J, et al. Pembrolizumab plus chemotherapy in squamous non-small-cell lung cancer: 5-year update of the phase III KEYNOTE-407 study. J Clin Oncol. (2023) 41:1999–2006. doi: 10.1200/JCO.22.01990
8. Haragan A, Field JK, Davies MPA, Escriu C, Gruver A, and Gosney JR. Heterogeneity of PD-L1 expression in non-small cell lung cancer: Implications for specimen sampling in predicting treatment response. Lung Cancer. (2019) 134:79–84. doi: 10.1016/j.lungcan.2019.06.005
9. Altea-Manzano P, Decker-Farrell A, Janowitz T, and Erez A. Metabolic interplays between the tumour and the host shape the tumour macroenvironment. Nat Rev Cancer. (2025) 25:274–92. doi: 10.1038/s41568-024-00786-4
10. Cote AL, Munger CJ, and Ringel AE. Emerging insights into the impact of systemic metabolic changes on tumor-immune interactions. Cell Rep. (2025) 44:115234. doi: 10.1016/j.celrep.2025.115234
11. Zhao H, Wu L, Yan G, Chen Y, Zhou M, Wu Y, et al. Inflammation and tumor progression: signaling pathways and targeted intervention. Signal Transduct Target Ther. (2021) 6:263. doi: 10.1038/s41392-021-00658-5
12. Yao Z, Li G, Pan D, Pei Z, Fang Y, Liu H, et al. Roles and functions of tumor-infiltrating lymphocytes and tertiary lymphoid structures in gastric cancer progression. Front Immunol. (2025) 16:1595070. doi: 10.3389/fimmu.2025.1595070
13. Allegra A, Murdaca G, Mirabile G, and Gangemi S. Protective effects of high-density lipoprotein on cancer risk: focus on multiple myeloma. Biomedicines. (2024) 12:514. doi: 10.3390/biomedicines12030514
14. Luo F, Cao J, Chen Q, Liu L, Yang T, Bai X, et al. HDL-cholesterol confers sensitivity of immunotherapy in nasopharyngeal carcinoma via remodeling tumor-associated macrophages towards the M1 phenotype. J Immunother Cancer. (2024) 12:e008146. doi: 10.1136/jitc-2023-008146
15. Ruan GT, Xie HL, Gong YZ, Ge YZ, Zhang Q, Wang ZW, et al. Prognostic importance of systemic inflammation and insulin resistance in patients with cancer: a prospective multicenter study. BMC Cancer. (2022) 22:700. doi: 10.1186/s12885-022-09752-5
16. Deng Y, Chen Q, Chen J, Zhang Y, Zhao J, Bi X, et al. An elevated preoperative cholesterol-to-lymphocyte ratio predicts unfavourable outcomes in colorectal cancer liver metastasis patients receiving simultaneous resections: a retrospective study. BMC Surg. (2023) 23:131. doi: 10.1186/s12893-023-01988-7
17. Tomsitz D, Schlaak M, Zierold S, Pesch G, Schulz TU, Muller G, et al. Development of lymphopenia during therapy with immune checkpoint inhibitors is associated with poor outcome in metastatic cutaneous melanoma. Cancers (Basel). (2022) 14:3282. doi: 10.3390/cancers14133282
18. Shien K, Papadimitrakopoulou VA, and Wistuba II. Predictive biomarkers of response to PD-1/PD-L1 immune checkpoint inhibitors in non-small cell lung cancer. Lung Cancer. (2016) 99:79–87. doi: 10.1016/j.lungcan.2016.06.016
19. Trakaki A and Marsche G. Current understanding of the immunomodulatory activities of high-density lipoproteins. Biomedicines. (2021) 9(6):587. doi: 10.3390/biomedicines9060587
20. Grao-Cruces E, Lopez-Enriquez S, Martin ME, and Montserrat-de la Paz S. High-density lipoproteins and immune response: A review. Int J Biol Macromol. (2022) 195:117–23. doi: 10.1016/j.ijbiomac.2021.12.009
21. Pecci F, Cantini L, Cognigni V, Perrone F, Mazzaschi G, Agostinelli V, et al. Prognostic impact of blood lipid profile in patients with advanced solid tumors treated with immune checkpoint inhibitors: A multicenter cohort study. Oncologist. (2024) 29:e372–81. doi: 10.1093/oncolo/oyad273
22. Li J, Wang J, and Cao B. Exploring the impact of HDL and LMNA gene expression on immunotherapy outcomes in NSCLC: a comprehensive analysis using clinical & gene data. Front Oncol. (2024) 14:1448966. doi: 10.3389/fonc.2024.1448966
23. Yao ZY, Ma X, Cui YZ, Liu J, Han ZX, and Song J. Impact of triglyceride-glucose index on the long-term prognosis of advanced gastric cancer patients receiving immunotherapy combined with chemotherapy. World J Gastroenterol. (2025) 31:102249. doi: 10.3748/wjg.v31.i5.102249
24. Abdesheikhi J, Sedghy F, Mahmoodi M, Fallah H, and Ranjkesh M. Metabolic regulation of T cell activity: implications for metabolic-based T-cell therapies for cancer. Iran BioMed J. (2023) 27:1–14. doi: 10.52547/ibj.3811
25. Jin J, Zhao Q, Wei Z, Chen K, Su Y, Hu X, et al. Glycolysis-cholesterol metabolic axis in immuno-oncology microenvironment: emerging role in immune cells and immunosuppressive signaling. Cell Biosci. (2023) 13:189. doi: 10.1186/s13578-023-01138-9
26. Jacobs CF, Peters FS, Camerini E, Cretenet G, Rietveld J, Schomakers BV, et al. Cholesterol homeostasis and lipid raft dynamics at the basis of tumor-induced immune dysfunction in chronic lymphocytic leukemia. Cell Mol Immunol. (2025) 22:485–500. doi: 10.1038/s41423-025-01262-1
27. Revilla G, Cedo L, Tondo M, Moral A, Perez JI, Corcoy R, et al. LDL, HDL and endocrine-related cancer: From pathogenic mechanisms to therapies. Semin Cancer Biol. (2021) 73:134–57. doi: 10.1016/j.semcancer.2020.11.012
28. Zou Y, Yu X, Zhou C, Zhu C, and Yuan Y. Adverse effects of low serum lipoprotein cholesterol on the immune microenvironment in gastric cancer: a case–control study. Lipids Health Dis. (2022) 21:150. doi: 10.1186/s12944-022-01766-z
29. Norata GD, Pirillo A, Ammirati E, and Catapano AL. Emerging role of high density lipoproteins as a player in the immune system. Atherosclerosis. (2012) 220:11–21. doi: 10.1016/j.atherosclerosis.2011.06.045
30. Cao Y, Yi Y, Han C, and Shi B. NF-kappaB signaling pathway in tumor microenvironment. Front Immunol. (2024) 15:1476030. doi: 10.3389/fimmu.2024.1476030
31. Wen Y, Zhu Y, Zhang C, Yang X, Gao Y, Li M, et al. Chronic inflammation, cancer development and immunotherapy. Front Pharmacol. (2022) 13:1040163. doi: 10.3389/fphar.2022.1040163
32. Bakrim S, Fessikh ME, Elhrech H, Omari NE, Amanullah M, Ming LC, et al. Targeting inflammation in cancer therapy: from mechanistic insights to emerging therapeutic approaches. J Transl Med. (2025) 23:588. doi: 10.1186/s12967-025-06583-3
33. Wang J, He Y, Hu F, Hu C, Sun Y, Yang K, et al. Metabolic reprogramming of immune cells in the tumor microenvironment. Int J Mol Sci. (2024) 25:12223. doi: 10.3390/ijms252212223
34. Li L and Tian Y. The role of metabolic reprogramming of tumor-associated macrophages in shaping the immunosuppressive tumor microenvironment. BioMed Pharmacother. (2023) 161:114504. doi: 10.1016/j.biopha.2023.114504
35. Qian Y, Yin Y, Zheng X, Liu Z, and Wang X. Metabolic regulation of tumor-associated macrophage heterogeneity: insights into the tumor microenvironment and immunotherapeutic opportunities. biomark Res. (2024) 12:1. doi: 10.1186/s40364-023-00549-7
36. Cupp MA, Cariolou M, Tzoulaki I, Aune D, Evangelou E, and Berlanga-Taylor AJ. Neutrophil to lymphocyte ratio and cancer prognosis: an umbrella review of systematic reviews and meta-analyses of observational studies. BMC Med. (2020) 18:360. doi: 10.1186/s12916-020-01817-1
37. Diem S, Schmid S, Krapf M, Flatz L, Born D, Jochum W, et al. Neutrophil-to-Lymphocyte ratio (NLR) and Platelet-to-Lymphocyte ratio (PLR) as prognostic markers in patients with non-small cell lung cancer (NSCLC) treated with nivolumab. Lung Cancer. (2017) 111:176–81. doi: 10.1016/j.lungcan.2017.07.024
Keywords: lymphocyte-to-HDL-C ratio, non-small cell lung cancer, chemo-immunotherapy, prognostic biomarker, nomogram, safety, efficacy
Citation: Ma G, Ma L, Zhang Y, Chen Y, Zhang Y, Guo W, Yao Z and Ji G (2025) Prognostic significance of the lymphocyte-to-high-density lipoprotein ratio in long-term efficacy of combined immunotherapy for advanced non-small cell lung cancer. Front. Oncol. 15:1712779. doi: 10.3389/fonc.2025.1712779
Received: 25 September 2025; Accepted: 03 November 2025;
Published: 19 November 2025.
Edited by:
Lizza E. L. Hendriks, Maastricht University Medical Centre, NetherlandsReviewed by:
Wenqiang Quan, Tongji University, ChinaDaoke Yang, First Affiliated Hospital of Zhengzhou University, China
Feng Yan, Nanjing Medical University, China
Copyright © 2025 Ma, Ma, Zhang, Chen, Zhang, Guo, Yao and Ji. This is an open-access article distributed under the terms of the Creative Commons Attribution License (CC BY). The use, distribution or reproduction in other forums is permitted, provided the original author(s) and the copyright owner(s) are credited and that the original publication in this journal is cited, in accordance with accepted academic practice. No use, distribution or reproduction is permitted which does not comply with these terms.
*Correspondence: Zhiyuan Yao, OTA2MjMyNjQ0QHFxLmNvbQ==; Guijuan Ji, MTkwNjIxNjQyQHFxLmNvbQ==
†These authors have contributed equally to this work