 Xuemei Peng†
 Yanfang Ai
 Weiying Xu
- Department of Breast Surgery, Jiangxi Cancer Hospital & Institute, The Second Affiliated Hospital of Nanchang Medical College, Nanchang, Jiangxi, China
Objective: Breast cancer-related lymphedema (BCRL) is a common postoperative complication that significantly impairs patients’ quality of life. This study aims to develop a machine learning-based personalized risk prediction model for BCRL by integrating multimodal clinical and behavioral data, thereby providing scientific support for early identification and intervention in high-risk individuals.
Methods: Clinical and follow-up data were collected from patients who underwent breast cancer surgery between June 2020 and June 2025. A total of 38 variables were analyzed using the Least Absolute Shrinkage and Selection Operator (LASSO) method for feature selection. Nine machine learning algorithms were developed, and their performance was evaluated using metrics including accuracy, sensitivity, specificity, positive predictive value, negative predictive value, F1-score, and the area under the receiver operating characteristic curve (AUC). The optimal model was further interpreted using Shapley Additive Explanations (SHAP) to enable individualized risk assessment.
Results: A total of 368 eligible patients were included and randomly divided into a training set (n = 257) and a validation set (n = 111) at a 7:3 ratio. Among them, 98 patients (26.63%) developed BCRL. LASSO regression identified 12 features most predictive of BCRL. Among all models, logistic regression demonstrated the best performance, with an AUC of 0.937, accuracy of 0.793, sensitivity of 0.937, and specificity of 0.740 in the validation set. BMI, lymph node dissection level, and lymph node status were identified as the most influential predictors contributing to model performance.
Conclusion: A logistic regression model, combined with SHAP-based interpretation, enables personalized risk prediction of BCRL in postoperative breast cancer patients. This approach may provide robust support for clinical risk stratification and intervention planning.
Background
Breast cancer (BC) is one of the most common malignancies among women worldwide, with an incidence that continues to rise. Recent studies indicate that advancements in screening technologies and comprehensive treatment strategies have significantly improved survival rates in breast cancer patients (1).However, increasing attention is being paid to postoperative complications.
Breast cancer-related lymphedema (BCRL) is among the most prevalent chronic complications following breast cancer surgery, affecting approximately one-fifth of patients (2). BCRL primarily results from impaired lymphatic drainage, leading to the accumulation of protein-rich fluid in the interstitial space and the development of secondary lymphedema (3, 4). Clinically, patients often present with upper limb swelling, heaviness, pain, progressive fibrosis, and skin hardening (5).
Numerous studies have identified several risk factors associated with BCRL, including axillary lymph node dissection (ALND), adjuvant radiotherapy and chemotherapy, tumor staging, obesity, and age (6, 7). Although these findings have provided valuable insights into the pathophysiology of BCRL, there remains a lack of comprehensive predictive tools that integrate multiple variables to assess individual risk.
In recent years, advanced technologies such as machine learning (ML) have emerged as powerful tools for modeling cancer treatment outcomes and prognostic parameters (8). Compared to traditional statistical approaches, ML methods are better suited for handling high-dimensional data with multiple predictors, offering improved accuracy in personalized risk prediction and demonstrating strong potential for clinical application (9).
This study aims to construct multiple ML-based models to predict the individualized risk of developing BCRL after surgery. In addition, the interpretability of the models is enhanced using Shapley Additive Explanations (SHAP), which enables clinicians to identify key risk factors more clearly, thereby supporting postoperative management and intervention strategies to reduce the incidence of BCRL.
Methods
Study population
Female patients diagnosed with unilateral breast cancer who underwent either unilateral radical mastectomy or modified radical mastectomy between June 2020 and June 2025 were recruited for this study. The inclusion criteria were as follows: (1) pathologically confirmed breast cancer with surgical treatment; (2) female sex; (3) age ≥18 years; (4) normal reading and comprehension abilities without cognitive or communication disorders; and (5) provision of written informed consent.
Patients were excluded if they met any of the following criteria: (1) bilateral breast cancer; (2) malignancies at non-breast sites; (3) history of tumor recurrence or metastasis; (4) prior diagnosis of lymphedema or other lymphatic system disorders; (5) inability or unwillingness to participate, or incomplete clinical records; (6) presence of serious comorbidities such as severe cardiac, cardiogenic, or renal failure; (7) congenital or acquired upper limb abnormalities (e.g., deformity, amputation, tumor, or scarring) that prevented arm circumference measurement; or (8) inability of the patient or caregiver to complete the questionnaire using a smartphone or WeChat.
Study variables
A data collection form comprising five sections and a total of 38 variables was used (Table 1). The first four sections—demographic, tumor characteristics, surgical and treatment-related factors, and postoperative status—were extracted from the electronic medical record system. The fifth section, containing behavioral data relevant to reducing lymphedema risk, was collected using a structured questionnaire administered via WeChat (a messaging application), telephone interviews, or outpatient follow-ups. After comprehensive explanation of the study’s purpose and significance, the questionnaire was completed independently by participants or their legal guardians/next of kin with informed consent.
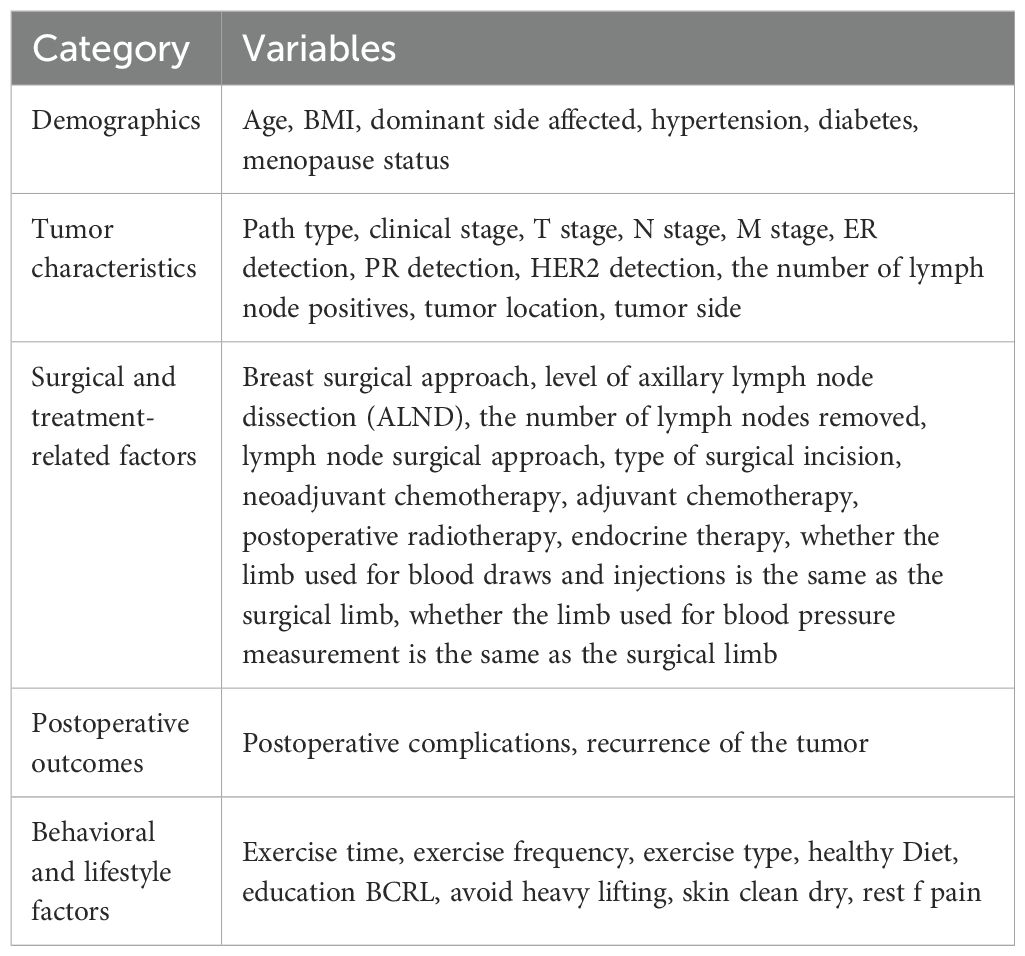
Table 1. The variables in this study and their corresponding categories used for predicting BCRL.
To enhance the reliability and validity of self-reported behavioral variables, we developed a structured questionnaire to collect postoperative behavior-related data, including exercise frequency, avoidance of heavy lifting, and adherence to lymphedema prevention recommendations. The questionnaire items were formulated based on a systematic review of previously published studies and relevant clinical guidelines for reducing the risk of breast cancer-related lymphedema (10–12).
The preliminary version of the questionnaire was reviewed by a multidisciplinary expert panel consisting of two breast surgeons, two oncology nurses, and one rehabilitation specialist to guarantee its content validity and clarity. Subsequently, a pilot test involving 20 postoperative breast cancer survivors was conducted to evaluate the comprehensibility of the items and the overall structural coherence. Revisions were made to the wording and logical flow based on participant feedback. Furthermore, the internal consistency of the multi-item behavioral scales was assessed using Cronbach’s α coefficient, which exceeded 0.70, indicating an acceptable level of reliability for measuring behavioral constructs.
Assessment of lymphedema
The diagnostic criterion for BCRL was based on objective circumference measurements. A non-elastic measuring tape was used to measure the circumference at four standardized points on both upper limbs: the wrist crease, 10 cm above the wrist crease, the antecubital fossa, and 10 cm above the antecubital fossa. A difference of ≥2.0 cm between the affected and unaffected arms at any site was defined as BCRL (13). The occurrence of BCRL was set as the follow-up outcome event, and follow-up ended in June 2025.
Model development and evaluation
Feature selection was performed using the Least Absolute Shrinkage and Selection Operator (LASSO) regression via R software (glmnet v4.1.2), which adjusts for model complexity and variable selection. After identifying relevant predictors from the full set of independent variables, patients were randomly divided into a training set (n = 257) and a validation set (n = 111) in a 7:3 ratio.
Multiple machine learning classification models were constructed to analyze and compare the importance of variables across both datasets. The best-performing model was selected based on these comparisons. The area under the receiver operating characteristic (ROC) curve (AUC) was used to assess the discriminative ability of each model. Additional evaluations included decision curve analysis (DCA), calibration plots, and precision-recall (PR) curves. Shapley Additive Explanations (SHAP) were applied to provide both global model interpretability and individualized prediction insights.
Clinical decision support framework
To facilitate the translation of our predictive model into clinical practice, we developed a structured decision support workflow. This framework outlines the systematic process from patient assessment to personalized intervention, comprising five key stages: Patient Assessment, Feature Extraction, Model Prediction, Risk Interpretation, Clinical Action.
Statistical analysis
Comparisons of variables between the training and validation sets were conducted. Continuous variables were presented as means ± standard deviations and compared using the Mann–Whitney U test. Categorical variables were reported as frequencies and percentages, and compared using the chi-square test. A two-sided p-value < 0.05 was considered statistically significant. Data analysis was performed using SPSS version 28.0 and R version 4.4.3.
Results
Participant characteristics
A total of 368 postoperative breast cancer patients were enrolled in this study and categorized into the non-lymphedema group and the BCRL group, with 98 patients (26.63%) diagnosed with BCRL. Baseline characteristics between the two groups are summarized in Table 2. Significant differences were observed in variables including age, BMI, number of positive lymph nodes, number of dissected lymph nodes, hypertension status, pathological type, clinical stage, T stage, N stage, type of surgery, lymph node dissection level, type of lymph node surgery, neoadjuvant chemotherapy, adjuvant chemotherapy, postoperative radiotherapy, endocrine therapy, postoperative complications, frequency of postoperative exercise, BCRL-related health education, and avoidance of heavy lifting (p < 0.05). Additionally, baseline characteristics of the training and validation sets are presented in Table 3, with no statistically significant differences between the two sets (p > 0.05).
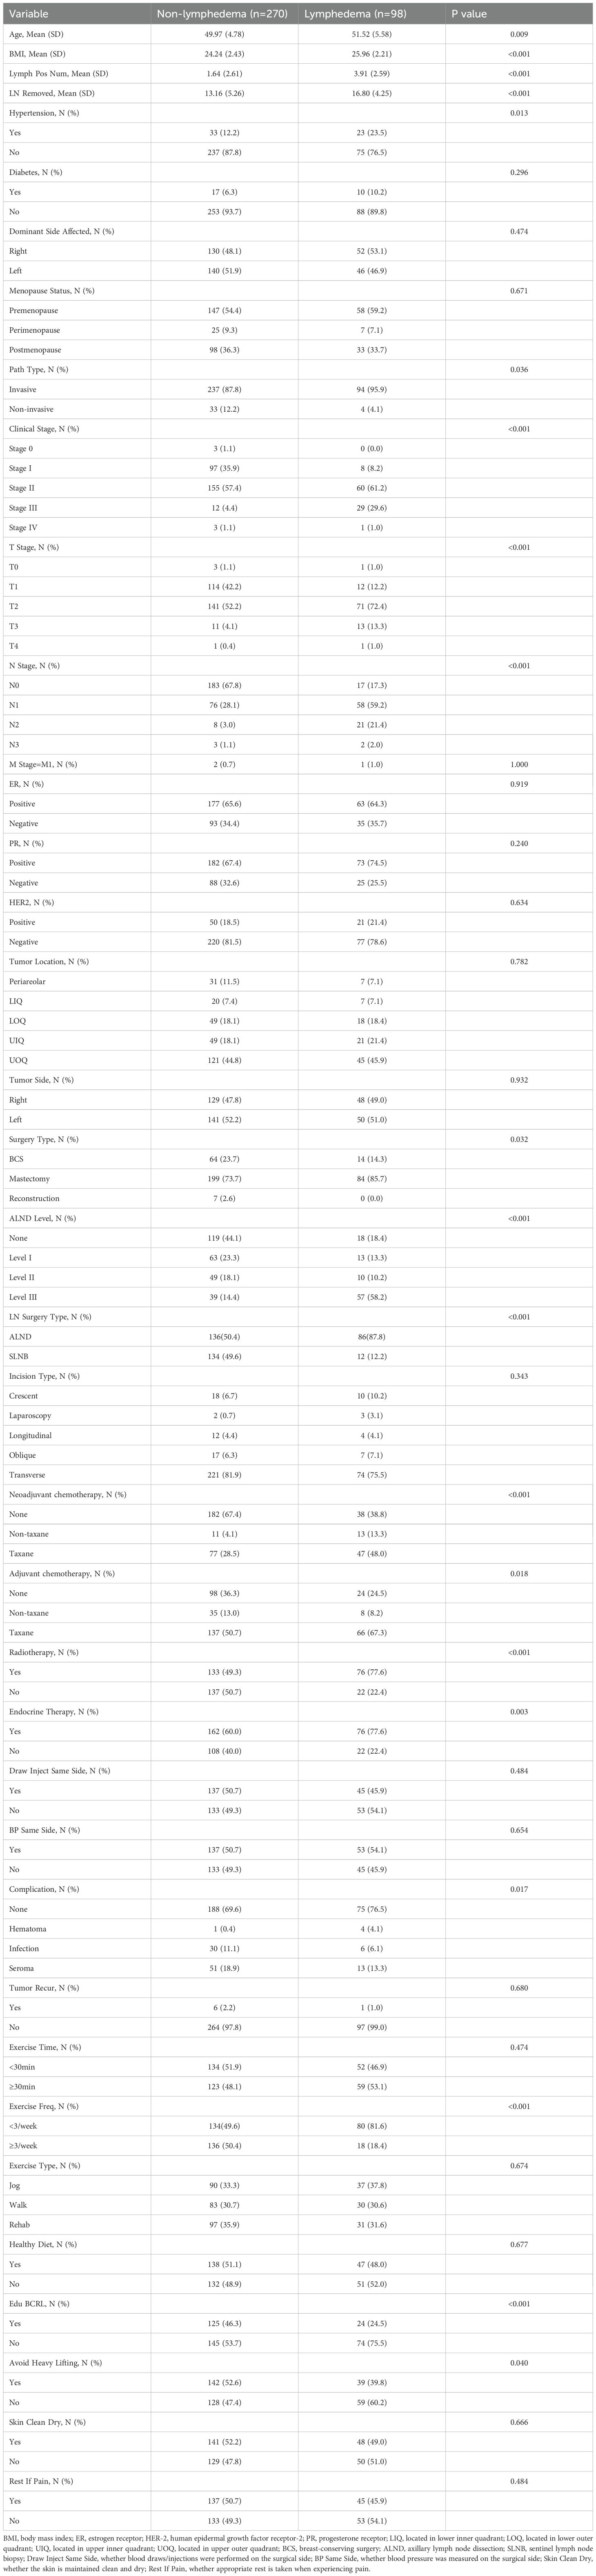
Table 2. Comparison of demographic, disease, and treatment information of postoperative breast cancer patients between different groups.
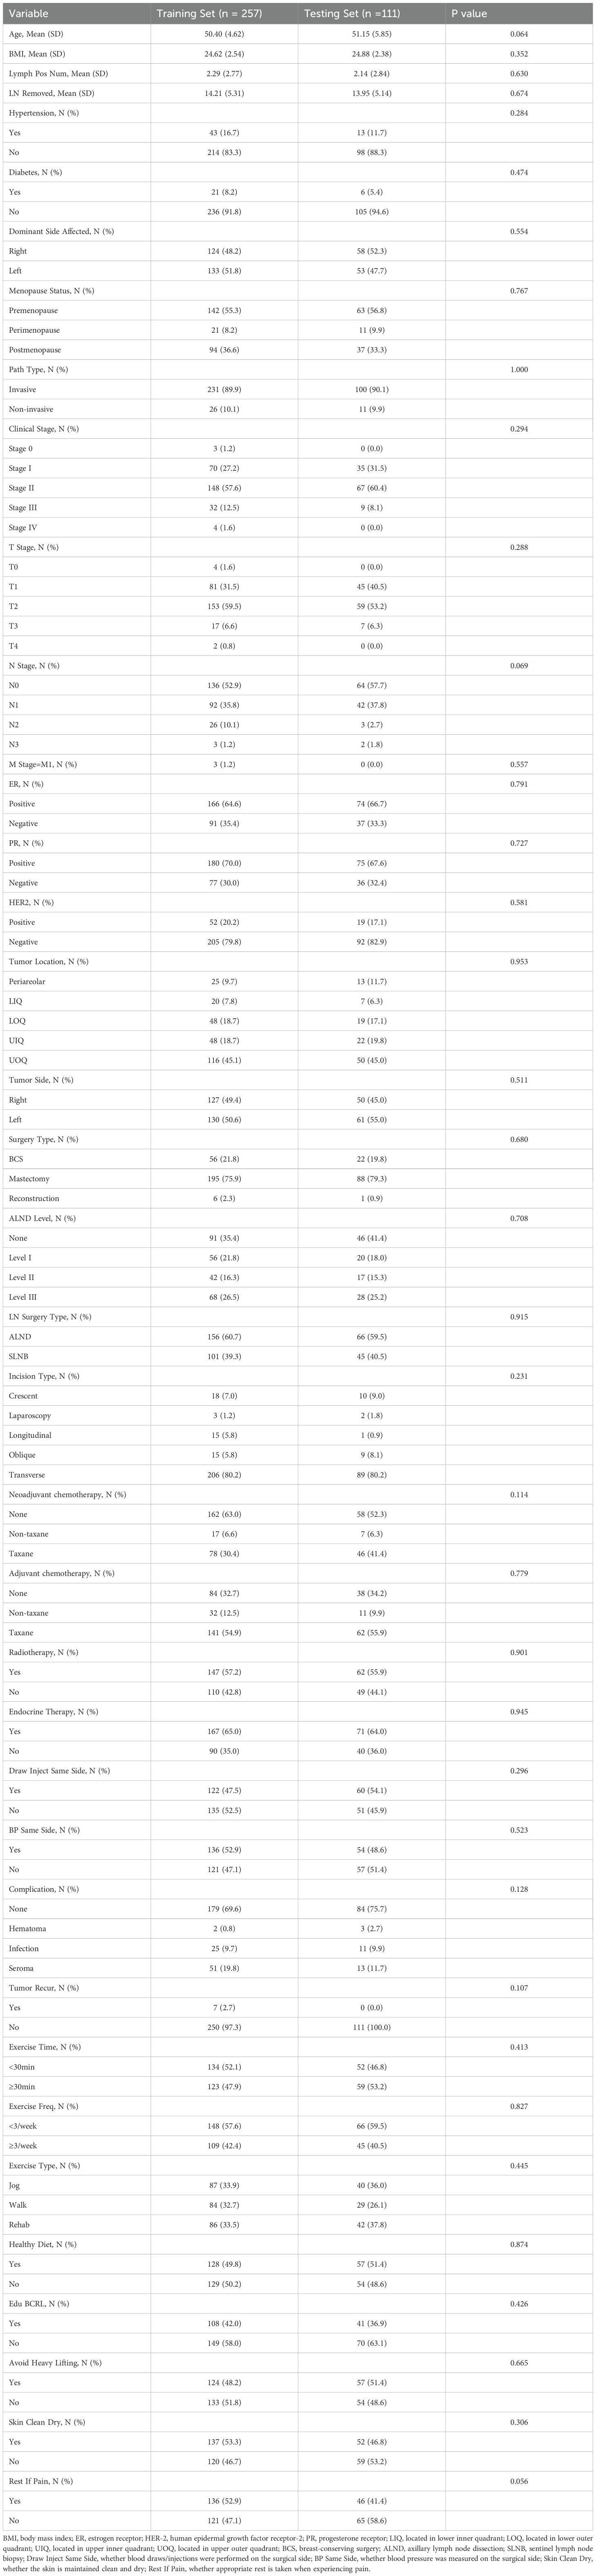
Table 3. Baseline characteristics in training cohort and testing cohort.
Identification of risk factors
LASSO regression was applied for feature selection, and optimal model parameters were determined via cross-validation to minimize overfitting and resolve multicollinearity issues (14). Based on the minimum lambda value of 0.037 within one standard error, 12 variables were selected from the initial 38 predictors. These included BMI, number of positive lymph nodes, number of dissected lymph nodes, clinical stage, N stage, lymph node dissection level, lymph node surgery type, neoadjuvant chemotherapy, postoperative radiotherapy, endocrine therapy, frequency of postoperative exercise, and BCRL-related health education (Figure 1).
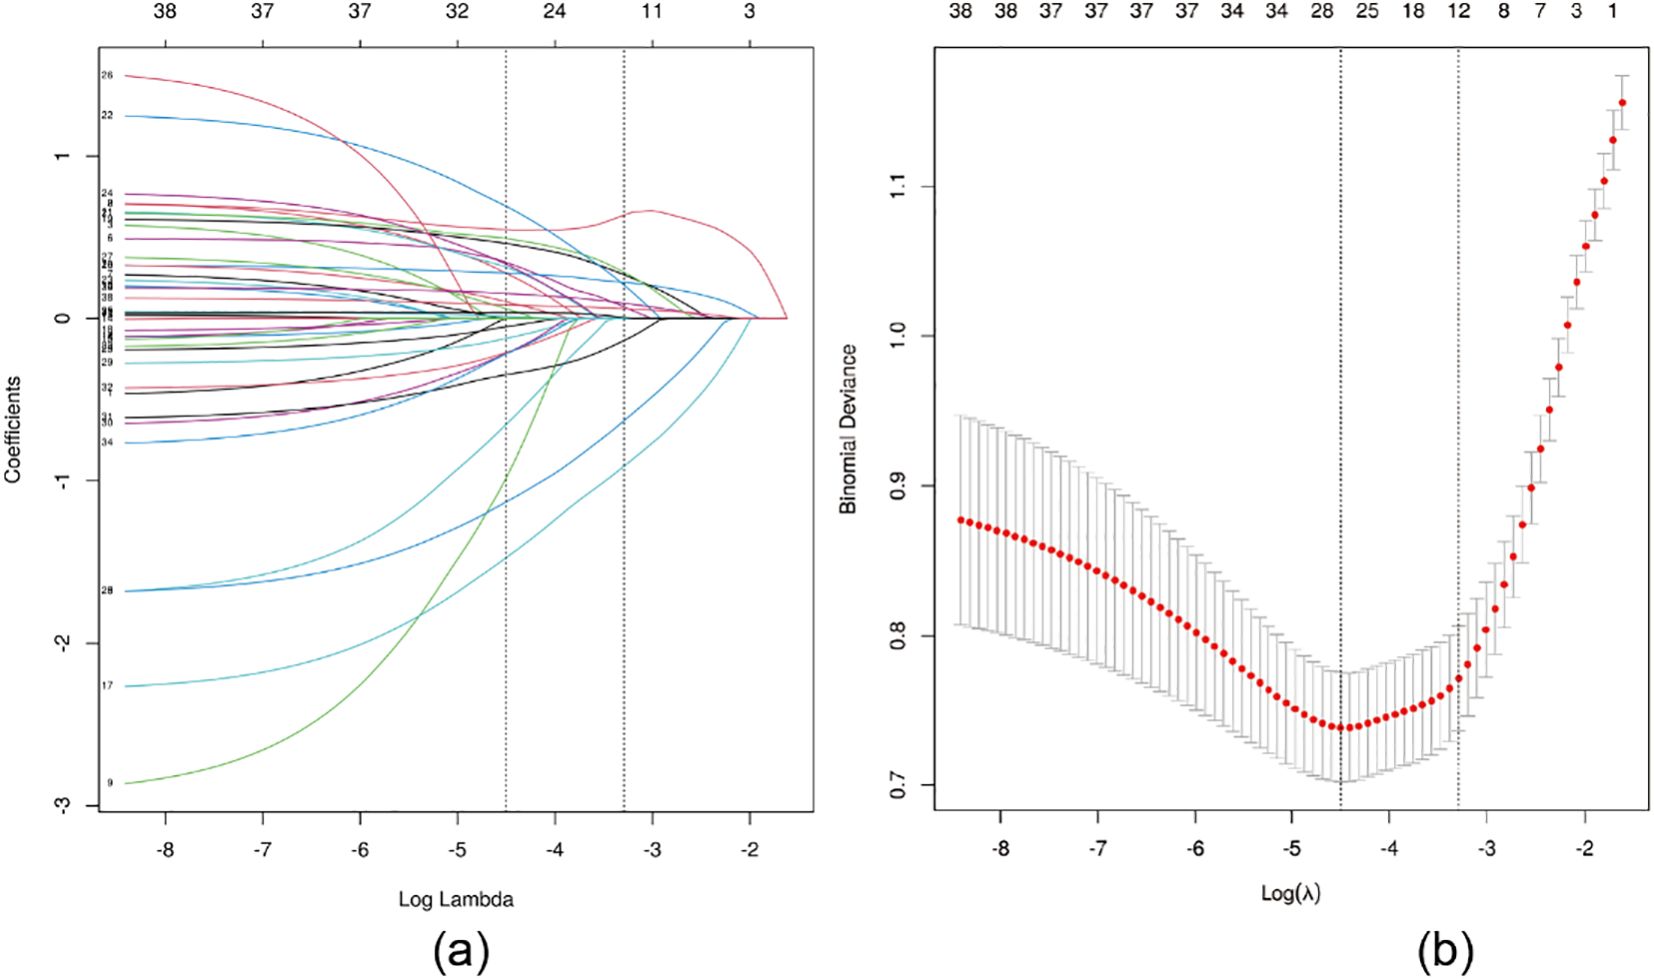
Figure 1. LASSO regression analysis was used to select characteristic factors. (A) The use of 10-fold cross-validation to draw vertical lines at selected values, where the optimal lambda produces 12 nonzero coefficients. (B) In the LASSO model, the coefficient profiles of 38 texture features were drawn from the log (λ) sequence. Vertical dotted lines are drawn at the minimum mean square error (λ = 0.011) and the standard error of the minimum distance (λ = 0.037).
Comprehensive evaluation of model performance
Nine machine learning algorithms—XGBoost, Logistic Regression, Random Forest, Decision Tree, Gaussian Naive Bayes (GNB), Support Vector Machine (SVM), k-Nearest Neighbor (KNN), Multilayer Perceptron (MLP), and LightGBM—were used to build predictive models on the training set and internally validated on the testing set. Grid search combined with 10-fold cross-validation was employed to optimize model performance. Model discrimination was primarily evaluated using the area under the curve (AUC) of the receiver operating characteristic (ROC) (15). Results showed that XGBoost, LightGBM, and Random Forest had the highest AUCs in the training set, while Logistic Regression and LightGBM performed best in the testing set (Figures 2A, B). Additional details on the performance metrics of all nine models are provided in Supplementary Table 1. The results indicate that complex ensemble models such as XGBoost, LightGBM, Random Forest, and Decision Tree achieved near-perfect performance in the training set (AUC: 1.00), but their performance decreased markedly in the validation set, with notable declines in accuracy and F1 scores, suggesting potential overfitting. In contrast, the Logistic Regression model demonstrated remarkable stability, with performance metrics remaining balanced and consistent between the training and validation sets, supporting its selection as the final optimized model. As AUC reflects predictive accuracy but not necessarily clinical utility (16), further assessments were conducted using decision curve analysis (DCA), calibration plots, and precision-recall (PR) curves.
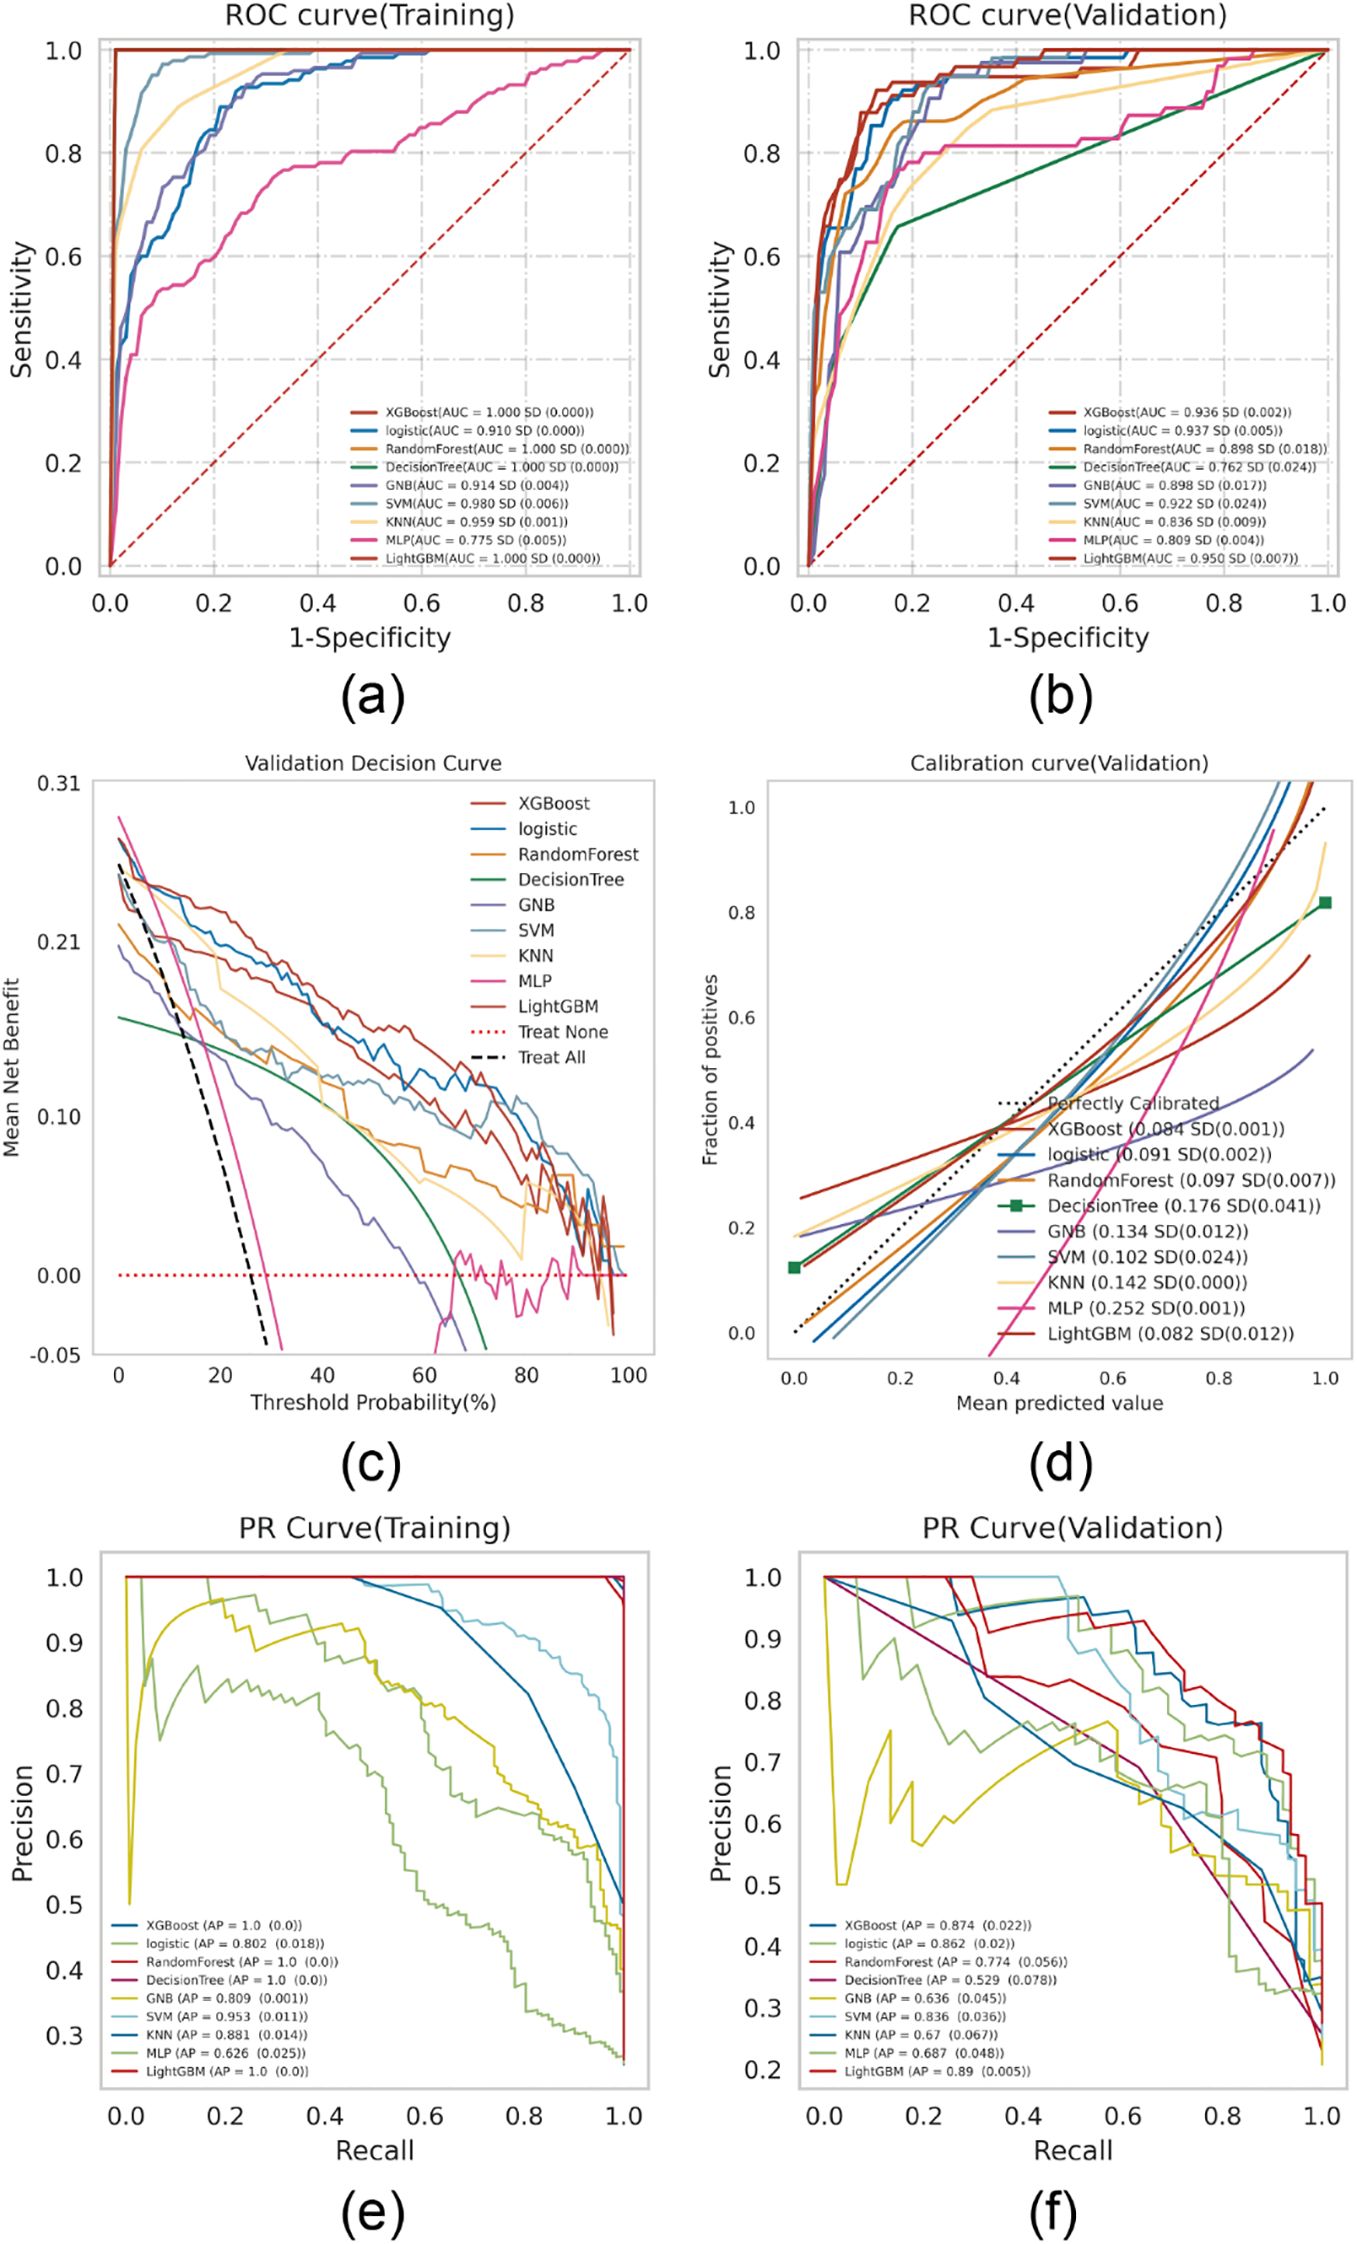
Figure 2. ML model comprehensive analysis. (A) Training sets ROC and AUC and (B) Testing sets ROC and AUC. Breast cancer patients were sampled 10 times at a ratio of 7:3. (C) Test set DCA where the black dotted line represents the assumption that all patients have BCRL and the red dotted line represents the assumption that no patient has BCRL. The remaining solid lines represent different models. (D) For the calibration curve of the test set, the abscissa is the average prediction probability, the case coordinate is the actual probability of the event, the dashed diagonal is the reference line, and the other smooth solid lines are the different model fitting lines. The closer the fitting line is to the reference line, the smaller the value in brackets is, the more accurate the model prediction value is. (E) Training set PR curve and AP and (F) testing set PR curve and AP. The y-axis is precision and the x-axis is recall. If the PR curve of one model is completely covered by the PR curve of another model, it can be concluded that the latter is better than the former, and the higher the AP value, the better the model performance. The different colors in the picture represent the corresponding model.
DCA revealed that both Logistic Regression and XGBoost demonstrated superior clinical utility (Figure 2C). Calibration plots indicated that the predictive accuracy of XGBoost, Logistic Regression, and LightGBM was higher than other models (Figure 2D). Furthermore, a comprehensive analysis incorporating the above results and the average precision (AP) values from both the training and testing sets (Figures 2E, F) suggests that XGBoost and LightGBM are likely to exhibit overfitting. In contrast, logistic regression demonstrates relatively better stability and can be considered the optimal model.
Construction and evaluation of the optimal model
Logistic regression analysis with 10-fold cross-validation was performed on the training set. The model achieved a mean AUC of 0.920 in the training set, 0.895 in the validation set, and 0.916 in the testing set (Figures 3A–C). The AUC values remained stable around 0.9 across all subsets, indicating high predictive accuracy. Given that the AUC in the validation set was not substantially lower than that of the testing set (within a 10% threshold), the model was considered well-fitted. Learning curves confirmed a good fit and high stability between the training and validation sets (17) (Figure 3D). These results support the suitability of the logistic regression model for classification tasks in this dataset.
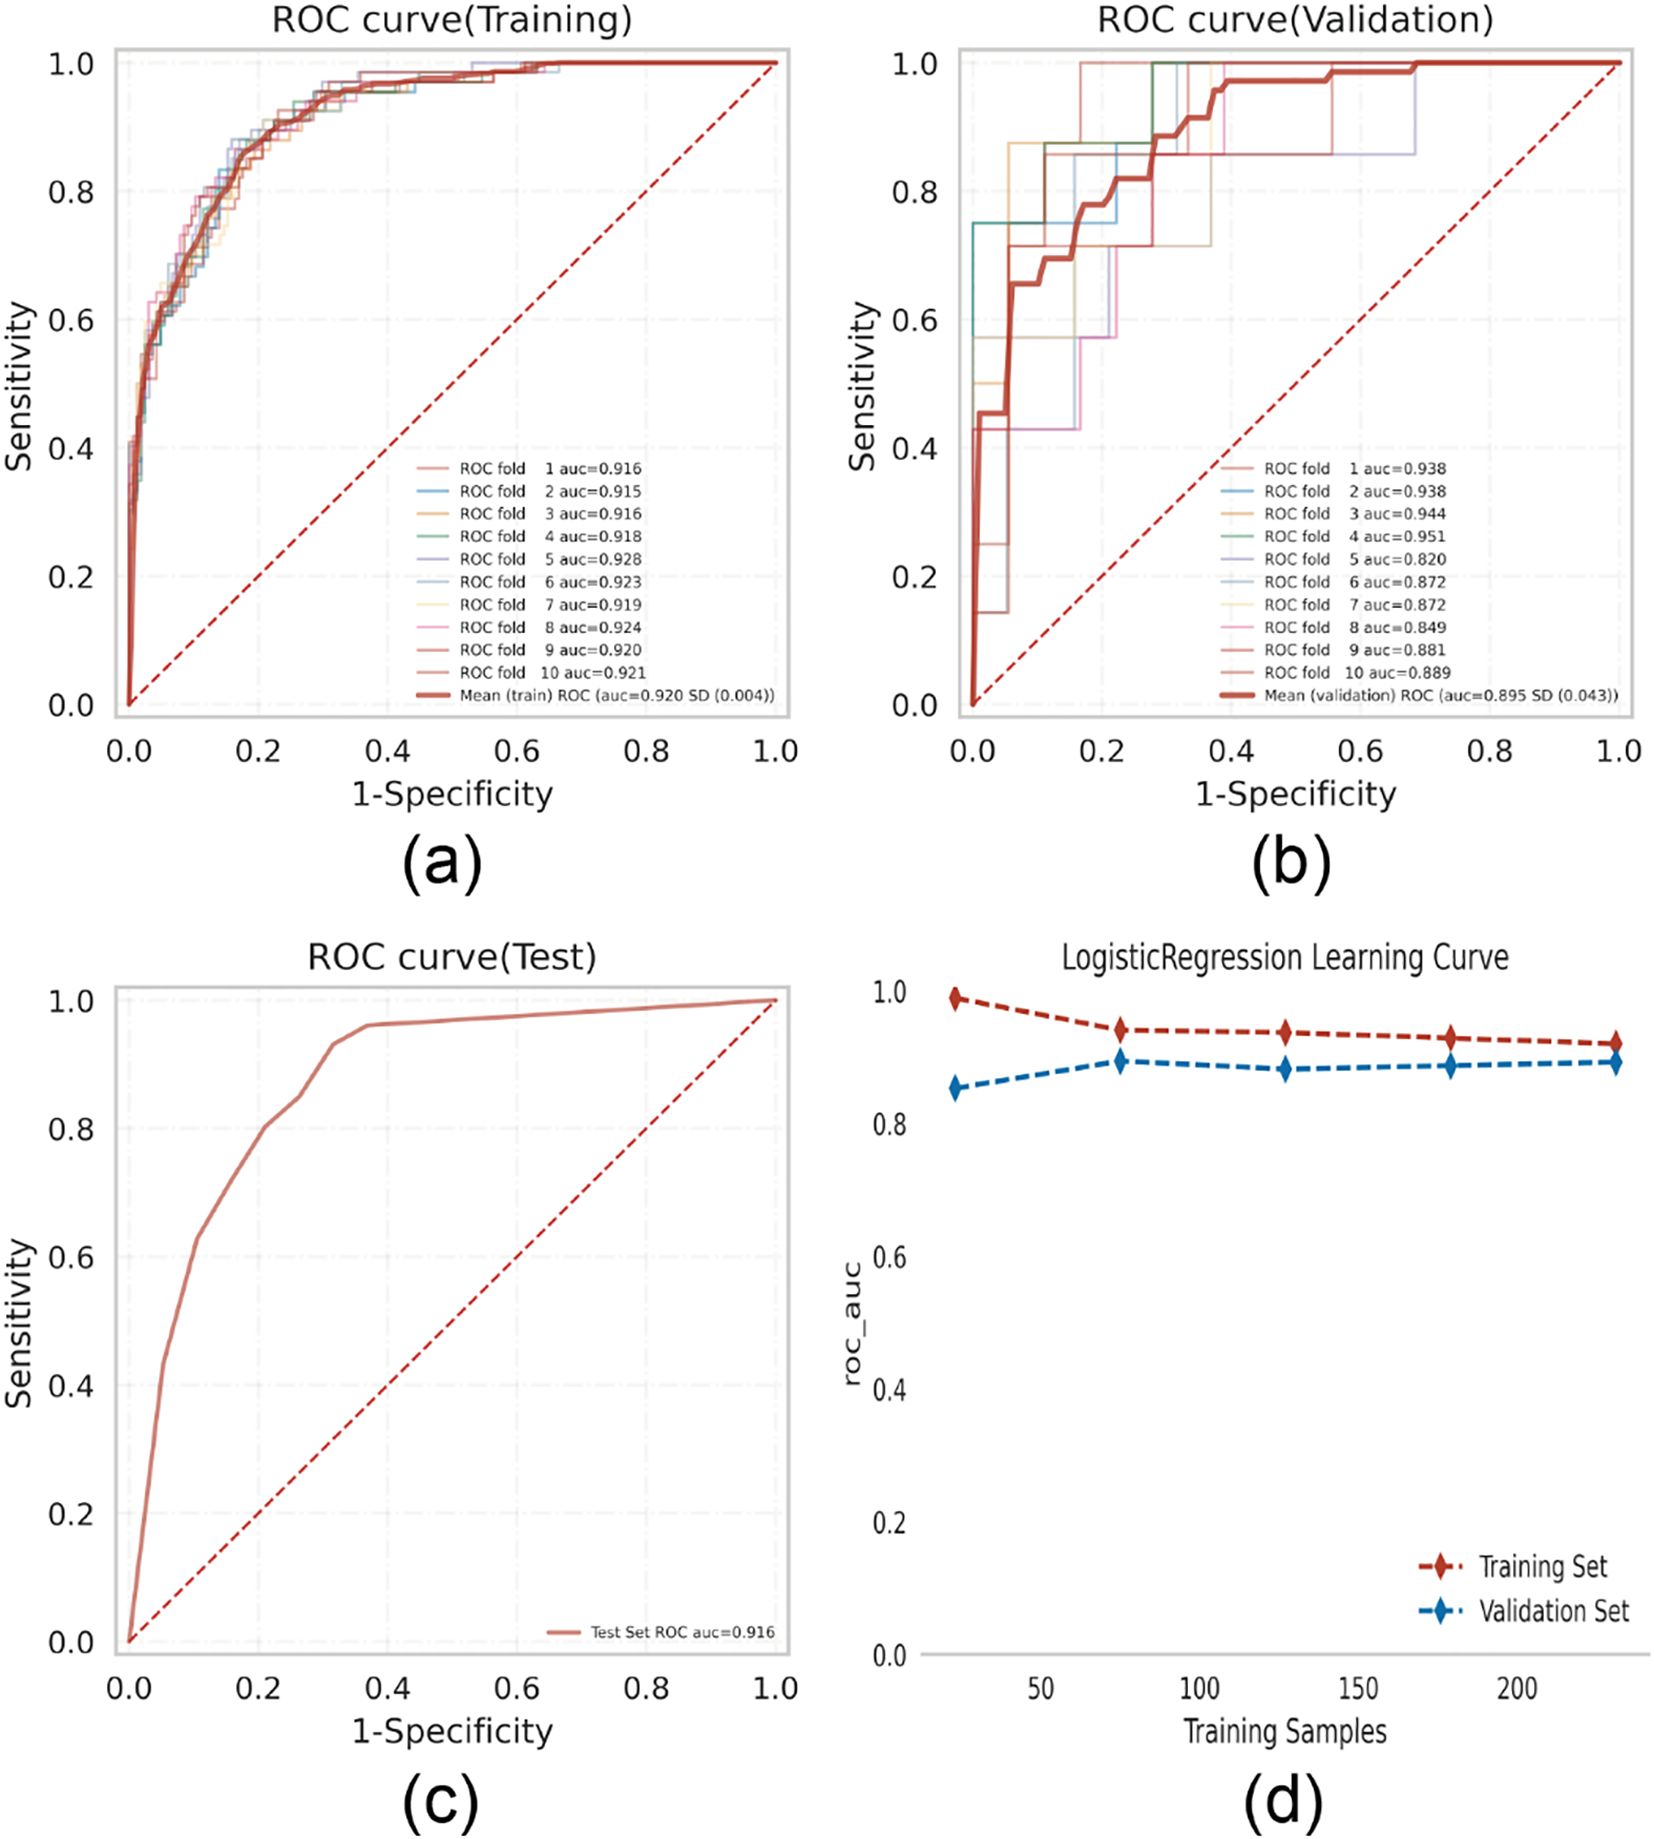
Figure 3. Logistic regression model training, validation, and testing. (A) Training sets ROC and AUC and (B) validation sets ROC and AUC. Training and cross-validation of 10% of breast cancer patients. Solid lines of different colors represent 10 different results. (C) Test set ROC and AUC. Test results for 30% of gout patients. (D) Learning curve. The red dashed line represents the training set and the blue dashed line represents the validation set.
SHAP-based model interpretation
To visually interpret the contributions of each selected variable, SHAP analysis was performed to illustrate how individual features influenced BCRL prediction within the model. As shown in Figure 4A, the top 12 predictive features were plotted, where each dot represents an individual patient’s contribution to the model output, with red indicating higher risk and blue indicating lower risk. Increased BMI, lymph node dissection level, number of positive lymph nodes, N stage, and clinical stage were all associated with elevated BCRL risk.
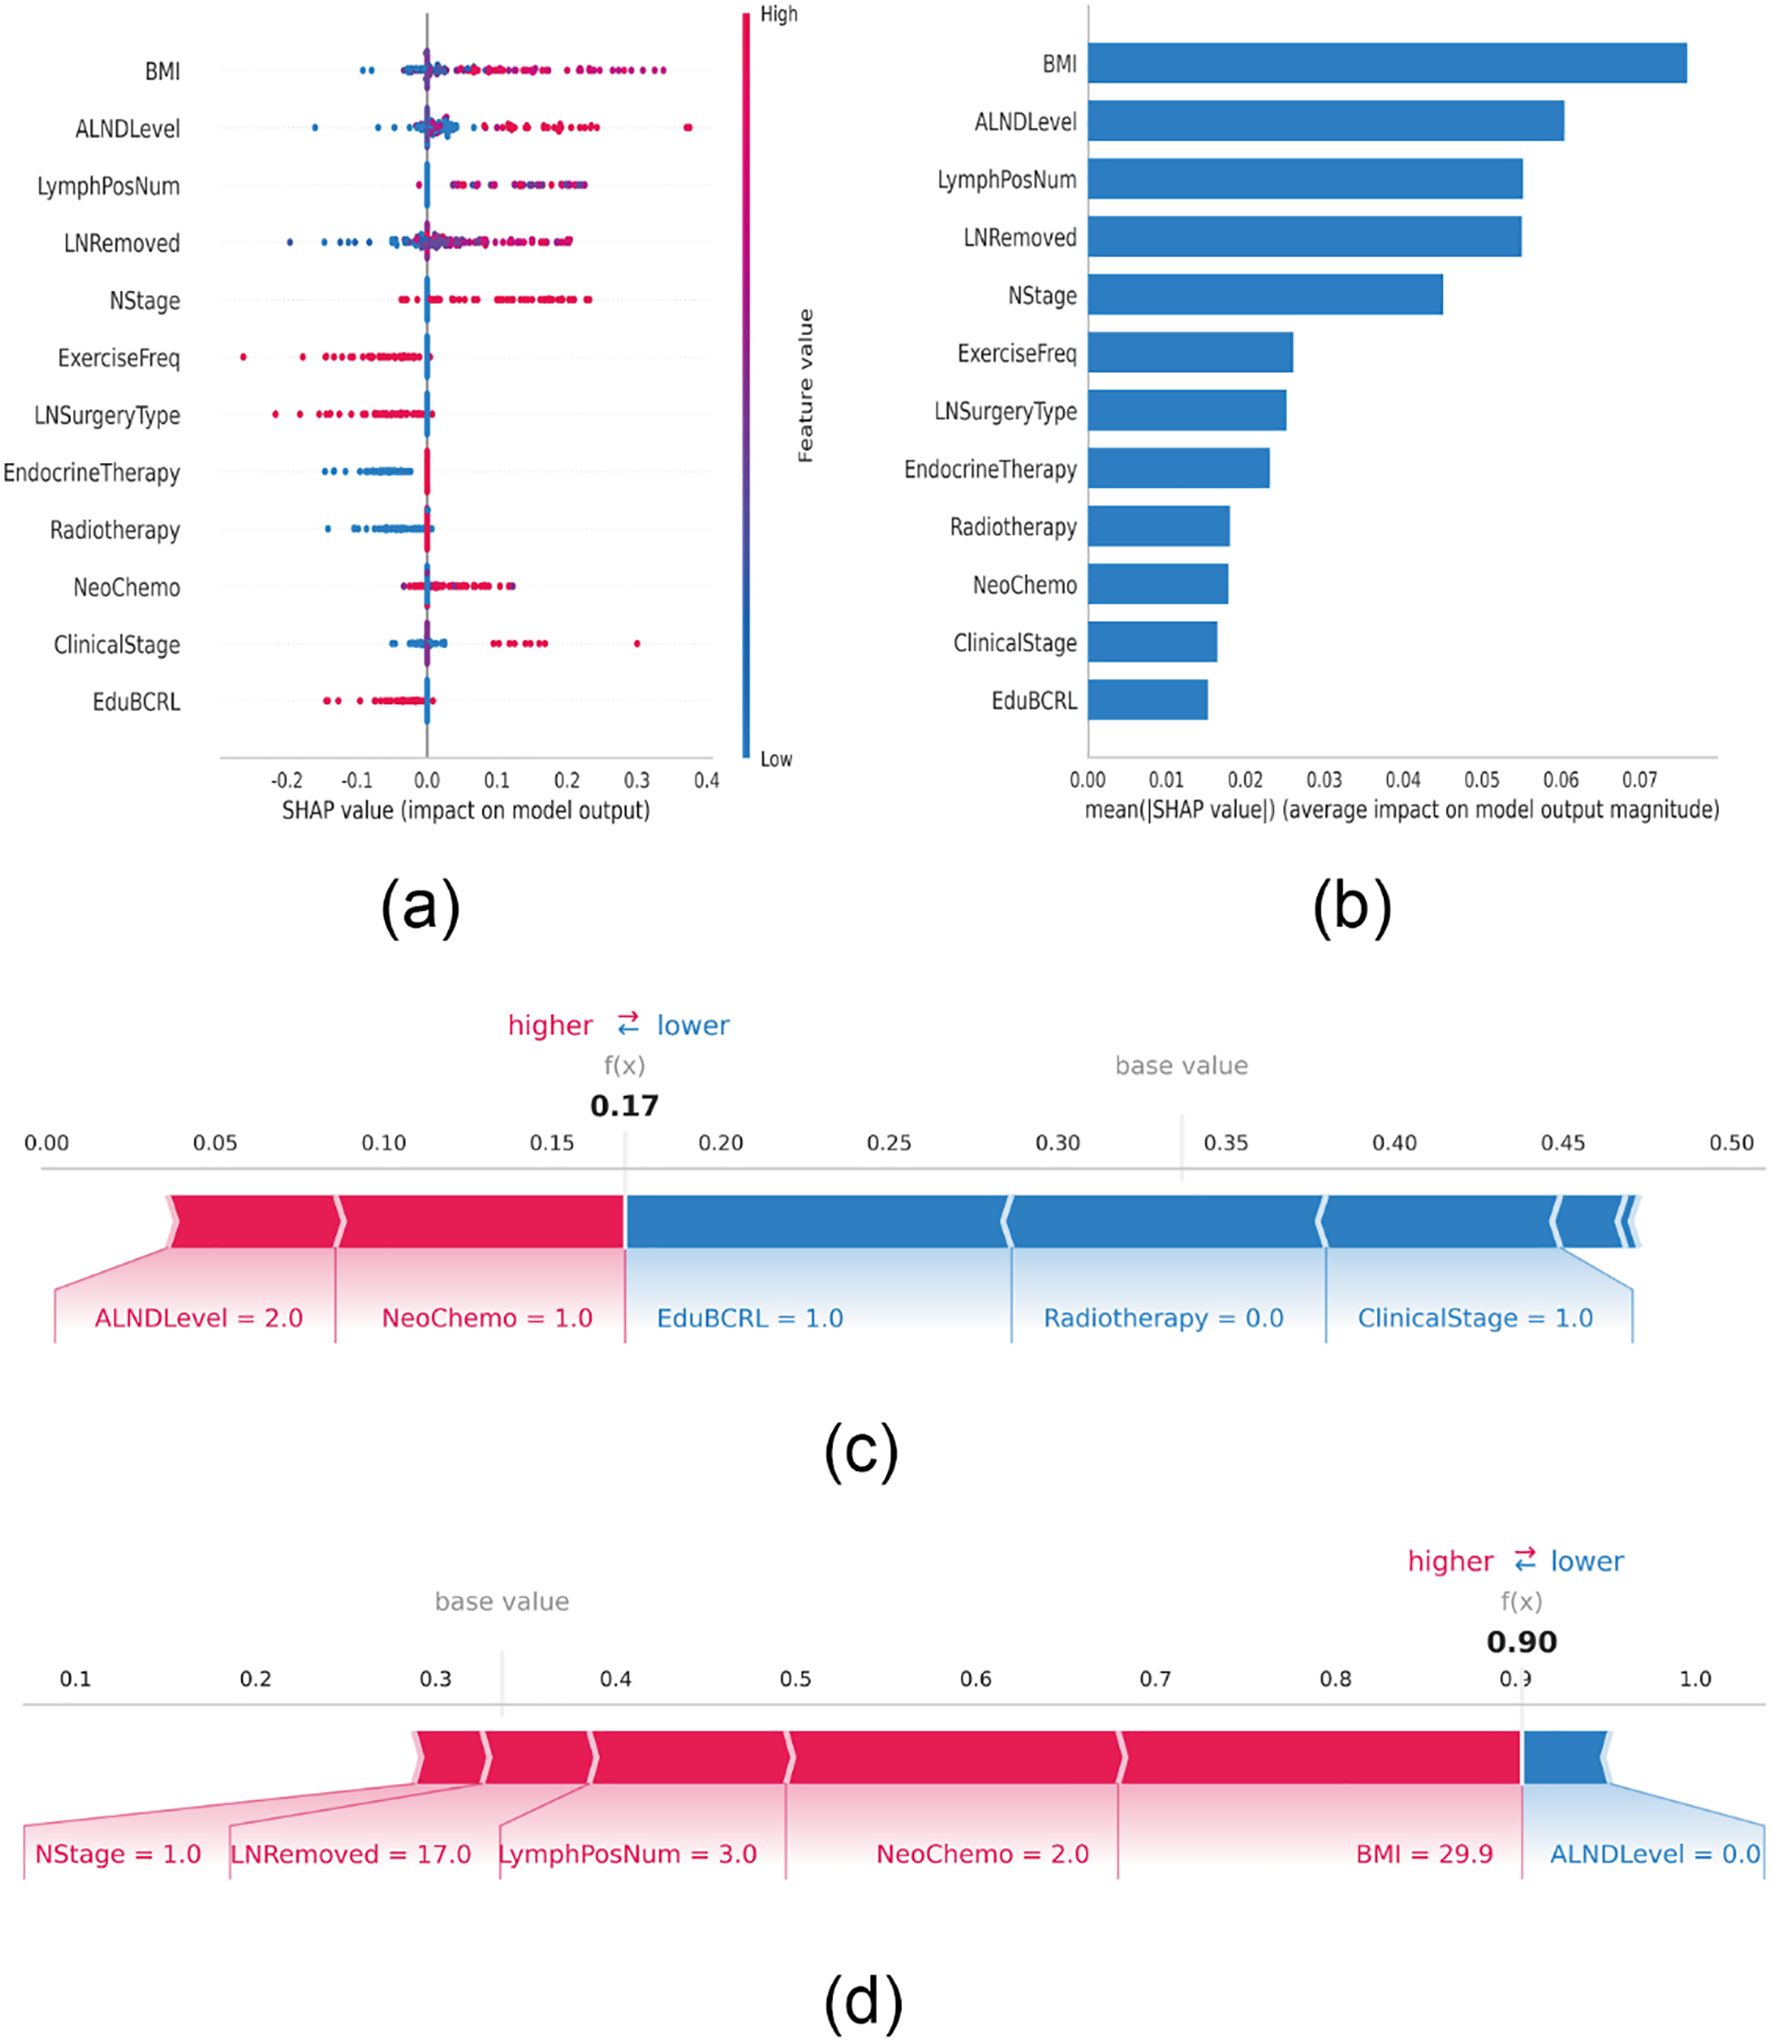
Figure 4. SHAP interprets the model. (A) Attributes of characteristics in SHAP. Each line represents a feature, and the abscissa is the SHAP value. Red dots represent higher eigenvalues and blue dots represent lower eigenvalues. (B) Feature importance ranking as indicated by SHAP. The matrix diagram describes the importance of each covariate in the development of the final prediction model. (C) Individual efforts by patients without BCRL and (D) with BCRL. The SHAP value represents the predictive characteristics of individual patients and the contribution of each to the predictive disease prevalence. The number in bold is the probability forecast value (f(x)), while the base value is the predicted value without providing input to the model. F(x) is the logarithmic ratio of each observation. Red features indicate increased risk of disease and blue features indicate reduced risk of disease. The length of the arrows helps visualize the extent to which the prediction is affected. The longer the arrow, the greater the effect.
Figure 4B ranks the 12 risk factors based on their average absolute SHAP values, with the X-axis representing their relative importance in the model. It is important to note that SHAP values inherently represent the contribution of each feature to the model’s output. Their magnitude is relative rather than absolute, and features with larger absolute SHAP values indicate a stronger influence on the predicted outcome for a specific patient. To further demonstrate model interpretability, two representative patient cases are presented. One patient without BCRL had a low SHAP prediction score of 0.17, characterized by multiple protective features, including participation in BCRL-related health education, absence of radiotherapy, and an early clinical stage (Stage I). These factors collectively lowered the predicted risk from the baseline value, with the lengths of the blue bars reflecting the “pulling effect” of each protective factor in reducing risk (Figure 4C). In contrast, another patient diagnosed with BCRL had a high score of 0.90, exhibiting several risk-enhancing features, including a high BMI (29.9 kg/m²), regional lymph node metastasis (N1), extensive lymph node dissection, three positive lymph nodes, and neoadjuvant chemotherapy with a taxane regimen. These factors substantially increased the predicted probability, with the lengths of the red bars visually indicating the “pushing effect” of each risk factor in elevating disease risk (Figure 4D).
Furthermore, to present a comprehensive clinical decision support workflow, we translated our machine learning model into actionable clinical practice (Supplementary Figure S1). The framework begins with comprehensive data collection encompassing 38 variables, identifies 12 key predictive factors via LASSO regression to optimize model efficiency, and integrates SHAP-based explanations to support individualized risk profiling. This provides a systematic strategy for implementing personalized BCRL prevention in routine breast cancer care.
Discussion
The primary objective of this study is to develop a predictive model for breast cancer-related lymphedema (BCRL) using machine learning algorithms. Twelve clinical variables were selected from an initial set of 38 using LASSO regression to assess the risk of lymphedema in postoperative breast cancer patients. Multiple machine learning models were subsequently implemented and optimized. After comparing performance across AUC, DCA, calibration curves, and PR curves, the logistic regression model demonstrated superior performance compared to other ML models. Furthermore, SHAP values were employed for model interpretability, identifying several key predictors of BCRL. Among them, BMI, axillary lymph node dissection (ALND), and lymph node status showed the highest SHAP values, indicating a greater influence on model prediction and highlighting their clinical relevance.
These findings are consistent with prior research. Multiple retrospective cohort studies have identified BMI as the most significant patient-related risk factor for BCRL and emphasized weight reduction as a preventive strategy (12, 18). Additionally, another study demonstrated that preoperative BMI influences both the incidence and timing of BCRL. Once BCRL occurs, patients with higher BMI tend to experience slower recovery, with lymphedema persisting in 50.0% of cases after 5 years (19).Mechanistically, obesity has been found to negatively affect lymphatic vessel density, endothelial cell proliferation, lymphatic drainage, collecting vessel pumping efficiency, and macromolecular clearance, all of which contribute to impaired lymphatic absorption (20, 21).
In this study, the second most significant risk factor is the level of axillary lymph node dissection. As a surgical procedure that disrupts the lymphatic network, ALND remains strongly associated with BCRL even after adjusting for the number of dissected lymph nodes (22). Despite advances in early diagnosis and treatment of breast cancer, ALND still results in upper limb lymphedema in 30–50% of patients. This condition is characterized by the abnormal accumulation of protein-rich interstitial fluid, leading to swelling and tissue remodeling (23). The use of breast lymphatic level (BLL)-based ALND, involving stepwise excision of lymph nodes in patients with positive axillary involvement, has been shown to reduce surgical extent while preserving oncological outcomes and potentially lowering BCRL incidence (24).
The influence of lymph node status on the development of BCRL remains a topic of ongoing debate. Our findings indicate that both the number of positive lymph nodes and the number of nodes removed during surgery are important risk factors. According to Huang et al., axillary lymph node status significantly impacts treatment and prognosis in breast cancer, likely due to broader dissection ranges, increased numbers of positive nodes, and the use of radiotherapy or chemotherapy (25). These observations are consistent with our results. A high number of positive lymph nodes (>8) may serve as a surrogate marker for extensive lymphatic metastasis and treatment-related injury, often necessitating more aggressive ALND, which increases the risk of BCRL (26, 27). Multivariate analysis conducted by Kwan et al. further supports the prognostic value of pathological lymph node counts in predicting BCRL severity. These identifiable risk factors enable reliable prediction of BCRL and support more tailored treatment planning by clinicians (6, 28).
Additionally, this study is the first to incorporate postoperative health behavior factors—such as rehabilitation exercises, limb management, and lifestyle interventions—into model development, revealing their potential protective effects. Behavioral factors such as “not ignoring upper limb swelling,” “avoiding strenuous activity of the affected limb,” “avoiding lifting heavy objects with the affected limb,” and “avoiding fatigue of the affected limb” are significantly associated with reduced BCRL risk. This may be due to excessive use of the affected limb causing increased muscle tension, which impairs lymphatic return and triggers lymphedema (29). Previous studies have shown that early, structured rehabilitative exercise enhances blood and lymphatic circulation, reducing interstitial lymph accumulation and the severity of lymphedema (30).The current study further verifies these findings using quantitative machine learning models.
In this study, we observed a cumulative incidence of BCRL of 26.63%, which aligns closely with reports from multiple high-quality studies. For example, a systematic review and meta-analysis including 21 studies on BCRL reported a wide range of incidence rates from 6.4% to 76.3% (7). Recent large-scale cohort studies, such as those by Li et al. (31), Wu et al. (32) and Martínez-Jaimez et al. (18), reported pooled incidence rates of approximately 25%–30%, which are highly consistent with our findings. However, some studies focusing on modern surgical techniques, such as the widespread adoption of SLNB, reported lower incidence rates (6.4%–12.5%) (33). The relatively higher incidence in our cohort can be reasonably explained by several key factors. First, the surgical population composition: a considerable proportion of patients in our cohort underwent ALND, which remains a major risk factor for BCRL. Although SLNB has become the standard procedure for early-stage patients, ALND remains the routine approach for patients with clinically positive lymph nodes or metastatic sentinel nodes (34). The proportion of ALND in our study is consistent with other studies focusing on populations requiring this procedure. Second, the sensitivity of diagnostic criteria: we used arm circumference measurement (≥2.0 cm difference) as the diagnostic criterion for BCRL, a method widely used in clinical practice due to its simplicity and good clinical relevance. Compared with stricter objective methods, such as bioimpedance spectroscopy (BIS) or measurements using <2.0 cm thresholds, this method is more sensitive and may capture mild to moderate cases (35). Third, the impact of radiotherapy: a relatively high proportion of patients in our cohort received adjuvant radiotherapy, particularly targeting the axillary or supraclavicular regions. Regional lymph node irradiation is known to significantly increase the risk of lymphatic injury and fibrosis, acting synergistically with surgery to elevate BCRL risk (36). Finally, BCRL is a late-onset complication, with risk persisting for several years postoperatively. The relatively long follow-up period in our study ensured adequate capture of late-onset cases, which may be underestimated in studies with shorter follow-up durations. Taken together, the 26.63% incidence reported in our study accurately reflects the disease burden of BCRL in a modern cohort that includes patients at intermediate to high risk (e.g., those undergoing ALND and radiotherapy), employs sensitive clinical diagnostic criteria, and has been followed longitudinally. This comparison underscores the importance of considering differences in patient populations, treatment modalities, diagnostic criteria, and follow-up strategies when interpreting and comparing BCRL incidence across studies.
Strengths and limitations of the study
Compared with traditional statistical approaches, machine learning models demonstrated superior predictive performance in this study. Among nine tested models, logistic regression showed the best balance between predictive accuracy and classification ability, likely due to the strict inclusion criteria that minimized model noise. Notably, SHAP analysis allowed for the quantification of each predictor’s contribution, enabling the model to be not only predictive but also interpretable. This transparency is essential for clinical risk assessment and facilitates the development of individualized follow-up and intervention plans.
Nevertheless, several limitations should be acknowledged. First, as a retrospective study, selection bias may exist. Second, the dataset was derived from a single center with a relatively small sample size, which may limit generalizability. Third, some variables—such as frequency of limb usage and subjective sensory scores—were based on patient records and follow-up interviews and may be prone to measurement bias. Lastly, the model did not include imaging indicators such as lymphangiography or elastography, which could provide additional objective data and further improve predictive accuracy and clinical relevance in future research.
To address the concern regarding the generalizability of findings derived from a single-center cohort, we compared the main demographic and clinical characteristics of our study population with those reported in large national and international breast cancer cohorts. The mean BMI values in the Non-lymphedema group (24.24 kg/m²) and the Lymphedema group (25.96 kg/m²) in our study were comparable to those reported in two large prospective Chinese cohorts (37, 38) and a multicenter case–control study conducted in the United States (39). In addition, the prevalence of axillary lymph node dissection (ALND) in our cohort was consistent with the rates reported in a recent systematic review and meta-analysis of regional therapies for breast cancer (40), reflecting contemporary surgical practice in which ALND remains applied to selected patients despite the increasing adoption of sentinel lymph node biopsy (SLNB). Meanwhile, the distribution of clinical stages and the proportion of patients receiving adjuvant chemotherapy or radiotherapy were also in line with the characteristics described in a recent retrospective study of breast cancer populations (12). Collectively, these comparisons indicate that although our study was conducted within a single institution, the sample shares similar demographic and clinical features with broader breast cancer populations, supporting the potential external validity and generalizability of our predictive model.
Therefore, future studies should aim to conduct multi-center, prospective cohort investigations and integrate multi-dimensional data, including imaging, genomics, and behavioral monitoring. Embedding such predictive models into clinical follow-up systems to enable dynamic postoperative risk evaluation and personalized alerts will be critical for real-world implementation.
Conclusion
In this study, a machine learning–based individualized prediction model for postoperative lymphedema in breast cancer patients has been successfully developed, demonstrating robust predictive performance and promising clinical applicability. Additionally, SHAP-based interpretation facilitates personalized risk assessment for BCRL among breast cancer patients. This effective, computer-assisted approach may serve as an important tool for precision rehabilitation management and represents a shift from empirical prevention strategies toward data-driven clinical decision-making.
Data availability statement
The raw data supporting the conclusions of this article will be made available by the authors, without undue reservation.
Ethics statement
The studies involving human participants were reviewed and approved by the Ethics Committee of Jiangxi Cancer Hospital. Written informed consent to participate in this study was provided by the participants or their legal guardians/next of kin.
Author contributions
XP: Conceptualization, Data curation, Formal Analysis, Writing – original draft, Investigation. YA: Data curation, Formal Analysis, Writing – original draft, Investigation. WX: Conceptualization, Data curation, Supervision, Writing – review & editing. JH: Formal Analysis, Investigation, Writing – original draft. QL: Formal Analysis, Investigation, Writing – original draft. JL: Formal Analysis, Investigation, Writing – original draft.
Funding
The author(s) declare that no financial support was received for the research, and/or publication of this article.
Conflict of interest
The authors declare that the research was conducted in the absence of any commercial or financial relationships that could be construed as a potential conflict of interest.
Generative AI statement
The author(s) declare that no Generative AI was used in the creation of this manuscript.
Any alternative text (alt text) provided alongside figures in this article has been generated by Frontiers with the support of artificial intelligence and reasonable efforts have been made to ensure accuracy, including review by the authors wherever possible. If you identify any issues, please contact us.
Publisher’s note
All claims expressed in this article are solely those of the authors and do not necessarily represent those of their affiliated organizations, or those of the publisher, the editors and the reviewers. Any product that may be evaluated in this article, or claim that may be made by its manufacturer, is not guaranteed or endorsed by the publisher.
Supplementary material
The Supplementary Material for this article can be found online at: https://www.frontiersin.org/articles/10.3389/fonc.2025.1729340/full#supplementary-material
Supplementary Figure 1 | Clinical decision support workflow for breast cancer-related lymphedema risk assessment.Comprehensive five-stage framework for implementing machine learning-based BCRL risk prediction in clinical practice: (1) Patient Assessment: multimodal data collection; (2) Feature Extraction: automated processing of 12 validated predictors; (3) Model Prediction: individualized risk computation with SHAP interpretability; (4) Risk Interpretation: visualization of feature contributions and modifiable factors; (5) Clinical Action: personalized prevention strategies based on identified risk profile. This workflow bridges predictive analytics with clinical decision-making to enable precision prevention of BCRL.
References
1. Kim J, Harper A, McCormack V, Sung H, Houssami N, Morgan E, et al. Global patterns and trends in breast cancer incidence and mortality across 185 countries. Nat Med. (2025) 31:1154–62. doi: 10.1038/s41591-025-03502-3
2. DiSipio T, Rye S, Newman B, and Hayes S. Incidence of unilateral arm lymphoedema after breast cancer: a systematic review and meta-analysis. Lancet Oncol. (2013) 14:500–15. doi: 10.1016/S1470-2045(13)70076-7
3. Shen A, Lu Q, Fu X, Wei X, Zhang L, Bian J, et al. Risk factors of unilateral breast cancer-related lymphedema: an updated systematic review and meta-analysis of 84 cohort studies. Support Care can: Off J Multination Assoc Support Care Cancer. (2022) 31:18. doi: 10.1007/s00520-022-07508-2
4. Fanning JE, Givant M, Chen A, Thomson S, Tillotson E, Fleishman A, et al. Major anatomic variations of the lateral upper arm lymphatic pathway in a healthy female population. Breast Cancer (Tokyo Jpn). (2025) 32:1125-31. doi: 10.1007/s12282-025-01742-2
5. Gursen C, Dylke ES, Moloney N, Meeus M, De Vrieze T, Devoogdt N, et al. Self-reported signs and symptoms of secondary upper limb lymphoedema related to breast cancer treatment: Systematic review. Eur J Cancer Care. (2021) 30:e13440. doi: 10.1111/ecc.13440
6. Kwan JYY, Famiyeh P, Su J, Xu W, Kwan BYM, Jones JM, et al. Development and validation of a risk model for breast cancer-related lymphedema. JAMA net Open. (2020) 3:e2024373. doi: 10.1001/jamanetworkopen.2020.24373
7. Shen A, Wei X, Zhu F, Sun M, Ke S, Qiang W, et al. Risk prediction models for breast cancer-related lymphedema: A systematic review and meta-analysis. Eur J Oncol nurs: Off J Eur Oncol Nurs Soc. (2023) 64:102326. doi: 10.1016/j.ejon.2023.102326
8. Ting WC, Lu YA, Ho WC, Cheewakriangkrai C, Chang HR, and Lin CL. Machine learning in prediction of second primary cancer and recurrence in colorectal cancer. Int J Med Sci. (2020) 17:280–91. doi: 10.7150/ijms.37134
9. Fu MR, Wang Y, Li C, Qiu Z, Axelrod D, Guth AA, et al. Qiu JM et al: Machine learning for detection of lymphedema among breast cancer survivors. mHealth. (2018) 4:17. doi: 10.21037/mhealth.2018.04.02
10. Luo X, He H, Chen J, Li M, and Yan J. Development and evaluation of a WeChat-based intervention program for prevention of breast cancer-related lymphedema. Support Care can: Off J Multination Assoc Support Care Cancer. (2024) 33:19. doi: 10.1007/s00520-024-09078-x
11. Panchik D, Masco S, Zinnikas P, Hillriegel B, Lauder T, Suttmann E, et al. Effect of exercise on breast cancer-related lymphedema: what the lymphatic surgeon needs to know. J reconstruct microsurg. (2019) 35:37–45. doi: 10.1055/s-0038-1660832
12. Du J, Yang J, Yang Q, Zhang X, Yuan L, and Fu B. Comparison of machine learning models to predict the risk of breast cancer-related lymphedema among breast cancer survivors: a cross-sectional study in China. Front Oncol. (2024) 14:1334082. doi: 10.3389/fonc.2024.1334082
13. Sayko O, Pezzin LE, Yen TW, and Nattinger AB. Diagnosis and treatment of lymphedema after breast cancer: a population-based study. PM R: J injury funct Rehabil. (2013) 5:915–23. doi: 10.1016/j.pmrj.2013.05.005
14. Sauerbrei W, Royston P, and Binder H. Selection of important variables and determination of functional form for continuous predictors in multivariable model building. Stat Med. (2007) 26:5512–28. doi: 10.1002/sim.3148
15. Obuchowski NA and Bullen JA. Receiver operating characteristic (ROC) curves: review of methods with applications in diagnostic medicine. Phys Med Biol. (2018) 63:07tr01. doi: 10.1088/1361-6560/aab4b1
16. Muschelli J. ROC and AUC with a binary predictor: a potentially misleading metric. J classif. (2020) 37:696–708. doi: 10.1007/s00357-019-09345-1
17. Belkin M, Hsu D, Ma S, and Mandal S. Reconciling modern machine-learning practice and the classical bias-variance trade-off. Proc Natl Acad Sci United States America. (2019) 116:15849–54. doi: 10.1073/pnas.1903070116
18. Martínez-Jaimez P, Armora Verdú M, Forero CG, Álvarez Salazar S, Fuster Linares P, Monforte-Royo C, et al. Breast cancer-related lymphoedema: Risk factors and prediction model. J adv Nurs. (2022) 78:765–75. doi: 10.1111/jan.15005
19. Ogiya A, Kimura K, Ueno T, Iwase T, and Ohno S. Time trend of breast cancer-related lymphedema according to body mass index. Eur J Surg Oncol J Eur Soc Surg Oncol Br Assoc Surg Oncol. (2024) 50:108350. doi: 10.1016/j.ejso.2024.108350
20. Sudduth CL and Greene AK. Lymphedema and obesity. Cold Spring Harbor Perspect Med. (2022) 12:a041176. doi: 10.1101/cshperspect.a041176
21. Arngrim N, Simonsen L, Holst JJ, and Bülow J. Reduced adipose tissue lymphatic drainage of macromolecules in obese subjects: a possible link between obesity and local tissue inflammation? Int J Obes (2005). (2013) 37:748–50. doi: 10.1038/ijo.2012.98
22. Shah C, Asha W, and Vicini F. Current diagnostic tools for breast cancer-related lymphedema. Curr Oncol Rep. (2023) 25:151–4. doi: 10.1007/s11912-023-01357-w
23. Sharifi N and Ahmad S. Breast cancer-related lymphedema: A critical review on recent progress. Surg Oncol. (2024) 56:102124. doi: 10.1016/j.suronc.2024.102124
24. Yuan Q, Hou J, He Y, Liao Y, Zheng L, and Wu G. Minimize the extent and morbidity of axillary dissection for node-positive breast cancer patients: implementation of axillary lymph node dissection based on breast lymphatics level. BMC Cancer. (2021) 21:293. doi: 10.1186/s12885-021-08024-y
25. Hua-Ping H, Jian-Rong Z, and Zeng Q. Risk Factors Associated with Lymphedema among Postmenopausal Breast Cancer Survivors after Radical Mastectomy and Axillary Dissection in China. Breast Care (Basel Switzerland). (2012) 7:461–4. doi: 10.1159/000345459
26. He L, Qu H, Wu Q, and Song Y. Lymphedema in survivors of breast cancer. Oncol Lett. (2020) 19:2085–96. doi: 10.3892/ol.2020.11307
27. Karaman S and Detmar M. Mechanisms of lymphatic metastasis. J Clin Invest. (2014) 124:922–8. doi: 10.1172/JCI71606
28. Siotos C, Arnold SH, Seu M, Lunt L, Ferraro J, Najafali D, et al. Antony AK et al: Breast cancer-related lymphedema: A comprehensive analysis of risk factors. J Surg Oncol. (2024) 130:1521–31. doi: 10.1002/jso.27841
29. Radina ME, Armer JM, Culbertson SD, and Dusold JM. Post-breast cancer lymphedema: understanding women’s knowledge of their condition. Oncol Nurs Forum. (2004) 31:97–104. doi: 10.1188/04.ONF.97-104
30. Chen K, Beeraka NM, Zhang X, Sinelnikov MY, Plotnikova M, Zhao C, et al. Recent advances in therapeutic modalities against breast cancer-related lymphedema: future epigenetic landscape. Lymphatic Res Biol. (2023) 21:536–48. doi: 10.1089/lrb.2022.0016
31. Li F, Lu Q, Jin S, Zhao Q, Qin X, Jin S, et al. A scoring system for predicting the risk of breast cancer-related lymphedema. Int J Nurs Sci. (2020) 7:21–8. doi: 10.1016/j.ijnss.2019.12.007
32. Wu X, Guan Q, Cheng ASK, Guan C, Su Y, Jiang J, et al. Comparison of machine learning models for predicting the risk of breast cancer-related lymphedema in Chinese women. Asia-Pac J Oncol Nurs. (2022) 9:100101. doi: 10.1016/j.apjon.2022.100101
33. Gross JP, Whelan TJ, Parulekar WR, Chen BE, Rademaker AW, Helenowski IB, et al. Development and validation of a nomogram to predict lymphedema after axillary surgery and radiation therapy in women with breast cancer from the NCIC CTG MA.20 randomized trial. Int J Radiat oncol biol Phys. (2019) 105:165–73. doi: 10.1016/j.ijrobp.2019.05.002
34. Giuliano AE, Ballman KV, McCall L, Beitsch PD, Brennan MB, Kelemen PR, et al. Blumencranz PW et al: Effect of Axillary Dissection vs No Axillary Dissection on 10-Year Overall Survival Among Women With Invasive Breast Cancer and Sentinel Node Metastasis: The ACOSOG Z0011 (Alliance) Randomized Clinical Trial. Jama. (2017) 318:918–26. doi: 10.1001/jama.2017.11470
35. Shah C, Whitworth P, Valente S, Schwarz GS, Kruse M, Kohli M, et al. Bioimpedance spectroscopy for breast cancer-related lymphedema assessment: clinical practice guidelines. Breast Cancer Res Treat. (2023) 198:1–9. doi: 10.1007/s10549-022-06850-7
36. Abouegylah M, Elemary O, Munir A, Gouda MY, Arafat WO, and Elzawawy S. Evaluation of the effect of axillary radiotherapy dose and the development of lymphedema in breast cancer patients. Breast Care (Basel Switzerland). (2022) 17:364–70. doi: 10.1159/000522243
37. Zou L, Liu FH, Shen PP, Hu Y, Liu XQ, Xu YY, et al. The incidence and risk factors of related lymphedema for breast cancer survivors post-operation: a 2-year follow-up prospective cohort study. Breast Cancer (Tokyo Jpn). (2018) 25:309–14. doi: 10.1007/s12282-018-0830-3
38. Huang HP, Zeng Q, and Zhou JR. Risk factors associated with lymphoedema among Chinese women after breast cancer surgery. Contemp nurse. (2013) 44:5–10. doi: 10.5172/conu.2013.44.1.5
39. Swenson KK, Nissen MJ, Leach JW, and Post-White J. Case-control study to evaluate predictors of lymphedema after breast cancer surgery. Oncol Nurs Forum. (2009) 36:185–93. doi: 10.1188/09.ONF.185-193
Keywords: breast cancer, lymphedema, machine learning, prediction model, cancer
Citation: Peng X, Ai Y, Xu W, Hong J, Li Q and Liu J (2025) Machine learning-based personalized risk prediction model for breast cancer-related lymphedema after surgery. Front. Oncol. 15:1729340. doi: 10.3389/fonc.2025.1729340
Received: 21 October 2025; Accepted: 20 November 2025; Revised: 17 November 2025;
Published: 04 December 2025.
Edited by:
Joseph M. Escandón, Wyckoff Heights Medical Center, United StatesReviewed by:
Jeffrey Jun Xian Hing, Changi General Hospital, SingaporeShijing Wang, China Medical University, China
Copyright © 2025 Peng, Ai, Xu, Hong, Li and Liu. This is an open-access article distributed under the terms of the Creative Commons Attribution License (CC BY). The use, distribution or reproduction in other forums is permitted, provided the original author(s) and the copyright owner(s) are credited and that the original publication in this journal is cited, in accordance with accepted academic practice. No use, distribution or reproduction is permitted which does not comply with these terms.
*Correspondence: Weiying Xu, MjI1MDM2NTU4NUBxcS5jb20=
†These authors share first authorship