 Priya Dey
 Chukwuebuka Ogwo
 Marisol Tellez
- Maurice H Kornberg School of Dentistry, Oral Health Sciences, Temple University, Philadelphia, PA, United States
Introduction: There are substantial gaps in our understanding of dental caries in primary and permanent dentition and various predictors using newer modeling methods such as Machine Learning (ML) algorithms and Artificial Intelligence (AI). The objective of this study is to compare the accuracy, precision, and differences between the caries predictive capability of AI vs. traditional multivariable regression techniques.
Methods: The study was conducted using secondary data stored in the Temple University Kornberg School of Dentistry electronic health records system (axiUm) of pediatric patients aged 6–16 years who were patients on record at the Pediatric Dentistry Clinic. The outcome variables considered in the study were the decayed–missing–filled teeth (DMFT) and the decayed–extracted–filled teeth (deft) scores. The predictors included age, sex, insurance, fluoride exposure, having a dental home, consumption of sugary meals, family caries experience, having special needs, visible plaque, medications reducing salivary flow, and overall assessment questions.
Results: The average DMFT score was 0.85 ± 2.15, while the average deft scores were 0.81 ± 2.15. For childhood dental caries, XGBoost was the best performing ML algorithm with accuracy, sensitivity. and Kappa as 81%, 84%, and 61%, respectively, followed by Support Vector Machine and Lasso Regression algorithms, both with 84% specificity. The most important variables for prediction found were age and visible plaque.
Conclusions: The machine learning model outperformed the traditional statistical model in the prediction of childhood dental caries. Data from a more diverse population will help improve the quality of caries prediction for permanent dentition where the traditional statistical method outperformed the machine learning model.
1 Introduction
Dental caries is the most prevalent oral disease affecting children and adolescents resulting in deterioration of oral health ultimately leading to tooth loss (1,2). According to the Centers for Disease Control and Prevention, about 23% of children have dental caries. Hence, it is becoming increasingly important to manage dental caries at an early age as early detection of the disease allows for a more preventive medical management (3).
Globally, the decayed–missing–filled teeth (DMFT) index has been widely accepted as a population-based measure of dental caries. DMFT along with other predictors such as demographics, potential risk, and protective factors have been strategized for individual risk assessment and as targets for caries management (3).
Utilization of various standardized checklists for the assessment of caries risk has been done for many decades now. These tools used for estimating caries risk are used in day-to-day practice for advising in the clinical decision-making process using individually tailored disease prevention (4). The foundation for successful caries management is conducting caries risk assessment (CRA). Some of the well-known and widely used Caries Risk Assessment systems include the Caries Management by Risk Assessment (CAMBRA) form, the Cariogram, the American Dental Association (ADA) checklist, and the American Academy of Pediatric Dentistry (AAPD) form (5).
Traditional multivariable regression techniques are age-old reliable methods used for caries prediction, but these traditional regression models face limitations based on the principles that need to be followed for regression modeling. These include satisfying assumptions such as independence, following normal distribution among other assumptions. Multicollinearity effect among variables cannot be as strongly studied when using regression models (6). Hence, there is a need to study the prediction of dental caries using stronger modeling techniques. Conversely, some of the newer adopted techniques include Artificial Intelligence (AI) based on Machine Learning (ML) modeling, which in comparison with the traditional approaches have shown to have higher prediction accuracy and are likely to contribute significantly to the diagnostic process. ML is a subset of AI that utilizes algorithms trained on datasets to produce models that can perform complex tasks by reducing over-/under-fitting of models (1). Furthermore, AI can analyze data with a variety of features that cannot be handled by traditional regression techniques such as the ability to test the performance of a model itself (4).
2 Materials and methods
No prior studies comparing AI vs. traditional modeling have been conducted for predicting caries outcomes and using risk factor information from a standardized CRA system. Therefore, the aim of this study was to compare the accuracy, precision, and differences between the caries predictive capability of AI vs. traditional multivariable regression techniques in a sample of pediatric patients attending the Temple University Maurice H Kornberg School of Dentistry (TUKSoD), located in Philadelphia, Pennsylvania, United States.
This secondary data analysis research study was approved by the Institutional Review Board (IRB) at Temple University. The secondary data collected belongs to pediatric patients attending the clinics at the Dental School.
2.1 Database and inclusion/exclusion criteria
Data collection involved requesting secondary data stored in the school's electronic health records system (axiUm) of patients aged 6–16 years who were patients on records at the Pediatric Dentistry Clinic. The data retrieved from axiUm were from 1 March 2021 to 1March 2022. Other participants younger than 6 or older than 17 years of age or emergency patients were excluded from the study.
2.2 Outcomes and predictors
The outcome variables considered in the study were DMFT and the decayed–extracted–filled teeth (deft) scores. Individuals with DMFT/deft = 0 were grouped as “having no caries” and those with DMFT/deft score >0 were grouped as “having caries.” The predictors included demographic variables such as age, sex (male, female, and transgender), and insurance (cash/no insurance, private insurance, Medicaid, Ryan White, and Medicare). The potential protective factors included fluoride exposure (yes/no) and having a dental home (yes/no), while potential risk factors included consumption of sugary meals (primarily at meals and frequently or for prolonged periods between meals), family caries experience (none in 24 months, lesions in last 7–23 months, and lesions in last 6 months), having special needs [no, yes (over age 14), and yes (age 6–14)], medications reducing salivary flow (yes/no), and overall assessment questions gauging if participants were given any additional education (yes/no) or received fluoride application (yes/no) (Appendix A).
2.3 Data analysis
Descriptive statistics such as mean ± standard deviation (SD), range, and frequency were generated for all the continuous variables. DMFT and deft scores were stratified by the predictors. Bivariate tests were conducted and included Pearson correlation coefficients between DMFT/deft scores and selected continuous variables, while independent T-tests were done for predictors with one category. Analysis of variance (ANOVA) was performed on those predictors with more than two categories. DMFT and deft were dichotomized into categorical variables and appropriate Chi-square tests were conducted between various categorical predictor variables. The significance level was set at p < 0.05.
A logistic regression model was used to test for associations between predictor variables while adjusting for confounders on the categorical outcome variable. The traditional negative binomial regression model and logistic model were compared with AI modeling (Logistic Regression, XGBoost, Support Vector Machine, and Lasso Regression). The datasets were divided using resampling techniques based on fivefold cross-validation. In using this technique, 80% of the data were used for training and 20% were used for testing at each stage of the resampling. The machine learning space allowed for models to be trained, which allows them to learn about each type of unit. After the training phase, the model was assessed on the test data to predict the kind of unlabeled data. To analyze the findings, supervised learning models such as Logistic Regression, XGBoost, Support Vector Machine, and Lasso Regression were applied. Hyperparameter tuning was performed by adjusting the nrounds = 10, eta = 0.2, and objective = “binary:logistic.” The predictive accuracy, precision, area under the receiver operating characteristic curve (AUC-ROC), specificity, and sensitivity of these AI models were also compared.
3 Results
3.1 Descriptive characteristics of data
The total number of subjects included in the study was 3,586. The average DMFT score was 0.85 ± 2.15, while the average deft scores were 0.81 ± 2.15. The mean age of the selected participants was 12 years. The sample comprised mostly girls (53.9%) who had Medicaid insurance (82.29%). The potential protective factors included those exposed to fluoride (46.8%) and having a dental home (36.42%). The potential risk factors included frequent consumption of sugary meals (25.2%), family caries experience (9%), special healthcare needs (40%), medication reducing salivary flow (1.7%), visible plaque (33%), unusual tooth morphology (7%), exposed root surface (2.4%), orthodontic appliances (4.2%), and severe xerostomia (0.16%). About 10.6% of the patients declined additional fluoride application, while 39.5% of them received additional caries prevention educational material from their dentists (Table 1).
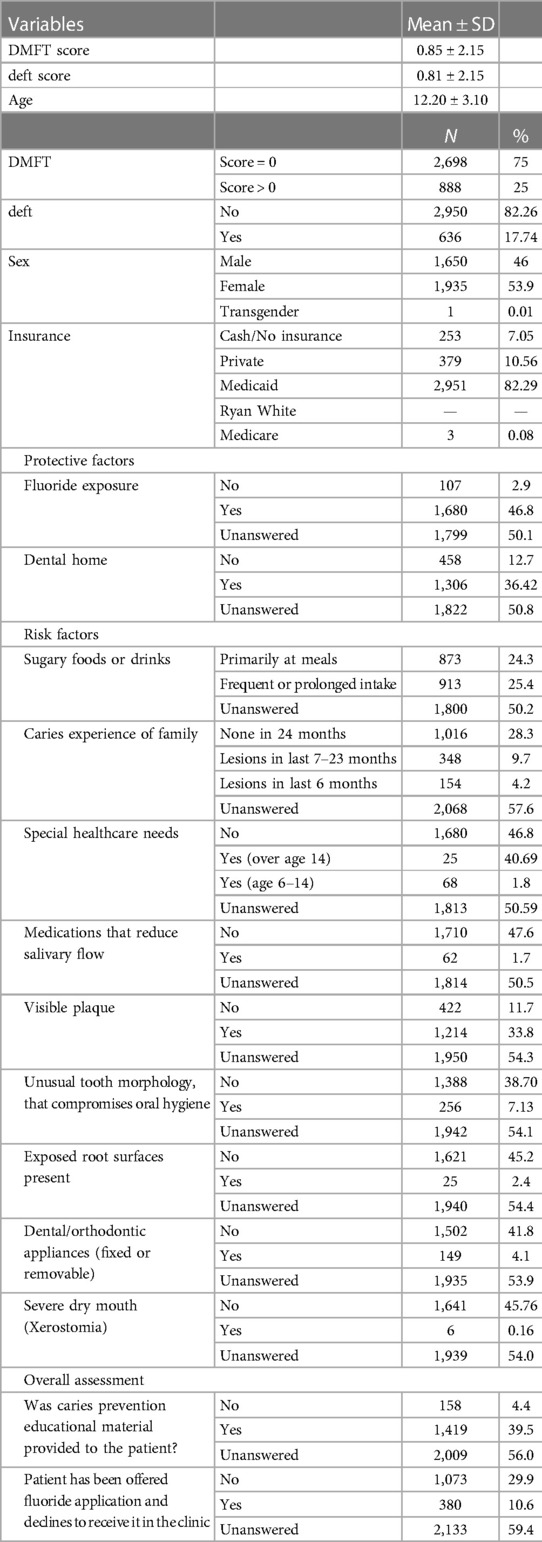
Table 1. Descriptive analysis (n = 3,586).
3.2 Bivariate analysis
DMFT was statistically significantly associated with age (p < 0.001), gender (mean ± SD, male DMFT: 0.75 ± 1.97, female DMFT: 0.95 ± 2.29, p-value <0.05], and sugary meal consumption (mean ± SD, primarily at meals DMFT: 1.43 ± 2.7, frequently or for prolonged periods between meals DMFT: 1.75 ± 2.76, p < 0.05) (Table 2).

Table 2. Bivariate analysis between DMFT and selected risk and protective factors (n = 912).
deft was statistically significantly associated with age (p < 0.001), family caries experience (mean ± SD, lesions in 7–23 months deft: 1.85 + 2.88 and lesions in past 6 months deft: 2.17 ± 3.20, p < 0.05), having unusual tooth morphology (mean ± SD, none deft: 1.47 ± 2.67 and having unusual tooth morphology deft score: 0.98 ± 2.44, p < 0.05), and use of orthodontic appliance (mean ± SD, no: 1.43 + 2.64 and using appliance deft score: 0.95 + 2.57, p < 0.05) (Table 3).
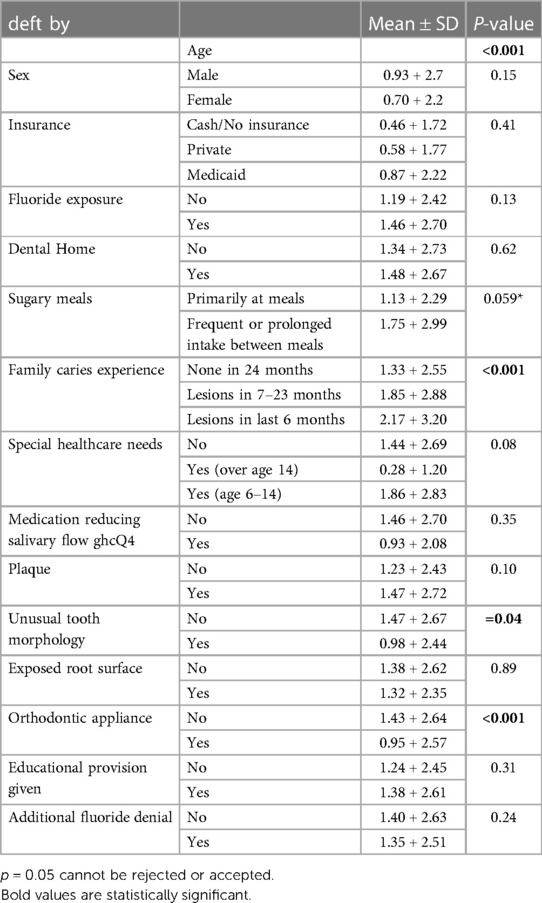
Table 3. deft stratified on the predictors (n = 912).
Dichotomizing DMFT and deft into categorical variables showed that DMFT was significantly associated with predictors such as age, consumption of sugary meals, and visible plaque. While deft was significantly associated with predictor variables such as age, family caries experience, special healthcare needs, and dental appliance use.
3.3 Multivariable analysis
3.3.1 Traditional logistic regression
As presented in Table 4, after careful consideration of the multicollinearity effect, interaction terms, and consideration of all fitted models, we found that holding all other variables in the model constant, age was found significantly associated with DMFT [odds ratio (OR) = 0.89, 95% CI (0.27–0.38)]. As age increased, the odds of having dental caries experience decreased by 11%. In addition, having insurance decreased the odds of having dental caries by 12% [OR = 0.88, 95% CI (0.032–0.62)], and those who frequently consumed sugary meals and drinks were 1.19 times more likely to have dental caries in comparison with those who did not consume sugary meals [OR = 1.19, 95% CI (0.15–0.74)]. Lastly, those who had visible plaque were 1.18 times more likely to have dental caries in comparison with those who did not have plaque [OR = 1.18, 95% CI (0.09–0.78)].

Table 4. Logistic regression (DMFT and deft).
As presented in Table 4, only age [OR = 1.65, 95% CI (−0.69 to −0.53)], special needs [OR = 2.66, 95% CI (0.02–0.20)], and visible plaque [OR = 1.31, 95% CI (0.05–0.88)] were found to be significant predictors of dental caries in the primary dentition.
3.3.2 AI machine learning (DMFT)
After comparison between the traditional logistic regression, ML logistic regression, XGBoost, Lasso, and Support Vector Machine methods, it was seen that the traditional logistic regression performed better in ROC AUC, accuracy, and Kappa statistic. Whereas XGBoost performed better in sensitivity measurement, and Lasso performed better in specificity measurement (Table 5).

Table 5. Model comparison between traditional models and ML (DMFT and deft).
3.3.3 AI machine learning (deft)
After comparison between the traditional logistic regression, ML logistic regression, XGBoost, Lasso, and Support Vector Machine methods, it was seen that the traditional logistic regression performed better in ROC AUC. XGBoost and traditional logistic regression performed equally in accuracy, whereas XGBoost performed better in sensitivity measurement and Kappa statistic. Lasso and Support Vector Machine performed equally in specificity measurement (Table 5).
3.4 Comparison of variables’ importance
The assessment of variable importance was similar for both classical and machine learning algorithms. For primary dental caries, age ranked the highest followed by visible plaque and special needs. For permanent dentition, sugary meals consumption followed by plaque and insurance were considered the most valuable predictors.
4 Discussion
Dental caries continues to remain a huge concern for dentists, dental public health professionals, and patients as it is the most prevalent oral disease affecting children and adolescents resulting in deterioration of oral health ultimately leading to tooth loss (1). Although CRA has been highly recommended in clinical practice for management of dental caries, it is however severely underutilized by practitioners (7). Apart from CAMBRA, the other current systems are lacking validation. Therefore, development of future tools such as ML that can help utilize CRA items for better risk calculation and clinical outcomes prediction by implementing evidence-based caries management will tremendously help clinical practitioners. While many studies have been done in the past looking into dental caries predictors, these studies have been conducted using traditional statistical tools (4). There are no existing studies that have compared traditional statistical methods vs. ML in predicting dental caries.
Previous studies done on prediction of childhood dental caries showed that the presence of thick and heavy plaque is a predictor for caries development, progression, and activity (8). A study conducted by Lin et al. (9) showed that age was a useful predictor of childhood dental caries. Children with special needs were more likely to have dental caries as reported (10). Our study too found age, visible plaque, and special needs as strong predictors of dental caries comparable with previous studies conducted. Although sugary meals and fluoride exposure were not found to be significantly associated, they were part of the final model with best fit as seen in the literature (11). A previous study done on the prediction of dental caries for adolescents and adults showed poor oral hygiene and socioeconomic status as useful predictors (12). Our study showed that not having dental insurance was associated with dental caries.
Previous studies on childhood dental caries prediction utilizing ML solely found their proposed model yielded an AUC-ROC value of 0.74, sensitivity of 0.67, and accuracy of 0.64 (13). Another study (4) performed on children reported an AUC-ROC value of 0.78 for ML Logistic Regression, 0.785 for XGBoost, and 0.780 for Support Vector Machine. Our prediction data for children yielded an AUC-ROC value of 0.87 for traditional Logistic regression and an AUC-ROC value of 0.86 for ML (Logistic Regression, Lasso, XGBoost, and Support Vector Machine) outperforming (4) AUC-ROC value. Our study also showed a sensitivity of 0.84 for XGBoost and accuracy of 0.81 for XGBoost outperforming Karhade (13) values. Some of the limitations of the current study included the lack of generalizability to other populations. Data were obtained at Temple University Pediatrics, which serves a very high proportion of low-income African Americans in an urban setting.
Our prediction data on permanent dentition yielded AUC-ROC, accuracy, and Kappa values of 0.76, 0.70, and 0.40, respectively, for traditional Logistic Regression. Our study showed a sensitivity value of 0.77 for XGBoost and specificity value of 0.70 for Lasso. No prior studies comparing traditional vs. ML have been done on dental caries prediction of adolescents and adults.
5 Conclusions
Understanding the predictors of dental caries plays a huge role in reducing the burden of dental caries in this population. This study contributes to reducing the gap in literature about the role of various predictors on dental caries and the utilization of ML in the prediction. Both ML and the traditional statistical tool were able to generate predictors of dental caries. However, the ML model outperformed the traditional statistical model for primary caries prediction. The ML model had better accuracy, sensitivity, specificity, and Kappa values in comparison with the traditional statistical method. Thus, with confidence we can say that ML is an accurate, precise, and more meaningful statistical method that can be used for enhancing dental caries risk assessment. Simultaneously, these predictors can be used in day-to-day practice for aiding in clinical decision-making processes and for disease prevention in individual patients.
Data availability statement
The data analyzed in this study are subject to the following licenses/restrictions: The data that support the findings of this study are available on request from the corresponding author. The data are not publicly available due to privacy or ethical restrictions. Requests to access these datasets should be directed tocHJpeWEuZGV5QHRlbXBsZS5lZHU=.
Ethics statement
The IRB approved the study under EXEMPT review and approved the waiver of Health Insurance Portability and Accountability Act (HIPAA) authorization for the protocol approved with submission #29659-0002. The studies were conducted in accordance with the local legislation and institutional requirements.
Author contributions
PD: Conceptualization, Data curation, Formal Analysis, Methodology, Supervision, Writing – original draft, Writing – review & editing, Investigation, Project administration, Software, Validation. CO: Conceptualization, Data curation, Formal Analysis, Methodology, Supervision, Writing – review & editing, Investigation, Project administration, Software, Validation. MT: Conceptualization, Data curation, Formal Analysis, Methodology, Supervision, Writing – review & editing, Investigation, Project administration, Validation.
Funding
The authors declare financial support was received for the research, authorship, and/or publication of this article.
This research used data from an already approved IRB project. The research was supported by Temple University, Department of Oral Health Sciences.
Conflict of interest
The authors declare that the research was conducted in the absence of any commercial or financial relationships that could be construed as a potential conflict of interest.
Publisher's note
All claims expressed in this article are solely those of the authors and do not necessarily represent those of their affiliated organizations, or those of the publisher, the editors and the reviewers. Any product that may be evaluated in this article, or claim that may be made by its manufacturer, is not guaranteed or endorsed by the publisher.
Abbreviations
ML, machine learning; AI, Artificial Intelligence; AUC-ROC, area under the receiver operating characteristic curve; OR, odds ratio; SD, standard deviation.
References
1. Hung M, Voss MW, Rosales MN, Li W, Su W, Xu J, et al. Application of machine learning for diagnostic prediction of root caries. Gerodontology. (2019) 36(4):395–404. doi: 10.1111/ger.12432
2. Benjamin RM. Oral health: the silent epidemic. Public Health Rep. (2010) 125(2):158–9. doi: 10.1177/003335491012500202
3. Kang I-A, Ngnamsie Njimbouom S, Lee K-O, Kim J-D. DCP: prediction of dental caries using machine learning in personalized medicine. Appl Sci. (2022) 12(6):3043. doi: 10.3390/app12063043
4. Park YH, Kim SH, Choi YY. Prediction models of early childhood caries based on machine learning algorithms. Int J Environ Res Public Health. (2021) 18(16):8613. doi: 10.3390/ijerph18168613
5. Featherstone JDB, Chaffee BW. The evidence for Caries Management by Risk Assessment (CAMBRA®). Adv Dent Res. (2018) 29(1):9–14. doi: 10.1177/0022034517736500
6. Liu L, Wu W, Zhang SY, Zhang KQ, Li J, Liu Y, et al. Dental caries prediction based on a survey of the oral health epidemiology among the geriatric residents of Liaoning, China. BioMed Res Int. (2020) 2020:5348730. doi: 10.1155/2020/5348730
7. Chaffee BW, Featherstone JD, Gansky SA, Cheng J, Zhan L. Caries risk assessment item importance: risk designation and caries status in children under age 6. JDR Clin Trans Res. (2016) 1(2):131–42. doi: 10.1177/2380084416648932
8. Carvalho JC, Mestrinho HD, Aimée NR, Bakhshandeh A, Qvist V. Visible occlusal plaque index predicting caries lesion activity. J Dent Res. (2022) 101(8):905–11. doi: 10.1177/00220345221084664
9. Lin YT, Chou CC, Lin YJ. Caries experience between primary teeth at 3–5 years of age and future caries in the permanent first molars. J Dent Sci. (2021) 16(3):899–904. doi: 10.1016/j.jds.2020.11.014
10. Chand BR, Kulkarni S, Swamy NK, Bafna Y. Dentition status, treatment needs and risk predictors for dental caries among institutionalised disabled individuals in central India. J Clin Diagn Res. (2014) 8(9):ZC56–9. doi: 10.7860/JCDR/2014/9940.4861
11. Ismail AI, Sohn W, Lim S, Willem JM. Predictors of dental caries progression in primary teeth. J Dent Res. (2009) 88(3):270–5. doi: 10.1177/0022034508331011
12. Tafere Y, Chanie S, Dessie T, Gedamu H. Assessment of prevalence of dental caries and the associated factors among patients attending dental clinic in Debre Tabor general hospital: a hospital-based cross-sectional study. BMC Oral Health. (2018) 18(1):119. doi: 10.1186/s12903-018-0581-8
13. Karhade DS, Roach J, Shrestha P, Simancas-Pallares MA, Ginnis J, Burk ZJ, et al. An automated machine learning classifier for early childhood caries. Pediatr Dent. (2021) 43:191–7. PMCID: PMC8278225; PMID: 3417211234172112
Appendix A
List of variables with explanations

Keywords: machine learning, dental caries, prediction, Artificial Intelligence, traditional statistical
Citation: Dey P, Ogwo C and Tellez M (2024) Comparison of traditional regression modeling vs. AI modeling for the prediction of dental caries: a secondary data analysis. Front. Oral. Health 5:1322733. doi: 10.3389/froh.2024.1322733
Received: 16 October 2023; Accepted: 22 April 2024;
Published: 24 May 2024.
Edited by:
Usha Sambamoorthi, University of North Texas Health Science Center, United StatesReviewed by:
Shihao Li, West China Hospital, ChinaMehak Gupta, Southern Methodist University, United States
© 2024 Dey, Ogwo and Tellez. This is an open-access article distributed under the terms of the Creative Commons Attribution License (CC BY). The use, distribution or reproduction in other forums is permitted, provided the original author(s) and the copyright owner(s) are credited and that the original publication in this journal is cited, in accordance with accepted academic practice. No use, distribution or reproduction is permitted which does not comply with these terms.
*Correspondence: Priya Dey, cHJpeWEuZGV5QHRlbXBsZS5lZHU=