 Durdana Khan
 Ixel Hernandez-Castro2
 Doreen Y. Larvie
 Seth M. Armah
 Ashley J. Malin
- 1Department of Epidemiology, College of Public Health and Health Professions and College of Medicine, University of Florida, Gainesville, FL, United States
- 2Department of Epidemiology and Population Health, Stanford School of Medicine, Stanford, CA, United States
- 3Division of Nutritional Sciences, Cornell University, Ithaca, NY, United States
- 4Department of Nutrition, University of North Carolina Greensboro, Greensboro, NC, United States
Introduction: Historic research shows that a diet rich in calcium, phosphorus, fat-soluble vitamins, and vitamin C, and low in phytates may help to prevent and arrest dental caries; however, current research on this topic is scarce. We examined associations of dietary intake of these nutrients with dental caries prevalence in the United States among youth 1–19 years old.
Methods: The study included 2,676 young children (1–5 years), 3,214 older children (6–11 years) and 3,701 adolescents (12–19 years) from the National Health and Nutrition Examination Survey (NHANES 2011–2018). Daily nutrient intake was ascertained via two 24 h recalls. We assessed the number and presence (yes/no) of decayed and/or filled teeth (DFT) among young children and decayed, missing and/or filled teeth (DMFT) among older children and adolescents. Covariate-adjusted survey-weighted negative binomial regression was used to examine associations of nutrient quartiles with DFT or DMFT scores. We examined joint associations of nutrients with the probability of caries using the probit extension of Bayesian Kernel Machine Regression.
Results: Mean (SD) DFT or DMFT scores were 0.82 (2.23) for young children, 2.08 (2.81) for older children and 2.51 (3.35) for adolescents. Higher phosphorus and vitamin A intake was associated with fewer DFT among young children [incident rate ratio (IRR) = 0.52, 95% CI: 0.29–0.94, p = 0.03, and IRR = 0.60, 95% CI: 0.37–0.95, p = 0.03, respectively]. Unexpectedly, higher intake of phytates was also associated with lower DFT scores among young children (IRR = 0.37, 95% CI: 0.21–0.65, p = 0.001). Higher phosphorus and vitamin E intake was associated with fewer DMFT among older children (IRR = 0.58, 95% CI: 0.40–0.84, p = 0.003 and IRR = 0.73, 95% CI: 0.54–0.97, p = 0.03, respectively). For adolescents, higher phosphorus and vitamin K intake was associated with fewer DMFT (IRR = 0.72, 95% CI: 0.53–0.99, p < 0.05; IRR = 0.82, 95% CI: 0.68–0.97, p = 0.02, respectively). The joint effect of nutrients was also associated with lower odds of DMFT. Setting all nutrients at their 75th relative to 50th percentiles was associated with 0.87 [95% credible interval (CrI): 0.81, 0.94] and 0.92 (95% CrI: 0.85, 0.99) lower odds of DMFT in older children and adolescents, respectively. Phosphorus and vitamin K contributed most to these associations.
Conclusion: Fat-soluble vitamins and phosphorus may have systemic dental benefits that warrant further investigation.
1 Introduction
Dental caries, commonly known as tooth decay, remains a significant health concern among children and adolescents in the United States. Despite increased dental visits, the high prevalence of dental caries persists (1, 2). Approximately, 45.8% of youth aged 2–19 years were reported to be affected by dental caries from 2015–2017 (3); with 23% of children aged 2–5 years (4), 52% of children aged 6–8 years (4), and 57% of adolescents of ages 12–19 years affected (2, 4).
Current conceptualizations of the pathogenesis of dental caries suggest that it involves a dynamic interplay of demineralization and remineralization processes, influenced by factors such as bacterial activity, dietary sugars, saliva composition, and fluoride exposure (5). Biofilms, which are complex aggregations of microorganisms adhering to dental surfaces, are integral to the pathogenesis of dental caries. The extracellular matrix of these biofilms can provide a protective niche for resident bacteria that contribute to dental caries. Acidogenic bacteria, particularly mutans streptococci, flourish within these biofilms, significantly contributing to the progression of caries (6–8). However, biofilms can also serve as a reservoir for fluoride, or even alkaline microorganisms, that can help to remineralize teeth, as well as prevent harmful bacteria from contributing to infections (9–12). These localized effects are well-documented, and form the basis for many preventive strategies including reducing sugar intake, use of fluoridated dental products, and the maintenance of optimal oral hygiene practices (2).
While most literature focuses on local dietary effects in the oral cavity (13–18); the potential systemic influence of nutrition on caries formation remains underexplored (19). Better understanding how the diet could potentially systemically influence dental caries progression, may be a missing piece to addressing this prevalent public health issue. While there are few recent studies on this topic, historic animal and human studies (conducted primarily in children or adolescents) published in the early to mid-1900s suggest that diets rich in calcium, phosphorus, vitamin C, and fat-soluble vitamins (A, D, and K2), with low phytate content, may help to prevent and even reverse dental caries by providing essential nutrients to the structure of teeth that help to systemically remineralize them [see (20) for a review]. However, this hypothesis has not yet been explored in the contemporary literature. Therefore, the present study examined associations of dietary calcium, phosphorus, vitamin C, fat-soluble vitamins (A, D, K, and E) and phytate intake with dental caries prevalence in a nationally representative sample of United States youth participating in the National Health and Nutrition Examination Survey (NHANES). We hypothesized that diets higher in calcium, phosphorus, vitamins A, D, K, E, and C and lower in phytates would be inversely associated with caries prevalence among youth.
2 Materials and methods
2.1 Participants
This study included participants from cycles 2011–2018 of NHANES (see eMethods for NHANES survey procedures) (21). There were 39,156 participants who completed the interview portion of NHANES 2011–2018. Of these, a subsample of 9,591 participants aged 1–19 years received an oral health examination, had reliable dietary data, and had complete data on all covariates included in the analysis. The final sample in the present analysis was comprised of 2,676 children aged 1–5 years, 3,214 children aged 6–11 years, and 3,701 adolescents aged 12–19 years. See Figure 1 for a participant selection flow diagram.
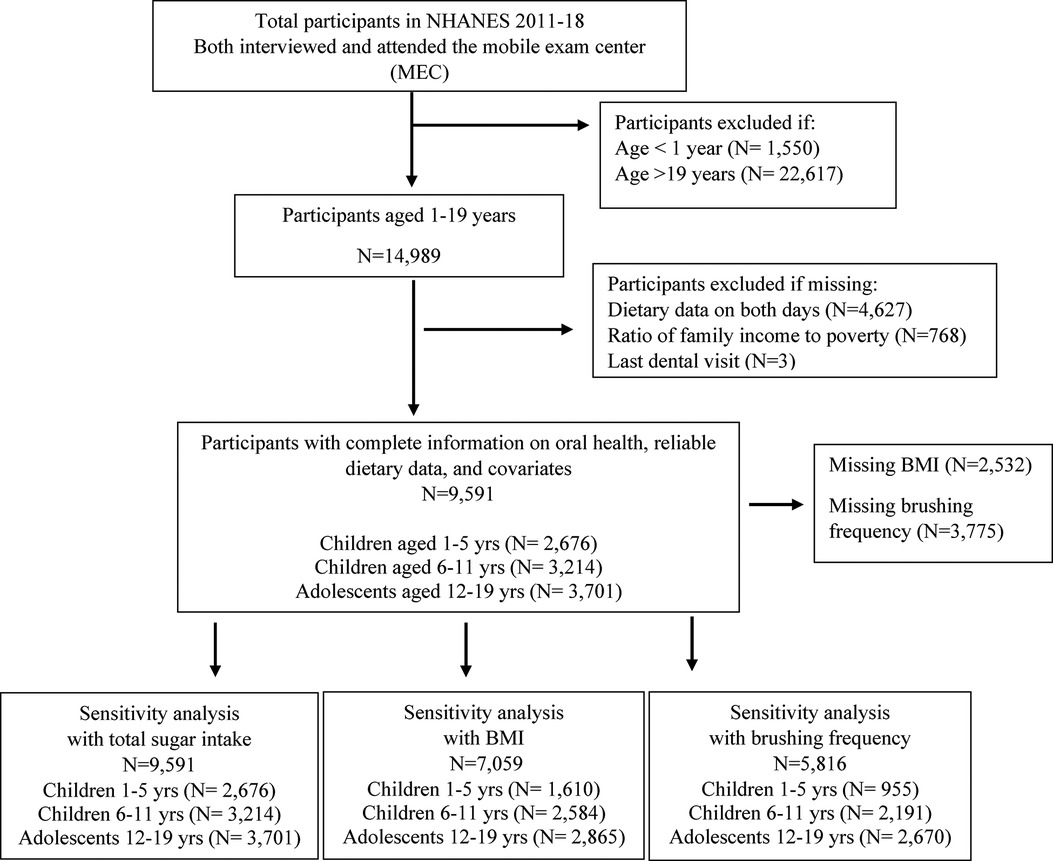
Figure 1. Flow chart of study participants included in the final analysis.
2.2 Measures
2.2.1 Dietary intake
Daily dietary intake data were obtained from two 24-hour dietary recalls known as “What We Eat in America” (WWEIA), the dietary intake component of NHANES. These were carried out through a collaboration between the U.S. Department of Agriculture (USDA) and the U.S. Department of Health and Human Services (DHHS) (22, 23). The first dietary recall was obtained during an initial in-person interview and the second was obtained 3–10 days later via telephone (23, 24). Interviews were conducted for participants less than six years of age with a proxy person (generally the person most knowledgeable about the participant's intake); interviews of children aged 6–11 years were conducted with a proxy person and the child present (24). Participants 12 years or older answered for themselves. We only included participants whose 24 h dietary recalls were considered reliable as assessed based on standard NHANES criteria of completing all relevant variables associated with the 24 h dietary recall. We included dietary recall data from both days (23).
2.2.2 Nutrient intake calculations
We calculated the mean dietary intake of calcium, phosphorus, vitamin C, fat-soluble vitamins (A, D, K, and E) from two days of recall, employing a widely recognized methodology (25). By utilizing this approach (two days of recall), we accounted for the variability in dietary nutrient consumption, thereby providing a more accurate representation of participants' habitual dietary patterns. However, we derived phytate intake from only the first day due to phytate data not being available for the second day at the time of analysis.
Phytate intake was estimated using the method published by Larvie and Armah (26). This method uses the USDA Food Patterns Equivalents Database (FPED) and phytate content values from the Food and Agriculture Organization/International Network of Food Data Systems/International Zinc Nutrition Consultative Group (FAO/INFOODS/IZINCG) Global Food Composition Database for Phytate (27, 28). The FPED converts food and beverages reported in WWEIA into 37 food pattern components/food group (29). We used data for the 2011–2018 survey cycles (30) and focused on food groups that contain phytate (e.g., dark green vegetables, other starchy vegetables, legumes, whole grains, refined grains, soy products, nuts and seeds).
To estimate the phytate intake, first, the number of equivalents of each food group consumed by each participant was converted to weight in grams using weight per unit equivalents data obtained from the FPED Methodology and User Guide document (29). Since the FPED document provides weight per unit equivalent data for individual food items, we estimated the values for each food group by averaging the weights provided in the FPED document for frequently consumed foods under that food group. For instance, for dark green leafy vegetables, we averaged the weight/unit equivalents for beet greens, broccoli, Chinese cabbage, collards, spinach, and turnip. The FAO/INFOODS/IZINCG phytate content data was then applied to the FPED data to estimate the phytate intake from each of the different food groups by each participant per day. The FAO/INFOODS/IZINCG data provides phytate content in mg per 100 g at the food group level, thus making it possible to estimate how much phytate was consumed from each food group for each participant. To obtain the total daily phytate intake in mg for each participant, we summed up the phytate intake from all the different food groups consumed. The data were then merged with the corresponding 2011–2018 NHANES data.
2.2.3 Dental caries
Oral health examinations were conducted by licensed dentists in a room at the MEC using light, compressed air, and a portable dental chair. Tooth scoring criteria used in the dental examination, along with quality assurance and training/calibration details, are further described in the NHANES plan and operations manual (31, 32).
2.2.3.1 Calculation of decayed, missing, and filled teeth (DMFT) and decayed and filled teeth (DFT) scores
The DMFT index, representing decayed, missing, and filled teeth, is a widely used measure (33) in NHANES to assess dental health. DMFT was calculated as the total count of decayed, missing, or filled status of each tooth. NHANES dental codes are summarized in Supplementary Table S1. A tooth was denoted “decayed” if it had an untreated carious lesion or both a carious lesion and a restoration (32). NHANES employed precise diagnostic criteria (visual and tactile criteria) to assess and document coronal caries, encompassing both frank lesions (gross cavitation) and incipient lesions (the early stages of caries development prior to cavity formation) (see eMethods) (32). Teeth missing due to caries were recorded as “missing.” Teeth with temporary or permanent fillings/restoration were classified as “filled.” Teeth that were congenitally missing, unerupted, supernumerary teeth, third molars, and teeth missing for reasons other than dental causes were excluded from DMFT scoring. The DMFT index was considered for permanent teeth, which are relevant for individuals beyond the age of 6 when primary dentition transitions to permanent dentition (34, 35). For children aged 1–5 years, we calculated a DFT score, which represents decayed and filled teeth, capturing both treated and untreated caries in primary dentitions. We excluded the “missing” component for this age group because primary teeth naturally fall out as part of the child's development, making it difficult to distinguish between teeth missing due to caries and those missing due to natural exfoliation (35). For older children (6–11 years) both primary and permanent dentitions were included in creating DMFT scores depending on what type of teeth the participant had. To avoid duplication, only the permanent tooth was scored when both primary and permanent teeth were present in the same space. If both a permanent and a primary tooth were visible in the same tooth space, only the status of the permanent tooth was described and no score was assigned for the primary tooth (32). For all participants we calculated a count indicator measuring the total number of DFT or DMFT, as well as a binary (yes/no) indicator measuring whether any DFT or DMFT were present.
2.3 Covariates
We included sociodemographic variables that have been associated with dental caries among children and adolescents, as well as with dietary nutrient intake in previous studies (36–38). These include age, sex, race/ethnicity, the ratio of family income to poverty, last dental visit and total energy intake. Race/ethnicity was classified as Mexican American, Other Hispanic, non-Hispanic White, non-Hispanic Black, non-Hispanic Asian, and Other Race, Including Multiracial; sex was defined as male or female; the ratio of family income to poverty was calculated by dividing annual family income by the poverty guidelines for the survey year. The Department of Health and Human Services (HHS) poverty guidelines were used as the poverty measure to calculate the family income to poverty ratio (39). The values range from 0–5 and were not computed if family income data were missing. Total energy intake was defined as total kcal per day and last dental visit was re-categorized as 6 months to 1 year, more than 1 year to 3 years, more than 3 years or never have been, and refused/don't know. Participants were stratified into age groups of 1–5 years, 6–11 years and 12–19 years for statistical analyses.
2.4 Statistical analysis
Descriptive statistics were reported for participant demographic characteristics, dietary nutrient intakes and dental caries scores across different age groups. To address count data and account for over-dispersion, we employed covariate-adjusted negative binomial regression to examine associations of dietary nutrient intake with DFT or DMFT scores. This method indicated good model fit (see eMethods). We examined the association between quartiles of each dietary nutrient separately with DFT and DMFT scores and stratified models by age group. Coefficients were exponentiated and presented as incident rate ratios (IRR) with respective 95% confidence intervals and p-values. We also conducted supplemental covariate-adjusted logistic regression analyses to examine associations between quartiles of each dietary nutrient intake separately in relation to binary presence of DMFT or DFT (yes/no) stratified by age group. Exponentiated coefficients from these models were presented as odds ratios (OR) with their respective 95% confidence intervals and p-values. All these analyses applied sampling weights from two days of dietary recall to ensure representation of the US population. However, only sampling weights from day 1 were applied for phytate intake as it was exclusively derived from the first day of dietary recall.
To examine joint associations of nutrients as a mixture with the probability of DFT or DMFT, we applied the probit extension of Bayesian Kernel Machine Regression (BKMR). BKMR is a semi-parametric method employing a flexible Gaussian kernel function (40) that allows for non-linear exposure-response functions. Furthermore, it can evaluate potential synergistic and antagonistic relationships between exposures (41). Relative to traditional regression approaches, BKMR limits potential Type I error by reducing the number of models and multiple comparison issues. It is also particularly suitable for nutrient mixtures where moderate to high correlations between exposures may lead to collinearity in alternative approaches (41). Using probit-BKMR with a component-wise variable selection, we modeled the overall effect of concurrently increasing percentiles of all nutrients in the mixture on odds of DFT/DMFT vs. no DFT/DMFT. We also evaluated posterior inclusion probabilities of each individual nutrient to assess the relative importance of the nutrient to the overall mixture effect. We assessed the single-exposure health effects for each nutrient (univariate associations) with the odds of DFT or DMFT, as well as pairwise interactions between nutrients in relation to the odds of DFT or DMFT (see eMethods). All BKMR models were unweighted and reported odds ratios (OR) with their respective 95% credible intervals (CrI) (see eMethods for BKMR data preparation).
In both weighted negative binomial regression models and unweighted BKMR models we explored potential interactions between vitamin A and vitamin K, vitamin D and vitamin A, vitamin K and vitamin D, vitamin K and phosphorous, and vitamin C and vitamin K. All models were adjusted for age, sex, race/ethnicity, ratio of family income to poverty, total energy intake, and last dental visit. We performed sensitivity analyses adjusting for sugar intake (gm), body mass index (BMI) in kg/m2, and brushing frequency (<=2 times/day or >2 times/day) in negative binomial regression models and adjusting for sugar intake in BKMR models. Mixture BKMR models did not include the survey weights or design due to software limitations. All data management and negative binomial regressions were performed using STATA version 18.0 and BKMR analysis were run in R (R v.4.3) using the “bkmr” package.
3 Results
Descriptive statistics for participant demographic characteristics and dental caries measures are summarized in Table 1. The Mean (SD) age in years was 3.02 (1.38) for younger children, 8.52 (1.69) for older children, and 15.51 (2.27) for adolescents. The distribution of females and males was approximately equal among all age groups. Most participants identified as Non-Hispanic White and reported having had at least one dental visit within the last year. The prevalence of DFT in primary teeth among younger children aged 1–5 years was 17.43 (%). For older children aged 6–11 years, 50.65 (%) had DMFT, while for adolescents, 56.25 (%) had DMFT. The mean (SD) number of teeth with caries (i.e., DFT or DMFT score) was 0.82 (2.23) for children aged 1–5 years, 2.08 (2.81) for children aged 6–11 years, and 2.51 (3.35) for adolescents.
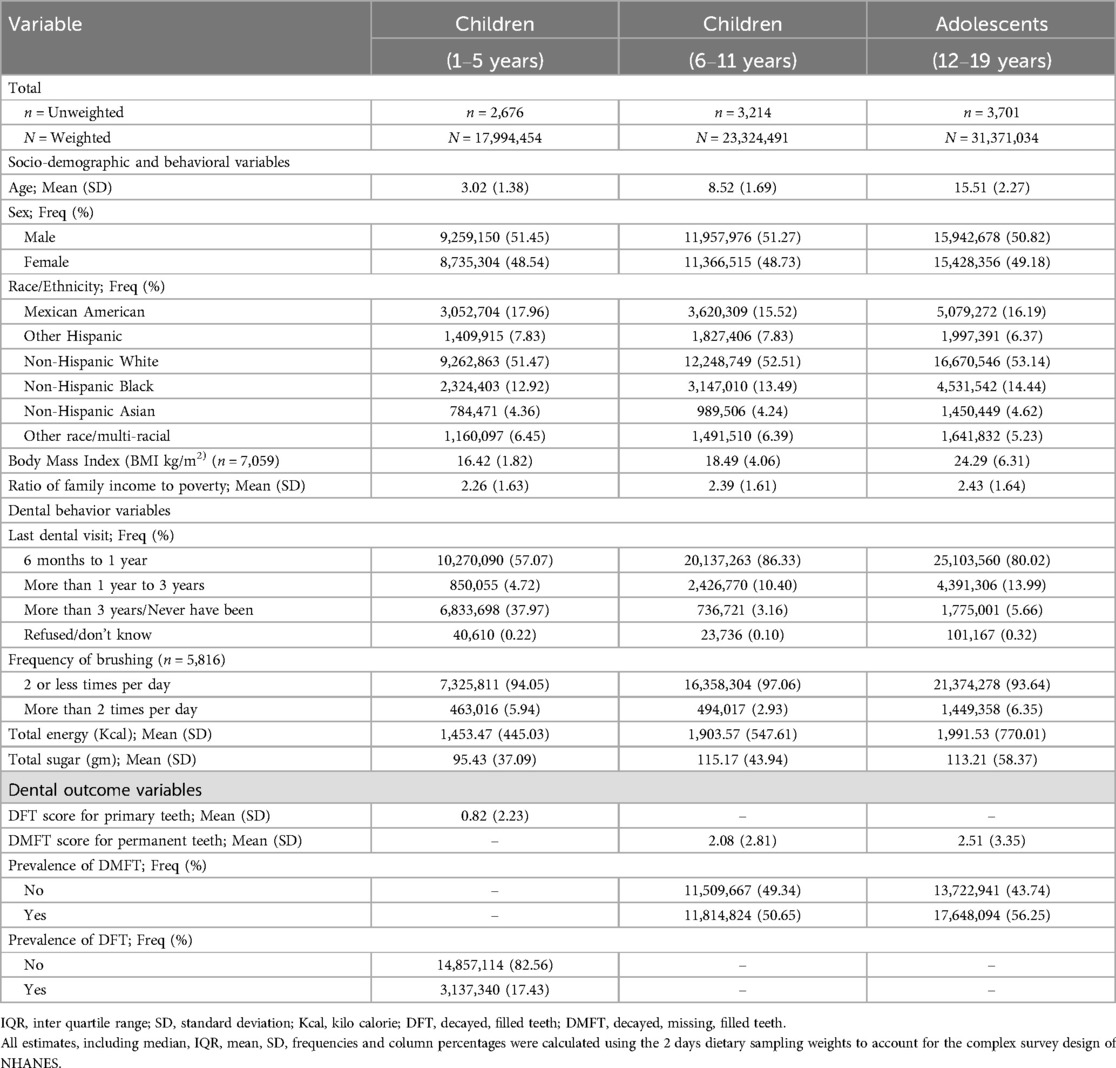
Table 1. Demographic characteristics of the study participants across different age groups.
Table 2 summarizes descriptive statistics for participants' daily dietary nutrient intakes according to recommended dietary allowance (RDA) per age group (42). On average, participants had adequate daily nutrient intake for most nutrients. However, median (IQR) intake of Vitamin D was lower than the RDA of 15 mcg among all age groups (42). Similarly, median (IQR) vitamin E intake was lower than the RDAs among all age groups, and median (IQR) calcium intake was lower than the RDAs for older children and adolescents (42, 43).
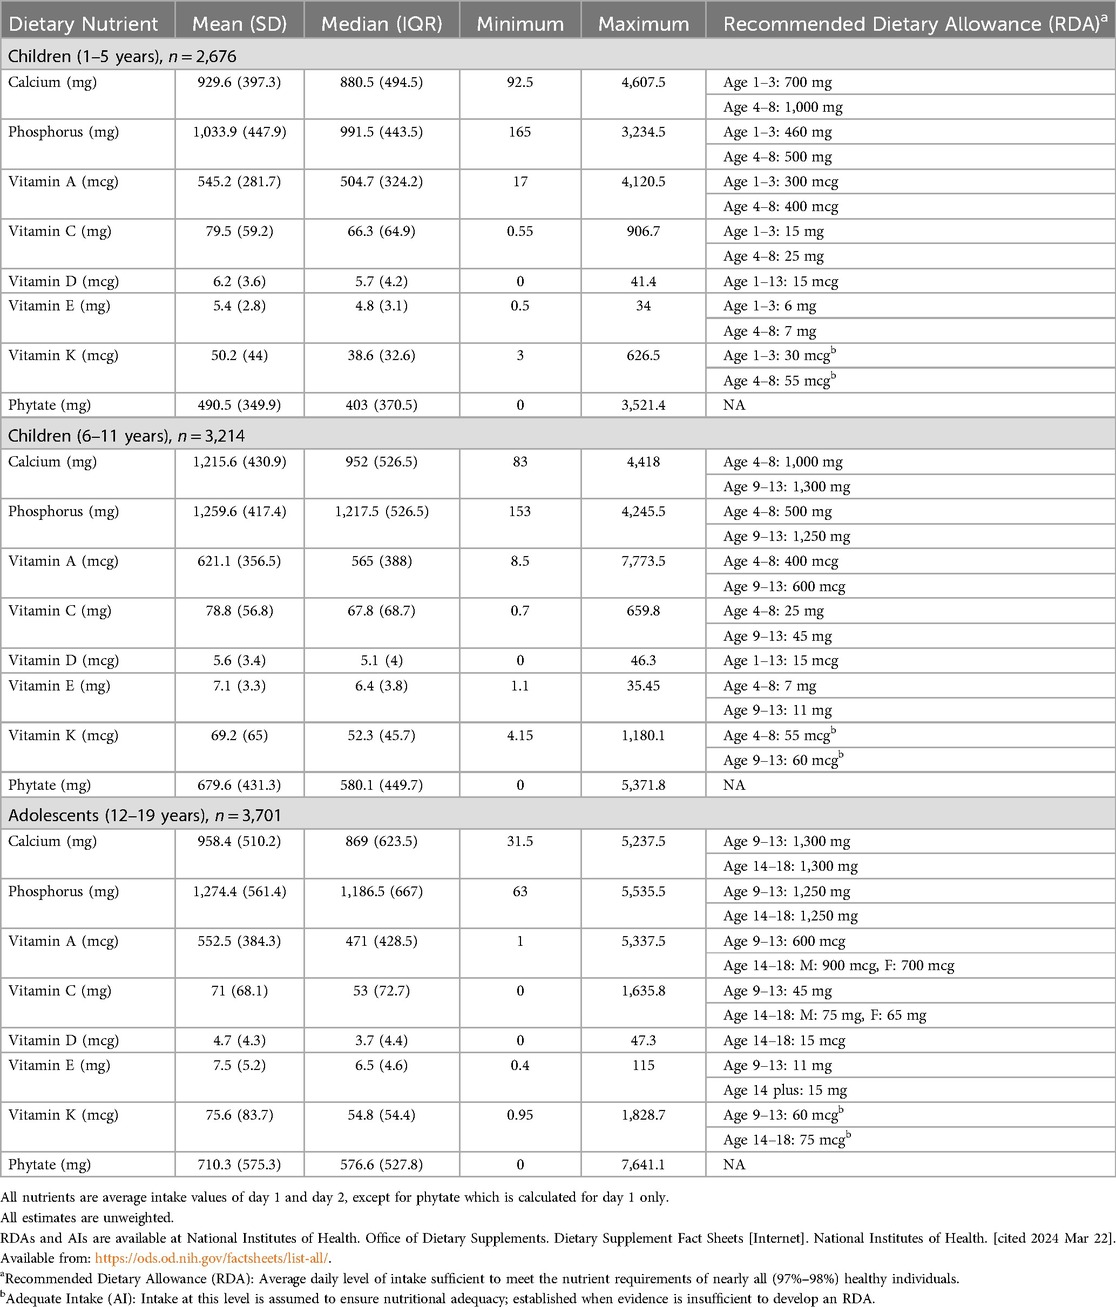
Table 2. Summary statistics and recommended levels of dietary nutrients according to age group.
3.1 Associations between dietary nutrient intake and number of dental caries
Associations between individual dietary nutrient intakes and DFT or DMFT scores are presented in Table 3. Among younger children, higher intake of phosphorus was associated with lower DFT scores (IRRQ2 = 0.52, 95% CI: 0.35–0.76, p = 0.001; IRRQ3 = 0.52, 95% CI: 0.29–0.94, p = 0.030). Similarly, among older children and adolescents, higher intake of phosphorus was associated with lower DMFT scores [(IRRQ2 = 0.77, 95% CI; 0.61–0.97, p = 0.025; IRRQ4 = 0.58, 95% CI; 0.40–0.84, p = 0.003 for older children) and (IRRQ3 = 0.79, 95% CI; 0.62–1.00, p = 0.050; IRRQ4 = 0.72, 95% CI; 0.53–0.99, p = 0.045 for adolescents)]. However, when adjusting for BMI in a reduced sample, the association between higher phosphorous and lower DMFT scores was no longer statistically significant for adolescents (in Supplementary Table S2).
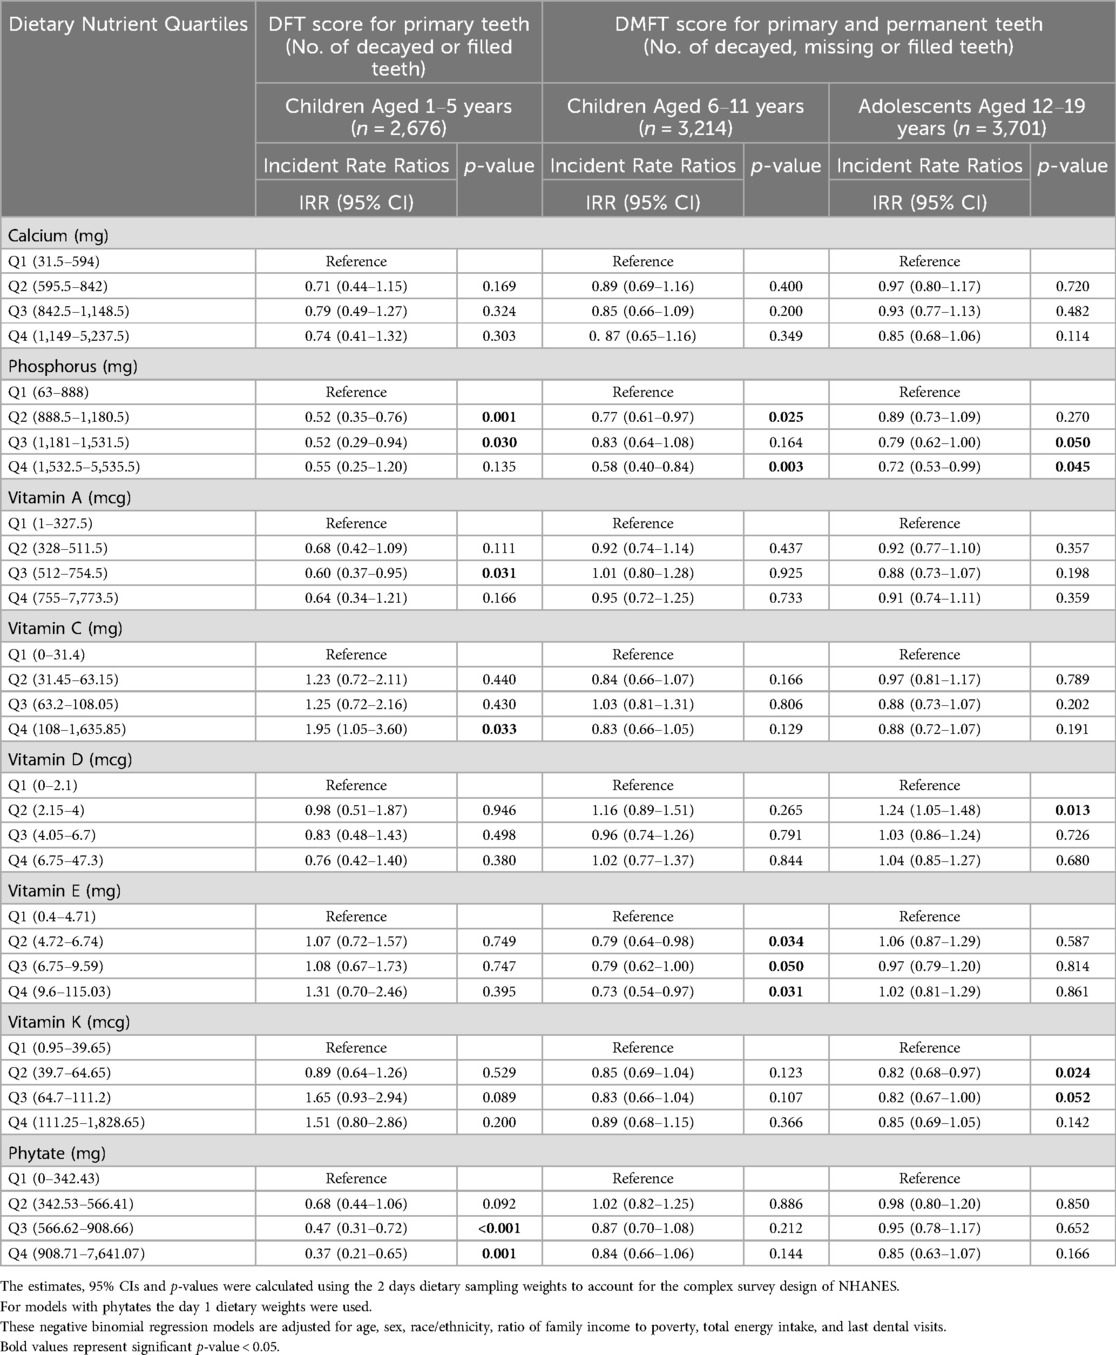
Table 3. Associations between quartiles of nutrients and dental decay across different age groups.
Higher dietary intake of fat-soluble vitamins was also associated with less dental caries across all age groups; notably, vitamins A, E, and K showed inverse associations. For younger children, a higher intake of vitamin A was associated with lower DFT scores (IRRQ3 = 0.60, 95% CI: 0.37–0.95, p = 0.031); for older children, higher intake of vitamin E was associated with lower DMFT scores (IRRQ2 = 0.79, 95% CI: 0.64–0.98, p = 0.034; IRRQ3 = 0.79, 95% CI: 0.62–1.00, p = 0.05; IRRQ4 = 0.73, 95% CI: 0.54–0.97, p = 0.031); and for adolescents, higher vitamin K intake was associated with lower DMFT scores (IRRQ2 = 0.82, 95% CI: 0.68–0.97, p = 0.024; IRRQ3 = 0.82, 95% CI: 0.67–1.00, p = 0.052). Interestingly, when adjusting for brushing frequency, higher vitamin K intake was associated with lower DMFT scores among older children but not adolescents, yet all other findings remained consistent (see Supplementary Table S3).
Unexpectedly, higher intake of phytates was associated with lower DFT scores among younger children (IRRQ3 = 0.47, 95% CI: 0.31–0.72, p < 0.001; IRRQ4 = 0.37, 95% CI: 0.21–0.65, p = 0.001). In contrast, the highest intake of vitamin C was associated with higher DFT scores among younger children (IRRQ4 = 1.95, 95% CI: 1.05–3.60, p = 0.033). However, this association might be confounded by sugar intake because it became non-significant after adjusting for daily sugar intake in sensitivity analyses (see Supplementary Table S4). Furthermore, for older children, after adjusting for BMI, higher vitamin C intake was associated with lower DMFT scores (IRRQ2 = 0.75, 95% CI: 0.57–0.98, p = 0.033). None of the interactions tested were statistically significant.
In sensitivity analyses, when we examined nutrient intake in relation to odds of dental caries (yes/no), findings remained generally consistent. However, higher intake of vitamin E and vitamin K were associated with higher odds of DFT in young children. Nevertheless, for older children and adolescents, higher intakes of these nutrients continued to be associated with lower odds of DMFT (see Supplementary Table S5).
3.2 Associations of nutrient mixtures with presence of DFT or DMFT
The joint association between nutrients and DFT in children 1–5 years old or DMFT in children 6–11 and adolescents is depicted in Figure 2. Higher intake of nutrients as a mixture was associated with lower odds of DMFT in children (6–11 years) and adolescents (12–19 years). Holding all nutrients at their 75h percentile relative to 50th percentile was associated with a 0.87 (95% CrI: 0.81, 0.94) and 0.92 (95% CrI: 0.85, 0.99) lower odds of DMFT compared to no DMFT in children 6–11 and 12–19 years old, respectively (Table 4). A similar inverse pattern was observed between the nutrient mixture and DFT in children 1–5 years old, however, the 95% CrI crossed the null. Dietary phosphorous and vitamin K intake were identified as the most important contributors to the nutrient mixture in DMFT models for children 6–11 and 12–19 years old (Table 4). In univariate exposure-response plots for DMFT in children 6–11 years old (Supplementary Figure S1), phosphorous was also inversely associated with DMFT, with lower probability of DMFT at higher concentrations of phosphorous, holding all other nutrients at their median. Univariate exposure-response associations for DMFT in children 12–19 years old with vitamin K were slightly u-shaped, with higher probability of DMFT at the lowest and highest concentrations of vitamin K, when holding other nutrients at their median. We did not find evidence of pairwise interactions between nutrients in relation to DFT or DMFT in children (Supplementary Figures S2, S3). However, a pairwise interaction was visually observed between vitamin K and vitamin C in the DMFT model for adolescents (Supplementary Figure S4). Nevertheless, we did not find significant interactions between vitamin K and vitamin C in the negative binomial regression models.
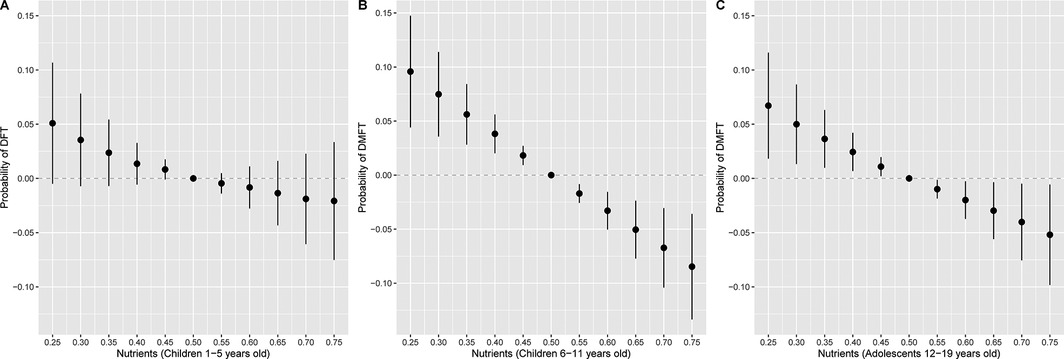
Figure 2. Overall association of the nutrient mixture on the probability of (A) DFT (n = 2,676) in children 1–5 years old or (B) DMFT in children 6–11 years old (n = 3,214) and (C) 12–19 years old (n = 3,701). Figures illustrate the probit model estimates and 95% credible intervals for DFT or DMFT vs. no DFT or DMFT of nutrients held at the percentile specified on the x-axis when compared with setting nutrients to their median values. Models were adjusted for age, sex, race and ethnicity, ratio of family income to poverty, total energy, and last dental visit.
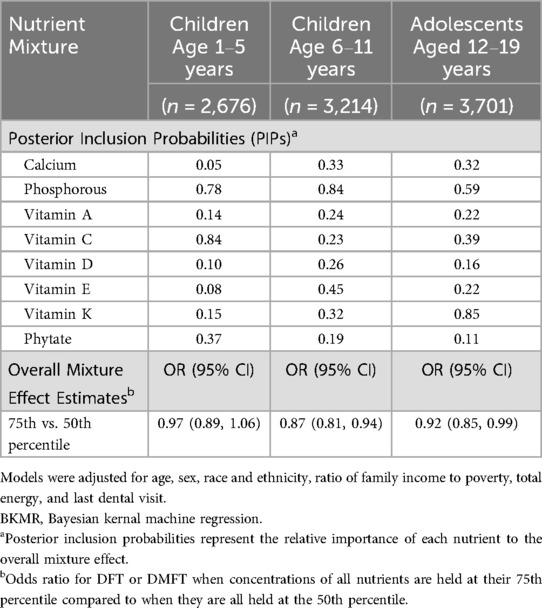
Table 4. BKMR results for the covariate adjusted joint effects of the nutrient mixture on odds of DFT or DMFT .
We observed single exposure health effects for phosphorous and Vitamin C in DFT mixtures models for children 1–5 years old (Supplementary Figure S5). When holding all other nutrients at their median, individual changes in phosphorous from its 25th to 75th percentile were associated with 0.75 (95% CrI: 0.63, 0.89) lower odds of DFT, while individual changes in Vitamin C from its 25th to 75th percentile were associated with 1.25 (95% CrI: 1.13, 1.38) higher odds of DFT (Supplementary Table S6). In DMFT mixtures models for children 6–11 years old, we found single exposure effects for phosphorous (Supplementary Figure S5) such that changes from the 25th to 75th percentile were associated with 0.79 (95% CrI: 0.67, 0.94) lower odds of DMFT (Supplementary Table S6). For DMFT mixtures models among adolescents, there were single exposure effects for phosphorous and Vitamin K (Supplementary Figure S5). Specifically, individual changes in phosphorous and Vitamin K from their 25th to 75th percentiles were associated with 0.82 (95% CrI: 0.70, 0.95) and 0.87 (95% CrI: 0.78, 0.96) lower odds of DMFT respectively, when holding other nutrients at their median (Supplementary Table S6). When adjusting for sugar in the BKMR model, joint associations between nutrients and DFT or DMFT were consistent but attenuated (Figure 3). For example, a higher nutrient mixture was similarly associated with lower odds of DMFT in children 6–11 years old, but associations were no longer observed between the nutrient mixture and odds of DMFT in adolescents 12–19 years old.
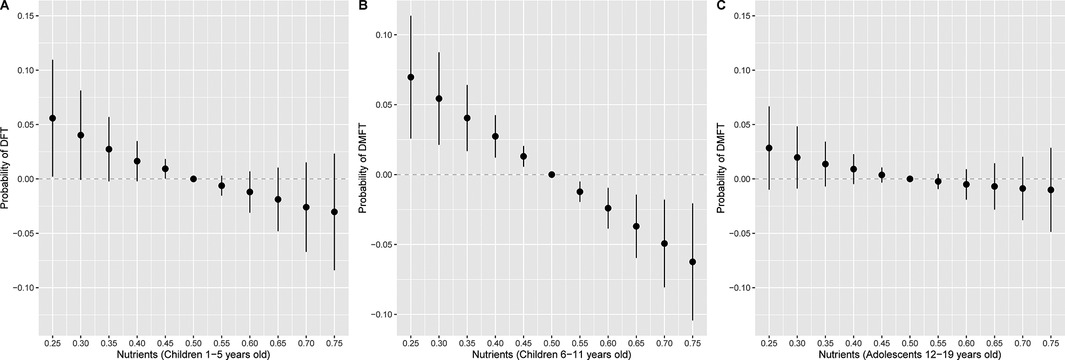
Figure 3. Overall association of the nutrient mixture on the probability of (A) DFT (n = 2,676) in children 1–5 years old or (B) DMFT in children 6–11 years old (n = 3,214) and (C) 12–19 years old (n = 3,701), additionally adjusting for daily sugar intake. Figures illustrate the probit model estimates and 95% credible intervals for DFT or DMFT vs. no DFT or DMFT of nutrients held at the percentile specified on the x-axis when compared with setting nutrients to their median values. Models were adjusted for age, sex, race and ethnicity, ratio of family income to poverty, total energy, last dental visit, and daily sugar intake.
4 Discussion
To our knowledge, this is the first contemporary study to examine associations between dietary intake of fat-soluble vitamins, vitamin C, calcium, phosphorus and phytates in relation to dental caries. Higher dietary intake of these nutrients was associated with less dental caries in youth, with phosphorus and certain fat-soluble vitamins being particularly important exposures. Specifically, higher dietary intake of vitamins A, E and K was associated with fewer dental caries in young children, older children and adolescents, respectively. Moreover, phosphorus and vitamin K appeared to be particularly important for dental health among children aged 6–11 years and adolescents when considered within the context of the other fat-soluble vitamins and minerals examined. Animal source foods including dairy products, muscle meat, organ meats and seafoods, can provide rich sources of phosphorus, as well as vitamins A and K2. Plant source foods such as seeds, beans and lentils are also high in phosphorus; orange fruits and vegetables and leafy green vegetables can be high in vitamin A, and green leafy vegetables and fermented foods can be high in vitamins K1 and K2, respectively (44–47). Additionally, avocados, as well as certain tree nuts and their oils are rich sources of vitamin E (48, 49). However, seeds, beans, nuts, legumes and whole grains may also contain antinutrients, such as phytates, that can interfere with nutrient absorption (44, 50, 51).
Findings of this study are consistent with historic studies demonstrating that fat-soluble vitamins contribute to healthy tooth formation and may even reverse dental caries. For example, Mellanby (52, 69) conducted experimental studies (52, 69) among puppies and rabbits in which she varied their diets with animal source foods rich in vitamins A, D and K2. She observed that puppies fed cod liver oil, butter, and suet (rich in vitamins A, D, and K2) had healthy tooth development, while those fed linseed oil, devoid of fat-soluble vitamins, had poor tooth development. Similarly, she observed that rabbits fed crushed oats, bran, lemon juice and calcium carbonate along with cod liver oil or egg yolks (rich in vitamins A and D) had normal tooth development and “healthy tooth calcification”. Conversely, rabbits fed the same diet but no cod liver oil or egg yolks had poor tooth calcification (52, 69). Consistently, in experimental studies of 7-year old children, Mellanby (54) and Mellanby & Pattinson (53, 55) found that children provided with a diet abundant in vitamins A and D for 6 months showed less initiation and spread of dental caries and experienced more hardening (improvement) of existing caries, when compared to children provided with less of these fat-soluble vitamins (53–55).
While the current study observed fewer dental caries among children aged 1–5 years who consumed more vitamin A in their diets, and adolescents who consumed more vitamin K in their diets, we did not observe an association of vitamin D intake with number of dental caries in any age group. Notably, participants in this study all had vitamin D intakes that were on average below the daily recommended intake ranges (42). Therefore, their vitamin D intakes may not have been sufficient or abundant enough to contribute to any potential dental health benefits. Specifically, the low average intake of vitamin D across all groups may have limited power to detect an association. Vitamin E intake also tended to be below the recommended level across all ages in this study; however, vitamin E intake may be underestimated as the amounts and types of fat added during cooking are often unknown and unaccounted for (56).
The potential importance of vitamin K for dental health observed in this study is mechanistically plausible and consistent with findings from historic studies. Vitamin K2 has been proposed as a nutrient that might help to prevent dental caries by increasing antioxidant defenses in the hypothalamus to blood sugar spikes that can contribute to dental caries (57). Furthermore, vitamin K2 acts as a co-factor of enzyme “gamma-glutamyl carboxylase” which can improve gamma-carboxylation of osteocalcin, a protein found in bones and teeth (58). Interestingly, historic observational and experimental human research conducted by Dr. Weston A. Price (59), the founder of the National Dental Association, reported a potential synergy between vitamin K2 and other fat-soluble vitamins in improving dental health. Dr. Price noted that when providing research participants with high vitamin cod liver oil (rich in vitamins A and D) along with high vitamin butter oil (rich in vitamin K2) these nutrients interacted to heal dental caries. Moreover, he highlighted the importance of calcium and phosphorus, as well as traditional dietary practices for dental caries prevention. He observed that switching from traditional diets rich in calcium, phosphorus and fat-soluble vitamins to modern diets was associated with an increase in dental caries; however, his research was not peer-reviewed [see (20) for a review of findings from peer-reviewed historic studies on nutrition and dental caries]. Nevertheless, two recent scientific reviews highlight the impact of contemporary dietary patterns and a switch toward processed foods deficient in essential nutrients, on the development of dental caries (17, 18). Similarly, another contemporary study conducted in Denmark found that a high intake of dairy foods, including milk (rich in calcium and phosphorus), may contribute to prevention of dental caries development during childhood and adolescence (14). While calcium was not associated with dental caries in this study, older children and adolescents tended to have intakes below the recommended level which could have limited any dental health benefits.
Contrary to our hypothesis, we observed that higher dietary intake of vitamin C was associated with more dental caries in young children. Fruit drinks contribute significantly to vitamin C intake among the US population, and these tend to be high in sugar (60, 61). Therefore, this association may be due to the high sugar content in fruit drinks consumed by young children, rather than vitamin C itself. Indeed, when we adjusted for sugar intake in our models, the positive association of vitamin C with dental caries was no longer statistically significant. Furthermore, research conducted in NHANES found that children aged 2–5 years who consumed fewer than five servings of fruits and vegetables (which tend to be high in vitamin C) (56, 62) per day had an increased likelihood of developing dental caries in their primary teeth (13). Additionally, vitamin C has well-documented oral health benefits (63). Unexpectedly, we also found that higher dietary phytate intake was associated with fewer dental caries in young children and not associated with dental caries among older children or adolescents. This may suggest that phytates may not be detrimental to dental health, or that some plant-based foods higher in phytates may also contribute to more favorable overall health effects that benefit dental health (64). Indeed, the capacity of phytates to reduce the solubility of fluoride, as well as calcium and phosphate, the main constituents of enamel, have been suggested as a mechanism by which phytates may prevent cavity formation (65). Furthermore, although some historic studies found phytates to have negative effects on tooth mineralization, many historic studies observed positive effects on caries from dietary protocols that included phytates within the context of a nutrient dense diet (20). Lastly, phytates are a main storage form of phosphorus (64), and therefore, the positive association between phytates and dental caries observed may have indirectly captured the potential benefit of phosphorus for dental health among younger children. However, in statistical analyses the observed relationship between phytates and DFT was not due to collinearity with phosphorus.
This study has several strengths. It utilized data from a large, nationally representative sample of the US population (NHANES 2011–2018) with standardized measures for dental caries assessment and daily dietary nutrient intake across two days. Additionally, we employed diverse and robust statistical approaches. Specifically, we employed negative binomial regression to account for overdispersion in the dental caries count data and applied the probit extension of BKMR to examine the joint associations of multiple nutrients with the probability of dental caries (40, 41). Combining these advanced statistical techniques allowed for a comprehensive and nuanced understanding of how dietary nutrients may impact dental health across different age groups. Further, all negative binomial regression analyses incorporated sampling weights, provided by NHANES, to reduce sampling bias. However, BKMR models did not integrate sampling weights or the survey design since the package has not been adapted yet.
However, this study has some limitations. First, dental caries was recorded using the DMFT index through a visual inspection technique (32) that does not use radiographs. This lack of radiographs could have underestimated the prevalence of dental caries, particularly interproximal lesions. Specifically, it may be difficult to distinguish between teeth lost due to caries compared to periodontal disease (32). Nevertheless, the DMFT is a recommended index (33), and has been widely used in numerous population-based studies (36, 37, 66, 67). In addition, the DMFT index has been shown to exhibit high reliability, with intra- and inter-examiner correlation coefficients exceeding 0.9 (68). Second, reverse causality cannot be ruled out due to the cross-sectional study design; however, given that this study included youth with relatively few dental caries on average, it is unlikely that their dental caries would have impacted dietary preferences. Lastly, the use of a self-report dietary recall method for ascertaining nutrient intake can contribute to recall bias; however, dietary misclassification in this study is likely to be non-systematic and bias associations toward the null.
5 Conclusion
This cross-sectional study found that higher dietary intake of phosphorus and fat-soluble vitamins A, E, and K was associated with fewer dental caries in a nationally representative sample of US children and adolescents. Contemporary prospective and experimental studies are needed to further examine these associations. Future research should also consider whether dietary interventions may be useful for mitigating dental caries, a common and costly public health issue.
Data availability statement
Publicly available datasets were analyzed in this study. This data can be found here: Data from National Health and Nutrition Examination Surveys (NHANES) are publicly available. The raw data supporting the conclusions of this article will be made available by the authors on reasonable request.
Ethics statement
This study was exempt from IRB review by the University of Florida (Protocol # ET00022531). The studies were conducted in accordance with the local legislation and institutional requirements. Written informed consent for participation was not required from the participants or the participants' legal guardians/next of kin in accordance with the national legislation and institutional requirements.
Author contributions
DK: Formal analysis, Writing – review & editing, Writing – original draft, Methodology, Investigation, Visualization, Data curation. IH-C: Methodology, Visualization, Investigation, Formal analysis, Writing – review & editing, Writing – original draft. DL: Data curation, Methodology, Writing – original draft, Writing – review & editing. SA: Writing – review & editing, Supervision, Methodology, Writing – original draft, Data curation. AC: Methodology, Supervision, Writing – review & editing, Investigation, Formal analysis. AM: Conceptualization, Validation, Writing – review & editing, Supervision, Resources, Funding acquisition, Writing – original draft, Project administration.
Funding
The author(s) declare that no financial support was received for the research and/or publication of this article.
Acknowledgments
We thank the participants and staff of the NHANES 2011–2018 cycles for making this research possible.
Conflict of interest
The authors declare that the research was conducted in the absence of any commercial or financial relationships that could be construed as a potential conflict of interest.
Generative AI statement
The author(s) declare that no Generative AI was used in the creation of this manuscript.
Publisher's note
All claims expressed in this article are solely those of the authors and do not necessarily represent those of their affiliated organizations, or those of the publisher, the editors and the reviewers. Any product that may be evaluated in this article, or claim that may be made by its manufacturer, is not guaranteed or endorsed by the publisher.
Supplementary material
The Supplementary Material for this article can be found online at: https://www.frontiersin.org/articles/10.3389/froh.2025.1617695/full#supplementary-material
References
1. NCHS. National Center for Health Statistics. Table 38, Dental Visits in the Past Year, by Selected Characteristics: United States, Selected Years 1997–2018 (2019). Available at: https://www.cdc.gov/nchs/data/hus/ 2019/038-508.pdf (Accessed November 25, 2024).
2. Krol DM, Whelan K. Maintaining and improving the oral health of young children. Pediatrics. (2023) 151(1):1–8. doi: 10.1542/peds.2022-060417
3. Fleming E, Afful J. Prevalence of total and untreated dental caries among youth: United States, 2015–2016. NCHS Data Brief. (2018):1–8. Available online at: http://www.ncbi.nlm.nih.gov/pubmed/2971797529717975
4. CDC. Centers for Disease Control and Prevention. Oral Health Surveillance Report: Trends in Dental Caries and Sealants, Tooth Retention, and Edentulism, United States, 1999–2004 to 2011–2016 (2019a). Available at: https://www.cdc.gov/oralhealth/ publications/OHSR-2019-index.html (Accessed November 15, 2024).
5. Anil A, Ibraheem WI, Meshni AA, Preethanath R, Anil S. Demineralization and remineralization dynamics and dental caries. In: Rusu L-C, Ardelean LC, editors. Dental Caries—the Selection of Restoration Methods and Restorative Materials. London: IntechOpen (2022). p. 1–19. doi: 10.5772/intechopen.105847
6. Tinanoff N, Baez RJ, Diaz Guillory C, Donly KJ, Feldens CA, McGrath C, et al. Early childhood caries epidemiology, aetiology, risk assessment, societal burden, management, education, and policy: global perspective. Int J Paediatr Dent. (2019) 29(3):238–48. doi: 10.1111/ipd.12484
7. Brambilla E, Ionescu AC. Oral biofilms and secondary caries formation. In: Ionescu AC, Hahnel S, editors. Oral Biofilms and Modern Dental Materials. Cham: Springer International Publishing (2021). p. 19–35. Available at: https://doi.org/10.1007/978-3-030-67388-8_3
8. Pitts NB, Twetman S, Fisher J, Marsh PD. Understanding dental caries as a non-communicable disease. Br Dent J. (2021) 231(12):749–53. doi: 10.1038/s41415-021-3775-4
9. Burne R. Alkali production by oral bacteria and protection against dental caries. FEMS Microbiol Lett. (2000) 193(1):1–6. doi: 10.1016/S0378-1097(00)00438-9
10. Liu Y-L, Nascimento M, Burne RA. Progress toward understanding the contribution of alkali generation in dental biofilms to inhibition of dental caries. Int J Oral Sci. (2012) 4(3):135–40. doi: 10.1038/ijos.2012.54
11. Banerjee A, Kang CY, An M, Koff BB, Sunder S, Kumar A, et al. Fluoride export is required for the competitive fitness of pathogenic microorganisms in dental biofilm models. mBio. (2024) 15(5):e00184-24. doi: 10.1128/mbio.00184-24
12. Fernandes JKB, Del Bel Cury AA, Caldas da Rocha DR, Cury JA, Tenuta LMA. Longevity of enamel fluoride reservoirs formed after fluoride application: an in situ study. Caries Res. (2025):1–14. doi: 10.1159/000543982
13. Dye BA, Shenkin JD, Ogden CL, Marshall TA, Levy SM, Kanellis MJ. The relationship between healthful eating practices and dental caries in children aged 2–5 years in the United States, 1988–1994. J Am Dent Assoc. (2004) 135(1):55–66. doi: 10.14219/jada.archive.2004.0021
14. Lempert SM, Christensen LB, Froberg K, Raymond K, Heitmann BL. Association between dairy intake and caries among children and adolescents. Results from the Danish EYHS follow-up study. Caries Res. (2015) 49(3):251–8. doi: 10.1159/000375505
15. Kotronia E, Brown H, Papacosta AO, Lennon LT, Weyant RJ, Whincup PH, et al. Poor oral health and the association with diet quality and intake in older people in two studies in the UK and USA. Br J Nutr. (2021) 126(1):118–30. doi: 10.1017/S0007114521000180
16. Moss ME, Luo H, Rosinger AY, Jacobs MM, Kaur R. High sugar intake from sugar-sweetened beverages is associated with prevalence of untreated decay in US adults: NHANES 2013–2016. Community Dent Oral Epidemiol. (2022) 50(6):579–88. doi: 10.1111/cdoe.12725
17. Dimopoulou M, Antoniadou M, Amargianitakis M, Gortzi O, Androutsos O, Varzakas T. Nutritional factors associated with dental caries across the lifespan: a review. Appl Sci. (2023) 13(24):13254. doi: 10.3390/app132413254
18. Hung M, Blazejewski A, Lee S, Lu J, Soto A, Schwartz C, et al. Nutritional deficiencies and associated oral health in adolescents: a comprehensive scoping review. Children. (2024) 11(7):869. doi: 10.3390/children11070869
19. Tungare S, Paranjpe AG. Diet and Nutrition to Prevent Dental Problems. YMT Dental College, Navi Mumbai. Treasure Island (FL): StatPearls Publishing (2023). Available online at: http://europepmc.org/abstract/MED/30480981
20. Malin AJ, Wang Z, Khan D, McKune SL. The potential systemic role of diet in dental caries development and arrest: a narrative review. Nutrients. (2024) 16(10):1463. doi: 10.3390/nu16101463
21. NHANES. National Health and Nutrition Examination Survey Questionnaires, Datasets, and Related Documentation. Atlanta, GA: US Department of Health and Human Services, CDC [Preprint] (2020). Available at: https://wwwn.cdc.gov/nchs/nhanes/ (Accessed May 15, 2024).
22. Moshfegh AJ, Rhodes DG, Baer DJ, Murayi T, Clemens JC, Rumpler WV, et al. The US department of agriculture automated multiple-pass method reduces bias in the collection of energy intakes. Am J Clin Nutr. (2008) 88(2):324–32. doi: 10.1093/ajcn/88.2.324
23. NHANES. National Health and Nutrition Examination Survey 2015-2016 Data Documentation, Codebook, and Frequencies Dietary Interview—Total Nutrient Intakes, Centers for Disease Control and Prevention (2018). Available at: https://wwwn.cdc.gov/Nchs/Nhanes/2015-2016/DR1TOT_I.htm (Accessed July 10, 2024).
24. National Center for Health Statistics. NHANES 2015-2016 MEC In-Person Dietary Interviewers Procedures Manual, (January) (2016). p. 331. Available at: https://wwwn.cdc.gov/nchs/data/nhanes/2015-2016/manuals/2016_MEC_In-Person_Dietary_Interviewers_Procedures_Manual.pdf (Accessed July 17, 2024).
25. Thompson FE, Subar AF. Dietary assessment methodology. In: Boushey CJ, Coulston AM, Rock CL, Monsen E, editors. Nutrition in the Prevention and Treatment of Disease. Cambridge, MA: Elsevier (2013). p. 5–46. doi: 10.1016/B978-0-12-391884-0.00001-9
26. Larvie DY, Armah SM. Estimating phytate intake from the US diet using the NHANES data. J Food Compos Anal. (2021) 102:104050. doi: 10.1016/j.jfca.2021.104050
27. Brown KH, Rivera JA, Bhutta Z, Gibson RS, King JC, Lönnerdal B, et al. International zinc nutrition consultative group (IZiNCG) technical document #1. Assessment of the risk of zinc deficiency in populations and options for its control. Food Nutr Bull. (2004) 25(1 Suppl 2):S99–203.18046856
28. Dahdouh S, Grande F, Espinosa SN, Vincent A, Gibson R, Bailey K, et al. Development of the FAO/INFOODS/IZINCG global food composition database for phytate. J Food Compos Anal. (2019) 78:42–8. doi: 10.1016/j.jfca.2019.01.023
29. USDA. US Department of Agriculture, Agricultural Research Service, Food Surveys Research Group, (USDA) (2024). Available at: https://www.ars.usda.gov/northeast-area/beltsville-md-bhnrc/beltsville-human-nutrition-research-center/food-surveys-research-group/docs/fndds/ (Accessed July 26, 2024).
30. USDA. U.S. Department of Agriculture. Agricultural Research Service | Food Surveys Research Group. Food Patterns Equivalents Database (FPED) | Databases and SAS Data Sets, (USDA) (2023). Available at: https://www.ars.usda.gov/northeast-area/beltsville-md-bhnrc/beltsville-human-nutrition-research-center/food-surveys-research-group/docs/fped-databases/ (Accessed August 4, 2024).
31. NHANES. National Health and Nutrition Examination Survey. Oral Health Examiners Manual 2013 (2013). Available at: https://wwwn.cdc.gov/nchs/data/nhanes/2013-2014/manuals/Oral_Health_Examiners.pdf (Accessed July 17, 2024).
32. NHANES. Oral Health Examiners Manual 2016 (2016). Available at: https://wwwn.cdc.gov/nchs/data/nhanes/public/2015/manuals/2016_Oral_Health_Examiners_Procedures_Manual.pdf (Accessed July 17, 2024).
33. WHO. Oral Health Surveys: Basic Methods. Geneva: World Health Organization Press (2013). Available at: https://www.who.int/publications/i/item/9789241548649
34. The Transition Between The Primary And Permanent Teeth. Muswell Hill Smile Dental and Orthodontics (2018). Available at: https://muswellhillsmile.co.uk/blog/transition-between-primary-and-permanent-teeth/ (Accessed September 11, 2024).
35. CDC. Centers for Disease Control and Prevention. Oral health surveillance report: trends in dental caries and sealants, tooth retention, and edentulism, United States, 1999–2004 to 2011–2016. Atlanta, GA: centers for disease control and prevention, US dept of H. J Dent Educ. (2019b) 81(8):100.
36. Bidinotto AB, Martinez-Steele E, Cunha-Cruz J, Thomson WM, Hugo FN, Hilgert JB. Food processing and its association with dental caries: data from NHANES 2011–2014. Community Dent Oral Epidemiol. (2021) 49(6):565–73. doi: 10.1111/cdoe.12628
37. Piovesan ÉT, de A, Leal SC, Bernabe E. Adiposity is not associated with caries among youth in the United States. J Am Dent Assoc. (2023) 154(11):991–999.e2. doi: 10.1016/j.adaj.2023.07.013
38. Mohajeri A, Berg G, Watts A, Cheever VJ, Hung M. Obesity and dental caries in school children. J Clin Med. (2024) 13(3):860. doi: 10.3390/jcm13030860
39. NHANES. National Health and Nutrition Examination Survey. 2015–2016 Data, Documentation, Codebook, and Frequencies | Demographic Variables and Sample Weights (DEMO_I) (2017). Centers for Disease Control and Prevention.
40. Bobb JF, Claus Henn B, Valeri L, Coull BA. Statistical software for analyzing the health effects of multiple concurrent exposures via Bayesian kernel machine regression. Environ Health. (2018) 17(1):67. doi: 10.1186/s12940-018-0413-y
41. Bobb JF, Valeri L, Claus Henn B, Christiani DC, Wright RO, Mazumdar M, et al. Bayesian Kernel machine regression for estimating the health effects of multi-pollutant mixtures. Biostatistics. (2015) 16(3):493–508. doi: 10.1093/biostatistics/kxu058
42. NIH. National Institutes of Health. Office of Dietary Supplements. Dietary Supplement Fact Sheets, National Institutes of Health (2024). Available at: https://ods.od.nih.gov/factsheets/list-all/ (Accessed March 22, 2025).
43. Wallace TC, McBurney M, Fulgoni VL. Multivitamin/mineral supplement contribution to micronutrient intakes in the United States, 2007–2010. J Am Coll Nutr. (2014) 33(2):94–102. doi: 10.1080/07315724.2013.846806
44. Kalantar-Zadeh K, Gutekunst L, Mehrotra R, Kovesdy CP, Bross R, Shinaberger CS, et al. Understanding sources of dietary phosphorus in the treatment of patients with chronic kidney disease. Clin J Am Soc Nephrol. (2010) 5(3):519–30. doi: 10.2215/CJN.06080809
45. Booth SL. Vitamin K: food composition and dietary intakes. Food Nutr Res. (2012) 56(1):5505. doi: 10.3402/fnr.v56i0.5505
46. Walther B, Karl JP, Booth SL, Boyaval P. Menaquinones, bacteria, and the food supply: the relevance of dairy and fermented food products to vitamin K requirements. Adv Nutr. (2013) 4(4):463–73. doi: 10.3945/an.113.003855
47. Debelo H, Novotny JA, Ferruzzi MG. Vitamin A. Adv Nutr. (2017) 8(6):992–4. doi: 10.3945/an.116.014720
48. Fulgoni VL, Dreher M, Davenport AJ. Avocado consumption is associated with better diet quality and nutrient intake, and lower metabolic syndrome risk in US adults: results from the national health and nutrition examination survey (NHANES) 2001–2008. Nutr J. (2013) 12(1):1. doi: 10.1186/1475-2891-12-1
49. Zaaboul F, Liu Y. Vitamin E in foodstuff: nutritional, analytical, and food technology aspects. Compr Rev Food Sci Food Saf. (2022) 21(2):964–98. doi: 10.1111/1541-4337.12924
50. Peumans WJ, Van Damme E. Lectins as plant defense proteins. Plant Physiol. (1995) 109(2):347–52. doi: 10.1104/pp.109.2.347
51. Phan MAT, Paterson J, Bucknall M, Arcot J. Interactions between phytochemicals from fruits and vegetables: effects on bioactivities and bioavailability. Crit Rev Food Sci Nutr. (2018) 58(8):1310–29. doi: 10.1080/10408398.2016.1254595
52. Mellanby M. An experimental study of the influence of diet on teeth formation. Lancet. (1918) 192(4971):767–70. doi: 10.1016/S0140-6736(01)04455-5
53. Mellanby M, Pattison CL. Some factors of diet influencing the spread of caries in children. Brit Dent J. (1926) 47:1045–57.
54. Mellanby M, Pattison CL, Proud JW. The effect of diet on the development and extension of caries in the teeth of children: (preliminary note.). Br Med J. (1924) 2(3322):354–5. doi: 10.1136/bmj.2.3322.354
55. Mellanby M, Pattison CL. The action of vitamin D in preventing the spread and promoting the arrest of caries in children. Br Med J. (1928) 2(3545):1079–82. doi: 10.1136/bmj.2.3545.1079
56. Medicine I. Dietary Reference Intakes for Vitamin C, Vitamin E, Selenium, and Carotenoids, Institute of Medicine. Washington, D.C.: National Academies Press (2000). Available online at: https://doi.org/10.17226/9810
57. Southward K. A hypothetical role for vitamin K2 in the endocrine and exocrine aspects of dental caries. Med Hypotheses. (2015) 84(3):276–80. doi: 10.1016/j.mehy.2015.01.011
58. Stock M, Schett G. Vitamin K-dependent proteins in skeletal development and disease. Int J Mol Sci. (2021) 22(17):9328. doi: 10.3390/ijms22179328
59. Price WA. Nutrition and physical degeneration: a comparison of primitive and modern diets and their effects. Am J Public Health Nations Health. (1939) 29(12):1358–9. doi: 10.2105/AJPH.29.12.1358
60. Eicher-Miller HA, Fulgoni VL, Keast DR. Contributions of processed foods to dietary intake in the US from 20032008: a report of the food and nutrition science solutions joint task force of the academy of nutrition and dietetics, American society for nutrition, institute of food technologists, and international food information council. J Nutr. (2012) 142(11):2065S–72. doi: 10.3945/jn.112.164442
61. Huth PJ, Fulgoni VL, Keast DR, Park K, Auestad N. Major food sources of calories, added sugars, and saturated fat and their contribution to essential nutrient intakes in the U.S. diet: data from the national health and nutrition examination survey (2003–2006). Nutr J. (2013) 12(1):116. doi: 10.1186/1475-2891-12-116
62. USDA. U.S. Department of Agriculture, Agricultural Research Service. FoodData Central, Oranges, Raw, Navels (2019). Available at: https://fdc.nal.usda.gov/ (Accessed April 9, 2025).
63. Rosa A, Pujia AM, Arcuri C. The protective role antioxidant of vitamin C in the prevention of oral disease: a scoping review of current literature. Eur J Dent. (2024) 18(04):965–70. doi: 10.1055/s-0044-1786845
64. Kumar V, Sinha AK, Makkar HPS, Becker K. Dietary roles of phytate and phytase in human nutrition: a review. Food Chem. (2010) 120(4):945–59. doi: 10.1016/j.foodchem.2009.11.052
65. Kaufman HW, Kleinberg I. Effect of pH on calcium binding by phytic acid and its inositol phosphoric acid derivatives and on the solubility of their calcium salts. Arch Oral Biol. (1971) 16(4):445–60. doi: 10.1016/0003-9969(71)90168-3
66. Blostein FA, Jansen EC, Jones AD, Marshall TA, Foxman B. Dietary patterns associated with dental caries in adults in the United States. Community Dent Oral Epidemiol. (2020) 48(2):119–29. doi: 10.1111/cdoe.12509
67. Rigo L, Bidinotto AB, Hugo FN, Neves M, Hilgert JB. Untreated caries and serum vitamin D levels in children and youth of the United States: NHANES 2013–2014. Braz Dent J. (2023) 34(1):99–106. doi: 10.1590/0103-6440202305123
68. Roland E, Gueguen G, Longis MJ, Boiselle J. Validation of the reproducibility of the DMF index used in bucco-dental epidemiology and evaluation of its 2 clinical forms. World Health Stat Q. Rapp Trimest Statist Sanit Mond. (1994) 47(2):44–61.
Keywords: DMFT score, dental caries, dietary nutrients, fat soluble vitamins, phosphorus, NHANES, children, adolescents
Citation: Khan D, Hernandez-Castro I, Larvie DY, Armah SM, Cardenas A and Malin AJ (2025) Higher fat-soluble vitamin and phosphorus intake are associated with less dental caries among children and adolescents in the United States, NHANES 2011–2018. Front. Oral Health 6:1617695. doi: 10.3389/froh.2025.1617695
Received: 24 April 2025; Accepted: 20 June 2025;
Published: 9 July 2025.
Edited by:
Lina Marin, University of Saskatchewan, CanadaReviewed by:
Alessio Rosa, University of Rome Tor Vergata, ItalyViviana Avila, El Bosque University, Colombia
Copyright: © 2025 Khan, Hernandez-Castro, Larvie, Armah, Cardenas and Malin. This is an open-access article distributed under the terms of the Creative Commons Attribution License (CC BY). The use, distribution or reproduction in other forums is permitted, provided the original author(s) and the copyright owner(s) are credited and that the original publication in this journal is cited, in accordance with accepted academic practice. No use, distribution or reproduction is permitted which does not comply with these terms.
*Correspondence: Ashley J. Malin, YXNobGV5bWFsaW5AdWZsLmVkdQ==