 Irum Shahzadi
 Mohammad M. Shah
- Biotechnology Program, Department of Environmental Sciences, COMSATS Institute of Information Technology, Abbottabad, Pakistan
Wild marigold (Tagetes minuta), a flowering plant of the family Asteraceae contains compounds of pharmaceutical and nutritional importance especially essential oils and flavonols. Identification, characterization of flavonols and determination of their antibacterial activity were major objectives of the current study. The isolation and purification of flavonols was accomplished using chromatographic techniques while structural elucidation was completed by LC–MS and NMR spectroscopy. The extracts and purified compounds were tested against various bacterial strains for antibacterial activity. A total of 19 flavonols were isolated from this species. Of these, 17 were of butanol and two of ethyl acetate extracts. Based on the concentration and purity, eight potential flavonols were selected and structurally elucidated. Four flavonols, 6-hydroxyquercetin 7-O-β-(6′′-galloylglucopyranoside; 2), 6-hydroxykaempferol 7-O-β-glucopyranoside (5), 6-hydroxykaempferol 7-O-β-(6′′-galloylglucopyranoside; 7), 6-hydroxyquercetin 7-O-β-(6′′-caffeoylglucopyranoside; 9), were identified for the first time from T. minuta. Butanol and ethyl acetate extracts of flowers and seeds showed significant antibacterial activity against Micrococcus leteus, Staphylococcus aureus, Bacillus subtilis, and Pseudomonas pikettii. Among the isolated flavonols only 1, 2, and 18 were found to possess significant antibacterial activity against M. luteus. The extracts and purified flavonols from T. minuta can be potential candidates for antibacterial drug discovery and support to ethnopharmacological use.
Introduction
The genus Tagetes includes 56 species (Soule, 1993), widely grown all over the world for multipurpose uses including ornamental, medicinal, cultural, nutritional and therapeutics (Vasudevan et al., 1997; Shahzadi et al., 2010). Tagetes minuta (wild marigold) is a potential medicinal plant of the family Asteraceae and is widely grown from temperate to tropical regions of the world in a wider range of climatic conditions (altitude range from 3000 to 11000 feet).
Tagetes minuta is reported to contain a number of chemical and biochemical compounds of high pharmaceutical and nutritional value (Shahzadi et al., 2010). The prominent classes of compounds present in this species are essential oils and flavonols. Majority of the studies focused on the isolation and characterization of essential oils of T. minuta (Singh et al., 1992; Tankeu et al., 2013). Efforts toward the identification, isolation, and characterization of flavonols in T. minuta have been marginal.
Flavonols are secondary metabolites which represent a class of flavonoids and are widely distributed in almost all plant groups like angiosperms, gymnosperms, mosses, liverworts, and ferns. More than 393 flavonols (Vetschera and Wollenweber, 2006) and over 1331 flavonol O-glycosides (Williams, 2006) were reported with complete structural elucidation. Flavonols and flavones accumulate in the epidermal cells consequent to wounding, pathogenic attack, nutrient deficiency, temperature changes, ozone irradiation, UV protection and copigmentation in flowers and fruits (Flint et al., 1985; Koes et al., 1994; Shirley, 1996; Smith and Markham, 1998; Simmonds, 2003). These also enhanced wine color through copigmentation with anthocyanins (Baranac et al., 1997; Boulton, 2001). Flavonols are natural products and preparations containing these compounds as the principal physiologically active constituents have been employed in curing many diseases in human since ages (Cushnie and Lamb, 2005). Several plant-derived flavonols have been reported to possess antibacterial activity against some super bugs, which are becoming common causes of infections in the acute and long-term care units in hospitals (Xu and Lee, 2001; Chan et al., 2014).
Previous studies on T. minuta focused on the chemodiversity of essential oils (Singh et al., 1992; Chalchat et al., 1995; Bansal et al., 1999; Gil et al., 2000; Kaul et al., 2005; Kiran and Kaul, 2007; Upadhyaya et al., 2010; Tankeu et al., 2013), thiophenes (Gil et al., 2002; Wang et al., 2002; Saha et al., 2012; Xu et al., 2012), and flavonoids (Abdala and Seeligmann, 1995; Tereschuk et al., 1997). Major flavonols such as patuletin, quercetin, quercetagetin, and isorhamnetin along with some of their glycosides have previously been detected in T. minuta (Abdala and Seeligmann, 1983; Abdala and Seeligmann, 1995). Present study aimed at isolating, characterizing and determining antibacterial activities of flavonols present in T. minuta.
Materials and Methods
Plant Material
Tagetes minuta L plant was collected during August–October, 2010 for chemical analysis from district Abbottabad, Pakistan. The collected plants were first identified by a taxonomist and a voucher specimen was deposited (IS/ATD/H-03) at the herbarium of the Botany Department of Post-Graduate College, Abbottabad, Pakistan. The plant material was separated and divided into three different portions; (A) flowers and seeds (5.2 kg), (B) roots (3.5 kg), and (C) leaves and stems (10 kg). These portions were air dried in shade and were crushed to fine powder by locally built grinder.
Extraction and Fractionation
Powder of all plant parts were extracted at room temperature by maceration with methanol (5L X 3) for 72 h. The methanol extracts were concentrated under reduced pressure at 30°C to give dry marc of 356 g (A), 106.4 g (B), and 461 g (C). These crude extracts were separately suspended in distilled H2O and subsequently extracted with n-hexane, chloroform, ethyl acetate and n-butanol. Each fraction was dried over anhydrous sodium sulfate and evaporated to yield dried fraction HA (n-hexane, 105 g), fraction CA (chloroform, 39.3 g), fraction EA (ethyl acetate, 21.4 g), fraction BA (butanol, 53.6 g), and WA (aqueous, 120.7 g) from flower and seeds extract and fractions, HB (n-hexane, 10.7 g), CB (chloroform, 3.8 g), EB (ethyl acetate, 1.3 g), BB (butanol, 1 g), and WB (aqueous, 67.6 g) from roots extract and fractions HC (chloroform, 146.4 g), CC (chloroform, 118.6 g), EC (ethyl acetate, 16.9 g), BC (butanol, 17.9 g), and WC (aqueous, 131.6 g) from leaves and stem extract. The crude extracts were defatted by n-hexane therefore fractions HA, HB, HC and in addition aqueous fractions were also not used for further analysis.
Fractions EA (ethyl acetate, 21.4 g) and BA (butanol, 53.6 g) were separately applied to a Sephadex LH-20 column (Pharmacia, 5 cm × 50 cm) and eluted with methanol. Eighteen fractions (∼200 mL each) were collected and evaporated to dryness under reduced pressure. Fractions 1–10 containing flavonol constituents were combined, owing to their TLC similarities, and subsequently purified by semi preparative HPLC.
Isolation of Flavonols – Preparative HPLC
Various chloroform, ethyl acetate and butanol fractions were analyzed by high performance liquid chromatography (HPLC). Samples were filtered through a 0.45 μm Millipore membrane filterprior to injection.
The butanol and ethyl acetate fractions of flowers and seeds were subjected to preparative HPLC by (A) H2O-TFA (0.5%) and (B) Acetonitril-TFA (0.5%) solvents for the isolation of flavonoids using a Gilson 305/306 pump equipped with C18 reversed phase column [ODS-Hypersil column (25 cm × 2.2 cm, 5 μm)] coupled to a multidiode array detector (HP-1040 A; Supelco, Bellefonte, PA, USA). The elution profile consisted of a linear gradient from 10% B to 100% B for 40 min, isocratic elution (100% B) for the next 3 min, followed by the linear gradient from 100% B to 10% B for 5 min. The flow rate was 15 mL/min, and aliquots of 500 μL were injected.
Reversed Phase Analytical HPLC-DAD
The Agilent 1100 HPLC system was equipped with a HP 1050 diode-array detector and a 200 mm × 4.6 mm, 5 μm ODS Hypersil column (Supelco, Bellefonte, USA). The elution system was binary, with A, water (0.5% TFA), and B, acetonitrile (0.5% TFA) solvents. The elution profile for HPLC consisted of initial conditions with 90% A and 10% B followed by linear gradient elution for the next 18 min to 20% B and the subsequent linear gradient conditions: 18–26 min (to 23% B), 26–30 min (to 28% B), 30–40 min (to 100% B), isocratic elution 40–43 min (100% B), and final linear gradient elution 43–48 min (to 10% B). The flow rate was 1.0 mL/min, and aliquots of 20 μL were injected with an Agilent 1100 series micro auto sampler. The UV absorption spectra were recorded on-line during HPLC analysis over the wavelength range of 280–360 nm in steps of 2 nm.
Spectroscopy
The NMR experiments of heteronuclear multiple bond correlation (1H-13C HMBC), 2-D heteronuclear single quantum coherence (1H-13C HSQC) and 2-D homonuclear correlation experiment (1H-1H DQF-COSY), were carried out at 600.13 MHz and 150.90 MHz for 1H and 13C, respectively, on a Bruker Biospin Ultrashield Plus AV-600 MHz instrument (Fallanden, Switzerland) at 298 K. The deuteriomethyl 13C signal and the residual 1H signal of the solvent CD3OD were used as secondary references (δ 49.0 and δ 3.40 from TMS, respectively).
High-resolution LC-electrospray mass spectrometry (ESI+/TOF), spectra of 1–19 were recorded using a JEOL AccuTOF JMS-T100LC instrument in combination with an Agilent Technologies 1200 Series HPLC system. A Zorbax SB-C18 [50 mm × 2.1 mm (length × i.d.), 1.8 μm] column was used for separation, and combinations of two solvents A, H2O containing 0.5% TFA (v/v) and B, acetonitrile containing 0.5% TFA (v/v) were used for elution. The following solvent composition was used: 0–1.25 min 10–22% B (linear gradient), 1.25–5 min 22–30% B (linear gradient), 5–7 min 30% B (isocratic), 7–8 min 30–40% B (linear gradient), 8–14 min 40% B (isocratic), and 14–15 min 40–10% B (linear gradient). The flow rate was 0.4 mL/min.
Antibacterial Assay
Gram positive strains of American Type of Culture Collection (ATCC) namely Micrococcus luteus (ATCC 10240), Staphylococcus aureus (ATCC 6538), Bacillus subtilis (ATCC 6633) and Gram-negative strains namely Pseudomonas picketti (ATCC 49129), Salmonella setubal (ATCC 19196) were used to assess the antibacterial activities of the isolated compounds and extracts.
Turbidity Standard, Growth Media, and Culture Conditions
To compare the turbidity of bacterial culture McFarland (0.5 BaSO4) solution was used. The standard was prepared by adding 0.5 ml of 1% solution (w/v) of anhydrous BaCl2 to 99.5 ml of 1% solution (v/v) of H2SO4. Barium sulfate turbidity (4–6 ml) was taken in screw capped test tube and was used to compare the turbidity of bacteria. Nutrient broth medium for bacterial growth consisted of peptone (5 g/L), sodium chloride (5 g/L), starch (1 g/L), and agar (10 g/L; Oxoid, England). The nutrient agar plating medium consisted of plury peptone (5 g/L), beef extract (3 g/L), sodium chloride (8 g/L), and agar (15 g/L; Britanialab). Both media were prepared according to manufacturer’s instructions in distilled water and sterilized in autoclave at 121°C for 15 min. The bacterial cultures of selected strains were inoculated individually and incubated in a shaker at 150 rpm for overnight at 37°C.
Antibacterial Activity
The agar well-diffusion method (Bibi et al., 2011) analyzed the samples for antibacterial activity. The autoclaved nutrient agar media was allowed to cool at 45°C and 25 mL was poured in each petri plate near flame. These petri plates were incubated overnight at 37°C in an incubator to avoid contamination. The wells were made by 6 mm sterile metallic borer at 24 mm distance from each other. Extracts and isolates were analyzed at 3 mg/mL in dimethyl sulfoxide (DMSO; Sigma-Aldrich, USA). Ampicillin (Sigma-Aldrich, USA, A2804) was used as standard antibiotic (positive control), up to 50 μg/mL and pure DMSO was used as negative control. Each well was filled with 20 μL of plant extract (60 μg), positive (Ampicillin, 20 μg) and negative (DMSO) control and labeled at the back of petri dishes. The incubation of sample plates was at 37°C in incubator for 24 h and all cultures were prepared in triplicate. After 24 h of incubation period, diameter of clear zones around each well was measured, showing no bacterial growth. The mean zone of inhibition was calculated with standard deviation procedure.
Statistical Analysis
The experiments were conducted in duplicate and all the analyses were done in triplicate. One way ANOVA followed by the Duncan’s multiple-range test was used to determine significant (p < 0.05) differences among different extracts of plant material. The computer software SPSS 16.0 (SPSS, Inc., Chicago, IL, USA, package) carried out statistical analyses. The data was expressed as mean ± standard deviation (SD).
Results and Discussion
The HPLC profiles revealed that the butanol fractions contained relatively high quantities of flavonoids as compared to the ethyl acetate fractions, while non-flavonoids compounds were identified in chloroform fractions. The roots, leaves, and stem extract profiles were not of high quality and therefore were not used for further spectroscopic analysis. The HPLC profiles of the butanol fraction (flowers and seeds) showed 17, while the ethyl acetate fraction of flowers and seeds showed two major flavonols (Table 1). The absorption maxima in the UV spectra of these compounds were recorded online during HPLC analysis in the 320–360 nm region indicating flavonol 7-O-glycosides based on quercetagetin, 6-hydroxy kaempferol, quercetin, and patuletin aglycones (Harborne et al., 1991; Llorach et al., 2003; Veitch et al., 2011).
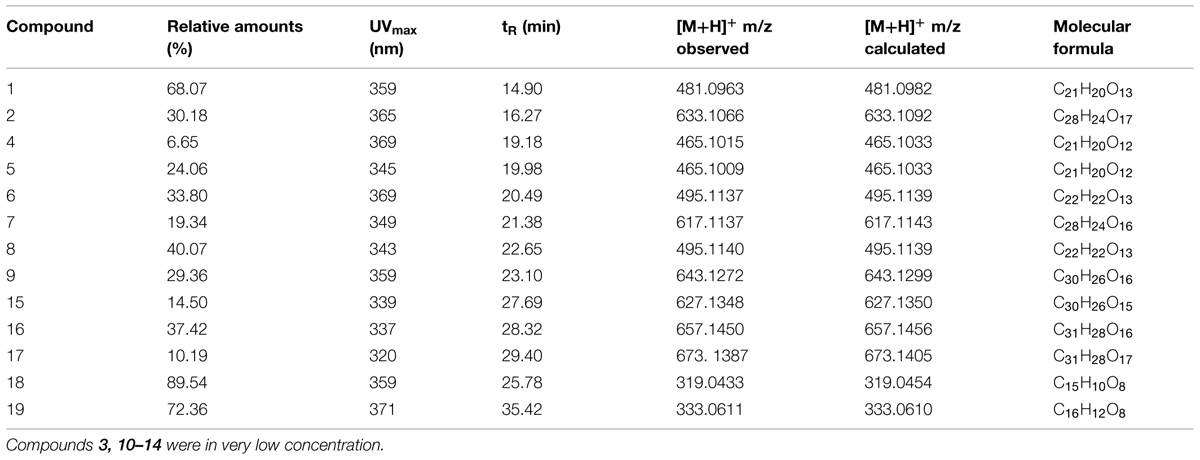
TABLE 1. Relative amounts and on-line HPLC and high-resolution electrospray ionization mass spectral data recorded for 1–19.
The spectroscopic analysis of 1–19 by UV, high-resolution LC–MS (Table 1), and 1D and 2D NMR (Tables 2 and 3) established that 2, 4, 5, 7, 9, and 15–17 (Figure 1) were previously not been reported to occur in T. minuta. This is the first complete identification of compound 7 in T. minuta, which was tentatively identified previously (Parejo et al., 2004). Flavonols 1, 6, 8, 18, and 19 have previously been reported to occur in T. minuta (Abdala and Seeligmann, 1995), however, this is the first NMR characterization of 1, 6, 18, and 19 isolates from T. minuta. Compounds 3, 10–14 were found in very low concentration for spectroscopic analysis.
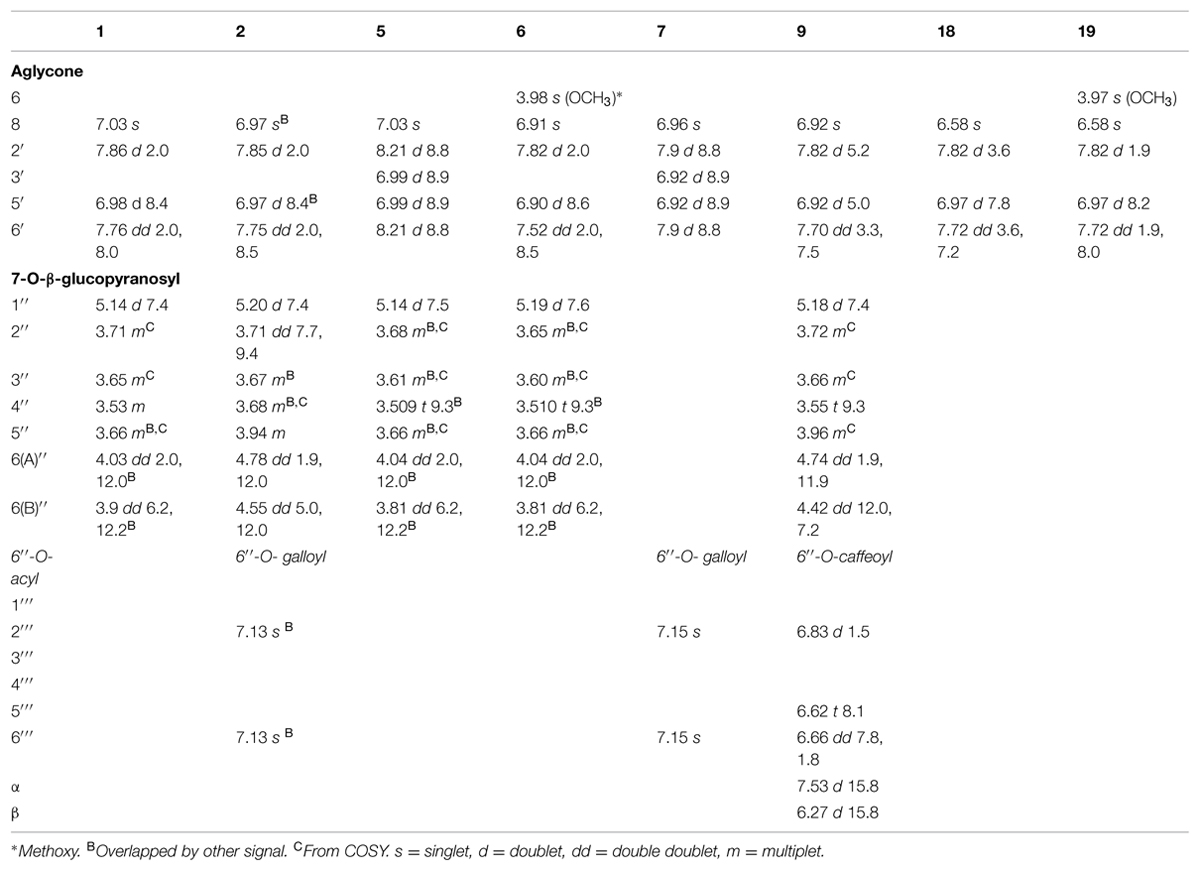
TABLE 2. 1H NMR spectral data for 1, 2, 5–7, 9, 18, 19 in CD3OD at 25°C.
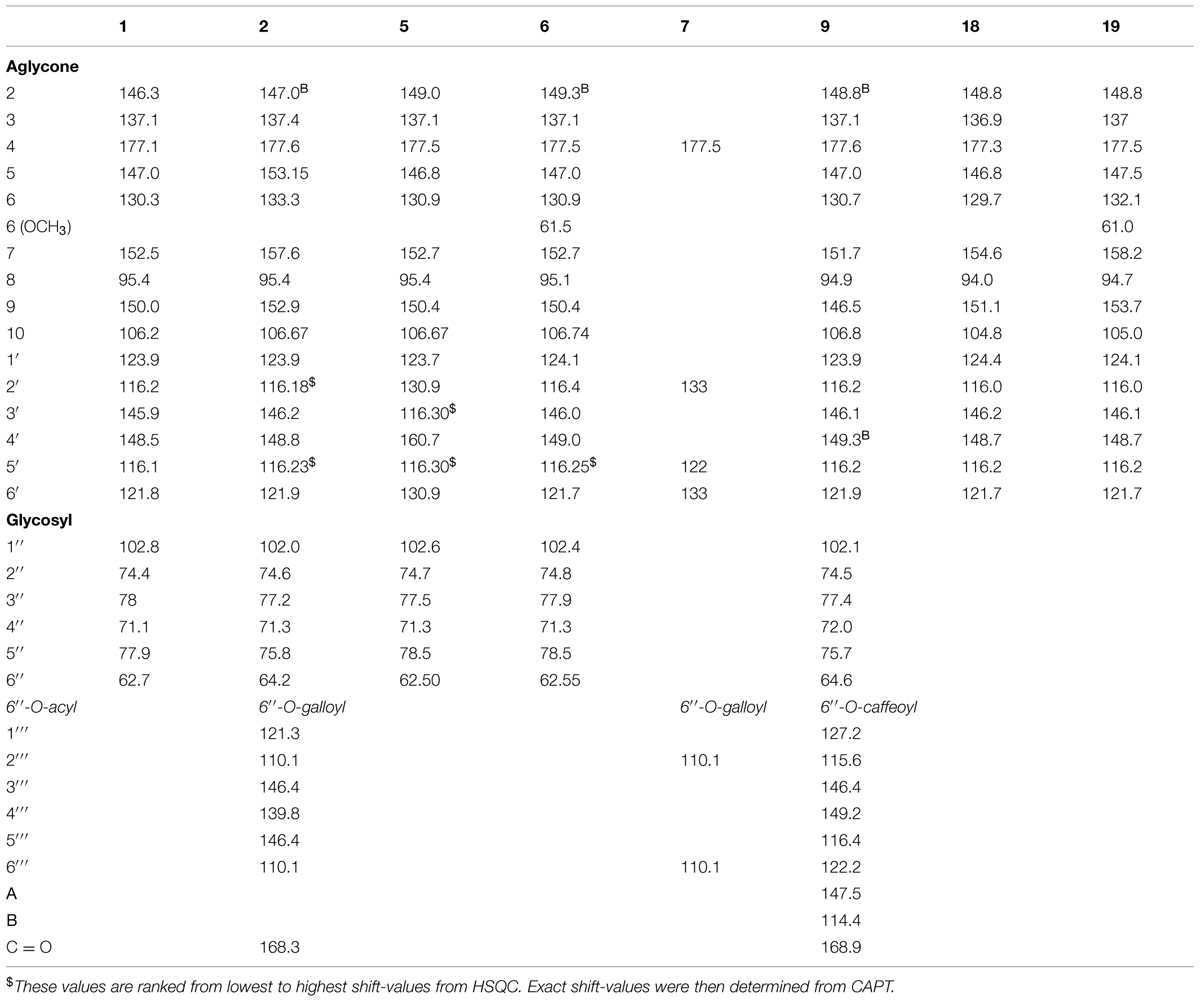
TABLE 3. 13C NMR spectral data for 1, 2, 5–7, 9, 18, 19 in CD3OD at 25°C.
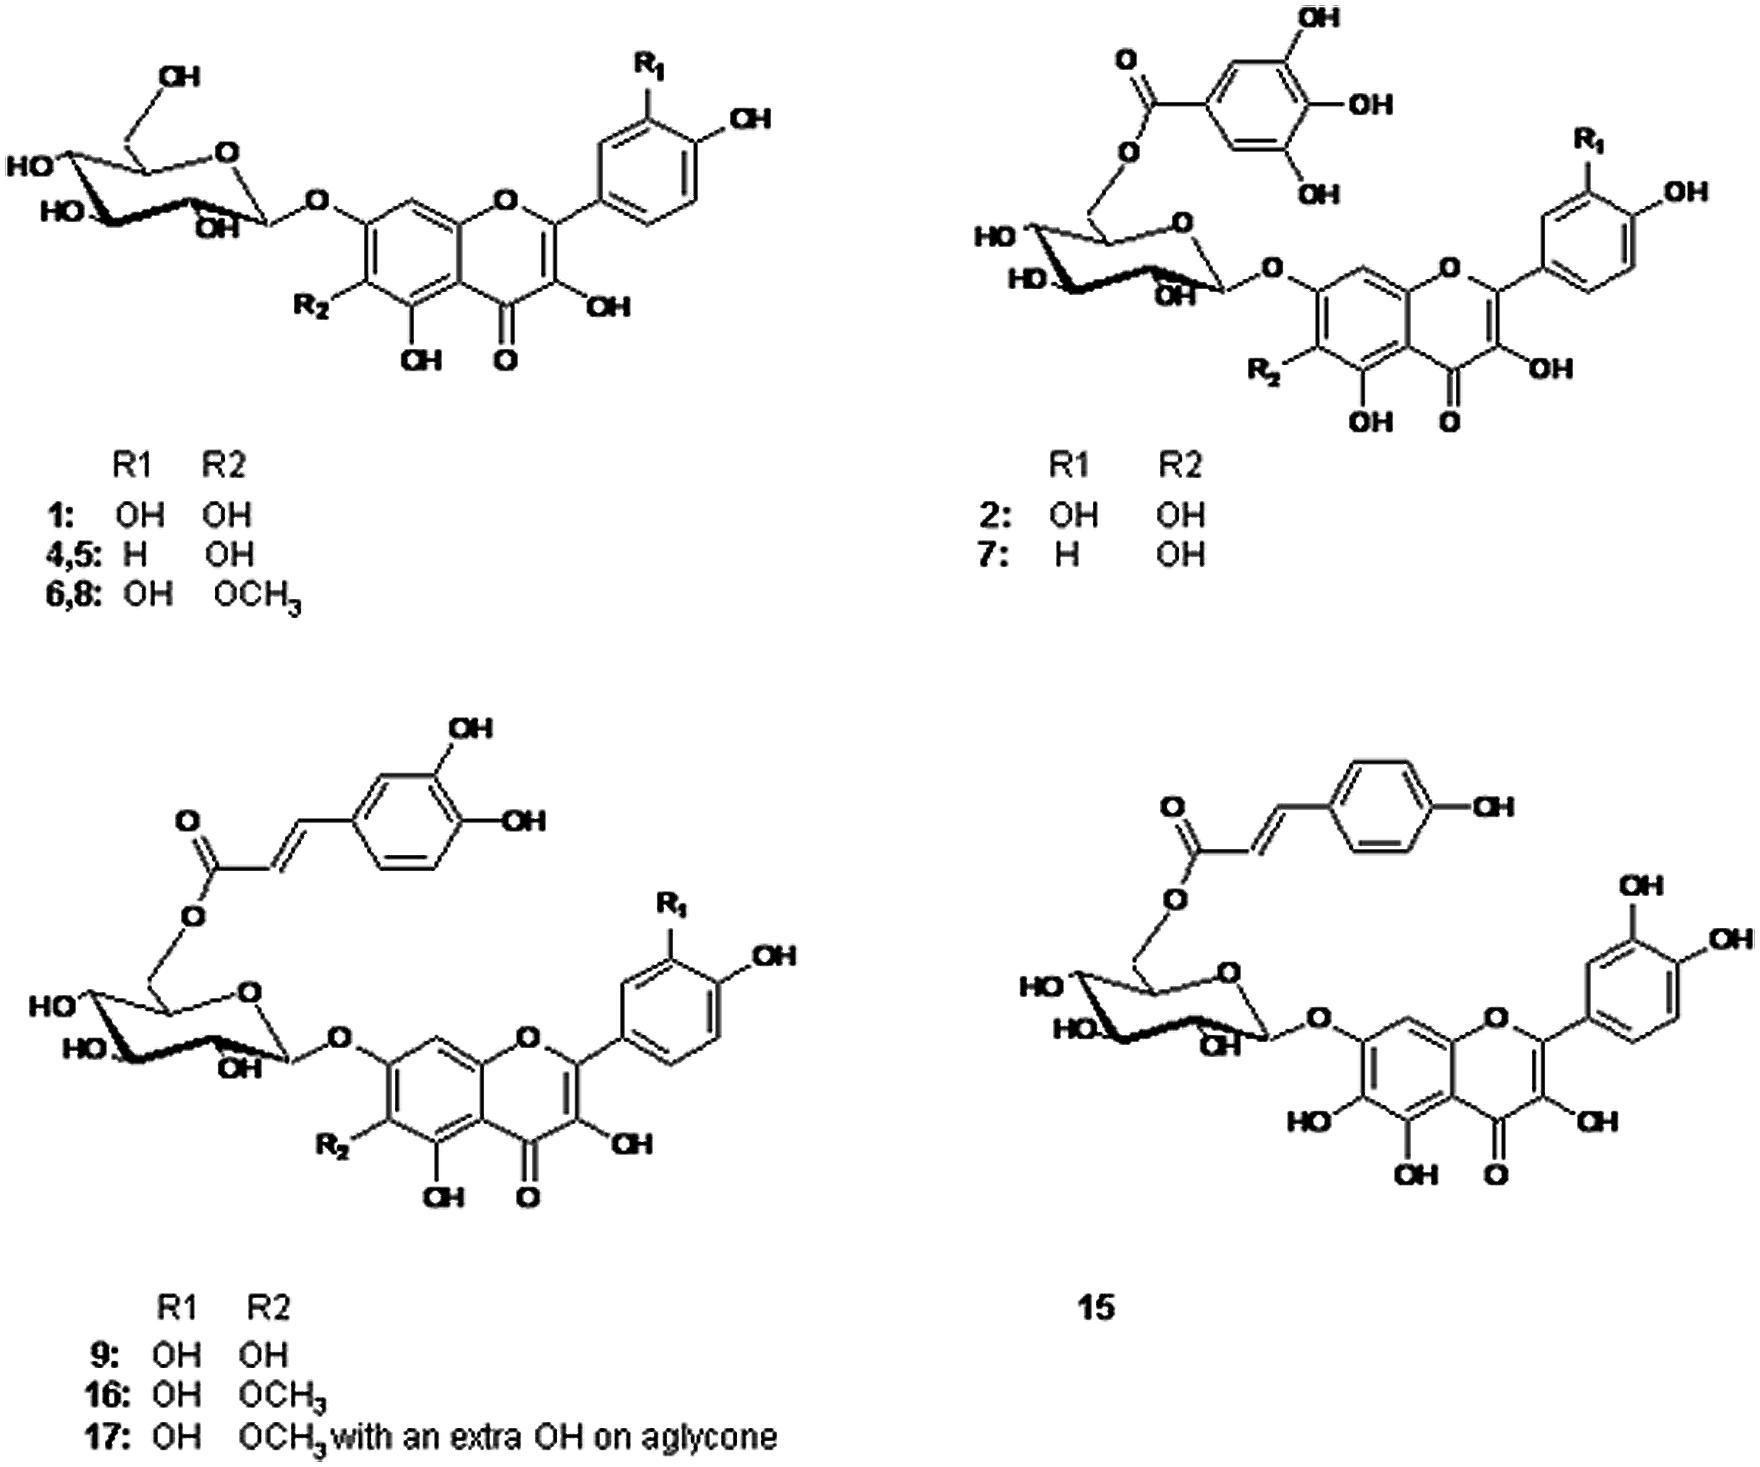
FIGURE 1. Structures of the flavonols identified in the examined Tagetes minuta. 1: 6OH Qc 7-glc, 4, 5: 6OH Kf 7-glc, 6, 8: 6MeO Qc 7-glc, 2: 6OH Qc 7Gao Glc, 7: 6OH Kf 7Gao Glc, 9: 6OH Qc 7Caf Glc, 15: 6OH Qc 7Cum Glc, 16: 6MeO Qc 7Caf Glc, 17: 6MeO Qc 7Caf Glc with a OH on aglycone. Qc = quercetin; Kf = kaempferol; Glc = glucoside; Gao = galloyl; Caf = caffeoyl; Cum = coumaroyl.
NMR Elucidation of Compounds
The downfield part of the 1D 1H NMR spectrum of 1 and 18 showed a 3H ABX system at 7.76 ppm (1: dd 2.0 Hz, 8.0 Hz; H-6′), 7.72 ppm (18: dd 3.6 Hz, 7.2 Hz; H-6′), 7.86 ppm (1: d 2.0 Hz; H-2′), 7.82 ppm (18: d 3.6 Hz; H-2′), 6.98 ppm (1: d 8.4 Hz; H-5′) and 6.97 ppm (18: d 7.8 Hz; H-5′), and an unresolved singlet at 7.03 ppm (1: H-8) and 6.58 ppm (18: H-8). In the HMBC spectrum of 1 the aromatic proton at 7.03 ppm showed correlations to the aromatic carbons at 106.2 ppm (C-10), 130.3 ppm (C-6), 150.0 ppm (C-9), 152.5 ppm (C-7), as well as to the carbonyl function at 177.1 ppm (C-4), revealing the aglycone to be 6-hydroxyquercetin (Table 3). The 1H and 13C NMR data of the glycone moiety was quite similar to those of quercetagetin (6-hydroxyquercetin; Abdala, 1999; Senatore et al., 1999; Aquino et al., 2002).The molecular mass at m/z 319.0435 of 1 and 319.0433 of 18 in their ESI high-resolution MS spectra were in accordance with 6-hydroxyquercetin (C15H10O8 + H+; calc: 319.0454).
The sugar region of the 1D 1H NMR spectrum of 1 showed the presence of one sugar unit by the single anomeric proton signal at 5.14 ppm (J = 7.4 Hz). In the COSY spectrum of this proton the observed crosspeak at 5.14/3.71 and the following crosspeaks were in accordance with seven sugar protons, which indicated that this sugar unit was a hexosyl. The corresponding crosspeaks in the HSQC spectrum permitted the assignment of H-2′′, H-3′′, H-4′′, H-5′′, H-6A′′ and H-6B′′, and the chemical shifts and coupling constants of 1 were in accordance with β-glucopyranosyl (Harborne et al., 1991; Parejo et al., 2005). A cross peak at δ 5.14/152.5 (H-1′′/C-7) in the HMBC spectrum confirmed the connection point of the sugar unit to be in the seven-position of the aglycone (Harborne et al., 1991). The molecular mass at m/z 481.0963 in the ESI high resolution mass spectrum of 1 was in accordance with 6-hydroxyquercetin 7-O-β-glucopyranoside (C21H20O13 + H+; calc: 481.0982).
The 1H NMR spectrum of flavonol 2 shared many similarities with the corresponding resonances of 1 (Table 2). However, the chemical shift values of H-6A′′ (4.78 ppm), H-6B′′ (4.55 ppm), H-5′′ (3.94 ppm) and C-6′′ (64.2 ppm) of the sugar, indicated the presence of acylation at the 6′′-hydroxyl. The two-proton singlet at 7.13 ppm of H-2′′′ and H-6′′′ in the 1D 1H NMR spectrum of 2 was in accordance with a galloyl unit (Table 2; Brakat et al., 1999; Chan et al., 2014). The crosspeaks at δ 4.78/168.3 (H-6A′′/C = O galloyl) and δ 4.55/168.3 (H-6B′′/C = O gallyol) confirmed the linkage between the 7-glucosyl and the galloyl moiety to be at the 6′′-hydroxyl (Tables 2 and 3; Brakat et al., 1999). Figure 2 shows the UV spectra of the three compounds 2 with UVmax at 365 nm, 9 with UVmax at 359 nm and 15 with UVmax at 339 nm respectively. The molecular mass at m/z 633.1066 (C28H24O17 + H+; calc: 633.1092) in the high resolution MS spectrum of 2 was in accordance with 6-hydroxyquercetin 7-O-β-(6′′-galloylglucopyranoside).
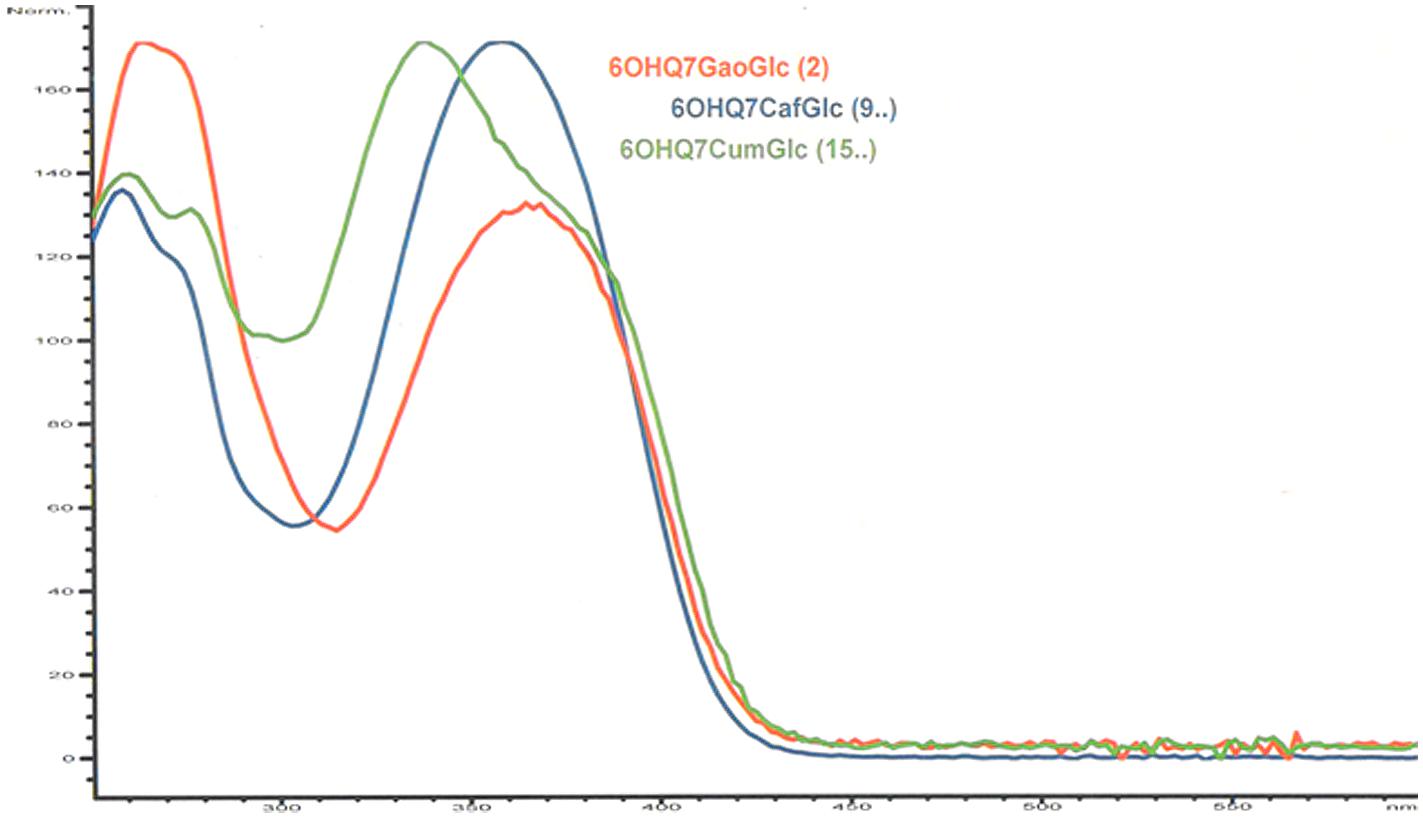
FIGURE 2. UV spectra of 2, 9, and 15 recorded on-line during HPLC analysis.
The 1H and 13C resonances of the aglycone and monosaccharide of 9 were assigned by a combination of 1D 1H NMR, DQF-COSY, HSQC, and HMBC experiments (Tables 2 and 3) to be 6-hydroxyquercetin 7-O-β-glucopyranoside. The crosspeak at δ 5.18/151.7 (H-1′′/C-7) in the HMBC spectra confirmed the linkage between the aglycone and sugar unit to be at the 7-hydroxyl moity. The doublets at δ 6.83 (1.5 Hz; H-2′′′), δ 6.62 (8.1Hz; H-5′′′), δ 7.53 (15.8 Hz; H-α) and δ 6.27 (15.8 Hz; H-β), and the double doublet at δ 6.66 (dd, 7.8Hz, 1.8Hz; H-6′′′) in the 1D 1H NMR spectrum of 9 was in accordance with a caffeoyl unit. These data were consistent with the presence of a caffeoyl moiety (Table 2; Nair et al., 1993; Diaz and Herz, 2010). The crosspeaks at δ 4.74/168.9 (H-6A′′/C = O caffeoyl) and δ 4.42/168.9 (H-6B′′/C = O caffeoyl) in the HMBC spectrum confirmed that an acyl moiety was linked to be at the 6′′-hydroxyl (Table 3; Nair et al., 1993). The molecular mass at m/z 643.1272 (C30H26O16 + H+; calc: 643.1299) in the high resolution MS spectrum of 9 was in accordance with 6-hydroxyquercetin 7-O-β-(6′′-caffeoylglucopyranoside).
The UV spectra of 5 and 7 showed UVmax at 345 nm and 349 nm, respectively (Table 1). The 1D 1H NMR spectrum of 5 showed a singlet at 7.03 ppm (H-8) and a 4H ABXY system of two doublets at 8.21 ppm (d, 8.8 Hz; H-2′′ and H-6′′) and 6.99 ppm (d 8.9 Hz; H-3′′ and H-5′′) in accordance with the flavonol, 6-hydroxykaempferol (Table 2; Hattori et al., 1992). On the basis of signals in the 1D 1H NMR, 1H-1H COSY,1H-1H TOCSY,1H-13C HSQC 1H-13C HMBC spectra, the chemical shifts (1H and 13C) of 5 were in agreement with 6-hydroxykaempferol linked to one β-glucopyranose unit (Hattori et al., 1992). The crosspeak at 5.14/152.7 ppm (H-1′′/C-7) in HMBC spectra confirmed the linkage between the aglycone and the sugar unit to be at the 7-hydroxyl (Table 3). The molecular mass at m/z 465.1009 in the ESI-MS spectrum of 5 was in accordance with 6-hydroxykaempferol 7-O-β-glucopyranoside (C21H20O12 + H+; calc: 465.1033).
The chemical shift values in 1D 1H NMR spectrum of 7 were similar to those of 5. It showed a singlet at 6.96 ppm (H-8) and a 4H ABXY system of two doublets at 7.9 ppm (d, 8.8 Hz; H-2′′ and H-6′′) and 6.92 ppm (d 8.9 Hz; H-3′′ and H-5′′) were in accordance with the flavonol, 6-hydroxykaempferol (Table 2). The ESI-MS spectra showed the fragment ion due to cleavage of the glycosidic bond, which suggested the presence of 6-hydroxykaempferol (m/z 303.0485). Some of the NMR signals were missing or very weak, but the singlet at 7.15 ppm of H-2′′′ and H-6′′′ in the 1D 1H NMR spectrum of 7 was in accordance with a galloyl unit (Brakat et al., 1999). The molecular mass at m/z 617.1137 in the high-resolution ESI-MS spectrum was in accordance with 6-hydroxykaempferol 7-O-β-(6′′-galloylglucopyranoside; C28H24O16 + H+; calc: 617.1143).
The 1D 1H NMR spectra of 6 and 19 revealed the presence of 6-methoxyquercetin aglycone. Each of their 1H NMR spectrum showed four aromatic proton resonances, a singlet at 6.91 ppm (6: H-8), 6.58 ppm (19: H-8) 7.52 ppm (6: dd 2.0 Hz, 8.5 Hz; H-6′), 7.72 ppm (19: dd 1.9 Hz, 8.0 Hz; H-6′), 7.82 ppm (6: d 2.0 Hz; H-2′), 7.82 ppm (19: d 1.9 Hz; H-2′), 6.90 ppm (6: d 8.6 Hz; H-5′) and 6.97 ppm (19: d 8.2 Hz; H-5′) along with a methoxy group at 3.98 ppm (6) and 3.97 ppm (19). The peaks assigned in 1H NMR corresponded to 6-methoxyquercetin (Andrade et al., 1999; Wei et al., 2011). The molecular mass at m/z 333.0597 of 6 and 333.0611 of 19 in the ESI high-resolution MS spectra were in accordance with 6-methoxyquercetin (C16H12O8 + H+; calc: 333.0610). 1H and 13C resonances of the monosaccharide of 6 were assigned by a combination of 1D 1H, DQF-COSY, TOCSY and experiments were in accordance with β-glucopyranosyl. The molecular mass at m/z 495.1137 in the ESI-MS spectrum of 6 was in accordance with 6-methoxy quercetin 7-O-β-glucopyranoside (C22H22O13 + H+; calc: 495.1139).
In literature, only a few reports dealing with compounds isolated from Tagetes species have addressed full structural elucidation of individual flavonoids including NMR assignments. Particularly no reference has been found with respect to NMR investigations of flavonoids in T. minuta. Abdala and Seeligmann (1995) and Tereschuk et al. (2004) have reported tentative occurrence of flavonols quercetagetin, patuletin, isorhamentin, and quercetin as aglycones with glycosides linkages without acylations in T. minuta. In the current study, we also identified 6-hydroxy- and 6-methoxyquercetin glycosides with acylation in T. minuta. 6-hydroxykaempferol was found in 5 (6-hydroxykaempferol 7-O-β-glucopyranoside) and 7 (6-hydroxykaempferol 7-O-β-(6′′ galloylglucopyranoside)) has been identified for the first time in T. minuta. The flavonols 2 (6-hydroxyquercetin 7-O-β-(6′′-galloylglucopyranoside)) and 9 (6-hydroxyquercetin 7-O-β-(6′′-caffeoylglucopyranoside)) have previously been reported only in extracts of T. maxima (Parejo et al., 2005), while this is the first report on complete identification of compound 7 in T. minuta.
Antibacterial Activity
The antibacterial activity of crude, aqueous, ethyl acetate, and n-butanol extracts of different parts (flowers and seeds, roots, leaves, and stems) of T. minuta were tested against gram positive (M. leteus, S. aureus, B. subtilis) and gram negative (P. pikettii, E. coli, S. setubal) bacteria (Table 4). The isolated flavonols 1, 2, 5, 6, 7, 9, 18, and 19 were also subjected to antibacterial screening. All the samples showed significant antibacterial activity while these samples were inactive against E. coli and S. setubal. Activity comparison of three parts of plant indicated that flowers and seeds extract have statistically significant impact. Besides the extracts, only the isolated flavonols 1, 2 of butanol and 18 of ethyl acetate extract of flowers and seeds showed statistically significant (p < 0.05) activity against M. luteus. The crude extracts were statistically significant against gram positive (B. subtilis and S. aureus) and gram negative bacteria (P. pikettii). This study indicated that extracts and isolated flavonols of T. minuta have a broad spectrum of antibacterial activity.
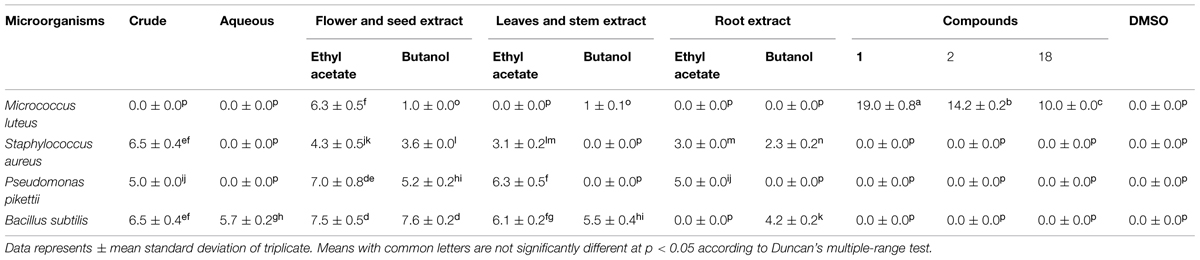
TABLE 4. Zone of inhibition (mm) of success extracts and isolated compounds of T. minuta against different bacterial stains.
The glycosilated and acylated flavonols of 6-hydroxyquercetin were strongly active in contrast to non-glycosilated flavonol. The results were in agreement with previous work of preliminary screening of the leaf extracts of C. tergemina displayed antibacterial activity against M. luteus, B. cereus, methicillin-resistant S. aureus containing acylated flavonol glycosides (Chew et al., 2011; Chan et al., 2014). The antimicrobial effect of crude flavonoids extracts has been reported in leaves of T. minuta (Tereschuk et al., 1997, 2004). The antibacterial activity of essential oil containing dihydrotagetone and ocimene has also previously been reported in T. minuta against Gram (+) and Gram (-) bacteria (Senatore et al., 2004). In this study antibacterial activity of plant extracts and purified acylated flavonol glycosides (1, 2, and 18) was reported for the first time in T. minuta.
Conclusion
The extracts and purified compounds of plant were considered as suitable candidates for antibacterial drug discovery and support ethnopharmacological use, and its economical properties for commercialization of T. minuta. Based on these findings, we envision the discovery of new antibacterial agent from natural sources (plants) that will help to minimize the adverse effects of synthetic drugs.
Conflict of Interest Statement
The authors declare that the research was conducted in the absence of any commercial or financial relationships that could be construed as a potential conflict of interest.
Acknowledgments
The study was financially supported by Higher Education Commission of Pakistan under the “International Research Support Initiative Programme-2010.” The whole research was carried out in Chemistry Laboratory under the supervision of Prof. Oyvind M. Andersen, Department of Chemistry, University of Bergen, Norway. We are grateful to Sectional Engineer Terje Lygre, Department of Chemistry, University of Bergen, for technical support during LC–MS analyses. The authors are thankful to Dr. Syed Tatheer Alam Naqvi, Department of Environmental Sciences (Biotechnology Program), CIIT Abbottabad, Pakistan for statistical analysis.
References
Abdala, L. R. (1999). Flavonoids of the aerial parts from Tagetes lucida (Asteraceae). Biochem. Syst. Ecol. 27, 753–754. doi: 10.1016/S0305-1978(99)00011-3
Abdala, L. R., and Seeligmann, P. (1983). Distribution of flavonoids from leaves of three species of Tagetes Compositae and their chemosystematics significance (In Spanish). Lilloa 36, 5–14.
Abdala, L. R., and Seeligmann, P. (1995). Natural distribution of flavonoids in Tagetes minuta. Biochem. Syst. Ecol. 23, 567–568. doi: 10.1016/0305-1978(95)00045-V
Andrade, D. D., Santos, L. D., Dokkedal, A., and Vilegas, W. (1999). Acyl glucosylated flavonols from Paepalanthus species. Phytochemistry 51, 411–415. doi: 10.1016/S0031-9422(99)00028-X
Aquino, R., Caceres, A., Morelli, S., and Rastrelli, L. (2002). An extract of Tagetes lucida and its phenolic constituents. J. Nat. Prod. 65, 1773–1776. doi: 10.1021/np020018i
Bansal, R. P., Bahl, J. R., Garg, S. N., Naqvi, A. A., Sharma, S., Ram, M., et al. (1999). Variation in quality of essential oil distilled from vegetative and reproductive stages of Tagetes minuta crop grown in North Indian plains. J. Essent. Oil Res. 11, 747–752. doi: 10.1080/10412905.1999.9712011
Baranac, J. M., Petranovic, N. A., and Dimitric-Markovic, J. M. (1997). Spectrophotometric study of anthocyanin copigmentation reactions 2. Malvin and the nonglycosidized flavone quercetin. J. Agric. Food Chem. 45, 1694–1697. doi: 10.1021/jf9606114
Bibi, Y., Nisa, S., Chaudhary, F. M., and Zia, M. (2011). Antibacterial activity of some selected medicinal plants of Pakistan. BMC Complem. Altern. Med. 11:52. doi: 10.1186/1472-6882-11-52
Boulton, R. (2001). The copigmentation of anthocyanins and its role in the colour of red wine: a critical review. Am. J. Enol. Viticult. 52, 67–87.
Brakat, H. H., Souleman, A. M., Hussein, S. A. M., Ibrahiem, O. A., and Nawwar, M. A. M. (1999). Flavonoid galloyl glucosides from the pods of Acacia farnesiana. Phytochemistry 51, 139–142. doi: 10.1016/S0031-9422(97)00010-1
Chalchat, L. C., Garry, R. P., and Muhayimana, A. (1995). Essential oil of Tagetes minuta from Rwanda and France: chemical composition according to harvesting location, growth stage and part of plant extracted. J. Essent. Oil Res. 7, 375–386. doi: 10.1080/10412905.1995.9698544
Chan, E. W. L., Gray, A. I., Igoli, J. O., Lee, S. M., and Goh, J. K. (2014). Galloylated flavonol rhamnosides from the leaves of Calliandra tergemina with antibacterial activity against methicillin-resistant Staphylococcus aureus (MRSA). Phytochemistry 107, 148–154. doi: 10.1016/j.phytochem.2014.07.028
Chew, Y. L., Chan, W. L. E., Tan, P. L., Lim, Y. Y., Stanslas, J., and Goh, J. K. (2011). Assessment of phytochemical content, polyphenolic composition, antioxidant and antibacterial activities of Leguminosae medicinal plants in Peninsular Malaysia. BMC Complement. Altern. Med. 11:12. doi: 10.1186/1472-6882-11-12
Cushnie, T. P. T., and Lamb, A. J. (2005). Antimicrobial activity of flavonoids. Int. J. Antimicrob. Agents 26, 343–356. doi: 10.1016/j.ijantimicag.2005.09.002
Diaz, J. G., and Herz, W. (2010). Acylated flavonol tetraglycosides from Delphinium gracile. Phytochemistry 71, 463–468. doi: 10.1016/j.phytochem.2009.11.011
Flint, S. D., Jordan, P. W., and Caldwell, M. M. (1985). Plant protective response to enhanced UV-B radiation under field conditions: leaf optical properties and photosynthesis. J. Photochem. Photobiol. 41, 95–99. doi: 10.1111/j.1751-1097.1985.tb03454.x
Gil, A., Ghersa, C. M., and Leicach, S. (2000). Essential oil yield and composition of Tagetes minuta accessions from Argentina. Biochem. Syst. Ecol. 28, 261–274. doi: 10.1016/S0305-1978(99)00062-9
Gil, A., Ghersa, C. M., and Perelman, S. (2002). Root thiophenes in Tagetes minuta (L.) accessions from Argentina: genetic and environmental contribution to changes in concentration and composition. Biochem. Syst. Ecol. 30, 1–13. doi: 10.1016/S0305-1978(01)00058-8
Harborne, J. B., Greenham, J., Eagles, J., and Wollenweber, E. (1991). 6-Hydroxyflavonol glycosides from Chrysactinia mexicana. Phytochemistry 30, 1044–1045. doi: 10.1016/0031-9422(91)85311-M
Hattori, M., Li, H. X., Ming, C. Q., Kawata, Y., Tezuka, Y., Kikuchi, T., et al. (1992). 6-hydroxykaempferol and its glycosides from Carthamus tinctorius petals. Phytochemistry 31, 4001–4004. doi: 10.1016/S0031-9422(00)97572-1
Kaul, P. N., Bhattacharya, A. K., Rao, B. R. R., Syamasundar, K. V., and Ramesh, S. (2005). Essential oil composition of Tagetes minuta L. fruits. J. Essent. Oil Res. 17, 184–185. doi: 10.1080/10412905.2005.9698869
Kiran, G. D. B., and Kaul, V. K. (2007). Variations in quantitative and qualitative characteristics of wild marigold (Tagetes minuta L.) oils distilled under vacuum and at NTP. Ind. Crops Prod. 26, 241–251. doi: 10.1016/j.indcrop.2007.03.013
Koes, R. E., Quattrocchio, F., and Mol, J. M. N. (1994). The flavonoid biosynthetic pathway in plants: function and evaluation. Bioessays 16, 123–132. doi: 10.1002/bies.950160209
Llorach, R., Gil-Izquierdo, A., Ferreres, F., and Tomas-Barberan, F. A. (2003). HPLC-DADMS/MS ESI characterization of unusual highly glycosylated acylated flavonoids from cauliflower (Brassica oleracea L. var. botrytis) agro industrial byproducts. J. Agric. Food Chem. 51, 3895–3899. doi: 10.1021/jf030077h
Nair, A. G. R., Jayaprakasam, R., Gunasegan, R., Bayet, C., and Voirin, B. (1993). 6-Hydroxykaempferol-7-(6′′-caffeoylglucoside) from Eupatorium grandulosum. Phytochemistry 33, 1275–1276. doi: 10.1016/0031-9422(93)85066-Z
Parejo, I., Bastida, J., Viladomat, F., and Codina, C. (2005). Acylated quercetagetin glycosides with antioxidant activity from Tagetes maxima. Phytochemistry 66, 2356–2362. doi: 10.1016/j.phytochem.2005.07.004
Parejo, I., Jauregui, O., Viladomat, F., Bastida, J., and Codina, C. (2004). Characterization of acylated flavonoids-O-glycosides and methoxylated flavonoids from Tagetes maxima by liquid chromatography coupled to electrospray ionization tandem mass spectroscopy. J. Mass Spectrom. 18, 2801–2810.
Saha, S., Walia, S., Kundu, A., Kumar, B., and Joshi, D. (2012). Antifungal acetylinic thiophenes from tagetes minuta: potential biopesticide. J. Appl. Bot. Food Qual. 85, 207–211.
Senatore, F., Agostino, D. M., and Dini, I. (1999). Two new quercetagetin O-glucosides from Tagetes mandonii. Biochem. Syst. Ecol. 27, 309–311. doi: 10.1016/S0305-1978(98)00081-7
Senatore, F., Napolitano, F., Mohamed, M. A. H., Harris, P. J. C., Mnkeni, P. N. S., and Henderson, J. (2004). Antibacterial activity of Tagetes minuta L. (Asteraceae) essential oil with different chemical composition. Flavour Fragr. J. 19, 574–578. doi: 10.1002/ffj.1358
Shahzadi, I., Hassan, A., Khan, U. W., and Shah, M. M. (2010). Evaluating biological activities of the seed extracts from Tagetes minuta L. found in Northern Pakistan. J. Med. Plants Res. 4, 2108–2112.
Shirley, B. W. (1996). Flavonoids biosynthesis: “new” functions for an “old” pathway. Trends Plant Sci. 1, 377–382.
Simmonds, M. S. J. (2003). Flavonoids-insect interactions: recent advances in our knowledge. Phytochemistry 64, 21–23. doi: 10.1016/S0031-9422(03)00293-0
Singh, B., Sood, R. P., and Singh, V. (1992). Chemical composition of Tagetes minuta L. oil from Himalachal Pradesh (India). J. Essent. Oil Res. 4, 525–526. doi: 10.1080/10412905.1992.9698123
Smith, J. G., and Markham, R. K. (1998). Tautomerism of flavonol glucosides relevance to plant UV protection and flower colour. J. Photochem. Photobiol. 118, 99–105. doi: 10.1016/S1010-6030(98)00354-2
Soule, J. A. (1993). Medicinal and beverage uses of Tagetes (Tageteae: Compositae). Am. J. Bot. 80, 177.
Tankeu, S. Y., Vermaak, I., Viljoen, A. M., Sandasi, M., and Kamatou, G. P. P. (2013). Essential oil variation of Tagetes minuta in South Africa - a chemometric approach. Biochem. Syst. Ecol. 51, 320–327. doi: 10.1016/j.bse.2013.10.003
Tereschuk, M. L., Baigori, M. D., Figueroa, L. I. C., and Abdala, L. R. (2004). Flavonoids from argentine Tagetes (Asteraceae) with antimicrobial activity. Methods Mol. Biol. 268, 317–330. doi: 10.1385/1-59259-766-1:317
Tereschuk, M. L., Riera, M. V. Q., Castro, G. R., and Abdala, L. R. (1997). Antimicrobial activity of flavonoids from leaves of Tagetes minuta. J. Ethnopharmacol. 56, 227–232. doi: 10.1016/S0378-8741(97)00038-X
Upadhyaya, K., Chanotiya, C. S., Padalia, R., Bhatt, Z. A., and Bahuguna, Y. M. (2010). Comparative phytochemistry and pharmacological evaluation of Tagetes minuta. J. Pharm. Res. 3, 1434–1437.
Vasudevan, P., Kashyp, S., and Sharma, S. (1997). Tagetes: a multipurpose plant. Bioresource Technol. 62, 29–35. doi: 10.1016/S0960-8524(97)00101-6
Veitch, N. C., Regos, I., Kite, G. C., and Treutter, D. (2011). Acylated flavonol glycosides from the forage legume, Onobrychis viciifolia (sainfoin). Phytochemistry 72, 423–429. doi: 10.1016/j.phytochem.2011.01.001
Vetschera, K. M., and Wollenweber, E. (2006). “Flavones and flavonols,” in Flavonoid: Chemistry Biochemistry and Applications, eds O. M. Andersen and K. R. Markham (Boca Raton, FL: CRC Press), 617–748.
Wang, X. G., Xu, H. H., and Zhao, S. H. (2002). Progress in insecticidal plant Marigold. J. Xi’an United Univ. 5, 5–10.
Wei, Y., Xie, Q., Fisher, D., and Sutherland, I. A. (2011). Separation of patuletin-3-O-glucoside, astragalin, quercetin, kaempferol and isorhamnetin from Flaveria bidentis (L.) Kuntze by elution-pump-out high-performance counter-current chromatography. J. Chromatogr. A 1218, 6206–6211. doi: 10.1016/j.chroma.2011.01.058
Williams, C. A. (2006). “Flavones and flavonols,” in Flavonoid: Chemistry Biochemistry and Applications, eds O. M. Andersen and K. R. Markham (Boca Raton, FL: CRC Press), 749–856.
Xu, H. X., and Lee, S. F. (2001). Activity of plant flavonoids against antibiotic resistant bacteria. Phytother. Res. 15, 39–43. doi: 10.1002/1099-1573(200102)15:1<39::AID-PTR684>3.0.CO;2-R
Keywords: Asteraceae, Tagetes minuta, 2D NMR, acylated flavonols, antibacterial
Citation: Shahzadi I and Shah MM (2015) Acylated flavonol glycosides from Tagetes minuta with antibacterial activity. Front. Pharmacol. 6:195. doi: 10.3389/fphar.2015.00195
Received: 25 May 2015; Accepted: 28 August 2015;
Published: 11 September 2015.
Edited by:
Adolfo Andrade-Cetto, Universidad Nacional Autónoma de México, MexicoReviewed by:
Fang-Rong Chang, Kaohsiung Medical University, TaiwanLuis Cláudio Nascimento Da Silva, University of Copenhagen, Denmark
Copyright © 2015 Shahzadi and Shah. This is an open-access article distributed under the terms of the Creative Commons Attribution License (CC BY). The use, distribution or reproduction in other forums is permitted, provided the original author(s) or licensor are credited and that the original publication in this journal is cited, in accordance with accepted academic practice. No use, distribution or reproduction is permitted which does not comply with these terms.
*Correspondence: Mohammad M. Shah, Biotechnology Program, Department of Environmental Sciences, COMSATS Institute of Information Technology, Abbottabad-22060, Pakistan,bW1zaGFoQGNpaXQubmV0LnBr