 Ana C. Rodrigues-Neves1,2
 Inês D. Aires1,2
 Joana Vindeirinho2,3
 Raquel Boia1,2
 Maria H. Madeira1,2
 Francisco Q. Gonçalves2,3
 Rodrigo A. Cunha2,3,4
 Paulo F. Santos1,2,5
 António F. Ambrósio1,2,4,6
 Ana R. Santiago1,2,4,6*
- 1Coimbra Institute for Clinical and Biomedical Research (iCBR), Faculty of Medicine, University of Coimbra, Coimbra, Portugal
- 2CNC.IBILI Consortium, University of Coimbra, Coimbra, Portugal
- 3Center for Neuroscience and Cell Biology, University of Coimbra, Coimbra, Portugal
- 4Faculty of Medicine, University of Coimbra, Coimbra, Portugal
- 5Department of Life Sciences, Faculty of Sciences and Technology, University of Coimbra, Coimbra, Portugal
- 6Association for Innovation and Biomedical Research on Light and Image, Coimbra, Portugal
Glaucoma is the second cause of blindness worldwide and is characterized by the degeneration of retinal ganglion cells (RGCs) and optic nerve atrophy. Increased microglia reactivity is an early event in glaucoma that may precede the loss of RGCs, suggesting that microglia and neuroinflammation are involved in the pathophysiology of this disease. Although global changes of the purinergic system have been reported in experimental and human glaucoma, it is not known if this is due to alterations of the purinergic system of microglial cells, the resident immune cells of the central nervous system. We now studied if elevated hydrostatic pressure (EHP), mimicking ocular hypertension, changed the extracellular levels of ATP and adenosine and the expression, density and activity of enzymes, transporters and receptors defining the purinergic system. The exposure of the murine microglial BV-2 cell line to EHP increased the extracellular levels of ATP and adenosine, increased the density of ecto-nucleoside triphosphate diphosphohydrolase 1 (E-NTPDase1, CD39) and decreased the density of the equilibrative nucleotide transporter 2 as well as the activity of adenosine deaminase. The expression of adenosine A1 receptor also decreased, but the adenosine A3 receptor was not affected. Notably, ATP and adenosine selectively control migration rather than phagocytosis, both bolstered by EHP. The results show that the purinergic system is altered in microglia in conditions of elevated pressure. Understanding the impact of elevated pressure on the purinergic system will help to unravel the mechanisms underlying inflammation and neurodegeneration associated with glaucoma.
Introduction
Glaucoma is a multifactorial degenerative disease characterized by the progressive loss of retinal ganglion cells (RGCs) and optic nerve fibers that leads to vision loss (Casson et al., 2012). Elevated intraocular pressure (IOP) is the most common risk factor of glaucoma and the current treatments are based on lowering the IOP (Cohen and Pasquale, 2014). However, some patients still progress to blindness despite successful control of IOP (Song et al., 2015), suggesting that the control of IOP is not sufficient to prevent RGC loss (Levin et al., 2017).
Microglial cells are the immunocompetent cells of the central nervous system (CNS). Under resting conditions, microglial cells are ramified and constantly monitor their surrounding environment. However, after an insult, microglia change their morphology and become reactive, migrate toward the lesion site, release pro-inflammatory mediators and phagocyte cell debris (Ransohoff and Perry, 2009). Sustained microglia-mediated neuroinflammation is associated with several retinal neurodegenerative diseases, namely glaucoma (Madeira et al., 2015a). Exacerbated microglia reactivity has been detected early in experimental models of glaucoma, even before RGC death (Bosco et al., 2011, 2015), suggesting that the modulation of microglia reactivity may attenuate disease progression.
Purine nucleotides are, among others, primordial mediators of cell-to-cell communication (Burnstock and Verkhratsky, 2009; Verkhratsky and Burnstock, 2014). Particularly, purines control several functions of microglia, such as chemotaxis, phagocytosis, and cytokine and chemokine release (reviewed in Di Virgilio et al., 2009). In pathological conditions, neurons, astrocytes and microglia release ATP and adenosine to the extracellular space (Sperlágh and Illes, 2007; Rodrigues et al., 2015). The ratio between the release and the removal, by enzymatic degradation and uptake, determines the extracellular levels of ATP and adenosine. ATP has been postulated to be released by vesicular exocytosis, carrier-mediated release, cytolytic release and through channels and membrane pores (Ballerini et al., 2002; Cook and McCleskey, 2002; Stout et al., 2002; Sperlágh and Illes, 2007; Gajardo-Gomez et al., 2016). Adenosine is considered to be generated by the breakdown of ATP through the actions of NTPDase (CD39) and ecto-5′-nucleotidase (CD73) (Yegutkin, 2008; Cunha, 2016), but it can also be released on its own (Sperlágh and Illes, 2007). The extracellular levels of adenosine are regulated by equilibrative nucleoside transporters (ENTs), that mediate the bidirectional adenosine transport, or through concentrative transporters (CNTs), that mediate the influx of adenosine (Yegutkin, 2008; Melani et al., 2012). Moreover, adenosine can be metabolized into adenosine monophosphate (AMP) by adenosine kinase (ADK) or into inosine by adenosine deaminase (ADA).
There are indications that the purinergic system is altered in glaucoma, as heralded by the increased levels of ATP detected in the aqueous humor of patients with glaucoma (Zhang et al., 2007; Li et al., 2011) and in experimental models of the disease (Resta et al., 2007; Reigada et al., 2008). Since microglial cells have a role in the pathophysiology of glaucoma and the purinergic system in microglial cells has been demonstrated to play a critical role in controlling inflammation and immune response in several models of neurological diseases (reviewed in Harry, 2013), we now studied the impact of elevated pressure in the set-up of the purinergic system in microglia and also assessed the role of ATP and adenosine in mediating the effects of elevated pressure in microglia phagocytosis and motility.
Materials and Methods
Microglial Cell Culture
The immortalized murine BV-2 microglia cell line was cultured in Roswell Park Memorial Institute (RPMI) medium, supplemented with 10% fetal bovine serum (FBS) and 1% of antibiotics (penicillin 100 U/ml, streptomycin 100 μg/ml) and maintained at 37°C under a humidified atmosphere with 5% CO2. For experiments, cells were cultured in RPMI with 2% FBS and 1% antibiotics at a density of 6 × 10³ cells/cm2 in 6-well-plates or at density of 1 × 10⁴ cells/cm2 in 12-well-plates.
Cells were exposed to elevated hydrostatic pressure (EHP, 70 mmHg above atmospheric pressure) for 4 or 24 h, as previously described (Madeira et al., 2016). Control cultures were kept in a standard incubator at atmospheric pressure.
ATP Quantification
The extracellular levels of ATP were measured with a luciferin-luciferase assay kit, as previously described (Cunha et al., 2000; Madeira et al., 2015b). Briefly, cell culture supernatants were collected and stored at −80°C until used. Cells were collected and protein concentration was determined by the bicinchoninic acid (BCA) method (Pierce Biotechnology). Supernatants were quickly defrosted and incubated with ATP assay mix (Sigma-Aldrich) in an opaque 96-well plate. ATP levels were measured using a VICTOR multilabel plate reader (Perkin Elmer). The ATP concentration in each sample was determined by interpolation with a standard curve obtained from an ATP stock solution and was normalized to the amount of protein. Results are presented as percentage of control.
Adenosine Quantification
The extracellular levels of adenosine were quantified using high-performance liquid chromatography (HPLC), as previously described (Vindeirinho et al., 2013). Briefly, cell supernatants were analyzed in Beckman-System Gold HPLC apparatus, with a computer controlled 126 Binary Pump Model using a 166 Variable UV detector (detection at 254 nm) and a Lichrospher 100 RP-18 (5 mm) column from Merck. An isocratic elution with 10 mM phosphate buffer (NaH2PO4; pH 6.0) and 14% methanol was performed with a flow rate of 1.5 ml/min. Adenosine was quantified by considering the retention time and absorption spectra, and then comparing with the standard curve. Results are presented as percentage of control.
Measurement of AMP Dephosphorylation
BV-2 microglial cells were washed with warm reaction buffer (in mM: 2 MgCl2, 125 NaCl, 1 KCl, 10 glucose, 10 HEPES; pH 7.4), and then incubated with 2 mM adenosine monophosphate (AMP; Sigma-Aldrich) for 40 min at 37°C. The medium was collected to quantify the free inorganic phosphate, as a measurement of AMP degradation with the Malachite Green Phosphate Assay kit, following the instructions provided by the manufacturer (Cayman Chemicals). Inorganic free phosphate was detected by spectrophotometry (620–630 nm). Results are presented as fold-change of control.
Measurement of ADA Activity
BV-2 cells were washed twice with ice-cold phosphate-buffered saline (PBS, in mM: 137 NaCl, 2.7 KCl, 10 Na2HPO4, 1.8 KH2PO4, pH 7.4) and lysed in 50 mM Tris-HCl (pH 7.2), supplemented with complete mini protease inhibitor cocktail tablets (Roche). The enzymatic activity of ADA was measured following the instructions provided by the manufacturer (Diazyme). Results were normalized to the amount of protein quantified by the BCA method, and are presented as percentage of control.
Western Blotting
BV-2 cells were washed twice with ice-cold PBS at 4°C. Cells were lysed in radioimmunoprecipitation assay buffer [RIPA, in mM: 50 Tris HCl, pH 7.4; 150 NaCl; 5 EDTA; 1% Triton X-100; 0.5% sodium deoxycholate; 0.1% sodium dodecyl sulfate (SDS)] supplemented with complete mini protease inhibitor cocktail tablets and 1 mM of dithiothreitol (DTT) at 4°C. Samples were denatured by adding 6x concentrated sample buffer (0.5 M Tris, 30% glycerol, 10% SDS, 0.6 M DTT, 0.012% bromophenol blue) and heating for 5 min at 95°C. When blotting for CD39, cells were lysed in non-reduced conditions.
Samples were separated in SDS-polyacrylamide gel electrophoresis (SDS-PAGE) and transferred onto PVDF membranes (Millipore). The membranes were blocked with 5% milk and then were incubated with the antibodies indicated in Table 1. Immunoreactive bands were visualized using Enhanced Chemi-Fluorescence system (ECF; GE Healthcare) on a Storm device (Molecular Dynamics, GE Healthcare) or with Enhance Chemiluminescence system (ECL; Bio-Rad) on a Versadoc (Bio-Rad). Digital quantification of band intensity was performed using Quantity One software (Bio-Rad). The membranes were reprobed for glyceraldehyde 3-phosphate dehydrogenase (GAPDH) to control for similar amounts of protein.
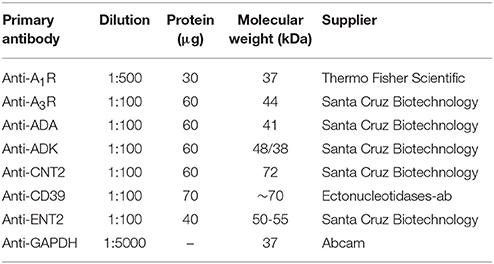
Table 1. List of primary antibodies used in Western blotting.
Immunocytochemistry
Cells were washed with ice-cold PBS and fixed using 4% of paraformaldehyde (PFA) with 4% sucrose for 10 min at room temperature (RT). After fixation, the cells were washed with PBS and permeabilized during 5 min with 1% Triton X-100 in PBS. Then, cells were blocked with 3% of bovine serum albumin (BSA; NZYtech) and 0.2% Tween-20 in PBS for 1 h at RT to prevent the non-specific binding. Afterwards, cells were incubated with the primary antibody diluted in the blocking solution for 90 min at RT (Table 2). After washing, the cells were incubated with the secondary antibody in the same solution for 1 h at RT in the dark. Then, cells were rinsed with PBS. Nuclei were stained with 4′,6-diamidino-2-phenylindole (DAPI 1:2,000; Molecular Probes, Life Technologies) and F-actin was stained with phalloidin conjugated to Tetramethylrhodamine B isothiocyanate (TRITC, 1:500; Sigma-Aldrich). Upon rising with PBS, the coverslips were mounted in glycergel mounting medium and observed with a fluorescence microscope (Axio Observer.Z1), using a LD Plan-Neofluar 40x/0.6 Korr Ph2 M27 objective.
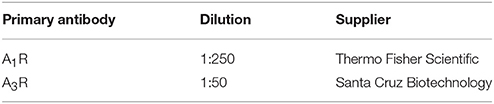
Table 2. List of primary antibodies used in immunocytochemistry.
Representative images were acquired with a confocal microscope (LSM 710, Zeiss) on an Axio Observer.Z1 microscope using Plan-Apochromat 63x/1.40 Oil Dic M27 objective.
Boyden Chamber Migration Assay
BV-2 cells were cultured in serum-free medium for 24 h before the experiment. Then, cells were plated in transwell cell culture inserts (8.0 μm pore diameter; Merck Millipore) in RPMI with 2% FBS and 1% antibiotics. Cells were incubated with apyrase (30 U/mL) and ADA (1 U/mL) followed by exposure to EHP for 4 h. At the end of the experiment, cells were washed with warm PBS and the cells in upper side of the insert were removed with a cotton swab. After fixation with 4% PFA with 4% sucrose during 10 min, the nuclei were stained with DAPI (1:2,000). The membranes were mounted in glass slides with glycergel mounting medium, and the preparations were observed with a fluorescence microscope (Axio Observer.Z1) using a N-Achroplan 5x/0.15 M27 objective. Five random images per sample were acquired. The number of cells in the bottom side of the insert (the cells that migrated) was counted and the results were expressed as percentage of control.
Phagocytosis Assay
BV-2 cells were plated in RPMI with 2% FBS and 1% antibiotics and exposed to EHP for 24 h. Cells were incubated with apyrase (30 U/mL) and ADA (1 U/mL) 2 h before the end of the experiment. One hour before the end of the experiment, BV-2 cells were incubated with 0.025% fluorescent beads at 37°C. Then, cells were washed with warm PBS and fixed with 4% PFA with 4% sucrose. BV-2 cells were stained with TRITC-conjugated phalloidin (1:500; Sigma-Aldrich) and nuclei were stained with DAPI (1:2,000). Cells were observed with a confocal microscope (LSM 710, Zeiss) using a Plan-Apochromat 20x/0.8 M27 objective and five random fields were acquired from each condition. The total number of cells in each field, the number of cells with incorporated beads and the number of fluorescent beads phagocytized by each cell were counted. The phagocytic efficiency was calculated:
where xn represents the number of cells containing n microspheres (n = 1, 2, 3 … up to a maximum of 6 points for more than 5 microspheres ingested per each cell).
Statistical Analysis
Results are presented as mean ± SEM. The number of independent experiments is indicated in each bar. Statistical analysis was performed using GraphPad Prism Version 6 (GraphPad Software). The normality of the data was assessed with Shapiro-Wilk test. Data was analyzed using the non-parametric Kruskall-Wallis test, followed by Dunn's multiple comparison test. Differences were considered significant for p < 0.05.
Results
Microglial cells are endowed with the machinery of the purinergic system (Sperlágh and Illes, 2007; Castellano et al., 2016). We now assessed how the purinergic system of microglial cells is altered after challenging the microglial cells in a pressure chamber to mimic elevated IOP.
Elevated Hydrostatic Pressure Increases Extracellular Levels of ATP and Adenosine
BV-2 cells were exposed to elevated pressure for 4 and 24 h and the levels of ATP (Figure 1A) and adenosine (Figure 1B) were quantified in cell culture medium supernatants. The exposure of microglia to EHP for 4 and 24 h increased the extracellular levels of ATP to 233.1 ± 49.9% (p < 0.01) and 187.9 ± 33.4% of control, respectively, and the adenosine levels to 124.1 ± 9.6% and 131.9 ± 9.6% of the control (p < 0.05), respectively.
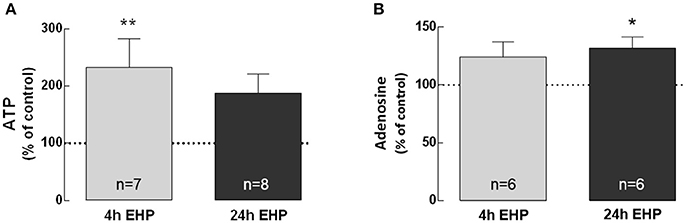
Figure 1. Elevated hydrostatic pressure increases extracellular levels of ATP and adenosine. The levels of extracellular ATP (A) and adenosine (B) were quantified in cell supernatants. Results were normalized to the amount of protein in each sample and are expressed as percentage of the control. *p < 0.05, **p < 0.01, different from control; Kruskal-Wallis test, followed by Dunn's multiple comparison test.
Elevated Hydrostatic Pressure Increases CD39 but Does Not Affect AMP Catabolism
Adenosine can be formed through the hydrolysis of adenine nucleotides [ATP, adenosine di-phosphate (ADP) and AMP] by a cascade of ectonucleotidases, including CD39 and CD73 that are expressed in several cell types, including microglia (Haskó et al., 2005).
Here, we addressed whether EHP could affect the expression of CD39 as well as AMP catabolism, both involved in adenosine formation through ATP hydrolysis. CD73 was not detected in BV-2 cells either by qPCR or Western blot (data not shown). The protein levels of CD39 significantly increased in BV-2 cells exposed to EHP for 4 and 24 h (147.3 ± 23.1% and 128.6 ± 11.0% of the control, respectively; p < 0.05; Figure 2A), which is in agreement with the previous proposal that CD39 might be a potential indicator of increased extracellular levels of ATP in retina cells (Lu et al., 2007). However, the dephosphorylation of AMP into adenosine was not altered in BV-2 cells exposed to 4 h EHP (1.0 ± 1 fold-change; Figure 2B).
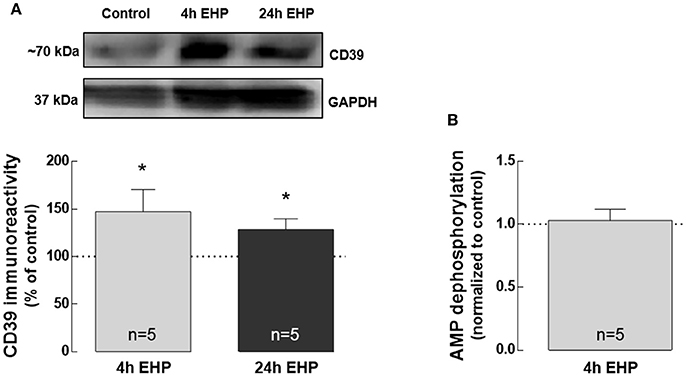
Figure 2. Elevated hydrostatic pressure increases CD39 but does not affect AMP catabolism. Total BV-2 cell extracts were assayed for CD39 (A) by Western blot. Representative images for CD39 and GAPDH (loading control) are presented above the graph. Results are expressed as percentage of control. (B) AMP dephosphorylation was evaluated by the malachite green phosphate assay in cell supernatants. Results are expressed as fold change of control. *p < 0.05, different from control; Kruskal-Wallis test, followed by Dunn's multiple comparison test.
Elevated Hydrostatic Pressure Impairs the Activity of ADA, but Not the Protein Levels of ADA and ADK
Adenosine can be removed from the extracellular space by degradation into inosine mediated by ADA, while the intracellular the removal of adenosine also occurs by the conversion into AMP mediated by adenosine kinase (Yegutkin, 2008).
The exposure of microglial cells to EHP for 4 and 24 h did not affect the protein levels of ADA and ADK (Figures 3A,C). Nevertheless, the activity of ADA (Figure 3B) significantly decreased in microglia exposed to EHP for 24 h to 67.9 ± 10.2% of the control (p < 0.05).
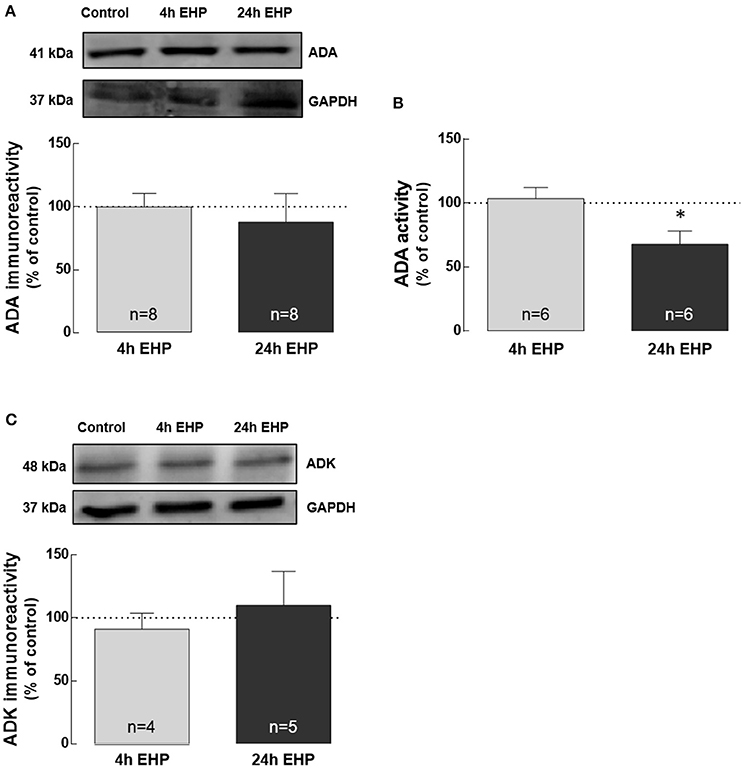
Figure 3. Elevated hydrostatic pressure impairs the activity of ADA, but not the protein levels of ADA and ADK. Total BV-2 cell extracts were assayed for ADA by Western blot (A) and enzymatic activity (B) as well as for ADK by Western blot (C). Representative images for ADA, ADK and GAPDH (loading control) are presented above the graphs (A,C). Results are expressed as percentage of control. *p < 0.05, different from control; Kruskal-Wallis test, followed by Dunn's multiple comparison test.
Elevated Hydrostatic Pressure Decreases ENT2 but Does Not Change CNT2 Protein Levels
Extracellular adenosine levels are typically regulated by nucleoside transporters or metabolism (Latini and Pedata, 2001). Hence, we also evaluated the impact of EHP exposure on the expression of nucleoside transporters ENT1, ENT2, and CNT2 in BV-2 cells.
ENT1 was not detected by Western blot (data not shown). The protein levels of ENT2 in BV-2 microglia exposed to EHP for 4 h were similar to the control. However, exposure to EHP for 24 h significantly decreased the protein levels of ENT2 in microglia (46.5 ± 9.6% of the control; p < 0.05; Figure 4A). The protein levels of CNT2 were not altered in BV-2 cells exposed to EHP (83.8 ± 13.5% and 105.2 ± 10.0% of the control, for 4 and 24 h, respectively; Figure 4B).
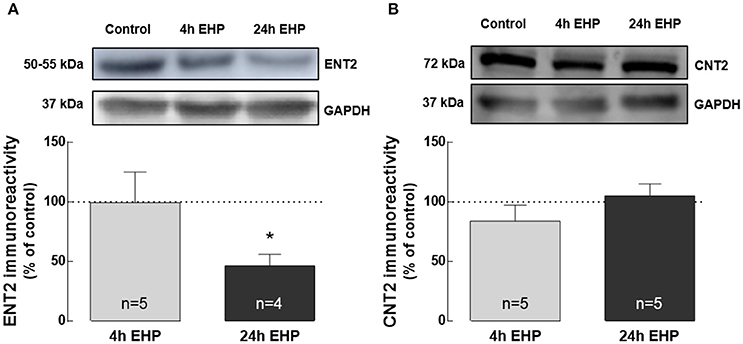
Figure 4. Elevated hydrostatic pressure decreases ENT2 but does not change CNT2 protein levels. Total BV-2 cell extracts were assayed for ENT2 (A) and CNT2 (B) by Western blot. Representative images for ENT2, CNT2, and GAPDH (loading control) are presented above the graphs. Results are expressed as percentage of control. *p < 0.05, different from control; Kruskal-Wallis test, followed by Dunn's multiple comparison test.
Elevated Hydrostatic Pressure Changes the Expression and Density of A1R but Not A3R
The actions of adenosine are dependent on the activation of the adenosine receptors. We evaluated the impact of EHP on the expression of A1R and A3R receptors in BV-2 microglial cells.
The exposure of BV-2 cells to EHP, for 4 and 24 h, decreased the protein levels of A1R to 64.5 ± 15.6% and 45.9 ± 4.2% (p < 0.05) of the control, respectively, as assessed by Western blot (Figure 5A). As we previously reported (Lopes et al., 2003), Western blot for A3R yields three bands but we quantified the more intense 44 kDa that corresponds to the expected molecular weight of A3R. This analysis revealed that the protein levels of A3R (Figure 5B) did not change in microglial cells upon exposure to EHP for 4 and 24 h (97.4 ± 17.2% and 124.0 ± 27.8% of the control, respectively).
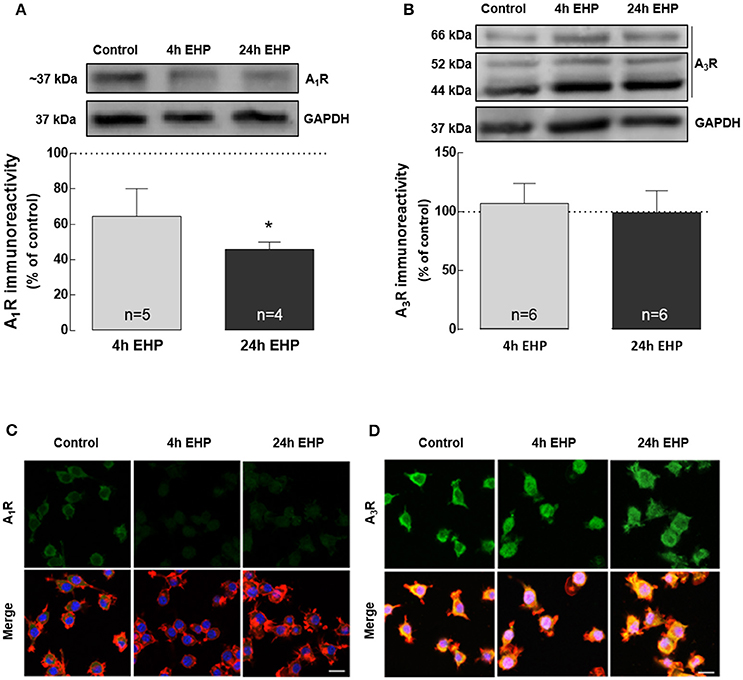
Figure 5. Elevated hydrostatic pressure changes the expression and density of A1R but not A3R. Total BV-2 cell extracts were assayed for A1R (A) and A3R (B) by Western blot. Representative images for A1R, A3R and GAPDH (loading control) are presented above the graphs. Results are expressed as percentage of control. Cells were immunolabelled with anti-A1R (green) (C) or anti-A3R (green) (D) antibodies. Phalloidin (red) staining was used to visualize cells. Nuclei were counterstained with DAPI (blue). Scale bar: 20 μm. *p < 0.05, different from control; Kruskal-Wallis test, followed by Dunn's multiple comparison test.
The effects of EHP on the immunoreactivity of A1R and A3R were also assessed by immunocytochemistry in microglia (Figures 5C,D). In microglial cells exposed to EHP, A1R immunoreactivity decreased when compared with the control, whereas the A3R immunoreactivity was similar to the control, supporting the results obtained by Western blotting.
ATP and Adenosine Mediate Microglia Migration Induced by Elevated Hydrostatic Pressure
A feature of reactive microglia is their ability to migrate toward the site of injury, where they release pro-inflammatory mediators and phagocyte cell debris (Karlstetter et al., 2010). Although the role of the purinergic system in microglia chemotaxis is well established (Honda et al., 2001; Davalos et al., 2005; Wu et al., 2007), the contribution of ATP and adenosine to the motility of microglia in conditions of elevated pressure it still unknown. Therefore, we evaluated whether EHP could affect microglia migration and if ATP and adenosine affected this process (Figure 6). When microglial cells were exposed to EHP for 4 h, the number of microglia that migrated to the bottom side of the transwell significantly increased to 220.5 ± 22.8% of the control (p < 0.05). The treatment of BV-2 cells with 30 U/ml apyrase, to remove the extracellular ATP, prevented the effect of EHP in microglia migration (98.0 ± 10.4% of the control; p < 0.01 compared with EHP). BV-2 cells were also pre-treated with 1 U/ml ADA, to remove the extracellular adenosine. The removal of extracellular adenosine also prevented the migration of microglial cells to the bottom side of the membrane elicited by EHP (115.5 ± 19.2% of the control, p < 0.01 compared with EHP). This strict dependency on extracellular ATP and adenosine for the increased migration of microglia upon EHP is also an important control to exclude the possibility that migration in EHP conditions might result from cells that were just pushed through the pores.
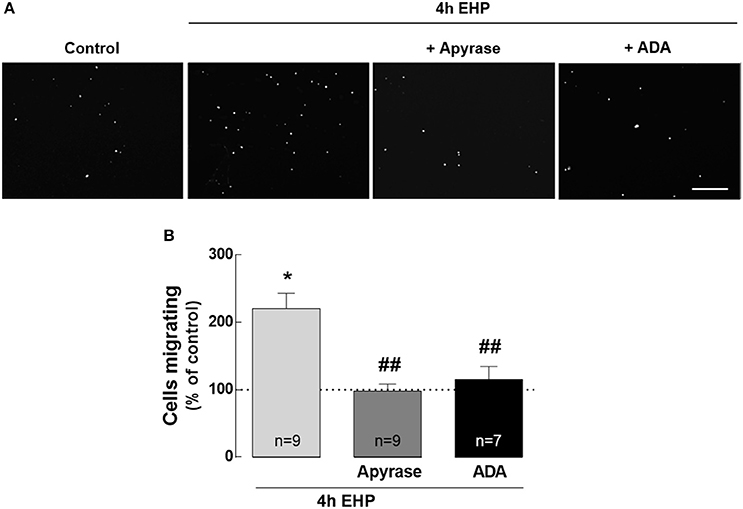
Figure 6. ATP and adenosine mediate microglia migration induced by elevated hydrostatic pressure. Cell migration was assessed with the Boyden chamber migration assay. The cell nuclei in the bottom surface of the Transwell were observed after DAPI staining (A) and the number of migrated BV-2 cells was counted. (B) Results are expressed as percentage of control. Scale bar: 100 μm. *p < 0.05, different from control; ##p < 0.01, different from 4 h EHP; Kruskal-Wallis test, followed by Dunn's multiple comparison test.
ATP and Adenosine Do Not Contribute to the Increase of Phagocytic Efficiency in Microglia Induced by Elevated Hydrostatic Pressure
Increased phagocytic efficiency is a feature of reactive microglia (Kettenmann et al., 2011). The contribution of adenosine and ATP to the phagocytic efficiency of microglia upon exposure to EHP was assessed by incubating microglia with fluorescent microbeads (Figure 7). The phagocytic efficiency of microglia exposed to EHP increased by nearly 200% when compared with control cells (from 13 ± 2% in control conditions to 25 ± 3% under EHP; p < 0.01). Incubation with apyrase (30 U/ml) and ADA (1 U/ml) was unable to decrease the phagocytic efficiency in cells under EHP (23 ± 2% and 19 ± 3%, respectively).
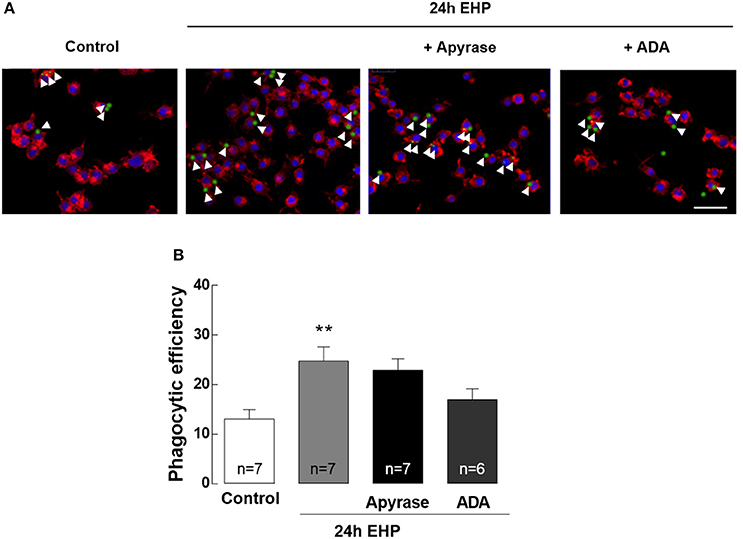
Figure 7. ATP and adenosine do not contribute to the increase of phagocytic efficiency in microglia induced by elevated hydrostatic pressure. Phagocytosis was assessed using fluorescent microbeads. (A) Representative images of BV-2 cells stained with phalloidin (red) with incorporated beads (green). Nuclei were counterstained with DAPI (blue). Arrowheads show some beads engulfed by microglia. (B) Phagocytic efficiency. Scale bar: 50 μm. **p < 0.01, different from control; Kruskal-Wallis test, followed by Dunn's multiple comparison test.
Discussion
The purinergic system is a controller of inflammation (reviewed in Di Virgilio et al., 2009) and microglia-mediated neuroinflammation contributes to the pathogenesis of glaucoma (reviewed in Madeira et al., 2015a). Here, we show for the first time that elevated pressure modifies the purinergic system of BV-2 microglial cells, altering the levels of ATP and adenosine, as well as enzymes responsible for the maintenance of purine levels, which we showed to regulate the EHP-induced microglial cell migration.
EHP increased the extracellular levels of ATP in BV-2 cells, without increasing cell death (data not shown), indicating that ATP released from these cells occurs by a non-lytic mechanism. Several reports have demonstrated the ability of microglia to release ATP under different conditions (Ferrari et al., 1997; Imura et al., 2013; Shinozaki et al., 2014; George et al., 2015). Indeed, microglia are endowed with the nucleotide transporter (VNUT) that transports cytosolic ATP into vesicles (Sawada et al., 2008) and the genetic deletion of VNUT impairs ATP release from microglia (Shinozaki et al., 2014). Other mechanisms mediate the release of ATP in microglia, namely, the carrier-mediated release (Ballerini et al., 2002), pannexins and/or hemi-channels (Gajardo-Gomez et al., 2016), as well as the cytolytic release (Sperlágh and Illes, 2007).
Increased ATP and adenosine levels have been reported in the aqueous humor of glaucoma patients (Daines et al., 2003; Zhang et al., 2007; Li et al., 2011), implicating the purinergic system in the pathophysiology of glaucoma. Increased ATP levels have been also documented in the retinas of animal models of glaucoma (Lu et al., 2015; Pérez de Lara et al., 2015) and in the vitreous of bovine eyecup preparations subjected to elevated pressure (Reigada et al., 2008). Moreover, we have recently reported that elevated pressure increases extracellular ATP in rat retinal organotypic cultures (Madeira et al., 2015b). In the retinal eyecup and organotypic models it is not possible to identify which cells release ATP, even though several cells are potential sources of extracellular ATP, such as neurons, astrocytes, Müller cells, and microglia (Rodrigues et al., 2015). Astrocytes, for instance, can release ATP when subjected to chronic mechanical strain (Beckel et al., 2014). Under mechanical strain, NLRP3 inflammasome is activated in the retina and astrocytes, due to the upregulation of IL-1β expression, which depends on ATP (released from pannexin hemichannels) and P2X7 receptor stimulation (Albalawi et al., 2017).
The levels of extracellular adenosine were increased in BV-2 microglia exposed to elevated pressure. Extracellular adenosine can arise from the direct release of adenosine into the extracellular space, or by ATP hydrolysis through ecto-enzymes (Yegutkin, 2008; Cunha, 2016), involving the conversion of ATP or ADP into AMP by CD39, followed by AMP dephosphorylation into adenosine by ecto-5′-nucleotidase (Ecto5′NTase, CD73). Increased expression of NTPDase1 in the posterior eye of rat, mouse, and primate models of glaucoma has been demonstrated (Lu et al., 2015), which is in line with our findings of increased CD39 protein levels in BV-2 cells under elevated pressure. Indeed, NTPDase1 was already proposed as an index for increased ATP levels under pathological conditions (Lu et al., 2007). However, AMP dephosphorylation in microglial cells was not altered by elevated pressure. In addition, we were unable to detect CD73, which is in accordance with a recent study that reported the absence of CD73 expression in the BV-2 cell line (Murphy et al., 2017). Importantly, other enzymes, such as alkaline phosphatase, widely distributed in cell surface, can also degrade ATP, ADP, and AMP into adenosine (Zimmermann, 2006; Yegutkin, 2008; Vardy et al., 2012), and may be responsible for the conversion of extracellular AMP into adenosine in these cells. The half-life of extracellular adenosine may be regulated by extracellular adenosine deaminase (Ecto-ADA) that irreversibly deaminates adenosine into inosine (Regateiro et al., 2013). Although no alterations were detected in the protein levels of ADA, the activity of this enzyme was decreased in cells exposed to elevated pressure, probably as a result of an allosteric modulation of ADA (Levine and Ginsburg, 2013), which we did not experimentally confirmed. This may explain the increase in extracellular adenosine levels. No changes were found in the protein levels of ADK (which converts intracellularly adenosine into AMP). Notably, this enzyme becomes easily saturated with basal concentrations of adenosine (Dunwiddie and Masino, 2001; Latini and Pedata, 2001), which prompts hypothesizing that ADK mostly controls basal levels of adenosine, but does not contribute to these increased levels of adenosine during elevated pressure.
Apart from metabolism, adenosine can also be cleared from the extracellular space by nucleoside transporters (Latini and Pedata, 2001). There are two types of adenosine transporters: equilibrative nucleoside transporters (ENTs) 1-4 and concentrative nucleoside transporters (CNTs) 1–3. Adenosine follows a concentrative gradient through ENTs, while CNTs transport nucleosides against the gradient (Thorn and Jarvis, 1996). ENTs are blocked by S-(4-nitrobenzyl)-6-thioinosine (NBMPR). In EOC-20 murine microglial cell line and in RAW264.7 macrophage cells, the majority of the adenosine transport is NBMPR-sensitive and insensitive to sodium removal, suggesting that ENTs are the primary transporters functioning in microglia (Carrier et al., 2006), where the presence of ENTs other than 1 and 2 has never been described. The decrease of ENT2 density in microglia caused by exposure to elevated pressure may affect the removal of adenosine from the extracellular space.
Adenosine mediates its actions by means of activation of G protein-coupled receptors named A1R, A2AR, A2BR, and A3R (Fredholm et al., 2001). All adenosine receptors have been described in microglial cells and microglia cell lines (Hammarberg et al., 2003; van Calker and Biber, 2005; Dare et al., 2007; Beckel et al., 2016). It is well documented that under brain noxious conditions, A1Rs are downregulated with a concomitant increase in A2AR density (reviewed in Cunha, 2005). Accordingly, we found that EHP caused A1R down-regulation in microglia and in previous reports, we demonstrated the up-regulation of A2AR in microglial cells triggered by elevated pressure (Madeira et al., 2015b, 2016). The downregulation of A1R may result from the exposure of the receptor to an excessive amount of adenosine that results in ligand-induced internalization of the receptor (Ciruela et al., 1997; Coelho et al., 2006).
The purinergic system regulates several functions of microglial cells, such as cell process extension and retraction, migration, proliferation, and phagocytosis (Davalos et al., 2005; Koizumi et al., 2007; Gomes et al., 2013; Matyash et al., 2017). Microglia migration increased under elevated pressure, and this process appears to be mediated by ATP and adenosine. Cell migration can occur by three mechanisms: basal motility (in the absence of a chemical stimulus), chemokinesis (random motility in response to a chemical stimulus), and chemotaxis (migration toward and dependent of a chemical gradient; Wilkinson, 1998; Miller and Stella, 2009). ATP is a known microglial chemotactic agent (Honda et al., 2001; Davalos et al., 2005; Wu et al., 2007) acting on P2Y12 and P2X4 receptors (Honda et al., 2001; Haynes et al., 2006). In addition to chemotaxis, ATP can mediate migration by chemokinesis (Miller and Stella, 2009). Moreover, adenosine may also play a role although it stills remains to be determined which adenosine receptor might bolster microglia chemotaxis: in fact A2ARs are responsible for microglia retraction (Orr et al., 2009), whereas it was proposed that the activation of A3R is required for ADP-induced P2Y12-mediated migration of microglia (Ohsawa et al., 2012).
Phagocytosis is a crucial function of microglia both in the surveillance and in reactive states (Mandrekar et al., 2009; Karlstetter et al., 2014; Scheiblich and Bicker, 2016). Elevated pressure increased microglia phagocytosis, but extracellular ATP and adenosine failed to prevent the increased phagocytosis, indicating that ATP and adenosine do not control this microglial function under elevated pressure conditions. In addition, ATP and adenosine per se did not change the phagocytic efficiency under basal conditions (data not shown). Others reported that the dual activation of P1 and P2 are mandatory for both migration and phagocytic capacity of microglial cells (Bulavina et al., 2013), which is not in total accordance with our results. Therefore, we cannot discard the possibility that the synergistic action of ATP and adenosine could be pivotal in phagocytosis, during elevated pressure conditions.
Our data showed for the first time that elevated pressure impaired the purinergic system of microglial cells (Figure 8) and this could interfere with microglial functions under elevated pressure. While it is important to keep in mind that an in vitro model of elevated pressure is an over-simplified model of glaucoma and that the BV-2 microglia cell line has particularities different from endogenous microglia in their native environment, the present results still pave the way to better appreciate the purinergic system in microglial cells as a putative target to be further considered for the management of glaucoma.
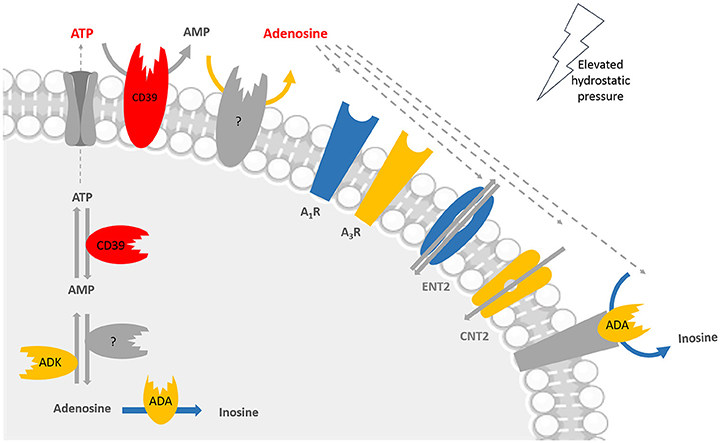
Figure 8. Main alterations in the purinergic system of microglial cells in conditions of elevated pressure. The exposure of microglial cells to elevated pressure changes several players of the purinergic system in microglia, including enzymes, receptors, and transporters. Color code: red means increased levels, expression, or density; blue means decreased expression, density, or activity; and yellow means no changes at elevated pressure when compared with control pressure. Taking into account the lack of CD73 in BV-2 cells, the enzyme responsible for converting AMP into adenosine was not identified; it could be for instance alkaline phosphatase (AP), but we did not assess it experimentally. Adenosine triphosphate (ATP), adenosine monophosphate (AMP), adenosine deaminase (ADA), adenosine kinase (ADK), adenosine A1 receptor (A1R), adenosine A3 receptor (A3R), concentrative nucleoside transporter 2 (CNT2), equilibrative nucleoside transporter 2 (ENT2).
Author Contributions
AR-N, IA, and AS conceived and designed the experiments; AR-N, IA, JV, and FG performed the experiments; AR-N, IA, JV, RB, MM, FG, RC, PS, AA, and AS analyzed and interpreted the results; RC, PS, AA, and AS contributed with reagents, materials, analysis tools; AR-N wrote the first draft of the manuscript and all authors have read and approved the final version.
Funding
This work was supported by FCT, Portugal (Project PTDC/BIM-MEC/0913/2012 and Strategic Projects PEst-C/SAU/UI3282/2013 and UID/NEU/04539/2013), FEDER-COMPETE (POCI-01-0145-FEDER-007440), Centro 2020 Regional Operational Programme (CENTRO-01-0145-FEDER-000008: BrainHealth 2020).
Conflict of Interest Statement
The authors declare that the research was conducted in the absence of any commercial or financial relationships that could be construed as a potential conflict of interest.
Acknowledgments
The authors acknowledge Prof. Sancha Santos, Faculty of Pharmacy, University of Coimbra, for the help with the HPLC equipment.
Abbreviations
A1R, adenosine A1 receptor; A2AR, adenosine A2A receptor; A2BR, adenosine A2B receptor; A3R, adenosine A3 receptor; ADA, adenosine deaminase; ADK, adenosine kinase; ADP, adenosine di-phosphate; AMP, adenosine monophosphate; ATP, adenosine triphosphate; BCA, bicinchoninic acid; BSA, bovine serum albumin; CD73, ecto-5′-nucleotidase; CNS, central nervous system; CNT, concentrative nucleoside transporter; ECF, chemi-fluorescence; ECL, Chemiluminescence; EHP, elevated hydrostatic pressure; ENT, equilibrative nucleoside transporter; E-NTPDase1/CD39, ecto-nucleoside triphosphate diphosphohydrolase 1; FBS, fetal bovine serum; HPLC, high-performance liquid chromatography; IOP, intraocular pressure; NBMPR, S-(4-nitrobenzyl)-6-thioinosine; PFA, paraformaldehyde; RGCs, retinal ganglion cells; RPMI, Roswell Park Memorial Institute; SDS, sodium dodecyl sulfate; TRITC, tetramethylrhodamine B isothiocyanate; VNUT, nucleotide transporter.
References
Albalawi, F., Lu, W., Beckel, J. M., Lim, J. C., McCaughey, S. A., and Mitchell, C. H. (2017). The P2X7 receptor primes IL-1β and the NLRP3 inflammasome in astrocytes exposed to mechanical strain. Front. Cell. Neurosci. 11:227. doi: 10.3389/fncel.2017.00227
Ballerini, P., Di Iorio, P., Ciccarelli, R., Nargi, E., D'Alimonte, I., Traversa, U., et al. (2002). Glial cells express multiple ATP binding cassette proteins which are involved in ATP release. Neuroreport 13, 1789–1792. doi: 10.1097/00001756-200210070-00019
Beckel, J. M., Argall, A. J., Lim, J. C., Xia, J., Lu, W., Coffey, E. E., et al. (2014). Mechanosensitive release of adenosine 5′-triphosphate through pannexin channels and mechanosensitive upregulation of pannexin channels in optic nerve head astrocytes: a mechanism for purinergic involvement in chronic strain. Glia 62, 1486–1501. doi: 10.1002/glia.22695
Beckel, J. M., Lu, W., Civan, M. M., and Mitchell, C. H. (2016). Treatment of retinal disorders with purinergic drugs: beyond receptors. J. Ocul. Pharmacol. Ther. 32, 488–489. doi: 10.1089/jop.2016.29020.jbe
Bosco, A., Romero, C. O., Breen, K. T., Chagovetz, A. A., Steele, M. R., Ambati, B. K., et al. (2015). Neurodegeneration severity is anticipated by early microglia alterations monitored in vivo in a mouse model of chronic glaucoma. Dis. Model. Mech. 8, 443–455. doi: 10.1242/dmm.018788
Bosco, A., Steele, M. R., and Vetter, M. L. (2011). Early microglia activation in a mouse model of chronic glaucoma. J. Comp. Neurol. 519, 599–620. doi: 10.1002/cne.22516
Bulavina, L., Szulzewsky, F., Rocha, A., Krabbe, G., Robson, S. C., Matyash, V., et al. (2013). NTPDase1 activity attenuates microglial phagocytosis. Purinergic Signal. 9, 199–205. doi: 10.1007/s11302-012-9339-y
Burnstock, G., and Verkhratsky, A. (2009). Evolutionary origins of the purinergic signalling system. Acta Physiol. 195, 415–447. doi: 10.1111/j.1748-1716.2009.01957.x
Carrier, E. J., Auchampach, J. A., and Hillard, C. J. (2006). Inhibition of an equilibrative nucleoside transporter by cannabidiol: a mechanism of cannabinoid immunosuppression. Proc. Natl. Acad. Sci. U.S.A. 103, 7895–7900. doi: 10.1073/pnas.0511232103
Casson, R. J., Chidlow, G., Wood, J. P., Crowston, J. G., and Goldberg, I. (2012). Definition of glaucoma: clinical and experimental concepts. Clin. Exp. Ophthalmol. 40, 341–349. doi: 10.1111/j.1442-9071.2012.02773.x
Castellano, B., Bosch-Queralt, M., Almolda, B., Villacampa, N., and González, B. (2016). Purine signaling and microglial wrapping. Adv. Exp. Med. Biol. 949, 147–165. doi: 10.1007/978-3-319-40764-7_7
Ciruela, F., Saura, C., Canela, E. I., Mallol, J., Lluís, C., and Franco, R. (1997). Ligand-induced phosphorylation, clustering, and desensitization of A1 adenosine receptors. Mol. Pharmacol. 52, 788–797. doi: 10.1124/mol.52.5.788
Coelho, J. E., Rebola, N., Fragata, I., Ribeiro, J. A., de Mendonça, A., and Cunha, R. A. (2006). Hypoxia-induced desensitization and internalization of adenosine A1 receptors in the rat hippocampus. Neuroscience 138, 1195–1203. doi: 10.1016/j.neuroscience.2005.12.012
Cohen, L. P., and Pasquale, L. R. (2014). Clinical characteristics and current treatment of glaucoma. Cold Spring Harb. Perspect. Med. 4:a017236. doi: 10.1101/cshperspect.a017236
Cook, S. P., and McCleskey, E. W. (2002). Cell damage excites nociceptors through release of cytosolic ATP. Pain 95, 41–47. doi: 10.1016/S0304-3959(01)00372-4
Cunha, R. A. (2005). Neuroprotection by adenosine in the brain: from A(1) receptor activation to A (2A) receptor blockade. Purinergic Signal. 1, 111–134. doi: 10.1007/s11302-005-0649-1
Cunha, R. A. (2016). How does adenosine control neuronal dysfunction and neurodegeneration? J. Neurochem. 139, 1019–1055. doi: 10.1111/jnc.13724
Cunha, R. A., Almeida, T., and Ribeiro, J. A. (2000). Modification by arachidonic acid of extracellular adenosine metabolism and neuromodulatory action in the rat hippocampus. J. Biol. Chem. 275, 37572–37581. doi: 10.1074/jbc.M003011200
Daines, B. S., Kent, A. R., McAleer, M. S., and Crosson, C. E. (2003). Intraocular adenosine levels in normal and ocular-hypertensive patients. J. Ocul. Pharmacol. Ther. 19, 113–119. doi: 10.1089/108076803321637645
Daré, E., Schulte, G., Karovic, O., Hammarberg, C., and Fredholm, B. B. (2007). Modulation of glial cell functions by adenosine receptors. Physiol. Behav. 92, 15–20. doi: 10.1016/j.physbeh.2007.05.031
Davalos, D., Grutzendler, J., Yang, G., Kim, J. V., Zuo, Y., Jung, S., et al. (2005). ATP mediates rapid microglial response to local brain injury in vivo. Nat. Neurosci. 8, 752–758. doi: 10.1038/nn1472
Di Virgilio, F., Ceruti, S., Bramanti, P., and Abbracchio, M. P. (2009). Purinergic signalling in inflammation of the central nervous system. Trends Neurosci. 32, 79–87. doi: 10.1016/j.tins.2008.11.003
Dunwiddie, T. V., and Masino, S. A. (2001). The role and regulation of adenosine in the central nervous system. Annu. Rev. Neurosci. 24, 31–55. doi: 10.1146/annurev.neuro.24.1.31
Ferrari, D., Chiozzi, P., Falzoni, S., Dal Susino, M., Collo, G., Buell, G., et al. (1997). ATP-mediated cytotoxicity in microglial cells. Neuropharmacology 36, 1295–1301. doi: 10.1016/S0028-3908(97)00137-8
Fredholm, B. B., IJzerman, A. P., Jacobson, K. A., Klotz, K. N., and Linden, J. (2001). International Union of Pharmacology. XXV. Nomenclature and classification of adenosine receptors. Pharmacol. Rev. 53, 527–552.
Gajardo-Gómez, R., Labra, V. C., and Orellana, J. A. (2016). Connexins and pannexins: new insights into microglial functions and dysfunctions. Front. Mol. Neurosci. 9:86. doi: 10.3389/fnmol.2016.00086
George, J., Gonçalves, F. Q., Cristovao, G., Rodrigues, L., Meyer Fernandes, J. R., Goncalves, T., et al. (2015). Different danger signals differently impact on microglial proliferation through alterations of ATP release and extracellular metabolism. Glia 63, 1636–1645. doi: 10.1002/glia.22833
Gomes, C., Ferreira, R., George, J., Sanches, R., Rodrigues, D. I., Gonçalves, N., et al. (2013). Activation of microglial cells triggers a release of brain-derived neurotrophic factor (BDNF) inducing their proliferation in an adenosine A2A receptor-dependent manner: A2A receptor blockade prevents BDNF release and proliferation of microglia. J. Neuroinflammation 10:16. doi: 10.1186/1742-2094-10-16
Hammarberg, C., Schulte, G., and Fredholm, B. B. (2003). Evidence for functional adenosine A3 receptors in microglia cells. J. Neurochem. 86, 1051–1054. doi: 10.1046/j.1471-4159.2003.01919.x
Harry, G. J. (2013). Microglia during development and aging. Pharmacol. Ther. 139, 313–326. doi: 10.1016/j.pharmthera.2013.04.013
Haskó, G., Pacher, P., Vizi, E. S., and Illes, P. (2005). Adenosine receptor signaling in the brain immune system. Trends Pharmacol. Sci. 26, 511–516. doi: 10.1016/j.tips.2005.08.004
Haynes, S. E., Hollopeter, G., Yang, G., Kurpius, D., Dailey, M. E., Gan, W. B., et al. (2006). The P2Y12 receptor regulates microglial activation by extracellular nucleotides. Nat. Neurosci. 9, 1512–1519. doi: 10.1038/nn1805
Honda, S., Sasaki, Y., Ohsawa, K., Imai, Y., Nakamura, Y., Inoue, K., et al. (2001). Extracellular ATP or ADP induce chemotaxis of cultured microglia through Gi/o-coupled P2Y receptors. J. Neurosci. 21, 1975–1982.
Imura, Y., Morizawa, Y., Komatsu, R., Shibata, K., Shinozaki, Y., Kasai, H., et al. (2013). Microglia release ATP by exocytosis. Glia 61, 1320–1330. doi: 10.1002/glia.22517
Karlstetter, M., Ebert, S., and Langmann, T. (2010). Microglia in the healthy and degenerating retina: insights from novel mouse models. Immunobiology 215, 685–691. doi: 10.1016/j.imbio.2010.05.010
Karlstetter, M., Nothdurfter, C., Aslanidis, A., Moeller, K., Horn, F., Scholz, R., et al. (2014). Translocator protein (18 kDa) (TSPO) is expressed in reactive retinal microglia and modulates microglial inflammation and phagocytosis. J. Neuroinflammation 11:3. doi: 10.1186/1742-2094-11-3
Kettenmann, H., Hanisch, U. K., Noda, M., and Verkhratsky, A. (2011). Physiology of microglia. Physiol. Rev. 91, 461–553. doi: 10.1152/physrev.00011.2010
Koizumi, S., Shigemoto-Mogami, Y., Nasu-Tada, K., Shinozaki, Y., Ohsawa, K., Tsuda, M., et al. (2007). UDP acting at P2Y6 receptors is a mediator of microglial phagocytosis. Nature 446, 1091–1095. doi: 10.1038/nature05704
Latini, S., and Pedata, F. (2001). Adenosine in the central nervous system: release mechanisms and extracellular concentrations. J. Neurochem. 79, 463–484. doi: 10.1046/j.1471-4159.2001.00607.x
Levin, L. A., Crowe, M. E., Quigley, H. A., Lasker/IRRF Initiative on Astrocytes and Glaucomatous Neurodegeneration Participants (2017). Neuroprotection for glaucoma: requirements for clinical translation. Exp. Eye Res. 157, 34–37. doi: 10.1016/j.exer.2016.12.005
Levine, R. L., and Ginsburg, A. (2013). Modulation by Molecular Interactions—Current Topics in Cellular Regulation. London: Academic press.
Li, A., Zhang, X., Zheng, D., Ge, J., Laties, A. M., and Mitchell, C. H. (2011). Sustained elevation of extracellular ATP in aqueous humor from humans with primary chronic angle-closure glaucoma. Exp. Eye Res. 93, 528–533. doi: 10.1016/j.exer.2011.06.020
Lopes, L. V., Rebola, N., Pinheiro, P. C., Richardson, P. J., Oliveira, C. R., and Cunha, R. A. (2003). Adenosine A3 receptors are located in neurons of the rat hippocampus. Neuroreport 14, 1645–1648. doi: 10.1097/00001756-200308260-00021
Lu, W., Hu, H., Sévigny, J., Gabelt, B. T., Kaufman, P. L., Johnson, E. C., et al. (2015). Rat, mouse, and primate models of chronic glaucoma show sustained elevation of extracellular ATP and altered purinergic signaling in the posterior eye. Invest. Ophthalmol. Vis. Sci. 56, 3075–3083. doi: 10.1167/iovs.14-15891
Lu, W., Reigada, D., Sévigny, J., and Mitchell, C. H. (2007). Stimulation of the P2Y1 receptor up-regulates nucleoside-triphosphate diphosphohydrolase-1 in human retinal pigment epithelial cells. J. Pharmacol. Exp. Ther. 323, 157–164. doi: 10.1124/jpet.107.124545
Madeira, M. H., Boia, R., Elvas, F., Martins, T., Cunha, R. A., Ambrósio, A. F., et al. (2016). Selective A2A receptor antagonist prevents microglia-mediated neuroinflammation and protects retinal ganglion cells from high intraocular pressure-induced transient ischemic injury. Transl. Res. 169, 112–128. doi: 10.1016/j.trsl.2015.11.005
Madeira, M. H., Boia, R., Santos, P. F., Ambrósio, A. F., and Santiago, A. R. (2015a). Contribution of microglia-mediated neuroinflammation to retinal degenerative diseases. Mediators Inflamm. 2015:673090. doi: 10.1155/2015/673090
Madeira, M. H., Elvas, F., Boia, R., Gonçalves, F. Q., Cunha, R. A., Ambrósio, A. F., et al. (2015b). Adenosine A2AR blockade prevents neuroinflammation-induced death of retinal ganglion cells caused by elevated pressure. J. Neuroinflammation 12:115. doi: 10.1186/s12974-015-0333-5
Mandrekar, S., Jiang, Q., Lee, C. Y., Koenigsknecht-Talboo, J., Holtzman, D. M., and Landreth, G. E. (2009). Microglia mediate the clearance of soluble Abeta through fluid phase macropinocytosis. J. Neurosci. 29, 4252–4262. doi: 10.1523/JNEUROSCI.5572-08.2009
Matyash, M., Zabiegalov, O., Wendt, S., Matyash, V., and Kettenmann, H. (2017). The adenosine generating enzymes CD39/CD73 control microglial processes ramification in the mouse brain. PLoS ONE 12:e0175012. doi: 10.1371/journal.pone.0175012
Melani, A., Corti, F., Stephan, H., Müller, C. E., Donati, C., Bruni, P., et al. (2012). Ecto-ATPase inhibition: ATP and adenosine release under physiological and ischemic in vivo conditions in the rat striatum. Exp. Neurol. 233, 193–204. doi: 10.1016/j.expneurol.2011.09.036
Miller, A. M., and Stella, N. (2009). Microglial cell migration stimulated by ATP and C5a involve distinct molecular mechanisms: quantification of migration by a novel near-infrared method. Glia 57, 875–883. doi: 10.1002/glia.20813
Murphy, P. S., Wang, J., Bhagwat, S. P., Munger, J. C., Janssen, W. J., Wright, T. W., et al. (2017). CD73 regulates anti-inflammatory signaling between apoptotic cells and endotoxin-conditioned tissue macrophages. Cell Death Differ. 24, 559–570. doi: 10.1038/cdd.2016.159
Ohsawa, K., Sanagi, T., Nakamura, Y., Suzuki, E., Inoue, K., and Kohsaka, S. (2012). Adenosine A3 receptor is involved in ADP-induced microglial process extension and migration. J. Neurochem. 121, 217–227. doi: 10.1111/j.1471-4159.2012.07693.x
Orr, A. G., Orr, A. L., Li, X. J., Gross, R. E., and Traynelis, S. F. (2009). Adenosine A(2A) receptor mediates microglial process retraction. Nat. Neurosci. 12, 872–878. doi: 10.1038/nn.2341
Pérez de Lara, M. J., Guzmán-Aránguez, A., de la Villa, P., Díaz-Hernández, J. I., Miras-Portugal, M. T., and Pintor, J. (2015). Increased levels of extracellular ATP in glaucomatous retinas: possible role of the vesicular nucleotide transporter during the development of the pathology. Mol. Vis. 21, 1060–1070.
Ransohoff, R. M., and Perry, V. H. (2009). Microglial physiology: unique stimuli, specialized responses. Annu. Rev. Immunol. 27, 119–145. doi: 10.1146/annurev.immunol.021908.132528
Regateiro, F. S., Cobbold, S. P., and Waldmann, H. (2013). CD73 and adenosine generation in the creation of regulatory microenvironments. Clin. Exp. Immunol. 171, 1–7. doi: 10.1111/j.1365-2249.2012.04623.x
Reigada, D., Lu, W., Zhang, M., and Mitchell, C. H. (2008). Elevated pressure triggers a physiological release of ATP from the retina:possible role for pannexin hemichannels. Neuroscience 157, 396–404. doi: 10.1016/j.neuroscience.2008.08.036
Resta, V., Novelli, E., Vozzi, G., Scarpa, C., Caleo, M., Ahluwalia, A., et al. (2007). Acute retinal ganglion cell injury caused by intraocular pressure spikes is mediated by endogenous extracellular ATP. Eur. J. Neurosci. 25, 2741–2754. doi: 10.1111/j.1460-9568.2007.05528.x
Rodrigues, R. J., Tomé, A. R., and Cunha, R. A. (2015). ATP as a multi-target danger signal in the brain. Front. Neurosci. 9:148. doi: 10.3389/fnins.2015.00148
Sawada, K., Echigo, N., Juge, N., Miyaji, T., Otsuka, M., Omote, H., et al. (2008). Identification of a vesicular nucleotide transporter. Proc. Natl. Acad. Sci. U.S.A. 105, 5683–5686. doi: 10.1073/pnas.0800141105
Scheiblich, H., and Bicker, G. (2016). Nitric oxide regulates antagonistically phagocytic and neurite outgrowth inhibiting capacities of microglia. Dev. Neurobiol. 76, 566–584. doi: 10.1002/dneu.22333
Shinozaki, Y., Nomura, M., Iwatsuki, K., Moriyama, Y., Gachet, C., and Koizumi, S. (2014). Microglia trigger astrocyte-mediated neuroprotection via purinergic gliotransmission. Sci. Rep. 4:4329. doi: 10.1038/srep04329
Song, W., Huang, P., and Zhang, C. (2015). Neuroprotective therapies for glaucoma. Drug Des. Devel. Ther. 9, 1469–1479. doi: 10.2147/DDDT.S80594
Sperlágh, B., and Illes, P. (2007). Purinergic modulation of microglial cell activation. Purinergic Signal. 3, 117–127. doi: 10.1007/s11302-006-9043-x
Stout, C. E., Costantin, J. L., Naus, C. C., and Charles, A. C. (2002). Intercellular calcium signaling in astrocytes via ATP release through connexin hemichannels. J. Biol. Chem. 277, 10482–10488. doi: 10.1074/jbc.M109902200
Thorn, J. A., and Jarvis, S. M. (1996). Adenosine transporters. Gen. Pharmacol. 27, 613–620. doi: 10.1016/0306-3623(95)02053-5
van Calker, D., and Biber, K. (2005). The role of glial adenosine receptors in neural resilience and the neurobiology of mood disorders. Neurochem. Res. 30, 1205–1217. doi: 10.1007/s11064-005-8792-1
Vardy, E. R., Kellett, K. A., Cocklin, S. L., and Hooper, N. M. (2012). Alkaline phosphatase is increased in both brain and plasma in Alzheimer's disease. Neurodegener. Dis. 9, 31–37. doi: 10.1159/000329722
Verkhratsky, A., and Burnstock, G. (2014). Biology of purinergic signalling: its ancient evolutionary roots, its omnipresence and its multiple functional significance. Bioessays 36, 697–705. doi: 10.1002/bies.201400024
Vindeirinho, J., Costa, G. N., Correia, M. B., Cavadas, C., and Santos, P. F. (2013). Effect of diabetes/hyperglycemia on the rat retinal adenosinergic system. PLoS ONE 8:e67499. doi: 10.1371/journal.pone.0067499
Wilkinson, P. C. (1998). Assays of leukocyte locomotion and chemotaxis. J. Immunol. Methods 216, 139–153. doi: 10.1016/S0022-1759(98)00075-1
Wu, L. J., Vadakkan, K. I., and Zhuo, M. (2007). ATP-induced chemotaxis of microglial processes requires P2Y receptor-activated initiation of outward potassium currents. Glia 55, 810–821. doi: 10.1002/glia.20500
Yegutkin, G. G. (2008). Nucleotide- and nucleoside-converting ectoenzymes: important modulators of purinergic signalling cascade. Biochim. Biophys. Acta 1783, 673–694. doi: 10.1016/j.bbamcr.2008.01.024
Zhang, X., Li, A., Ge, J., Reigada, D., Laties, A. M., and Mitchell, C. H. (2007). Acute increase of intraocular pressure releases ATP into the anterior chamber. Exp. Eye Res. 85, 637–643. doi: 10.1016/j.exer.2007.07.016
Keywords: purinergic system, ATP, adenosine, microglia, elevated pressure, glaucoma
Citation: Rodrigues-Neves AC, Aires ID, Vindeirinho J, Boia R, Madeira MH, Gonçalves FQ, Cunha RA, Santos PF, Ambrósio AF and Santiago AR (2018) Elevated Pressure Changes the Purinergic System of Microglial Cells. Front. Pharmacol. 9:16. doi: 10.3389/fphar.2018.00016
Received: 17 October 2017; Accepted: 05 January 2018;
Published: 24 January 2018.
Edited by:
Francisco Ciruela, University of Barcelona, SpainReviewed by:
Rodrigo Pacheco, Universidad Andrés Bello, ChileClaire H. Mitchell, University of Pennsylvania, United States
Copyright © 2018 Rodrigues-Neves, Aires, Vindeirinho, Boia, Madeira, Gonçalves, Cunha, Santos, Ambrósio and Santiago. This is an open-access article distributed under the terms of the Creative Commons Attribution License (CC BY). The use, distribution or reproduction in other forums is permitted, provided the original author(s) or licensor are credited and that the original publication in this journal is cited, in accordance with accepted academic practice. No use, distribution or reproduction is permitted which does not comply with these terms.
*Correspondence: Ana R. Santiago, YXNhbnRpYWdvQGZtZWQudWMucHQ=