 Hong Li1,2†
 Jing Lin1†
 Fei Yang1†
 Junzhu Deng3
 Jia Lai1
 Jing Zeng1
 Wenjun Zou3
 Nan Jiang1,4
 Qianqian Huang1,4
 Hua Li1
 Jian Liu1
 Mao Li1
 Zhirong Zhong1*
 Jianming Wu5,1,4*
- 1School of Pharmacy, Southwest Medical University, Luzhou, China
- 2Laboratory of Ethnopharmacology, Tissue-orientated Property of Chinese Medicine Key Laboratory of Sichuan Province, West China School of Medicine, West China Hospital, Sichuan University, Chengdu, China
- 3School of Pharmacy, Chengdu University of Traditional Chinese Medicine, Chengdu, China
- 4The Key Laboratory of Medical Electrophysiology, Ministry of Education of China, Institute of Cardiovascular Research, Luzhou, China
- 5School of Basic Medical University, Southwest Medical University, Luzhou, China
Background: Non-small cell lung cancer (NSCLC) is the most common type of lung cancer. Sanguisorba officinalis L. (SOL), a traditional Chinese herbal medicine called Diyu, has been shown to have potent antitumor effects. However, the role of SOL in suppressing NSCLC remains unknown.
Methods: Network pharmacology was employed for acquiring the potential targets and mechanisms of SOL in NSCLC. Based on the predictions of network pharmacology, we used CCK8 and EdU assays to investigate cell proliferation, flow cytometry to investigate apoptosis, wound healing assay to investigate cell migration, and transwell assay to investigate cell invasion in vitro. Western blot was employed for detecting the potential proteins, including signaling pathways and apoptosis. The A549-bearing athymic nude mice were employed to verify the effect on cell proliferation and apoptosis in vivo.
Results: SOL significantly inhibited the proliferation, migration and invasion of NSCLC cells in a dose-dependent manner. Flow cytometry showed that the apoptotic ratio and ROS level of NSCLC cells increased significantly with increasing concentrations. AKT and the PI3K-AKT signaling pathway were analyzed as the most relevant target and pathway via network pharmacology predictions. Western blotting revealed that the expression levels of p-PI3K, p-AKT, and p-mTOR in NSCLC cells treated with SOL were significantly downregulated, while cleaved PARP-1 and caspase-3 were upregulated in a dose-dependent manner. The results in the mouse xenograft model were consistent with those in NSCLC cell lines.
Conclusion: SOL downregulated the PI3K/AKT/mTOR signaling pathway to suppress NSCLC.
1 Introduction
Lung cancer has the highest mortality rate among all cancers according to the Global Cancer Case Report 2020. Lung cancer can be divided into small cell lung cancer and non-small cell lung cancer (NSCLC). NSCLC is accounting for 80%–85% of all lung cancers and has low five-year survival rates (Planchard et al., 2018; Sung et al., 2021). Currently, chemotherapy, immunotherapy, radiotherapy, and surgery are the main therapeutic options for NSCLC. Among these, chemotherapy plays a critical role in the treatment of all stages of NSCLC. Traditional medicines harm various normal cells, while targeted drugs (e.g., EGFR TKIs, ALK TKIs, ROS1 TKI, and NTRK TKI) are susceptible to resistance (Chen et al., 2020; Rodak et al., 2021). Therefore, breakthroughs in lung cancer chemotherapy are urgently needed.
Searching for potential antitumor-active components from traditional Chinese medicine (TCM) has become the focus of pharmaceutical research. Current studies have shown that TCMs, including Cremastra appendiculata (Wang et al., 2021), Artemisia Annua (Zhang S. Q et al., 2020) and Rhodiola rosea L. (Zhang S. Q et al., 2020), can be used as candidate drugs against NSCLC. Sanguisorba officinalis L. (SOL) is a medicinal plant widely distributed in China (Zhou et al., 2021). Currently, “Diyu Sheng Bai Pian,” made from SOL, is used clinically to treat leukopenia induced by antitumor drugs (Zhao, 2019). Many studies have shown that SOL can markedly inhibit the growth of some solid tumors, such as colorectal cancer, prostate cancer, and breast cancer (Choi et al., 2012; Liu et al., 2016; Wang N et al., 2020). We previously demonstrated that 3,3′,4′-trimethylellagic acid, isolated from SOL, could markedly inhibit colon cancer (Bai et al., 2019) and regulate platelet levels (Li et al., 2021). And the ethanol extract of SOL could induce apoptosis in hepatocellular carcinoma cells by inhibiting the phosphoinositide 3-kinase (PI3K)/AKT pathway (Jiang et al., 2021). These studies highlight the significant antitumor effects of SOL. Thus, it will be interesting to explore the antitumor effects and significance of SOL in non-small cell lung cancer.
Network pharmacology, based on systems biology and network analysis theory, is a novel and unique method for systematically studying and exploring the complex relationship between drugs and diseases. It can reveal the complex mechanisms of TCM in the treatment of diseases by constructing and visualizing the drug-disease-target interaction network (Poornima et al., 2016; Wang L et al., 2020). It can effectively map the unexplored target space for natural products, thus providing a systematic approach to expand the drug space, involving proteins in a variety of complex diseases (Kibble et al., 2015; Oettrich et al., 2016). Network pharmacology guides drug research and has an important reference value for the study of drug mechanisms. Therefore, it is necessary to predict and verify the main targets and pathways of SOL activity in lung cancer cells using this approach.
In this study, multiple databases and computational tools were used to establish a pharmacological network to explore potential drug targets and molecular mechanisms of SOL in NSCLC. We have successfully predicted that the active components in SOL can influence NSCLC by PI3K/AKT/mTOR pathway. Various experiments, including cell proliferation, apoptosis, migration, and invasion, further verified the efficacy and mechanism of NSCLC cell lines and mouse xenograft models. Collectively, SOL downregulated the PI3K/AKT/mTOR signaling pathway to suppress NSCLC.
2 Materials and methods
2.1 Predicting putative Sanguisorba officinalis L. targets
The chemical composition of SOL was obtained from the Traditional Chinese Medicine Systems Pharmacology Database (TCMSP; http://lsp.nwu.edu.cn/tcmsp.php) (Ru et al., 2014), the Traditional Chinese Medicine Integrated Database (TCMID; http://www.megabionet.org/tcmid/) (Huang et al., 2018), and the Encyclopedia of Traditional Chinese Medicine (ETCM; http://www.tcmip.cn/ETCM/) (Xu et al., 2019). Bioactive compounds were selected according to the following criteria: oral bioavailability (OB) > 30% and drug-likeness (DL) > 0.18. Molecular structures of the selected bioactive compounds were acquired from the PubChem Compound Database (https://www.ncbi.nlm.nih.gov/pccompound) and uploaded to the Swiss Target Prediction Database (http://www.swisstargetprediction.ch/) to obtain putative targets.
2.2 Identifying the potential targets of Sanguisorba officinalis L. activity in NSCLC
The GeneCards database (https://www.genecards.org/), DisGeNET database (http://www.disgenet.org/), and OMIM database (https://www.OMIM.org/) were searched to identify targets related to NSCLC. The targets of both SOL and NSCLC were considered potential therapeutic targets (i.e.,: common targets of SOL and NSCLC) for SOL activity in NSCLC.
2.3 Network construction
2.3.1 Construction of drug-disease-target network
Based on the target information of SOL and NSCLC, Cytoscape version 3.7.1 software was employed to construct the network among the bioactive compounds of SOL, NSCLC, and their common targets.
2.3.2 Construction of a protein-protein interaction network and screening of the core targets of Sanguisorba officinalis L. activity in NSCLC
The interaction network of the bioactive compound targets in NSCLC was built using STRING version 11.0 software (http://string-db.org). Protein interactions with confidence scores greater than 0.4 were analyzed (Szklarczyk et al., 2017). Nodes and score information was imported into Cytoscape 3.7.1 for visual analysis. Topological analysis was conducted by network analysis in Cytoscape 3.7.1, and the core targets were screened according to the main parameters, degree, betweenness centrality, and closeness centrality. Nodes with topological parameters greater than the medians of betweenness centrality and closeness centrality, and greater than twice the degree median, were selected as the core targets (Wang L et al., 2020). The interaction network of core targets was constructed using Cytoscape 3.7.1.
2.3.3 Gene ontology and pathway enrichment analysis of core targets
The Database for Annotation, Visualization, and Integrated Discovery (DAVID; https://david.ncifcrf.gov/) was employed to perform GO function enrichment analysis and KEGG pathway enrichment analysis of core targets. (Huang da et al., 2009). Results were visualized using the Omicshare cloud platform (http://www.omicshare.com/).
2.4 Preparation of Sanguisorba officinalis L. ethanol extracts
As previously reported (Jiang et al., 2021), dried SOL roots were crushed into a crude powder, which was then extracted by sonication in 70% ethanol for 30 min. The resulting solution was filtered and concentrated under a reduced-pressure condenser to acquire the dried ethanol extract of SOL.
2.5 UPLC-MS analysis of Sanguisorba officinalis L. compounds
SOL compounds were analyzed using a UPLC (Exion)–quadrupole time-of-flight (QTOF) MS system (X500R; SCIEX, MA, United States). A Kinetex C18 column (100 mm × 2.1 mm, 2.6 μm, 100 Å; Phenomenex) was used for chromatographic separation. The column temperature was set to 40°C. Mobile phase A was 0.1% formic acid-water (v/v), while mobile phase B was 0.1% formic acid-acetonitrile (v/v). The flow rate was set at 0.3 ml/min. The gradient elution protocol was as follows: 5% B from 0–2.00 min, 5%–70% B from 2.01–18.00 min, and 70%–100% A from 18.0–20.00 min. The injection volume was 5 µl.
2.6 Cell culture
NSCLC cell lines (A549 and H1299) obtained from the American Type Culture Collection (Manassa, VA, United States) were used for in vitro experiments. Cells were cultured in RPMI 1640 media (#8119060, Gibco, MA, United States) supplemented with 10% fetal bovine serum (FBS, #42Q9281K, Gibco, MA, United States) and 100 U/ml penicillin-streptomycin (#C0222, Beyotime, Shanghai, China), and maintained at 37°C, 5% CO2 in a humidified incubator.
2.7 Cell viability
A549 and H1299 cells were seeded into 96-well plates (4 × 10³ cells/well) and incubated for 24 h before treatment with different concentrations of SOL (0, 15.625, 31.25, 62.5, 125, 250, 500, or 1,000 μg/ml) for 24 h and 48 h 293T, LO2, and Beas-2b cells were seeded into 96-well plates and incubated for 24 h, before treatment with different concentrations of SOL (0, 50, 100, or 200 μg/ml) for 24 h. Following the addition of 10 μl/well by cell counting kit 8 (CCK8) (#LZ735, Dojindo, Japan), cells were cultured for another 2 h at 37°C. Absorbance was measured at 450 nm by a microplate reader (Cytation3, Bio-Tek, United States). Cell viability was calculated using the following formula:
2.8 5-Ethynyl-2-deoxyuridine assay
EdU is a thymidine analog that can be incorporated into replicating DNA for the detection of cell proliferation (Salic and Mitchison, 2008). In this study, NSCLC cells were seeded into 96-well plates (4 × 10³ cells/well) and incubated for 24 h before treatment with different concentrations of SOL (0, 50, 100, or 200 μg/ml) for 24 h. Cells were then incubated for 2 h with 50 μM EdU (#K1075, APE×BIO, TX, United States) before fixation with 4% formaldehyde (#1810473, Biosharp, Hefei, China) for 30 min. EdU Click buffer was then added for 30 min and cells were stained with Hoechst 33342 for 30 min. EdU-positive cells were imaged with an ImageXpress Micro 4 High-Content Screening System (Molecular Devices, CA, United States) at ×100 magnification. Cell proliferation was analyzed as the percentage of viable cells using the following formula:
2.9 Wound healing assay
A549 and H1299 cells were grown in 6-well plates until 80% confluent. The cell monolayer was then scratched using a sterile pipette tip and the media was removed, before washing with phosphate-buffered saline (PBS, #P1010, Sorlabio, Beijing, China) and replacing with media containing different concentrations of SOL (0, 50, 100, or 200 μg/ml). Cell movements into wound areas were imaged after 0 and 24 h of incubation with a phase-contrast inverted microscope at ×40 magnification.
2.10 Transwell invasion assay
A Transwell invasion assay was conducted using a Corning Transwell chamber system (#3442, Corning, NY, United States). Cells were seeded into the upper chamber at a density of 1.5 × 10⁵ cells/chamber in the presence of a Matrigel-precoated membrane (#M8370, Solarbio, Beijing, China) and 200 μl serum-free RPMI 1640. A complete medium (500 μl) containing 10% FBS was added to the bottom chamber. Following incubation for 24 h at 37°C, chambers were washed twice with PBS, fixed with 4% paraformaldehyde, and stained with a 1% crystal violet solution (#C0121, Beyotime, Shanghai, China) at room temperature. Cells were counted in three random fields under a light microscope at ×100 magnification.
2.11 Hoechst 33342/PI staining
Cells were seeded into 6-well plates and treated with different concentrations of SOL. Cells were then stained with Hoechst 33342/PI solution (#CA1120, Solarbio, Beijing, China) to identify necrotic cells, following the manufacturer’s instructions. Hoechst 33342 stains cell nuclei, while PI penetrates dying cells due to a loss of cell membrane integrity. Representative images were captured using a fluorescence microscope (Nikon ECLIPSE 80i; Nikon, Tokyo, Japan) at ×40 magnification. The percentage of PI-positive cells was calculated using ImageJ software (National Institutes of Health, Bethesda, MD, United States).
2.12 Flow cytometry analysis of apoptosis
A549 and H1299 cells were seeded into 6-well plates (1.5 × 10⁵ cells/well) and treated with different concentrations of SOL for 24 h. For analysis of apoptosis, cells were stained using an Annexin V-FITC/PI Detection Kit (#A211-01, Vazyme, Nanjing, China). A FACS Verse flow cytometer (BD Biosciences, CA, United States) was used for detection. Data acquisition and analysis were performed using FlowJo software (BD Biosciences, CA, United States).
2.13 Detection of intracellular ROS levels
NSCLC cells were seeded into 6-well plates (1.5 × 10⁵ cells/well) and treated with SOL for 24 h. The cells harvested after 24 h were centrifuged at 1,500 r/min for 3 min, re-suspended in 500 μl of serum-free medium containing 10 μM DCFH-DA (#S0033, Beyotime, Shanghai, China), incubated in the dark for 20 min under a gentle mixing at 5 min intervals. The cells were subsequently washed with serum-free medium twice, resuspended in 500 μl of PBS, and submitted to the analysis of intracellular oxidative species (ROS) using a FACS Verse flow cytometer under the FITC channel. The quantitation of the test DCF was based on the corresponding mean fluorescence, data analysis was performed using FlowJo software.
2.14 Western blot
Cells were seeded into 6-well plates (1.5 × 10⁵ cells/well) and treated with different concentrations of SOL for 24 h. Cells were then lysed on ice for 30 min in radioimmunoprecipitation assay buffer (#9806, Cell Signaling Technology, MA, United States) containing 1:100 protease and phosphatase inhibitor cocktail (#C0001, TargetMol, MA, United States). Lysate protein concentrations were determined using the Bradford protein assay (#500-0205, Bio-Rad, CA, United States), according to the manufacturer’s instructions. Equal amounts of protein (30 μg/sample) were separated by 10% sodium dodecyl sulfate-polyacrylamide gel (#PG11X, Epizyme, Shanghai, China) electrophoresis and transferred onto polyvinylidene difluoride membranes. The membranes were then blocked with 5% non-fat milk for 1 h at room temperature and incubated overnight at 4°C with primary antibodies: anti-mTOR (#2983, Cell Signaling Technology, MA, United States), anti-p-mTOR (#5536, Cell Signaling Technology, MA, United States), anti-PI3K (#4249, Cell Signaling Technology, MA, United States), anti-p-PI3K (#4228, Cell Signaling Technology, MA, United States), anti-AKT (#4691, Cell Signaling Technology, MA, United States), anti-p-AKT (#4060, Cell Signaling Technology, MA, United States), Caspase 3 (#10380-1-AP, Proteintech, Wuhan, China), anti-cleaved-PARP 1 (#56196, SANTA CRUZ, CA, United States) and anti-β-actin (#4970, Cell Signaling Technology, MA, United States) at 1:1,000. After three washes with PBST, membranes were incubated with horseradish peroxidase (HRP)-conjugated secondary antibodies (#7074, #7076, Cell Signaling Technology, MA, United States) for 1 h at room temperature. The membranes were developed using UltraSignal Hypersensitive ECL Chemiluminescent Substrate (#4AW011, 4A Biotech, Beijing, China), and then detected by the ChemiDoc MP Imaging System (Bio-Rad). Bands were quantified using ImageJ software, and expression was normalized to β-Actin. Mouse tissue was analyzed following the same protocol after grinding with a tissue grinder (SCIENTZ-48, Ningbo, China).
2.15 Animal studies and drug administration
All animal experiments in this study were approved by the Animal Ethics Committee of Southwest Medical University (License No. 20210304-012). Four-week-old male athymic nude mice (Chongqing Tengxin Experimental Animal Co., Ltd., Chongqing, China) were maintained in pathogen-free conditions. A549 cells (1 × 10⁶/mouse in 0.1 ml PBS) were injected subcutaneously into the right flank; after 12 days, tumor volumes were between 75 and 100 mm3. Mice were randomly divided into five groups (6 mice/group): a control group (0.9% NaCl with 15% ethanol), SOL-treated groups (25, 50, and 100 mg/kg), and a paclitaxel (PTX) group (10 mg/kg, positive control group). Mice were sacrificed after intraperitoneal (I.P.) administration for 12 consecutive days, and tumor tissues were collected for the detection of PI3K/AKT/mTOR activation by Western blot and immunohistochemistry.
2.16 Tumor volumes and weights
Tumor volumes were measured daily with a Vernier caliper. Tumor volumes were determined using the following formula (Hou et al., 2020):
After 12 days of the administration, mice were sacrificed, autopsies were performed, and tumor xenografts were isolated, analyzed, and weighed. The tumor inhibition rate (IR) was calculated as follows:
2.17 Peripheral blood and platelet assay
After 12 days, 40 μl whole blood samples were collected from the retro-orbital venous plexus and diluted with 160 μl diluent (#8169, Sysmex, Kobe, Japan) for blood cell analysis. Complete blood cell counts were determined using an automatic hematology analyzer (XT-2000iV, Sysmex, Kobe, Japan).
2.18 Hematoxylin and eosin staining
Tumors and organs including the heart, liver, spleen, lung, and kidney were fixed with 4% paraformaldehyde, embedded in paraffin, and sectioned for H&E staining (#G1003, Servicebio, Wuhan, China). Stained tumor and organ slices were imaged using an upright optical microscope (Nikon Eclipse E100, Nikon, Tokyo, Japan) at ×200 magnification.
2.19 Immunohistochemistry
Cell proliferation in tumors was assessed by immunohistochemical analysis of Ki67 expression. Briefly, paraffin sections were dewaxed in xylene, washed twice, rehydrated with 75%–85% ethanol, and washed three times with distilled water. After adding the citric acid repair solution (#G1202, Servicebio, Wuhan, China), the slices were placed in a microwave oven and fixed for 15 min. Slices were then cooled and washed three times with 5 min PBS washes, before 3% H2O2 was added and slices were again washed three times with PBS for 25 min. Sections were then blocked with 5% blocking serum for 30 min before incubating with Ki67 primary antibody (#ab15580, Abcam, Cambridge, UK), at 4°C overnight. The following day, anti-rabbit/mouse HRP-labeled polymer was added for 1 h at 37°C. Then, the pre-formed developer diaminobenzidine working solution was added, incubated for 5 min, and rinsed with distilled water. Slices were then hematoxylin-counterstained for 3 min, and rinsed with distilled water. Finally, the slices were dehydrated, sealed, and mounted with neutral gum. Representative images were captured using an upright optical microscope.
2.20 Statistical analysis
The data acquired in this study were statistically analyzed using GraphPad Prism 8.0 (GraphPad Software Inc., CA, United States). The data are expressed as the means ± standard deviation
3 Results
3.1 Network pharmacology analysis revealed the potential mechanism of Sanguisorba officinalis L. in NSCLC
A total of 41 reported active compounds of SOL were retrieved by searching the databases, and 12 bioactive compounds were acquired by OB and DL (Table 1) and verified via UPLC-MS (Figure 1). 258 putative targets of the 12 compounds in SOL and 6,123 targets of NSCLC were obtained. Through analysis of intersections, 208 common targets were identified as potential targets of SOL in NSCLC (Figure 2A). A drug-disease-target network was constructed based on the information on targets (Figure 2B). A protein-protein interaction (PPI) network of the 208 common targets was established using the STRING database and Cytoscape software (Figure 3A). According to the screening threshold criteria of degree, betweenness centrality, and closeness centrality, 36 core targets were acquired (Figure 3A). The top 10 targets of these 36 core targets were AKT1, VEGF, EGFR, SRC, HSP90AA1, CCND1, PTGS2, ESR1, mTOR, and MMP9 (Figure 3A; Table 2). To elucidate the underlying mechanisms of SOL activity in NSCLC, GO and KEGG pathway enrichment analyses were performed using DAVID. GO analysis demonstrated that the mechanism were mainly related to protein autophosphorylation, protein phosphorylation, and cell proliferation (biological processes); protein kinase activity, enzyme binding, and protein phosphatase binding (molecular function); and the cytoplasm, membrane, and nucleus (cellular components) (Figures 3B–D). The KEGG pathway enrichment analysis showed that the core targets were significantly enriched in cancer-related pathways such as the PI3K-AKT, HIF-1, FoxO, VEGF, and AMP-activated protein kinase signaling pathways (Figure 3E). Combined with the ranking of core targets, the PI3K-AKT signaling pathway was the most related pathway of SOL in NSCLC.
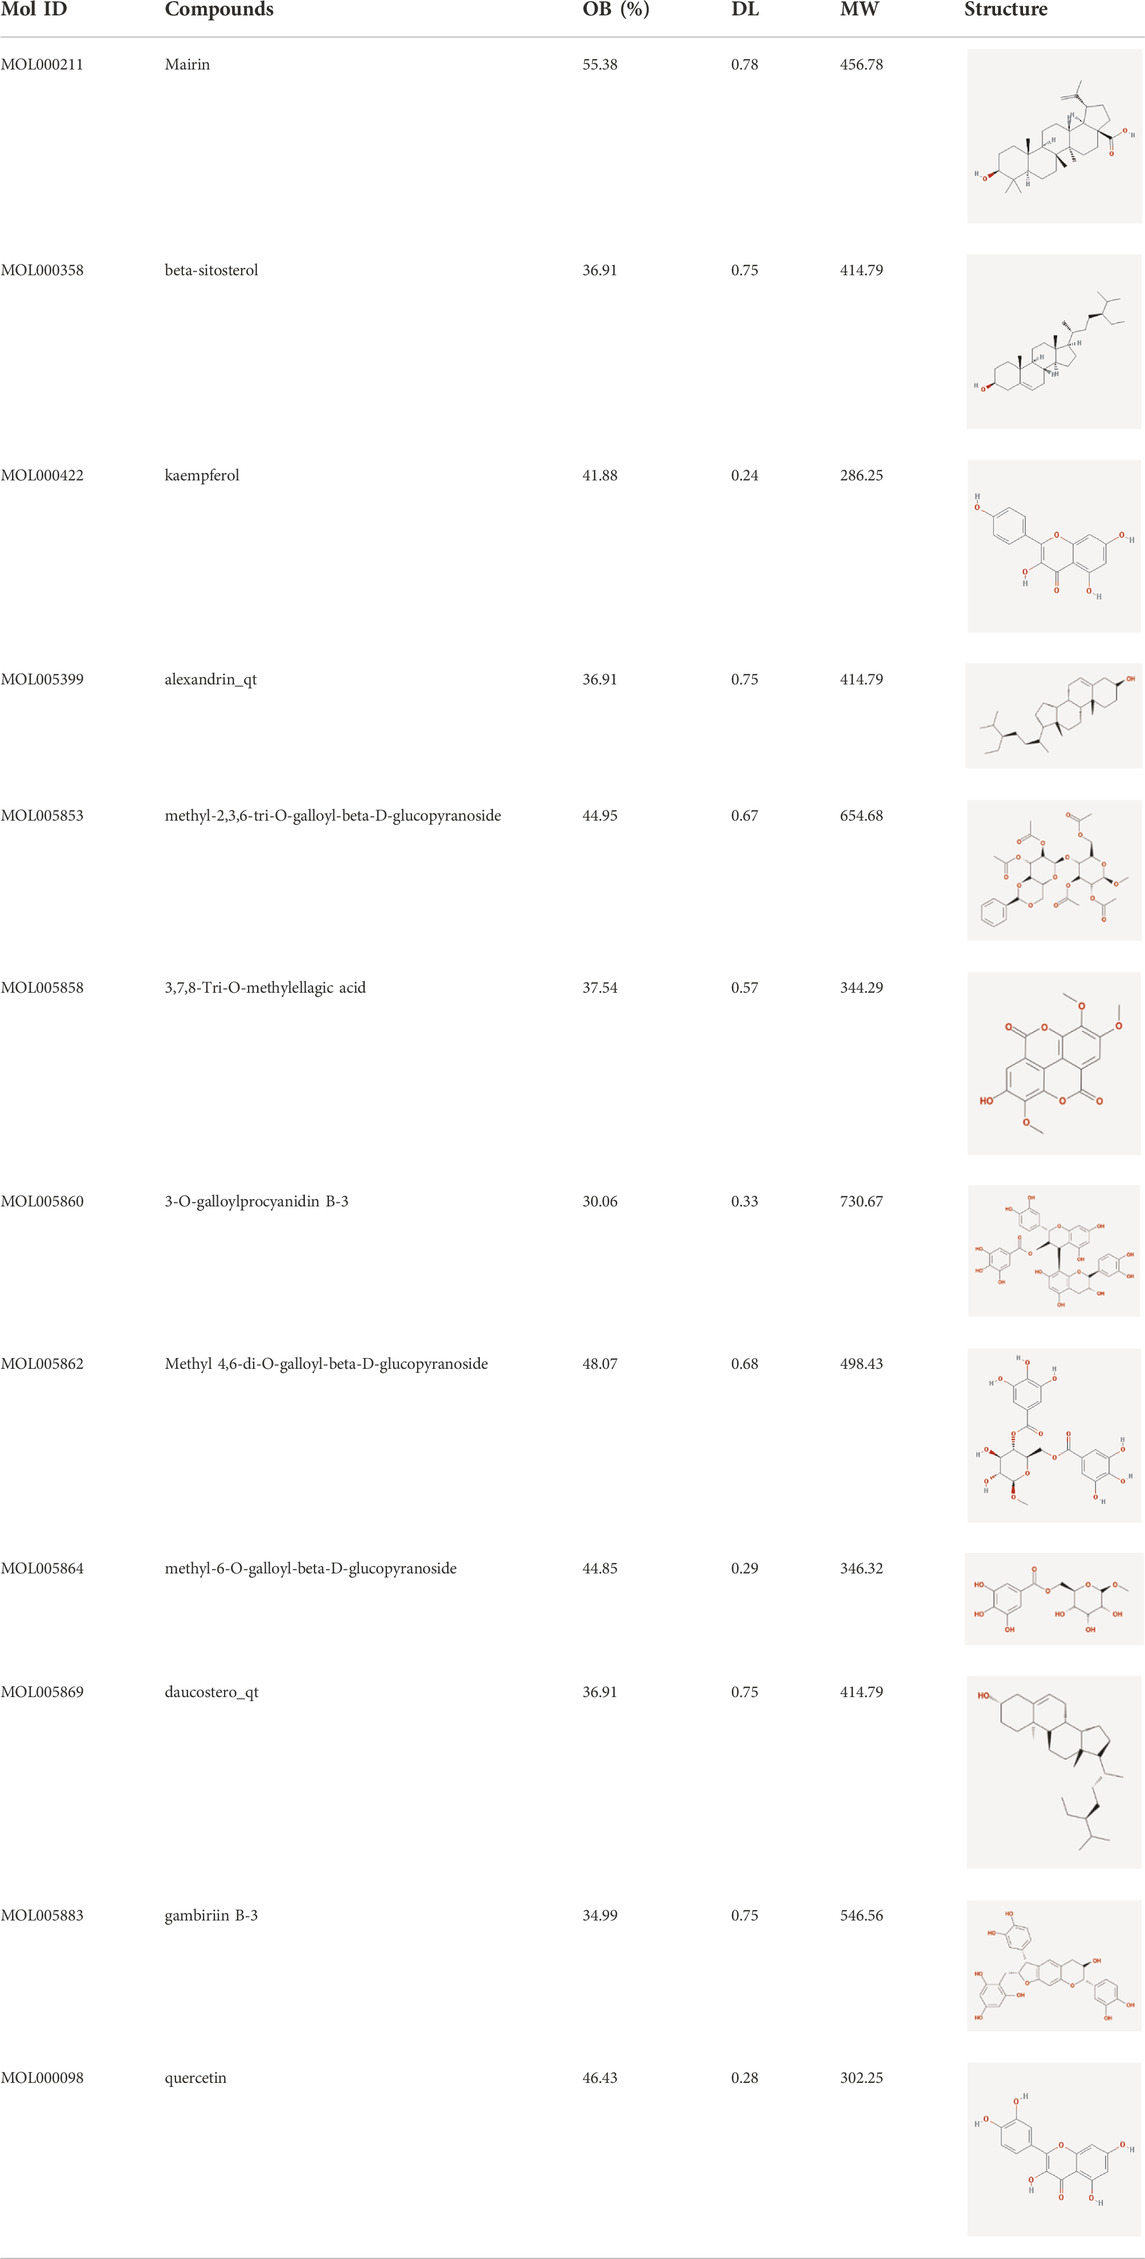
TABLE 1. Active compounds of Sanguisorba officinalis L.
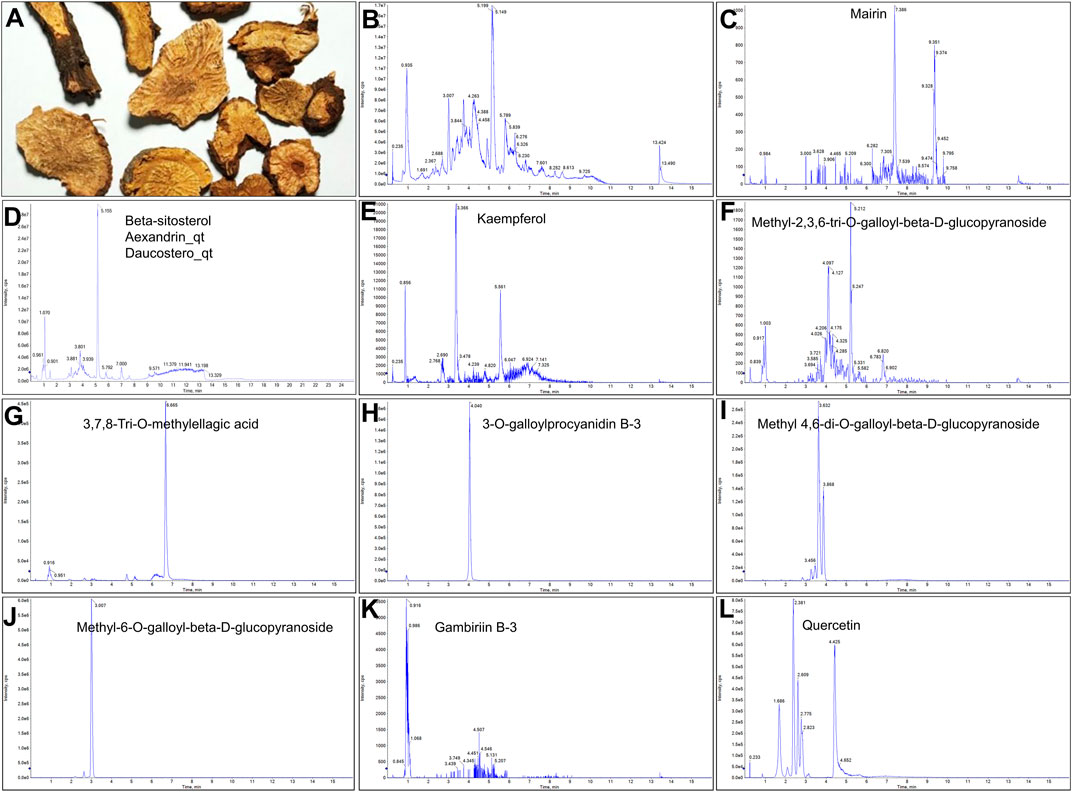
FIGURE 1. UPLC-MS-QTOF chromatograms of the 12 compounds detected in samples. (A) Dry rhizomes of Sanguisorba officinalis L.; (B) Total ion flow diagram of 70% ethanol extract of Sanguisorba officinalis L.; (C) Mairin; (D) Beta-sitosterol or Alexandrin_qt or Daucostero_qt; (E) Kaempferol; (F) Methyl-2,3,6-tri-O-galloyl-beta-D-glucopyranoside; (G) 3,7,8-Tri-O-methylellagic acid; (H) 3-O-galloylprocyanidin B-3; (I) Methyl 4,6-di-O-galloyl-beta-D-glucopyranoside; (J) Methyl-6-O-galloyl-beta-D-glucopyranoside; (K) Gambiriin B-3; (L) Quercetin.
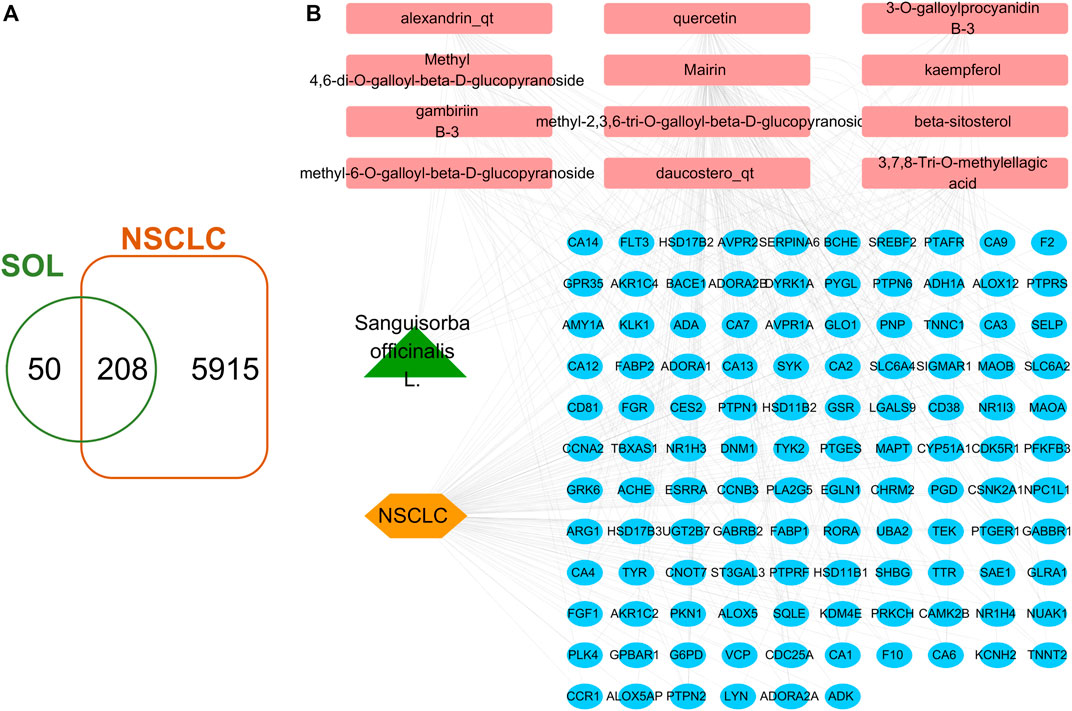
FIGURE 2. Venn diagram and disease-drug-target network of SOL and NSCLC. (A) Venn diagram of SOL targets and NSCLC targets. (B) SOL-compounds-NSCLC-targets network. Among them, the green node represents SOL, the pink nodes represent the 12 compounds in SOL, the orange node represents NSCLC, and the blue nodes represent their common targets.
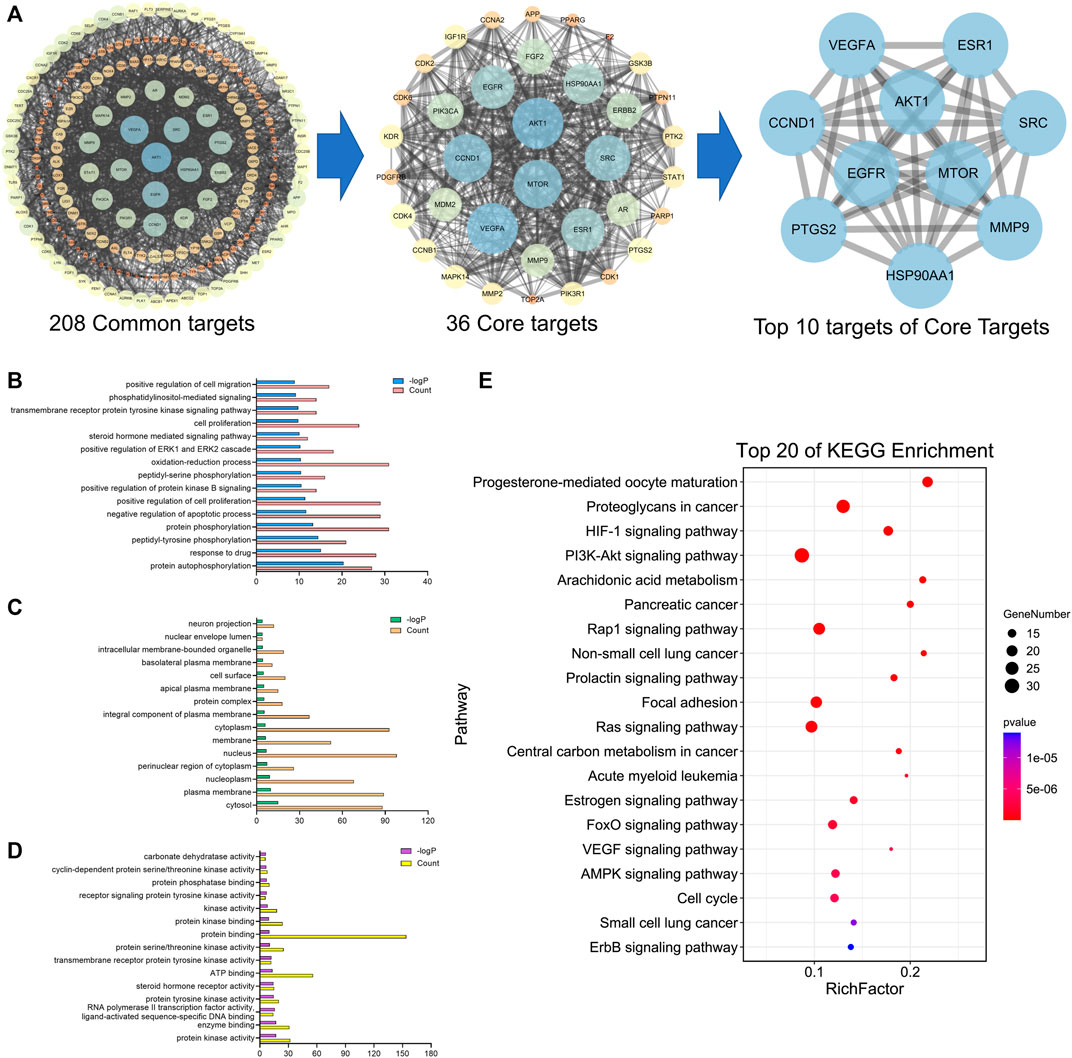
FIGURE 3. PPI and enrichment analyses based on network pharmacology. (A) Protein-protein interaction (PPI) network of bioactive compounds of SOL against NSCLC. GO enrichment analysis of common targets for SOL against NSCLC. (B) Biological process, (C) cellular components, and (D) molecular function were shown in histograms. (E) Top 20 enriched KEGG pathways of the common targets for SOL against NSCLC. The color scales indicated the different thresholds of adjusted p-values, and the sizes of the dots represented the gene count of each term.
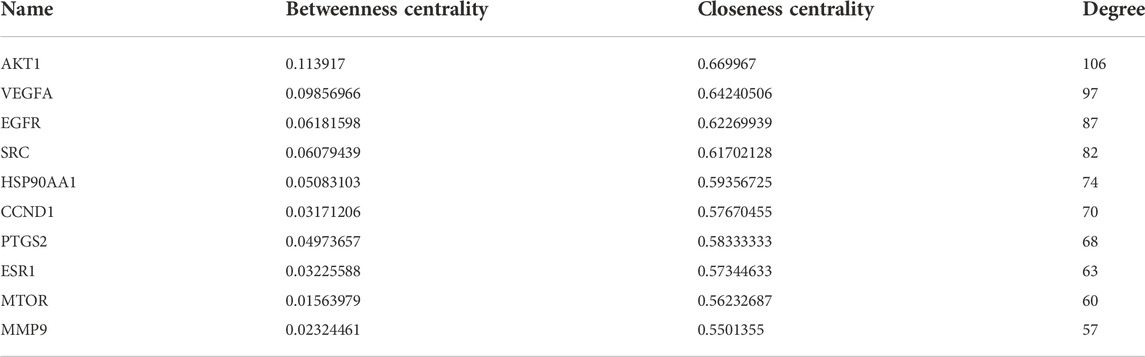
TABLE 2. Core targets of Sanguisorba officinalis L. against NSCLC.
3.2 Sanguisorba officinalis L. exhibited promising anti-NSCLC activity
Analysis by CCK8 and EdU assays demonstrated that SOL inhibited the growth and proliferation of A549 and H1299 cells in a dose-dependent manner. CCK8 analysis revealed that SOL significantly inhibited the viability of A549 and H1299 cells (Figures 4A,B), with IC50 484.2 and 424.5 μg/ml at 24 h, 158.6 and 291.7 μg/ml at 48 h for A549 and H1299 cells, respectively. In the EdU assay, SOL showed remarkable cytotoxicity in A549 and H1299 cells (Figures 4C,D). Calculating the ratio of EdU-positive cells to total cells, we found that the percentage of SOL-induced cell death in A549 and H1299 cells (Figures 4E,F) increased in a dose-dependent manner. Immunohistochemical analysis of Ki67 expression in tumor tissues also revealed that tumor cell proliferation was inhibited by SOL (Figure 12E). Furthermore, the downregulation of cyclin D1 expression in tumor tissues revealed that the cell cycle was obstructed to inhibit cell proliferation by SOL (Supplementary Figure S1).
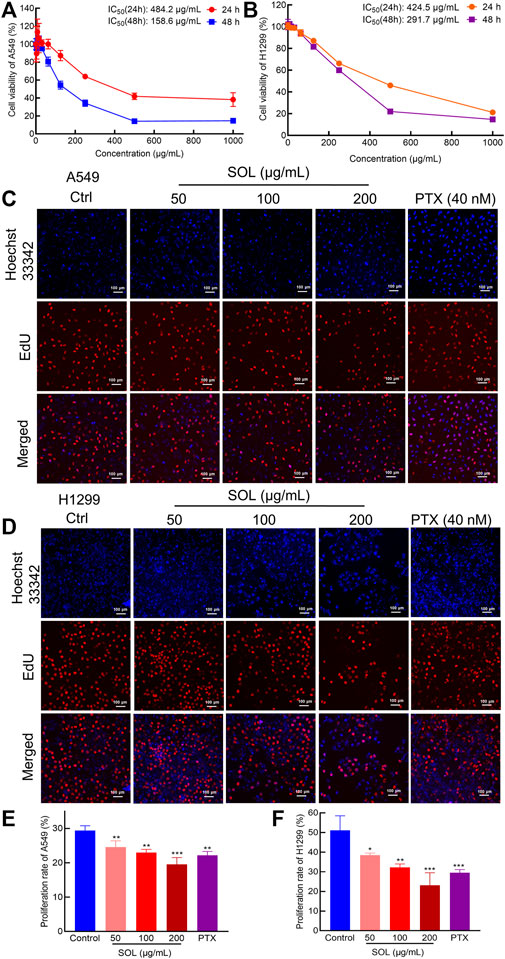
FIGURE 4. Proliferation inhibition of SOL in NSCLC cells. CCK8 assay was conducted in A549 (A) and H1299 (B) cells treated with SOL for 24 h and 48 h. Cell viability curves and IC50 values were shown, respectively. EdU assay was conducted in A549 (C) and H1299 (D) cells treated with SOL for 24 h. Blue represents the cell nucleus, and red represents DNA replication. SOL significantly decreased the proportion of EdU-positive cells compared with that of control A549 (E) and H1299 (F) cells. Magnification: ×100, scale bar in white: 100 µm. Bars in the histograms represent the mean ± SD from three independent experiments. Compared with Ctrl group, *p < 0.05, **p < 0.01, and ***p < 0.001.
To explore the effect of SOL on the migration and invasion of A549 and H1299 cells, wound healing and Transwell assays were performed. Compared to the control group, the migration of A549 and H1299 cells was markedly inhibited in the SOL treatment groups (Figure 5). In the Transwell assay, the invasion of SOL-treated A549 and H1299 cells (Figure 6) was inhibited in a dose-dependent manner. Immunohistochemical analysis of MMP9 expression in tumor tissues revealed that invasion of the tumor was inhibited by SOL (Supplementary Figure S2).
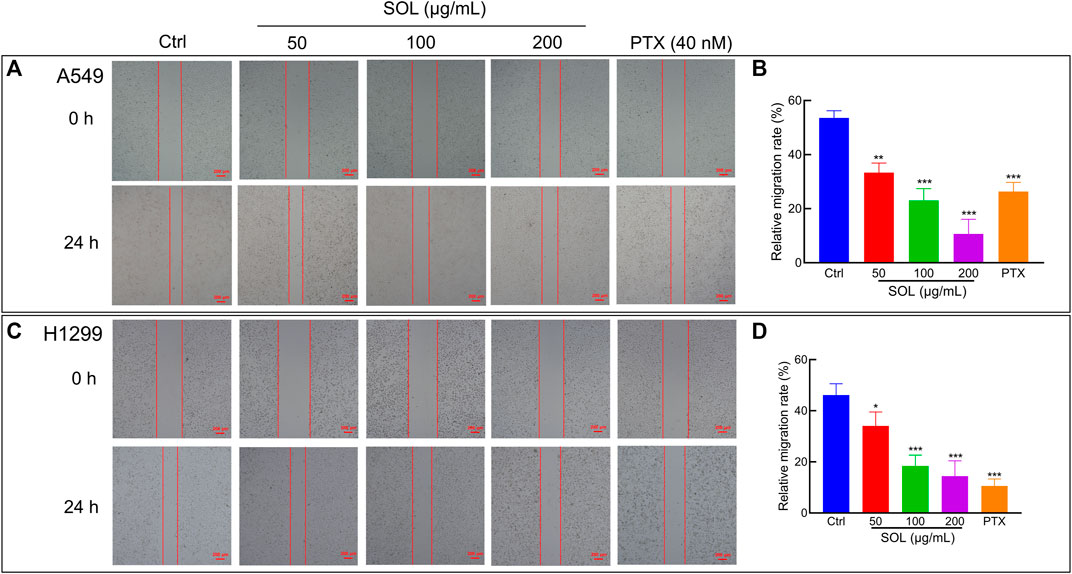
FIGURE 5. Cell migration of SOL in NSCLC cells. SOL decreased the migration of A549 (A) and H1299 (C) cell lines, as shown by wound healing assays. The statistical results of the relative migration rate of A549 (B) and H1299 (D) cells were shown in this figure, respectively. Magnification: ×100, scale bar in red: 100 µm. Bars in the histograms represent the mean ± SD from three independent experiments. Compared with Ctrl group, *p < 0.05, **p < 0.01, and ***p < 0.001.
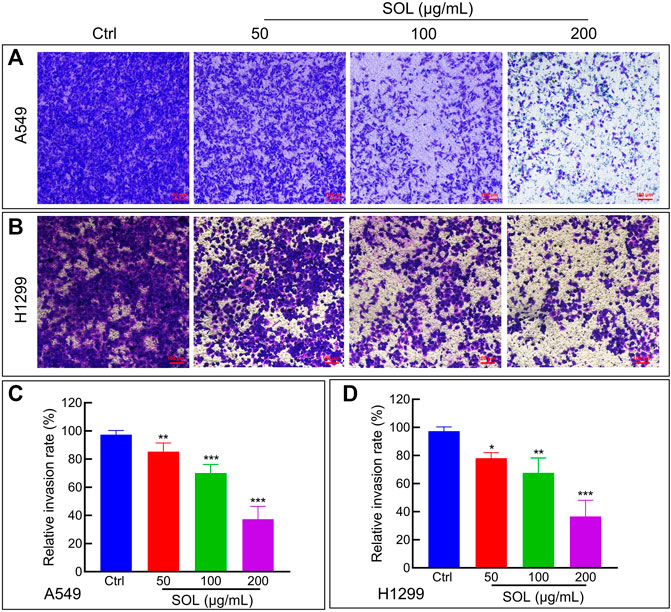
FIGURE 6. Cell invasion of SOL in NSCLC cells. SOL decreased the invasion of A549 (A) and H1299 (B) cell lines, as shown by transwell assays, respectively. Magnification: ×100, Scale bar in red: 100 µm. The statistical results of the relative invasion rate of A549 (C) and H1299 (D) cells were shown in this figure, respectively. Bars in the histograms represent the mean ± SD from three independent experiments. Compared with Ctrl group, *p < 0.05, **p < 0.01, and ***p < 0.001.
3.3 Sanguisorba officinalis L. accelerated apoptosis in NSCLC cells
SOL treatment generated a significant increase in the Annexin V-positive population as determined by flow cytometry (Figures 7A,C). Cleavage of caspase-3 and poly (ADP-ribose) polymerase-1 (PARP-1), considered apoptosis markers, was induced by SOL treatment (Figures 7B,D; Supplementary Figure S3), so as in tumors of A549-bearing athymic nude mice (Figures 12B,D). To reveal the type of cell death induced by SOL, A549 and H1299 cells, they were doubly stained with Hoechst 33342/PI. Hoechst 33342 staining revealed that SOL treatment decreased the density of A549 and H1299 cells (Figures 8A,B), while PI staining revealed that the proportion of cells undergoing SOL-induced lytic cell death (PI-positive cells) increased in a dose-dependent manner.
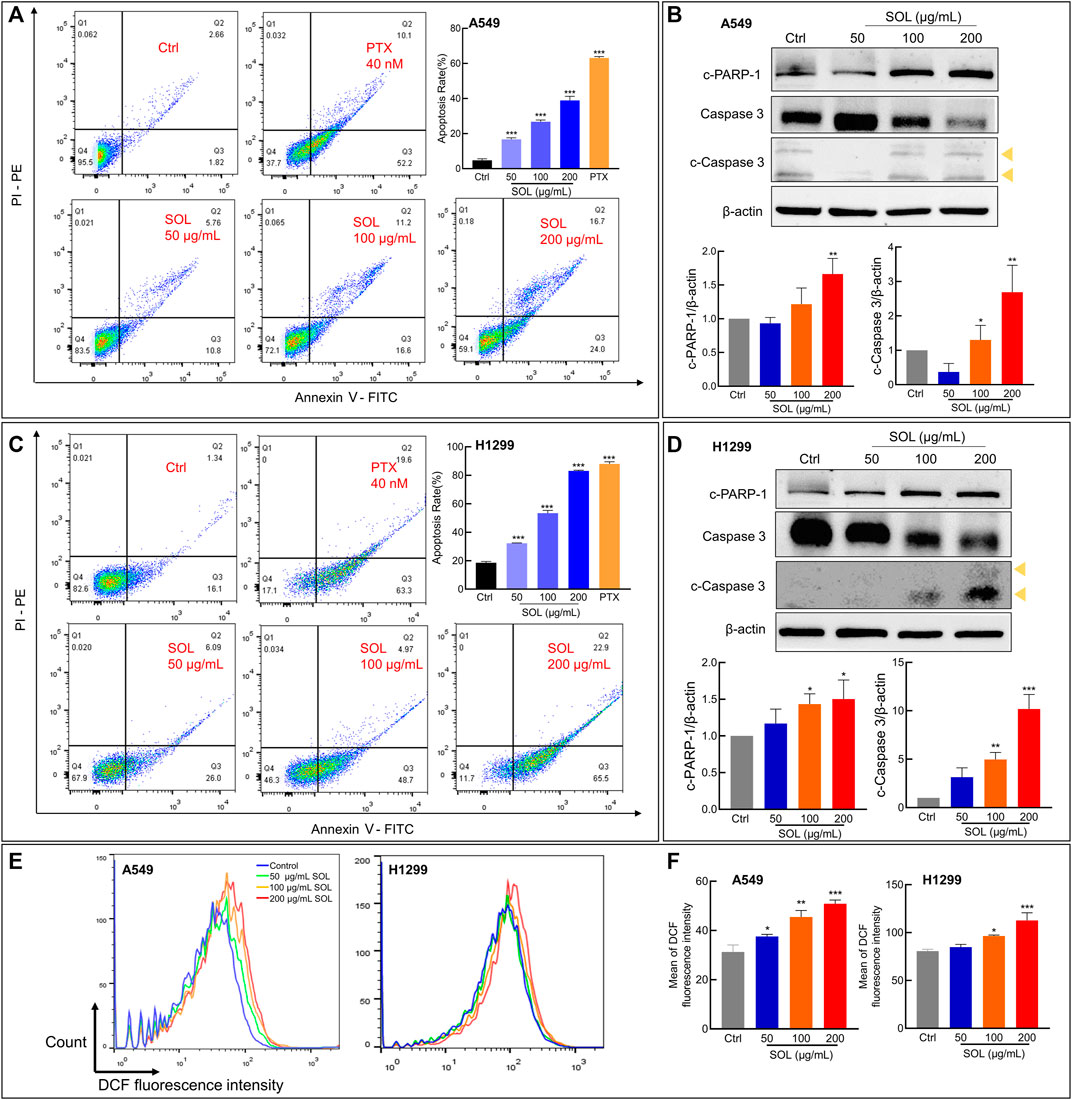
FIGURE 7. Cell apoptosis and ROS level of SOL in NSCLC cells. SOL increased the apoptosis of A549 (A) and H1299 (C) cell lines, as shown by FACS assays. The statistical results of the apoptosis rate of A549 and H1299 cells were shown, respectively. The apoptosis-related protein levels of c-PARP-1, caspase 3, and c-caspase 3 in A549 cells (B) and H1299 cells (D) were detected by western blotting. The yellow arrows indicated the location of the two cleaved bands of Caspase-3. Bars in the histograms represent the mean ± SD from three independent experiments. Compared with Ctrl group, *p < 0.05, **p < 0.01, and ***p < 0.001. (E) Intracellular ROS level in NSCLC cells using flow cytometry analysis. (F) Quantitative analysis of ROS level in NSCLC cells. Bars in the histograms represent the mean ± SD from three independent experiments. Compared with Ctrl group, *p < 0.05, **p < 0.01, and ***p < 0.001.
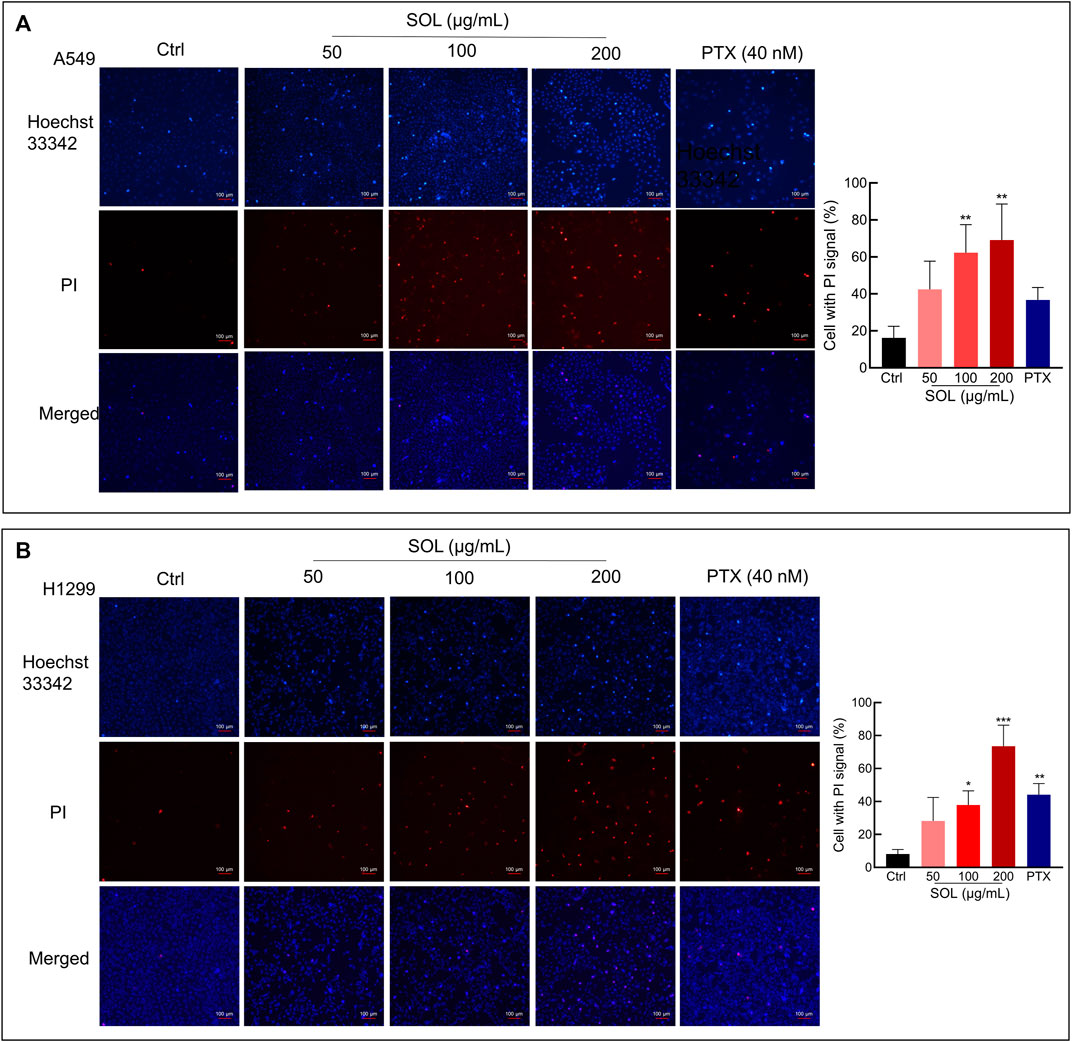
FIGURE 8. Hoechst 33342/PI staining of SOL on NSCLC cells. A549 cells (A) and H1299 cells (B) were treated with SOL at the indicated concentration for 24 h. The cells were then stained with PI (red, staining dying cells) plus Hoechst 33342 (blue, staining all cells), and observed by fluorescent microscopy. The bar chart indicates the percentage of cells with a PI signal compared to the blue signal. Magnification: ×100, scale bar in white: 100 µm. Bars in the histograms represent the mean ± SD from three independent experiments. Compared with Ctrl group, *p < 0.05, **p < 0.01, and ***p < 0.001.
ROS generation plays a pivotal role in regulating the process of cancers (Srinivas et al., 2019). ROS induces apoptosis if produced excessive amounts (Sies and Jones, 2020). The results from the flow cytometry assay using the DCFH-DA probe showed that SOL induced excessive ROS production in NSCLC cells, which was in a concentration-dependent manner (Figures 7E,F). This result consistently confirmed oxidative stress was induced by SOL in NSCLC cells, thus resulting in the acceleration of apoptosis.
3.4 Sanguisorba officinalis L. suppressed tumor growth in A549-bearing athymic nude mice
Based on the potent anti-proliferative effect of SOL in vitro, we further validated its inhibitory effect on tumor growth in A549-bearing athymic nude mice. After tumor establishment on the 12th day, mice were I.P.-administered PTX (10 mg/kg) or SOL (25, 50, or 100 mg/kg) daily from days 13–24. After drug administration, tumor volumes were found to be significantly reduced in the SOL groups compared to the vehicle group (Figures 9A,B). Tumor weights were remarkably decreased (Figure 9C), and the rate of tumor inhibition also increased significantly in the SOL groups (Figure 9D). In addition, H&E staining of tumor tissues showed that the proliferation of tumor cells was inhibited (Figure 9E).
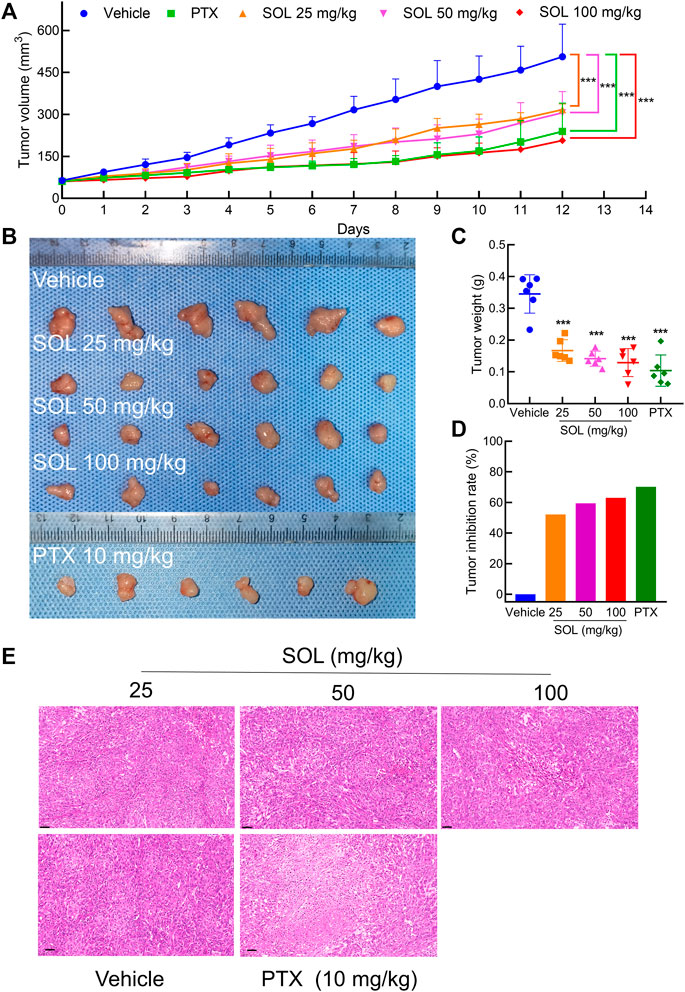
FIGURE 9. SOL inhibited tumor growth in vivo. (A) Statistical results of tumor volume change in mice during 12 days of continuous administration. Bars in the line chart represent the mean ± SD in each group of the 12th day. Compared with Vehicle group, ***p < 0.001. (B) Tumor volume in mice after 12 days of continuous administration. (C) Statistical results of tumor weight in mice after 12 days of continuous administration. Bars in the chart represent the mean ± SD in each group. Compared with Vehicle group, ***p < 0.001. (D) Statistical results of tumor inhibition rate in mice after 12 days of continuous administration. (E) H&E staining images of tumor tissues were dissected from each group on the 12th day. Magnification: ×200, scale bar in black: 50 μm.
3.5 Normal cells and tissues were less sensitive to Sanguisorba officinalis L.
To test the safety of SOL in normal cells, 293T, LO2, and Beas-2b cell lines were employed in vitro. The results showed that the concentrations of SOL used in the study induced no significant toxicity on the liver, kidney, and lung cells (Figures 10F–H). Besides, during the experiments in A549-bearing athymic nude mice, no significant change in body weight was found (Figure 10A). To further confirm the safety of SOL, mice were dissected on the 12th day post-treatment and their major organs were subjected to histological analysis. Compared with the control group, no significant organ damage or inflammation was found, further confirming the safety and low toxicity of SOL (Figure 10B; Supplementary Figure S4). Peripheral blood tests showed that no significant changes were observed in red blood cells and platelet numbers (Figures 10D,E). Interestingly, the white blood cell count in the SOL group increased significantly in a dose-dependent manner (Figure 10C).
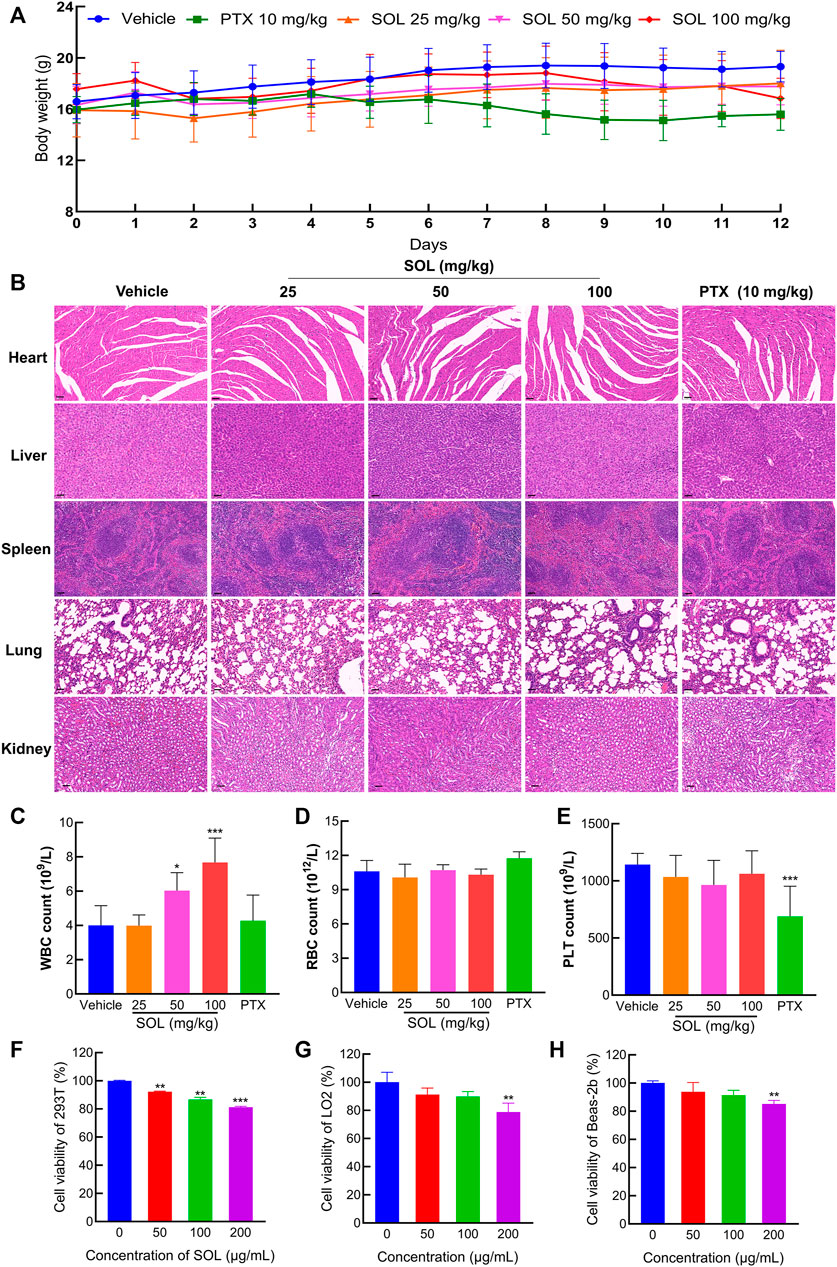
FIGURE 10. The safety of SOL in normal cells and tissues. (A) The body weight of mice changed during 12 days of continuous administration. (B) H&E staining images of major organs (heart, liver, spleen, lung, and kidney) were dissected from each group on the 12th day after photothermal treatment. Magnification: ×200, scale bar in black: 50 µm. Level of white blood cells (C), red blood cells (D), and platelets (E) after 12 days of administration. Bars in the histograms represent the mean ± SD in each group. Compared with Vehicle group, ***p < 0.001. CCK8 assay was conducted in normal cells 293T (F), LO2 (G), and Beas-2b (H) cells treated with SOL for 24 h. Bars in the histograms represent the mean ± SD from three independent experiments. Compared with Ctrl group, **p < 0.01 and ***p < 0.001.
3.6 Sanguisorba officinalis L. suppressed NSCLC via downregulating the PI3K/AKT/mTOR pathway
Network pharmacology analysis suggested that AKT was the top-ranked target and PI3K-AKT was the most significant signaling pathway of SOL activity in NSCLC. Therefore, we further assessed the expression levels of PI3K, AKT, mTOR, and their phosphorylated counterparts by Western blot. Treatment of A549 and H1299 cells with SOL showed the apparent repression of PI3K, AKT and mTOR phosphorylation in a dose-dependent manner (Figure 11). Likewise, the protein expressions of p-PI3K, p-AKT, and p-mTOR were found to be significantly downregulated in the tumors of the mouse xenograft model (Figures 12A,C).
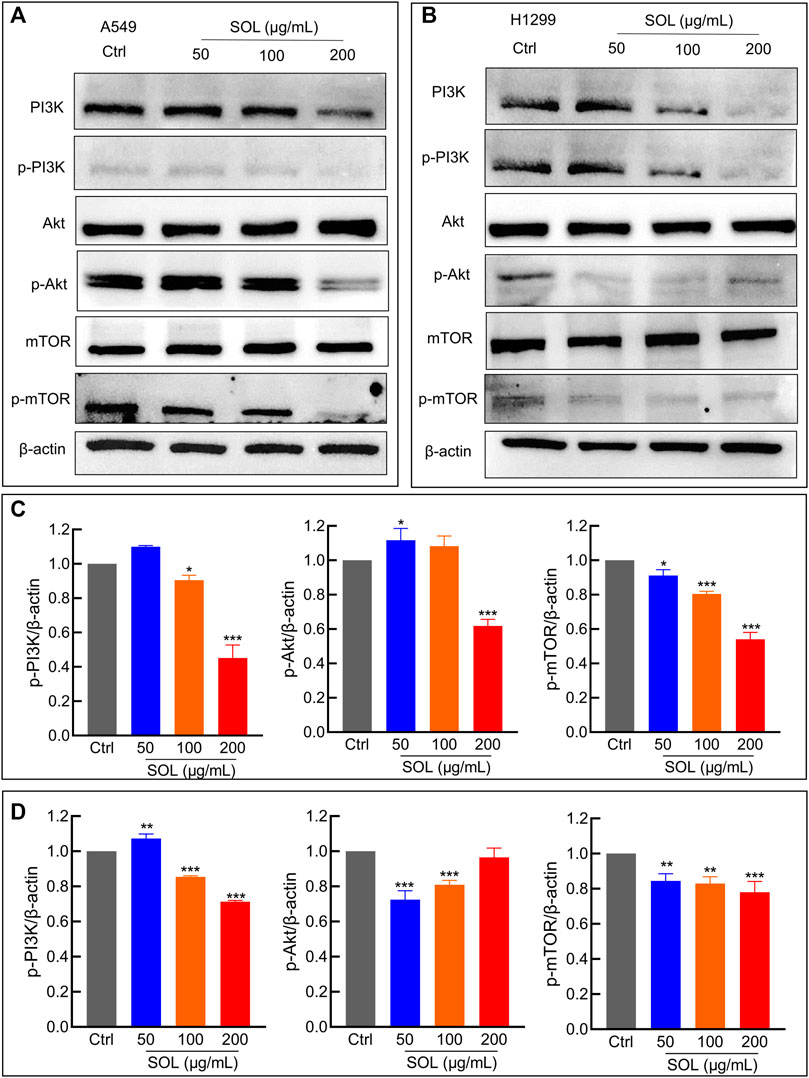
FIGURE 11. SOL suppressed NSCLC via the PI3K/AKT/mTOR signaling pathway. (A) A549 and (B) H1299 cells were treated with SOL (0, 50, 100, 200 μg/ml) for 24 h. The cell protein was then harvested for detecting PI3K, AKT, mTOR, and β-Actin by Western blotting. (C,D) Histograms indicated the relative density of these proteins to β-Actin. Bars in the histograms represent the mean ± SD from three independent experiments. Compared with Ctrl group, *p < 0.05, **p < 0.01 and ***p < 0.001. Compared with Ctrl group, *p < 0.05, **p < 0.01, and ***p < 0.001.
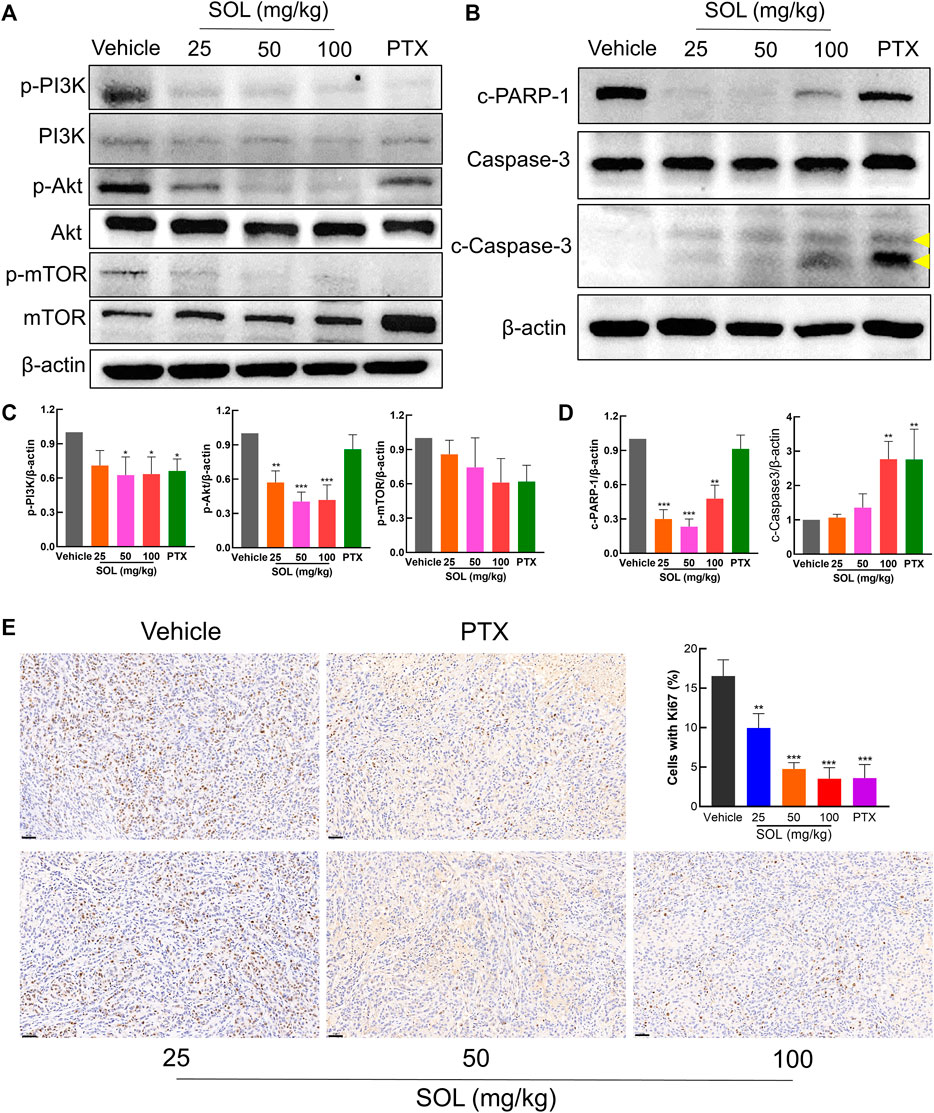
FIGURE 12. SOL exhibited the anti-NSCLC activity in A549-bearing athymic nude mice. (A) Tumor tissue lysates were analyzed by Western blot for mTOR, PI3K, AKT, and β-Actin. (B) Tumor tissue lysates were analyzed by Western blot for cleaved PARP-1 (c-PARP-1), Caspase-3, cleaved Caspase-3 (c-Caspase-3), and β-Actin. The yellow arrows indicated the location of the two cleaved bands of Caspase-3. (C) Histograms indicated the relative density of the proteins (p-mTOR, p-PI3K, and p-AKT) to β-Actin. Bars in the histograms represent the mean ± SD in each group. Compared with Vehicle group, *p < 0.05, **p < 0.01, and ***p < 0.001. (D) Histograms indicated the relative density of the proteins (c-PARP-1 and c-Caspase-3) to β-Actin. Bars in the histograms represent the mean ± SD in each group. Compared with Vehicle group, **p < 0.01 and ***p < 0.001. (E) The expression of Ki67 in the tumor tissue of A549-bearing athymic nude mice was analyzed by the immunohistochemistry method. Magnification: ×200, scale bar in black: 50 µm. Bars in the histogram represent the mean ± SD in each group. Compared with Vehicle group, **p < 0.01 and ***p < 0.001.
4 Discussion
NSCLC is the most common lung cancer, most of which are diagnosed at a late stage and the five-year survival rate is low (Sung et al., 2021). However, drug resistance and drug toxicity are the main problems during the treatment of NSCLC. Searching for effective and safe therapeutic drugs to treat NSCLC becomes a hot topic nowadays. Various extracts from TCMs have shown anti-NSCLC effects in recent years (Zhou et al., 2017; Wang et al., 2018; Zhang X et al., 2020), and modern studies have shown that extracts of SOL have antitumor effects (Choi et al., 2012; Liu et al., 2016; Wang N et al., 2020; Jiang et al., 2021). These findings suggested that SOL has potential against NSCLC. Thus, we explored the relationship between SOL and NSCLC to verify the hypothesis.
Network pharmacology is the comprehensive exploration of compounds, pathways, genes, and proteins (Tang and Aittokallio, 2014; Boezio et al., 2017). As an auxiliary means of experimental research, network pharmacology provides a reference for predicting the relationship between TCMs and diseases (Luo et al., 2020). Therefore, network pharmacology was employed to reveal the possibility and mechanisms underlying SOL activity in NSCLC. In the present study, databases and software were used to acquire the common targets of SOL and NSCLC. These targets are associated with cell proliferation, cell migration, apoptosis, and protein phosphorylation, which are closely related to tumorigenesis. Among the potential targets, AKT is top-ranked. AKT (Protein kinase B, PKB) is a serine/threonine kinase that plays a key in regulating cell survival and tumor formation. Activation of AKT promotes cell proliferation and suppresses apoptosis (Manning and Toker, 2017). In addition to identifying the targets of SOL in NSCLC, we obtained 10 potential pathways using KEGG pathway enrichment analysis. Of these pathways, the PI3K/Akt signaling pathway caught our attention not only because of its top rank among the enriched pathways but also because of its linkage to AKT as a major mediator. The PI3K/AKT/mTOR pathway plays an important role in cell growth and proliferation. Phosphatidylinositol 3-kinase (PI3K), phosphorylating the inositol ring of phosphatidylinositol, plays a vital role in a variety of human cancers including NSCLC (Fruman et al., 2017). AKT is the major downstream target of PI3K. The mechanistic target of rapamycin (mTOR) is one of the downstream of AKT, which is related to cell proliferation, growth, and apoptosis (Saxton and Sabatini, 2017). Moreover, the constitutive activation of the PI3K/AKT/mTOR signaling pathway occurs in 90% of NSCLC cell lines (Zhao et al., 2015). ROS is the specific event upstream of the inhibition of the PI3K/AKT signaling pathway and induction of apoptosis (Liu et al., 2021). ROS can induce DNA damage and increase the mutation rate, contributing to tumorigenesis (Harris and DeNicola, 2020). Importantly, ROS leads to caspase-3 activation (Onodera et al., 2018). Consistently, we have found an elevation in the ROS level in SOL-induced NSCLC cells. More importantly, PARP-1, one of the core targets identified from network pharmacology analysis, plays a key role in cell apoptosis (Yu et al., 2002; Schiewer et al., 2018). And caspase-3 is the execution of apoptosis (Eto et al., 2012). In this study, the cleavage of PARP-1 and caspase-3 were dramatically enhanced in vitro and in vivo. Therefore, SOL resulted in caspase- and ROS-dependent apoptosis through downregulating the PI3K/AKT/mTOR signaling pathway in NSCLC.
Collectively, we demonstrated that SOL downregulated the PI3K/AKT/mTOR signaling pathway to suppress NSCLC cell growth (i.e.,: cell proliferation, migration, and invasion) and activated caspase-3 and PARP-1 to promote cell apoptosis by inducing ROS production (Figure 13). To our knowledge, this is the first study showing that SOL suppressed NSCLC both in vitro and in vivo based on network pharmacology. This research provides a positive preclinical study for the development of potential antitumor TCM drugs. However, the limitation of the present study is the unknown specific active components of SOL in NSCLC, which we will explore in the following research. Mechanistically, predictions of other pathways require further validation to improve this study.
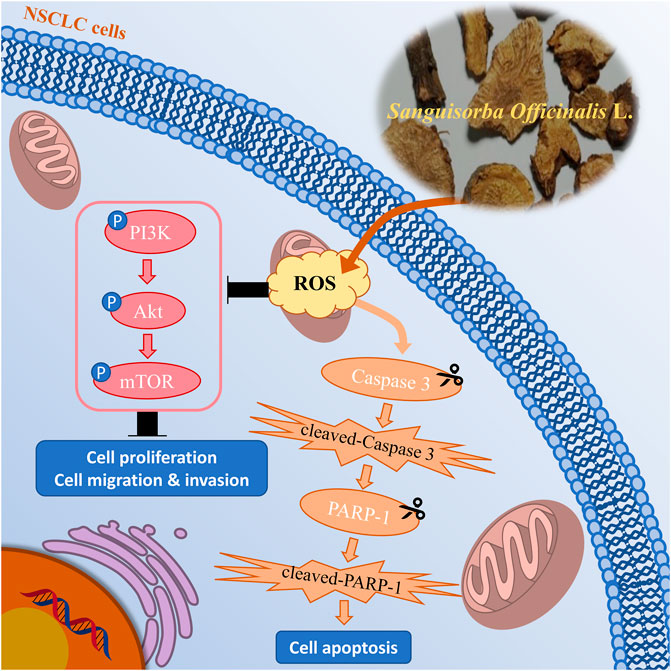
FIGURE 13. Mechanism chart of the study. SOL downregulated the PI3K/AKT/mTOR signaling pathway to suppress NSCLC cell growth, including cell proliferation, migration, and invasion, by inducing the production of ROS. Simultaneously, SOL induced ROS production, thus activated caspase-3 and PARP-1 to promote cell apoptosis. A “P” in the circle represents phosphorylation. Scissors indicate the cleaved process of caspase 3 and PARP-1.
5 Conclusion
In summary, the present study predicted the mechanism of SOL in NSCLC and determined conclusively that SOL downregulated the PI3K/AKT/mTOR signaling pathway to suppress NSCLC.
Data availability statement
The original contributions presented in the study are included in the article/Supplementary Material, further inquiries can be directed to the corresponding authors.
Ethics statement
The animal study was reviewed and approved by the Animal Ethics Committee of Southwest Medical University (License No. 20210304-012).
Author contributions
HoL and JLi performed the network pharmacological analysis. HoL wrote the manuscript. HoL, JL, FY, JD, QH, HuL and JLa performed the in vivo experiment. HoL, JLi, and FY performed the in vitro experiments. HoL performed the statistical analysis. WZ, NJ, JLi and ML provided useful suggestions on the methodology. JZ carried out UPLC-MS analysis. JW and ZZ designed the study, revised the manuscript, and approved the final proof as corresponding authors. All authors read and approved the final manuscript.
Funding
This research was funded by grants from the National Natural Science Foundation of China (grant numbers 82074129), the Science and Technology Planning Project of Sichuan Province, China (grant numbers 2022JDJQ0061, 2019YJ0484, 2019YFSY0014, 2019JDPT0010, 2019YJ0473, and 22ZYZYTS0191), Science and Technology Program of Luzhou, China (grant numbers 2019LZXNYD-J11, 2019LZXNYDJ05, 2020LZXNYDZ03, and 2020LZXNYDP01).
Conflict of interest
The authors declare that the research was conducted in the absence of any commercial or financial relationships that could be construed as a potential conflict of interest.
Publisher’s note
All claims expressed in this article are solely those of the authors and do not necessarily represent those of their affiliated organizations, or those of the publisher, the editors and the reviewers. Any product that may be evaluated in this article, or claim that may be made by its manufacturer, is not guaranteed or endorsed by the publisher.
Supplementary material
The Supplementary Material for this article can be found online at: https://www.frontiersin.org/articles/10.3389/fphar.2022.1054803/full#supplementary-material
References
Bai, C. F., Sun, Y. S., Pan, X. C., Yang, J., Li, X. X., Wu, A. G., et al. (2019). Antitumor effects of trimethylellagic acid isolated from Sanguisorba officinalis L. On colorectal cancer via Angiogenesis inhibition and apoptosis induction. Front. Pharmacol. 10, 1646. doi:10.3389/fphar.2019.01646
Boezio, B., Audouze, K., Ducrot, P., and Taboureau, O. (2017). Network-based Approaches in pharmacology. Mol. Inf. 36, 1700048. doi:10.1002/minf.201700048
Chen, R., Manochakian, R., James, L., Azzouqa, G., Shi, H., Zhang, Y., et al. (2020). Emerging therapeutic agents for advanced non-small cell lung cancer. J. Hematol. Oncol. 13, 58. doi:10.1186/s13045-020-00881-7
Choi, E. S., Kim, J. S., Kwon, K. H., Kim, H. S., Cho, N. P., and Cho, S. D. (2012). Methanol extract of Sanguisorba officinalis L. with cytotoxic activity against PC3 human prostate cancer cells. Mol. Med. Rep. 6, 670–674. doi:10.3892/mmr.2012.949
Eto, K., Goto, S., Nakashima, W., Ura, Y., and Abe, S. I. (2012). Loss of programmed cell death 4 induces apoptosis by promoting the translation of procaspase-3 mRNA. Cell Death Differ. 19, 573–581. doi:10.1038/cdd.2011.126
Fruman, D. A., Chiu, H., Hopkins, B. D., Bagrodia, S., Cantley, L. C., and Abraham, R. T. (2017). The PI3K pathway in human disease. Cell 170, 605–635. doi:10.1016/j.cell.2017.07.029
Harris, I. S., and DeNicola, G. M. (2020). The complex interplay between antioxidants and ROS in cancer. Trends Cell Biol. 30, 440–451. doi:10.1016/j.tcb.2020.03.002
Hou, Y., Pi, C., Feng, X. H., Wang, Y. Y., Fu, S. Z., Zhang, X. M., et al. (2020). Antitumor activity in vivo and vitro of New Chiral Derivatives of baicalin and induced apoptosis via the PI3K/Akt signaling pathway. Mol. Ther. Oncolytics 19, 67–78. doi:10.1016/j.omto.2020.08.018
Huang da, W., Sherman, B. T., and Lempicki, R. A. (2009). Systematic and integrative analysis of large gene lists using DAVID bioinformatics resources. Nat. Protoc. 4, 44–57. doi:10.1038/nprot.2008.211
Huang, L., Xie, D. L., Yu, Y. R., Liu, H., Shi, Y., Shi, T., et al. (2018). TCMID 2.0: A comprehensive resource for TCM. Nucleic Acids Res. 46, D1117–D1120. doi:10.1093/nar/gkx1028
Jiang, N., Li, H., Sun, Y. S., Zeng, J., Yang, F., Kantawong, F., et al. (2021). Network pharmacology and pharmacological evaluation reveals the mechanism of the Sanguisorba officinalis in suppressing hepatocellular carcinoma. Front. Pharmacol. 12, 618522. doi:10.3389/fphar.2021.618522
Kibble, M., Saarinen, N., Tang, J., Wennerberg, K., Mäkelä, S., and Aittokallio, T. (2015). Network pharmacology applications to map the unexplored target space and therapeutic potential of natural products. Nat. Prod. Rep. 32, 1249–1266. doi:10.1039/c5np00005j
Li, H., Jiang, X., Shen, X., Sun, Y., Jiang, N., Zeng, J., et al. (2021). TMEA, a polyphenol in Sanguisorba officinalis, promotes thrombocytopoiesis by upregulating PI3K/AKT signaling. Front. Cell Dev. Biol. 9, 708331. doi:10.3389/fcell.2021.708331
Liu, M. P., Liao, M., Dai, C., Chen, J. F., Yang, C. J., Liu, M., et al. (2016). Sanguisorba officinalis L synergistically enhanced 5-fluorouracil cytotoxicity in colorectal cancer cells by promoting a reactive oxygen species-mediated, mitochondria-caspase-dependent apoptotic pathway. Sci. Rep. 6, 34245. doi:10.1038/srep34245
Liu, Y., Shi, C., He, Z., Zhu, F., Wang, M., He, R., et al. (2021). Inhibition of PI3K/AKT signaling via ROS regulation is involved in Rhein-induced apoptosis and enhancement of oxaliplatin sensitivity in pancreatic cancer cells. Int. J. Biol. Sci. 17, 589–602. doi:10.7150/ijbs.49514
Luo, T. T., Lu, Y. Y., Yan, S. K., Xiao, X., Rong, X. L., and Guo, J. (2020). Network pharmacology in research of Chinese medicine formula: Methodology, application and prospective. Chin. J. Integr. Med. 26, 72–80. doi:10.1007/s11655-019-3064-0
Manning, B. D., and Toker, A. (2017). AKT/PKB signaling: Navigating the network. Cell 169, 381–405. doi:10.1016/j.cell.2017.04.001
Oettrich, J. M., Dao, V. T., Frijhoff, J., Kleikers, P., Casas, A. I., Hobbs, A. J., et al. (2016). Clinical relevance of cyclic GMP modulators: A translational success story of network pharmacology. Clin. Pharmacol. Ther. 99, 360–362. doi:10.1002/cpt.336
Onodera, Y., Nam, J. M., Horikawa, M., Shirato, H., and Sabe, H. (2018). Arf6-driven cell invasion is intrinsically linked to TRAK1-mediated mitochondrial anterograde trafficking to avoid oxidative catastrophe. Nat. Commun. 9, 2682. doi:10.1038/s41467-018-05087-7
Planchard, D., Popat, S., Kerr, K., Novello, S., Smit, E. F., Faivre-Finn, C., et al. ESMO Guidelines Committee (2018). Metastatic non-small cell lung cancer: ESMO clinical Practice Guidelines for diagnosis, treatment, and follow-up. Ann. Oncol. 29, iv192–iv237. doi:10.1093/annonc/mdy275
Poornima, P., Kumar, J. D., Zhao, Q., Blunder, M., and Efferth, T. (2016). Network pharmacology of cancer: From understanding of complex interactomes to the design of multi-target specific therapeutics from nature. Pharmacol. Res. 111, 290–302. doi:10.1016/j.phrs.2016.06.018
Rodak, O., Peris-Díaz, M. D., Olbromski, M., Podhorska-Okołów, M., and Dzięgiel, P. (2021). Current landscape of non-small cell lung cancer: Epidemiology, histological classification, targeted therapies, and immunotherapy. Cancers 13, 4705. doi:10.3390/cancers13184705
Ru, J. L., Li, P., Wang, J. N., Zhou, W., Li, B. H., Huang, C., et al. (2014). TCMSP: A database of systems pharmacology for drug discovery from herbal medicines. J. Cheminform. 6, 13. doi:10.1186/1758-2946-6-13
Salic, A., and Mitchison, T. J. (2008). A chemical method for fast and sensitive detection of DNA synthesis in vivo. Proc. Natl. Acad. Sci. U. S. A. 105, 2415–2420. doi:10.1073/pnas.0712168105
Saxton, R. A., and Sabatini, D. M. (2017). mTOR signaling in growth, Metabolism, and disease. Cell 168, 960–976. doi:10.1016/j.cell.2017.02.004
Schiewer, M. J., Mandigo, A. C., Gordon, N., Huang, F., Gaur, S., de Leeuw, R., et al. (2018). PARP-1 regulates DNA repair factor availability. EMBO Mol. Med. 10, e8816. doi:10.15252/emmm.201708816
Sies, H., and Jones, D. P. (2020). Reactive oxygen species (ROS) as pleiotropic physiological signalling agents. Nat. Rev. Mol. Cell Biol. 21, 363–383. doi:10.1038/s41580-020-0230-3
Srinivas, U. S., Tan, B. W. Q., Vellayappan, B. A., and Jeyasekharan, A. D. (2019). ROS and the DNA damage response in cancer. Redox Biol. 25, 101084. doi:10.1016/j.redox.2018.101084
Sung, H., Ferlay, J., Siegel, R. L., Laversanne, M., Soerjomataram, I., Jemal, A., et al. (2021). Global cancer Statistics 2020: GLOBOCAN estimates of incidence and mortality worldwide for 36 cancers in 185 countries. Ca. Cancer J. Clin. 71, 209–249. doi:10.3322/caac.21660
Szklarczyk, D., Morris, J. H., Cook, H., Kuhn, M., Wyder, S., Simonovic, M., et al. (2017). The STRING database in 2017: Quality-controlled protein-protein association networks, made broadly accessible. Nucleic Acids Res. 45, D362–D368. doi:10.1093/nar/gkw937
Tang, J., and Aittokallio, T. (2014). Network pharmacology strategies toward multitarget anticancer. Therapies: From computational models to experimental design principles. Curr. Pharm. Des. 20, 23–36. doi:10.2174/13816128113199990470
Wang, L., Li, H., Shen, X., Zeng, J., Yue, L., Lin, J., et al. (2020). Elucidation of the molecular mechanism of Sanguisorba officinalis L. against leukopenia based on network pharmacology. Biomed. Pharmacother. 132, 110934. doi:10.1016/j.biopha.2020.110934
Wang, N., Muhetaer, G., Zhang, X., Yang, B., Wang, C., Zhang, Y., et al. (2020). Sanguisorba officinalis L. suppresses triple-negative breast cancer metastasis by inhibiting late-phase autophagy via Hif-1α/Caveolin-1 signaling. Front. Pharmacol. 11, 591400. doi:10.3389/fphar.2020.591400
Wang, Q., Acharya, N., Liu, Z. W., Zhou, X. M., Cromie, M., Zhu, J., et al. (2018). Enhanced anticancer effects of Scutellaria barbata D. Don in combination with traditional Chinese medicine components on non-small cell lung cancer cells. J. Ethnopharmacol. 217, 140–151. doi:10.1016/j.jep.2018.02.020
Wang, Y., Zhang, Y., Wang, Y., Shu, X., Lu, C., Shao, S., et al. (2021). Using network pharmacology and molecular Docking to explore the mechanism of Shan Ci Gu (Cremastra appendiculata) against non-small cell lung cancer. Front. Chem. 9, 682862. doi:10.3389/fchem.2021.682862
Xu, H. Y., Zhang, Y. Q., Liu, Z. M., Chen, T., Lv, C. Y., Tang, S. H., et al. (2019). ETCM: An encyclopaedia of traditional Chinese medicine. Nucleic Acids Res. 47, D976–D982. doi:10.1093/nar/gky987
Yu, S. W., Wang, H., Poitras, M. F., Coombs, C., Bowers, W. J., Federoff, H. J., et al. (2002). Mediation of poly (ADP-ribose) polymerase-1-dependent cell death by apoptosis-inducing factor. Science 297, 259–263. doi:10.1126/science.1072221
Zhang, S. Q., Xu, H. B., Zhang, S. J., and Li, X. Y. (2020). Identification of the active compounds and significant pathways of Artemisia Annua in the treatment of non-small cell lung carcinoma based on network pharmacology. Med. Sci. Monit. 26, e923624. doi:10.12659/MSM.923624
Zhang, X., Zhu, J. L., Yan, J. N., Xiao, Y., Yang, R. J., Huang, R. F., et al. (2020). Systems pharmacology unravels the synergic target space and therapeutic potential of Rhodiola rosea L. for non-small cell lung cancer. Phytomedicine 79, 153326. doi:10.1016/j.phymed.2020.153326
Zhao, R., Chen, M., Jiang, Z., Zhao, F., Xi, B., Zhang, X., et al. (2015). Platycodin-D induced autophagy in non-small cell lung cancer cells via PI3K/Akt/mTOR and MAPK signaling pathways. J. Cancer 6, 623–631. doi:10.7150/jca.11291
Zhao, X. J. (2019). Comparison of therapeutic effects of Diyu Shengbai tablet, reservior and shark-liver alcohol on leukopenia. Cap. Food Med. 26, 555–557.
Zhou, M., Shen, S., Zhao, X., and Gong, X. (2017). Luteoloside induces G0/G1 arrest and pro-death autophagy through the ROS-mediated AKT/mTOR/p70S6K signalling pathway in human non-small cell lung cancer cell lines. Biochem. Biophys. Res. Commun. 494, 263–269. doi:10.1016/j.bbrc.2017.10.042
Keywords: Sanguisorba officinalis L., non-small cell lung cancer, network pharmacology, PI3K/AKT/mTOR, ROS
Citation: Li H, Lin J, Yang F, Deng J, Lai J, Zeng J, Zou W, Jiang N, Huang Q, Li H, Liu J, Li M, Zhong Z and Wu J (2022) Sanguisorba officinalis L. suppresses non-small cell lung cancer via downregulating the PI3K/AKT/mTOR signaling pathway based on network pharmacology and experimental investigation. Front. Pharmacol. 13:1054803. doi: 10.3389/fphar.2022.1054803
Received: 27 September 2022; Accepted: 09 November 2022;
Published: 24 November 2022.
Edited by:
Luchen Shan, Jinan University, ChinaReviewed by:
Sidharth Mehan, Indo-Soviet Friendship College of Pharmacy, IndiaAgustina Dwi Retno Nurcahyanti, Atma Jaya Catholic University of Indonesia, Indonesia
Copyright © 2022 Li, Lin, Yang, Deng, Lai, Zeng, Zou, Jiang, Huang, Li, Liu, Li, Zhong and Wu. This is an open-access article distributed under the terms of the Creative Commons Attribution License (CC BY). The use, distribution or reproduction in other forums is permitted, provided the original author(s) and the copyright owner(s) are credited and that the original publication in this journal is cited, in accordance with accepted academic practice. No use, distribution or reproduction is permitted which does not comply with these terms.
*Correspondence: Zhirong Zhong, emhvbmd6aGlyb25nQDEyNi5jb20=; Jianming Wu, amlhbm1pbmd3dUBzd211LmVkdS5jbg==
†These authors have contributed equally to this work and share first authorship