 Mei-Neng Wang
 Yu Li
Yu Li Li-Lan Lei1
 De-Wu Ding
- 1School of Mathematics and Computer Science, Yichun University, Yichun, China
- 2School of Information Engineering, Inner Mongolia University of Science and Technology, Baotou, China
Increasing evidences suggest that miRNAs play a key role in the occurrence and progression of many complex human diseases. Therefore, targeting dysregulated miRNAs with small molecule drugs in the clinical has become a new treatment. Nevertheless, it is high cost and time-consuming for identifying miRNAs-targeted with drugs by biological experiments. Thus, more reliable computational method for identification associations of drugs with miRNAs urgently need to be developed. In this study, we proposed an efficient method, called GNMFDMA, to predict potential associations of drug with miRNA by combining graph Laplacian regularization with non-negative matrix factorization. We first calculated the overall similarity matrices of drugs and miRNAs according to the collected different biological information. Subsequently, the new drug-miRNA association adjacency matrix was reformulated based on the
1 Introduction
Most of the human genes can be transcribed, but more than 98% of genes cannot encode proteins (only about 1.5% can encode proteins) (Carninci et al., 2005). In human tissues, some non-coding RNAs (ncRNAs) can regulate life activities by affecting genes and epigenetics. According to whether the length of ncRNA exceeds 200 nucleotides (nts), ncRNAs can be divided into long non-coding RNA (lncRNA) and short non-coding RNA (sncRNA) (Batista and Chang, 2013). MicroRNA (miRNA) is a type of small ncRNAs with about 22nts that is widely discovered in human beings, animals and plants (Wheeler et al., 2013). miRNAs perform post-transcriptional gene regulation by silencing gene expression (He and Hannon, 2004). Since the discovery of the first miRNA in 1993 in the Caenorhabditis elegans, more and more miRNAs have been discovered in various organisms (Wightman et al., 1993). Up to now, based on the recently updated miRBase (v22), there are 2,656 miRNAs reported and annotated in human beings (Kozomara et al., 2018). MiRNAs are not only highly conserved among different species, but also have temporal and tissue specificity in expression (Berezikov et al., 2006). In human tissues, More than 30% of human genes can be up-regulated or down-regulated by miRNA, and the number of target genes regulated by one miRNA even exceeds 200 (Sui et al., 2013). Research evidences suggest that miRNAs are widely participated in physiological processes and pathological, such as cell development, differentiation, proliferation and apoptosis, etc., (Bartel, 2004; You et al., 2017; Wang et al., 2019a). Clinical studies have confirmed that the occurrence and development of many complex diseases are closely related to the abnormal expression of some specific miRNAs, including tumor, neurological disorders, immune-related and cardiovascular (Rupaimoole and Slack, 2017; You et al., 2017; Peng et al., 2022). For example, the expression levels of miR-210, miR-221 and let-7d are up-regulated in invasive carcinoma and down-regulated in ductal carcinoma in situ (Di Leva et al., 2015). The expression of miR-21 is obviously up-regulated in liver cancer, breast cancer and other malignant tumors. MiR-21 negatively regulates the expression of the tumor suppressor gene PTEN to enhance the invasion and proliferation of liver cancer cells. Therefore, miRNAs have attracted increasing attention of researchers as diagnostic biomarkers and potential therapeutic targets for complex human diseases.
Small molecule drug is an organic compound with a small molecular weight (less than 1,000 Daltons) (Dougherty and Pucci, 2011). Most drugs are small molecule, among commonly used drugs, the number of small molecule drugs accounts for about 98% of the total (Krzyzosiak et al., 2018). Because of good drug-forming properties and drug metabolism, small molecule drugs are helpful to regulate biological processes (Krzyzosiak et al., 2018). Currently, proteins are as the main targets of drug in clinical medical treatment (Hopkins and Groom, 2002; Huang et al., 2018). However, only 10%–15% of human proteins with expression functions are thought to be associated with diseases (Dixon and Stockwell, 2009). In addition, among these disease-associated proteins, many molecules cannot be combined with drugs due to the lack of unique structures, which means that they cannot be targeted (Dixon and Stockwell, 2009; Wang et al., 2018). In other words, the number of protein-targeted of drugs is still very limited. Existing drugs actually only target about 0.05% of the human genome (Santos et al., 2017). In recent years, scientists have begun to look for new drug targets, such as lncRNA and miRNA. The number of targets will become very plentiful if lncRNAs and miRNAs can be as targets for drugs. Nowadays, studies have discovered that miRNAs can be targeted by drugs and have received increasing attentions (Jiang et al., 2012; Huang et al., 2021). Jiang et al. constructed a correlation diagram between drugs and miRNAs in human cancers, and confirmed that some of miRNAs can be inhibited by drugs (Jiang et al., 2012). For example, clinical trials have confirmed that SPC349 can inhibit miR-122 in hepatitis C viruses (Lanford et al., 2010). Additionally, in the breast cancer MCF-7 cells, the expression of miR-21 can be reduced by the use of Matrine (Li et al., 2012). Therefore, in-depth study of drug-miRNA associations is not only conducive to the discovery of new drugs, but also to the repositioning and resistance researches of existing drugs (Huang et al., 2020; Shen et al., 2022). Since the identification of drug-miRNA associations through biological experiments is time-consuming and costly, more accurate and efficient computational approaches for revealing their associations are imperative.
Based on the assumption that similar drugs tend to be related with similar miRNAs, some computational methods have been proposed to identify drug-miRNA associations, including Random Walk with Restart algorithm, Rotation Forest, and Graph Representation Learning, etc., Lv et al. developed a novel computational model to comprehensively infer the unknown associations of drug with miRNA by using Random Walk with Restart algorithm on the bipartite network (Lv et al., 2015). Guan et al. proposed a computational method of Graphlet Interaction based inference for drug-MiRNA association (GISMMA) (Guan et al., 2018). This method used Graphlet Interaction consisting of 28 isomers to describe the complex associations between two drugs or two miRNAs. The drug-miRNA association score is calculated by counting the numbers of graphlet interaction in miRNA similarity network and drug similarity network. Li et al. developed a new computational model based on network framework to infer miRNAs as potential biomarkers of anticancer drugs (SMiR-NBI) (Li et al., 2016a). This method implemented a network-based algorithm by constructing a heterogeneous network that connected genes, miRNAs and drugs. Yin et al. developed a computational approach using heterogeneous graph inference and sparse learning to discover associations of drug with miRNA (SLHGISMMA) (Yin et al., 2019). SLHGISMMA decomposes the adjacency matrix of drug-miRNA using sparse learning, and reconstructs heterogeneous graph for predicting. Qu et al. developed a triple layer heterogeneous graph method to discover drug-miRNA potential relationships (TLHNSMMA) (Qu et al., 2018). This method used an iterative update algorithm to transmit information through the constructed heterogeneous network. Wang et al. proposed a new computational model based on random forest (RFSMMA) (Wang et al., 2019b). The model of RFSMMA uses machine learning algorithms to infer drug-miRNA associations by integrating multiple similarities between drugs and miRNAs. Although many calculation methods have been proposed, as of now, these existing methods are still unsatisfactory for predicting drug-miRNA associations. In fact, drug-miRNA associations inference can be regarded as a recommender task (Huang et al., 2017; Wang et al., 2022a). Recent studies suggest that non-negative matrix factorization (NMF) has been effectively used for data representation in recommendation systems (Lee and Seung, 1999; Jiang et al., 2015), especially in the field of bioinformatics (Wang et al., 2021a; Wang et al., 2021b). Therefore, we turn the drug-miRNA association prediction into recommender system task and utilize NMF to discover potential associations between them.
In this work, we propose a new approach, GNMFDMA, to infer drug-miRNA potential associations by combining graph Laplacian regularization with non-negative matrix factorization. In our method, the similarity of drug needs to be measured by combining drug chemical structure similarity, drug side effect similarity, disease-phenotype similarity and gene-functional consistency similarity. The similarity of miRNA was measured by merging disease-phenotype and gene-functional consistency. In addition, we constructed the graph space of drug and miRNA using
2 Materials and methods
2.1 Methods overview
In this work, a new computational model called GNMFDMA is developed to predict associations of drug with miRNA. The GNMFDMA approach can be summarized into the following three steps (See Figure 1). First, the similarity matrix of drugs is constructed according to the drug chemical structure similarity, indication phenotype similarity of drug, drug side effect similarity and gene functional consistency similarity of drug. The similarity matrix of miRNAs is constructed based on gene functional consistency and disease indication phenotype similarity of miRNA. Second, to extend GNMFDMA to novel drugs and miRNAs, we use weighted
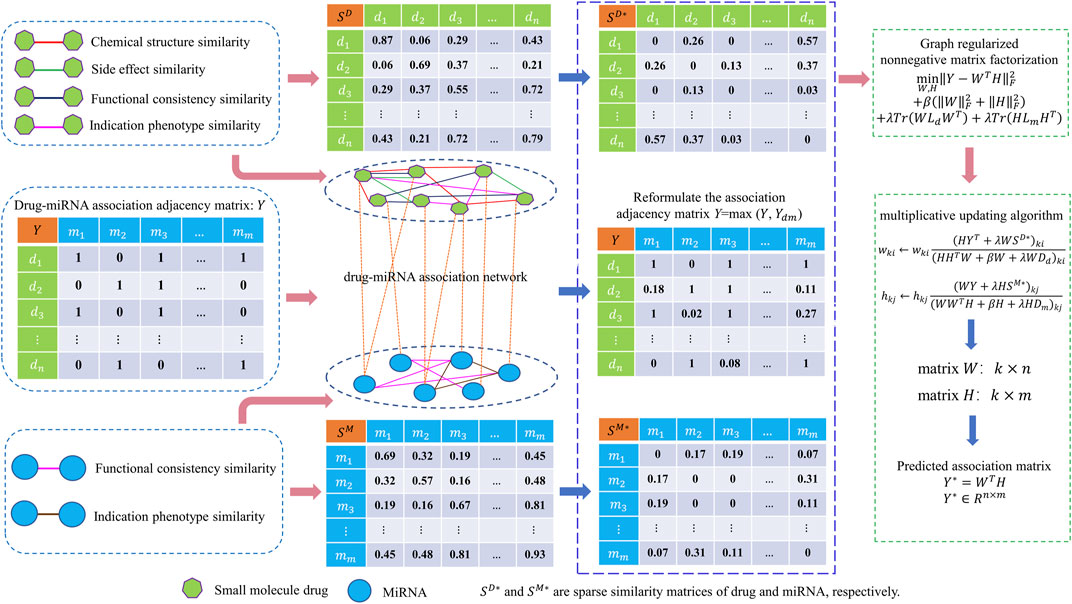
FIGURE 1. Overall framework of GNMFDMA for inferring potential drug-miRNA associations.
2.2 Construct the similarity networks of drug and miRNA
In order to infer potential associations of drug with miRNA using non-negative matrix factorization, we construct the drug-drug interaction network and miRNA-miRNA interaction network by integrating the four categories of drug-drug similarities and two categories of miRNA-miRNA similarities, respectively. Besides, drug-miRNA association network is constructed using the known drug-miRNA association pairs.
In this work, the verified 664 drug-miRNA associations were obtained from the SM2miR database, which can be accessible at http://bioinfo.hrbmu.edu.cn/SM2miR/ (Liu et al., 2012). In the 664 known associations, 831 drugs obtain from PubChem (Wang et al., 2009), DrugBank (Knox et al., 2010), and SM2miR; 541 miRNAs collect from PhenomiR (Ruepp et al., 2010), HMDD (Lu et al., 2008), miR2Disisease (Jiang et al., 2008), and SM2miR databases. However, there are some drugs and miRNAs without any known association information. For this reason, these drugs and miRNAs are deleted, and the duplicated entries are also removed. After screening, the drug-miRNA association network with 664 different associations is constructed for prediction, including 39 drugs and 286 miRNAs (See Table 1). Based on the drug-miRNA association network, the original association adjacency matrix
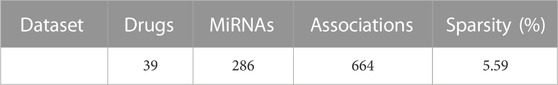
TABLE 1. The dataset used in GNMFDMA for prediction.
Previous studies have shown that similarities based on chemical structure (Hattori et al., 2003), indication phenotype (Gottlieb et al., 2011), side effect (Gottlieb et al., 2011) and gene functional consistency (Lv et al., 2011) are effectively tools to infer the relationships between drugs. In this work, to avoid the bias of single similarity measurement and contribute the discovery of new interactions, four types of drug similarity were integrated according to the model of Lv et al. (2015). The four types of drug similarity are drug chemical structure similarity, disease indication phenotype similarity of drug, drug side effect similarity and gene functional consistency similarity of drug, respectively (Lv et al., 2015). We use matrix
where the weight value
The similarity of miRNA is constructed in this work using the model proposed by Lv et al. (2015), which is based on disease indication phenotype similarity of miRNA and gene functional consistency similarity of miRNA, respectively (Gottlieb et al., 2011; Lv et al., 2011).
where the weight value
2.3 Weighted
Let
For each drug
where
Similarly, all other miRNAs are ranked in descending order according to their similarity to
Then, we merge the two matrices of
where
2.4 Sparse similarity matrices
Based on the spectral graph and manifold learning theories that the nearest neighbor graph can maintain the local geometry of the original data points, and the sparseness technique of similarity matrix has been successfully applied in graph regularization (Cai et al., 2010; You et al., 2010; Li et al., 2016b). At the same time, the drugs and miRNAs located in the same cluster often have more similar functions. Thus, we calculate the affinity graphs (
where
Similarly, the sparse similarity matrix
2.5 The model of GNMFDMA
Non-negative matrix factorization (NMF) method has been effectively applied for data representation. NMF decomposes an original matrix into two non-negative matrices whose product is as equal to the original matrix as possible. At the same time, it can also achieve the purpose of dimensionality reduction. In this work, NMF is used to decompose the drug-miRNA association adjacency matrix
where
where
and
here,
2.6 Optimization of GNMFDMA
To minimize Eq. 14, we introduce Lagrange multipliers method to solve this problem. Let Lagrange multipliers
The partial derivatives of
Then, the Karush–Kuhn–Tucker (KKT) condition
Thus, the updating rules for
Updating
Ultimately, the predicted drug-miRNA associations adjacency matrix
3 Results
3.1 Experimental settings
To systematical evaluate the performance of GNMFDMA, we carry out five-fold cross-validation (5-CV) experiments on SM2miR database and compare it with four state-of-the-art predictors: SMiR-NBI (Li et al., 2016a), SLHGISMMA (Yin et al., 2019), TLHNSMMA (Qu et al., 2018) and RFSMMA (Wang et al., 2019b). Specifically, in the framework of five-fold cross-validation, 664 known drug-miRNA association pairs are randomly divided into five equal subsets. Four subsets of them are taken in turn as the training samples to train the prediction model, and the remaining one subset is regarded as the test sample. In this work, the AUC values (the area under the ROC curve) are used to assess the prediction performance of various models. AUC = 0.5 represents randomly prediction, whereas AUC = 1 represents that the prediction performance of the method is perfect.
In this paper, the parameter values are chosen by 5-CV experiment on the training dataset. GNMFDMA has the following five parameters, the neighborhood size
3.2 Performance evaluation
The performance of GNMFDMA is evaluated by comparing with the previous computational models: SMiR-NBI, SLHGISMMA, TLHNSMMA and RFSMMA. For the above methods, we all use 5-CV to evaluate their performance. Figure 2 draws the ROC curves of GNMFDMA, Table 2 displays the AUC values of all compared approaches. The AUC values of GNMFDMA, SMiR-NBI, SLHGISMMA, TLHNSMMA and RFSMMA are 0.9193, 0.7104, 0.7724, 0.8168 and 0.8389, respectively. GNMFDMA achieves the best performance, which are 20.89%, 14.69%, 10.25% and 8.04% higher than the other four computational methods, respectively.
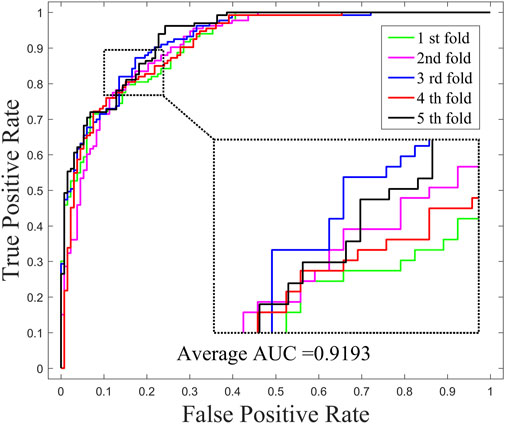
FIGURE 2. The ROC curves of GNMFDMA for drug-miRNA association prediction under 5-CV.

TABLE 2. The AUC values of GNMFDMA and four compared methods in 5-CV.
Additionally, in order to calculate the ratio of exact identifications in the predicted results, sensitivity (Sen), accuracy (Acc), precision (Pre) and F1-Score are widely applied to measure the model performance.
Here, when given a cutoff value, TP and FP denote the number of true positive samples and false positive samples, whose prediction scores higher than cutoff value; TN and FN are the number of true negative samples and false negative samples, whose prediction scores lower than cutoff value. In this work, the threshold of specificity is set 85% to calculate sensitivity, accuracy, precision and F1-Score, respectively. Table 3 exhibits the sensitivity, accuracy, precision, and F1-Score by GNMFDMA under 5-CV.
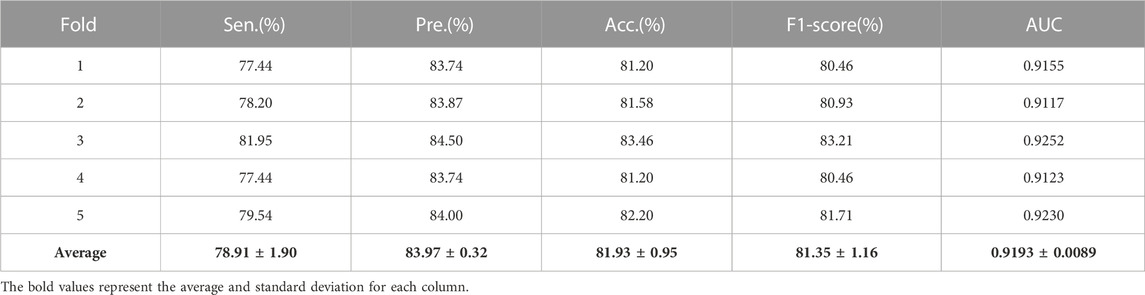
TABLE 3. The average sensitivity, precision, accuracy and F1-Score obtained by GNMFDMA.
In general, the predicted results obtained from top-ranked are more convincing compared with those obtained from other portions. The more true association pairs that are correctly retrieved from the top-ranked, the predictor is more effective. For this reason, we calculate the correct recovery of association pairs at different thresholds when all 664 known drug-miRNA association pairs are used as training samples. The top 10%, 15% and 20% drug-related miRNAs in prediction result, GNMFDMA correctly retrieved 429 (64.61%), 532 (80.12%) and 617 (92.92%) association pairs, respectively. The comparison between the original association adjacency matrix and the predicted association matrix is shown in Figure 3. These results show that GNMFDMA can effectively retrieve the true association pairs with a lower false negative rate. In summary, the method of GNMFDMA has powerful ability for identifying drug-associated miRNAs.
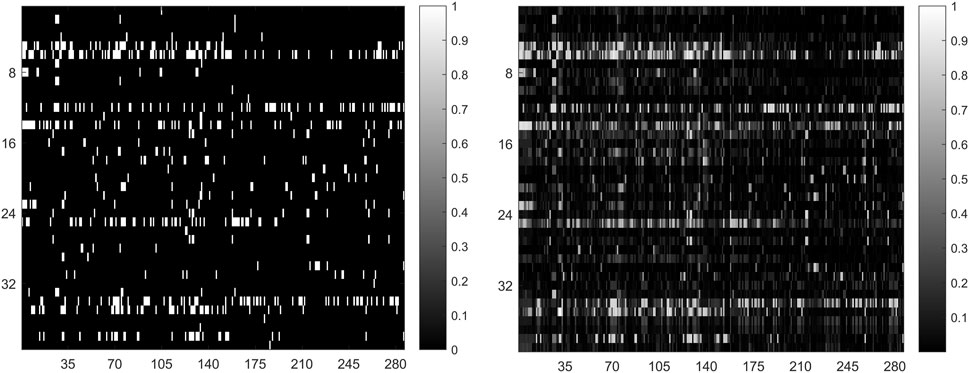
FIGURE 3. The comparison of original association adjacency matrix (left) and the prediction association matrix (right).
3.3 The effect of WKNKN on model performance
In order to investigate the effects of preprocessing step (WKNKN) for GNMFDMA, we compared the performance of GNMFDMA and GNMFDMA* under 5-CV. For GNMFDMA, we implement a preprocessing step (WKNKN) to re-construct the drug-miRNA association adjacency matrix based on their known neighbors before performing non-negative matrix factorization, which can supplement more interaction information to give assistance for predicting new drugs and miRNAs. In addition, the preprocessing step is also helpful for predicting those drugs or miRNAs with sparse known associations. For GNMFDMA*, the preprocessing step is ignored and matrix factorization is directly performed on the original adjacency matrix for inferring drug-associated miRNAs. Figure 2 and Figure 4 represent the ROC curves of GNMFDMA and GNMFDMA* under 5-CV, the AUC values achieved by GNMFDMA and GNMFDMA* are 0.9193 and 0.8507, respectively. The results demonstrate that the performance of GNMFDMA is significantly improved after performing the preprocessing step.
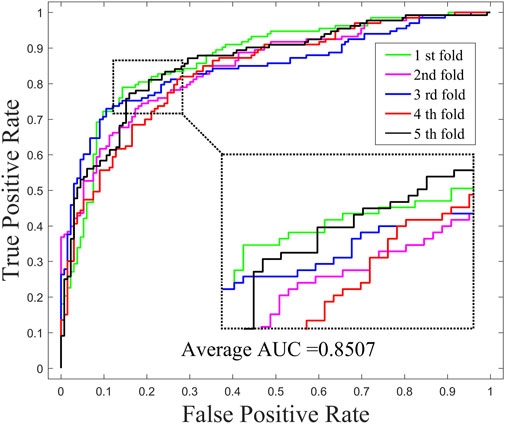
FIGURE 4. The ROC curves of GNMFDMA* for drug-miRNA association prediction under 5-CV.
3.4 Case studies
To further demonstrate the availability of GNMFDMA to discover potential associations of drug with miRNA, case studies are conducted for three common small molecule drugs, 5-Aza-CdR, 5-FU and Gemcitabine based on the SM2miR dataset. In each independent case study, all known 5-Aza-CdR (5-FU or Gemcitabine)-related miRNAs are removed (all miRNAs are regarded as the potential candidates of corresponding drug), the remaining known associations are utilized as the training samples. Next, for each investigated drug, these miRNAs are sorted in descending order according to the predicted scores, it means that the top-ranked miRNAs tend to be related to the corresponding drug.
We use the experimental literature to verify the predicted potential miRNAs for three corresponding drugs. The top 50 potential candidate miRNAs associated with 5-Aza-CdR, 5-FU and Gemcitabine predicted by GNMFDMA are exhibited in Table 4, Table 5 and Table 6, respectively. 30, 31 and 34 out of the top-50 miRNAs inferred by GNMFDMA are verified to be related to the corresponding drug by the experimental literature, respectively. For example, the expression of hsa-let-7d and hsa-let-7e was significantly down-regulated in gemcitabine-resistant cells (Li et al., 2009). Up-regulation of has-let-7 by natural agents can lead to the reversal of epithelial-to-mesenchymal transition in gemcitabine-resistant pancreatic cancer cells. Hsa-miR-125a promotes chemical resistance of pancreatic cancer cells to Gemcitabine by targeting A20 (Yao et al., 2016). In addition, the SM2miR database confirmed that hsa-miR-125a is also associated with drug 5-Aza-CdR. That is, one miRNA may be targeted by multiple small molecule drugs. The above results show that GNMFDMA can effectively predict new drugs or miRNAs without any known relationships, which has important reference significance for related biomedical experiments.
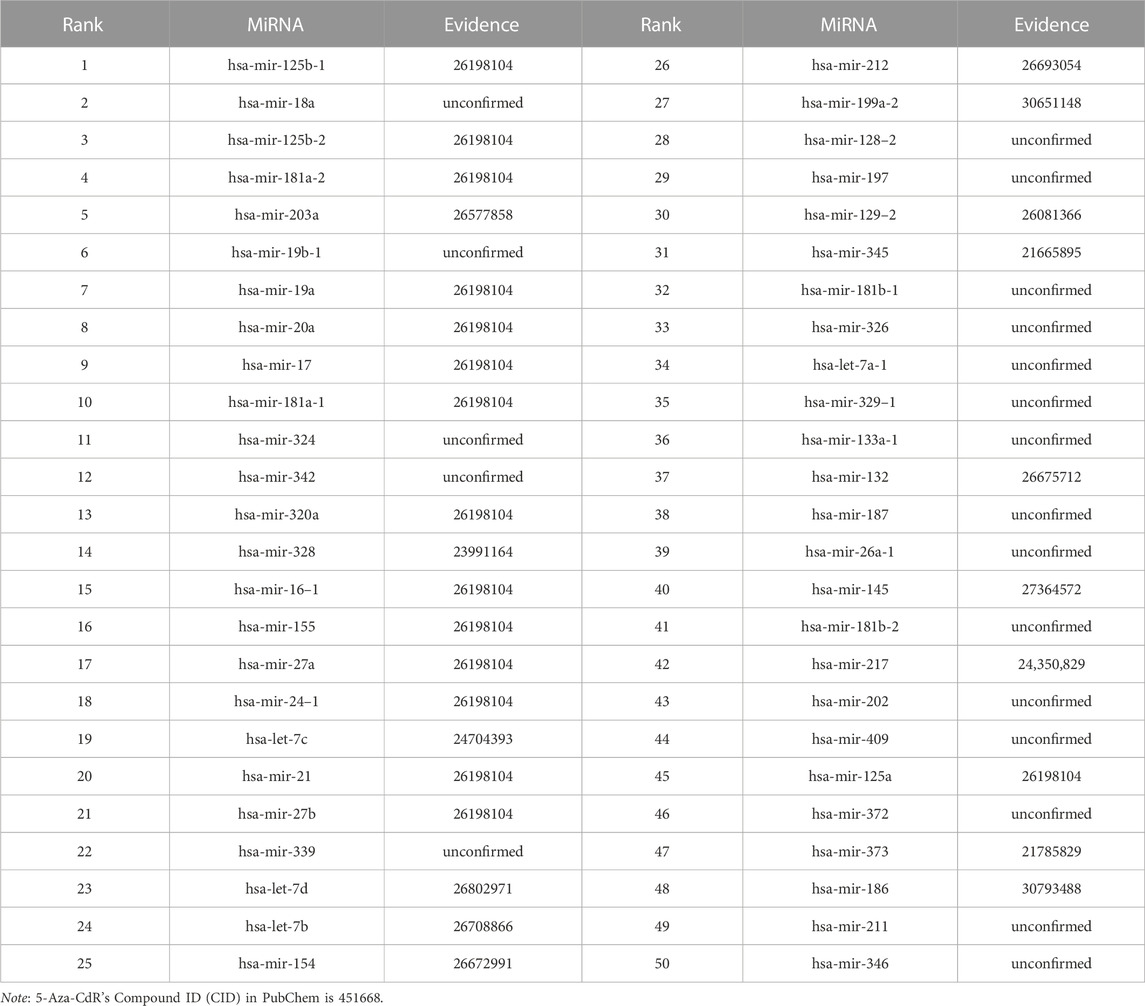
TABLE 4. The top-50 miRNAs related to 5-Aza-CdR are predicted by GNMFDMA.
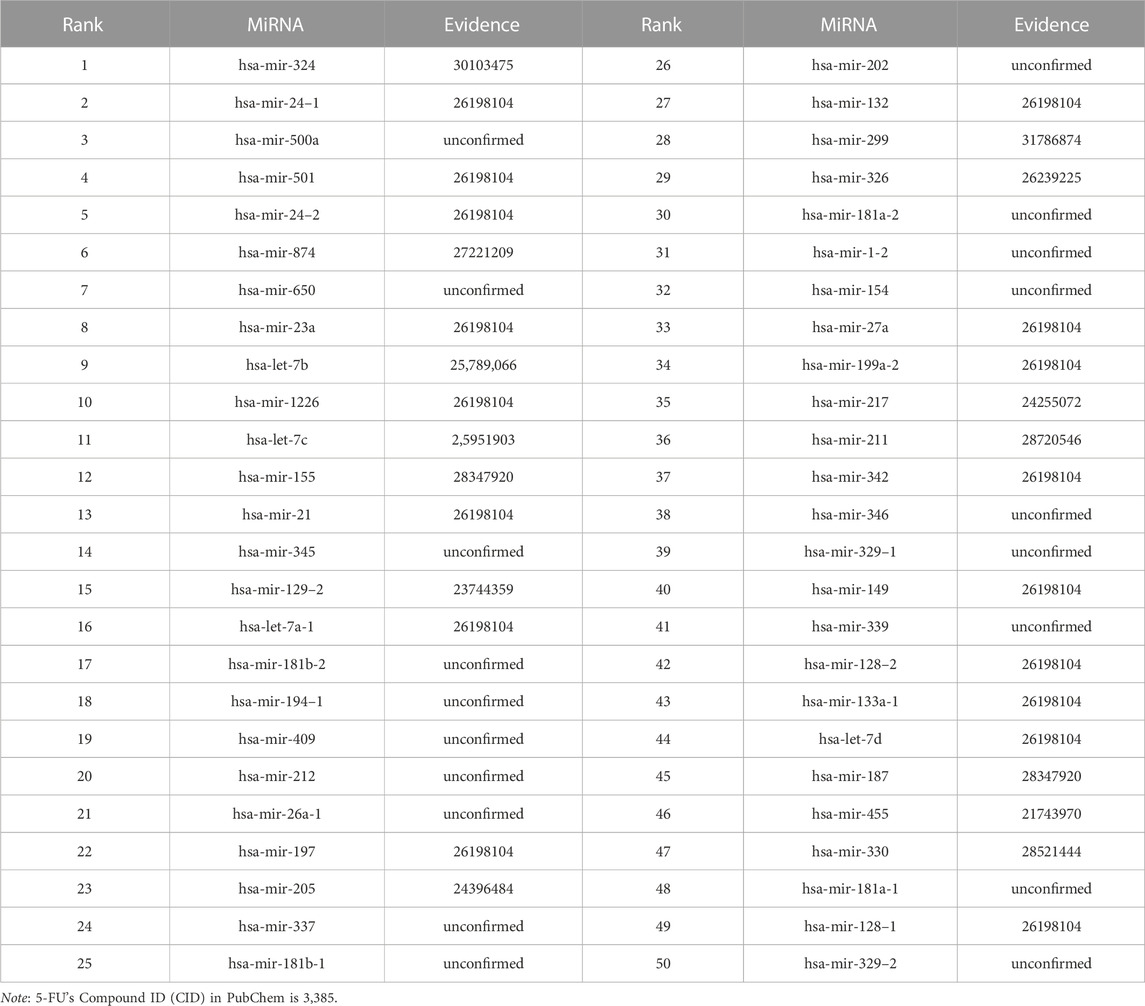
TABLE 5. The top-50 miRNAs related to 5-FU are predicted by GNMFDMA.
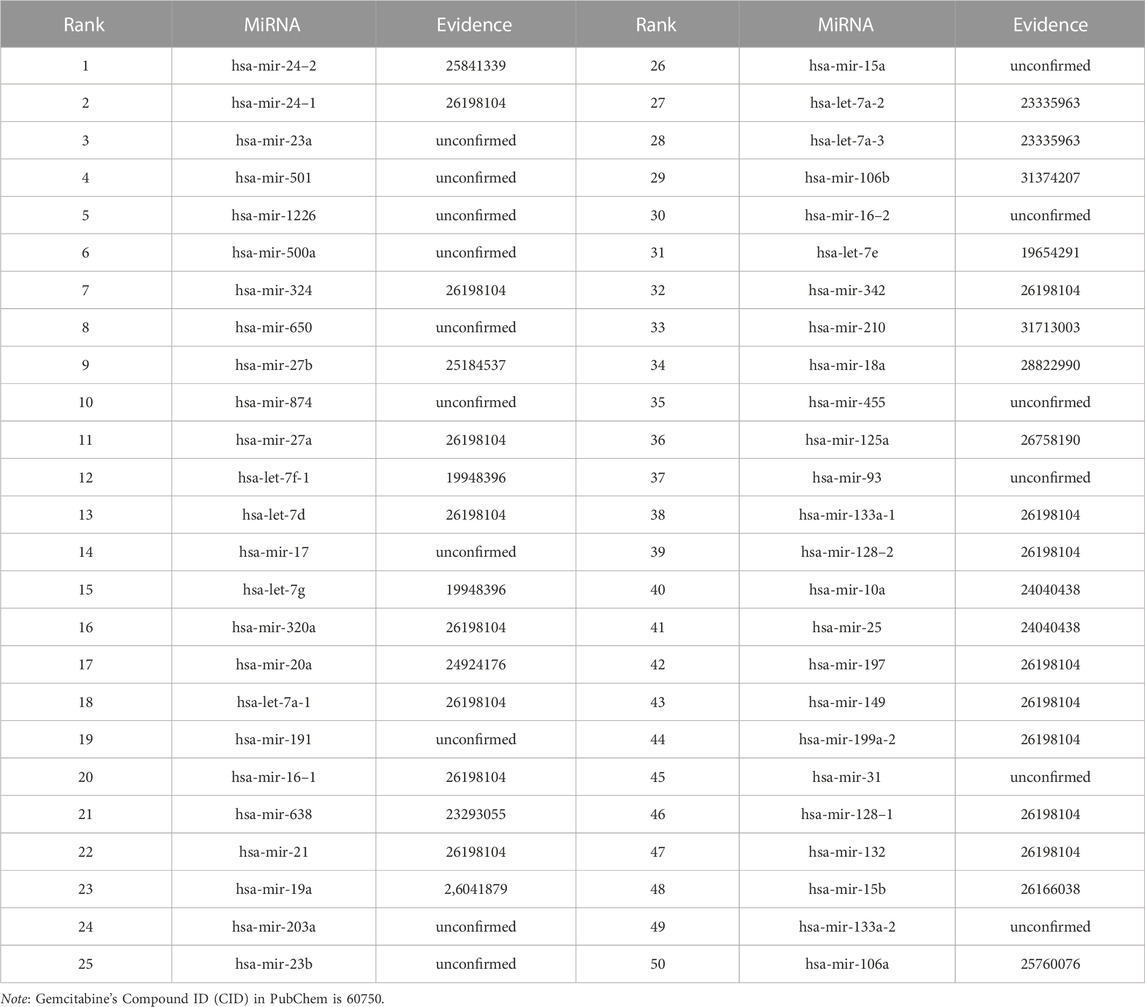
TABLE 6. The top-50 miRNAs related to Gemcitabine are predicted by GNMFDMA.
4 Discussion
Identifying the relationships between drugs and miRNAs is helpful for the discovery of new miRNA-targeted therapies and accelerate drug discovery for complex diseases therapy. Compared with discovering drug-miRNA associations through biological experiments, predicting their associations using computational models can save time and reduce cost. In this study, we propose a new method, GNMFDMA, to infer drug-miRNA potential associations using graph Laplacian regularization collaborative non-negative matrix factorization. In GNMFDMA, we use p-nearest neighbors to construct sparse similarity matrix, and the new drug-miRNA association adjacency matrix is reconstructed based on the
Indeed, the prediction performance of GNMFDMA is still limited by some factors. Firstly, the known drug-miRNA associations are relatively sparse. With the in-depth study of drugs and miRNAs, there will be more datasets of drug-miRNA associations. Secondly, the similarity measurement in our method may not be optimal. Finally, how to effectively integrate more relevant biological information to improve prediction performance is worthy of further research.
Data availability statement
The datasets presented in this study can be found in online repositories. The names of the repository/repositories and accession number(s) can be found in the article/supplementary material.
Author contributions
M-NW conceived the algorithm, analyzed it, carried out experiments, and wrote the manuscript; YL designed and analyzed the experiment; L-LL prepared the data sets and carried out experiments; D-WD carried out experiments and wrote the manuscript; X-JX prepared the data sets. All authors read and approved the final manuscript.
Funding
This work was supported in part by the National Natural Science Foundation of China, under Grant 62161050, in part by the Science and Technology Project of Jiangxi Provincial Department of Education, under Grants GJJ2201716, GJJ211603, GJJ190834.
Acknowledgments
The authors would like to thank all the guest editors and reviewers for their constructive advices.
Conflict of interest
The authors declare that the research was conducted in the absence of any commercial or financial relationships that could be construed as a potential conflict of interest.
Publisher’s note
All claims expressed in this article are solely those of the authors and do not necessarily represent those of their affiliated organizations, or those of the publisher, the editors and the reviewers. Any product that may be evaluated in this article, or claim that may be made by its manufacturer, is not guaranteed or endorsed by the publisher.
References
Bartel, D. P. (2004). MicroRNAs: Genomics, biogenesis, mechanism, and function. Cell 116, 281–297. doi:10.1016/s0092-8674(04)00045-5
Batista, P. J., and Chang, H. Y. (2013). Long noncoding RNAs: Cellular address codes in development and disease. Cell 152, 1298–1307. doi:10.1016/j.cell.2013.02.012
Berezikov, E., Cuppen, E., and Plasterk, R. H. (2006). Approaches to microRNA discovery. Nat. Genet. 38, S2–S7. doi:10.1038/ng1794
Cai, D., He, X., Han, J., and Huang, T. S. (2010). Graph regularized nonnegative matrix factorization for data representation. IEEE Trans. pattern analysis Mach. Intell. 33, 1548–1560. doi:10.1109/TPAMI.2010.231
Carninci, P., Kasukawa, T., Katayama, S., Gough, J., Frith, M., Maeda, N., et al. (2005). The transcriptional landscape of the mammalian genome. Science 309, 1559–1563. doi:10.1126/science.1112014
Di Leva, G., Cheung, D. G., and Croce, C. M. (2015). miRNA clusters as therapeutic targets for hormone-resistant breast cancer. Expert Rev. Endocrinol. Metabolism 10, 607–617. doi:10.1586/17446651.2015.1099430
Dixon, S. J., and Stockwell, B. R. (2009). Identifying druggable disease-modifying gene products. Curr. Opin. Chem. Biol. 13, 549–555. doi:10.1016/j.cbpa.2009.08.003
Dougherty, T. J., and Pucci, M. J. (2011). Antibiotic discovery and development. Berlin, Germany: Springer Science & Business Media.
Ezzat, A., Zhao, P., Wu, M., Li, X.-L., and Kwoh, C.-K. (2017). Drug-target interaction prediction with graph regularized matrix factorization. IEEE/ACM Trans. Comput. Biol. Bioinforma. (TCBB) 14, 646–656. doi:10.1109/TCBB.2016.2530062
Facchinei, F., Kanzow, C., and Sagratella, S. (2014). Solving quasi-variational inequalities via their KKT conditions. Math. Program. 144, 369–412. doi:10.1007/s10107-013-0637-0
Gottlieb, A., Stein, G. Y., Ruppin, E., and Sharan, R. (2011). Predict: A method for inferring novel drug indications with application to personalized medicine. Mol. Syst. Biol. 7, 496. doi:10.1038/msb.2011.26
Guan, N.-N., Sun, Y.-Z., Ming, Z., Li, J.-Q., and Chen, X. (2018). Prediction of potential small molecule-associated microRNAs using graphlet interaction. Front. Pharmacol. 9, 1152. doi:10.3389/fphar.2018.01152
Hattori, M., Okuno, Y., Goto, S., and Kanehisa, M. (2003). Development of a chemical structure comparison method for integrated analysis of chemical and genomic information in the metabolic pathways. J. Am. Chem. Soc. 125, 11853–11865. doi:10.1021/ja036030u
He, L., and Hannon, G. J. (2004). MicroRNAs: Small RNAs with a big role in gene regulation. Nat. Rev. Genet. 5, 522–531. doi:10.1038/nrg1379
Hopkins, A. L., and Groom, C. R. (2002). The druggable genome. Nat. Rev. Drug Discov. 1, 727–730. doi:10.1038/nrd892
Huang, Y.-A., Chan, K. C., You, Z.-H., Hu, P., Wang, L., and Huang, Z.-A. (2021). Predicting microRNA–disease associations from lncRNA–microRNA interactions via multiview multitask learning. Briefings Bioinforma. 22, bbaa133. doi:10.1093/bib/bbaa133
Huang, Y.-a., Hu, P., Chan, K. C., and You, Z.-H. (2020). Graph convolution for predicting associations between miRNA and drug resistance. Bioinformatics 36, 851–858. doi:10.1093/bioinformatics/btz621
Huang, Y.-A., You, Z.-H., and Chen, X. (2018). A systematic prediction of drug-target interactions using molecular fingerprints and protein sequences. Curr. Protein Peptide Sci. 19, 468–478. doi:10.2174/1389203718666161122103057
Huang, Y.-A., You, Z.-H., Li, X., Chen, X., Hu, P., Li, S., et al. (2016). Construction of reliable protein–protein interaction networks using weighted sparse representation based classifier with pseudo substitution matrix representation features. Neurocomputing 218, 131–138. doi:10.1016/j.neucom.2016.08.063
Huang, Y., You, Z., Chen, X., Huang, Z., Zhang, S., and Yan, G. (2017). Prediction of microbe-disease association from the integration of neighbor and graph with collaborative recommendation model. J. Transl. Med. 15, 209. doi:10.1186/s12967-017-1304-7
Jiang, Q., Wang, Y., Hao, Y., Juan, L., Teng, M., Zhang, X., et al. (2008). miR2Disease: a manually curated database for microRNA deregulation in human disease. Nucleic Acids Res. 37, D98–D104. doi:10.1093/nar/gkn714
Jiang, W., Chen, X., Liao, M., Li, W., Lian, B., Wang, L., et al. (2012). Identification of links between small molecules and miRNAs in human cancers based on transcriptional responses. Sci. Rep. 2, 282. doi:10.1038/srep00282
Jiang, X., Hu, X., and Xu, W. (2015). Microbiome data representation by joint nonnegative matrix factorization with laplacian regularization. IEEE/ACM Trans. Comput. Biol. Bioinforma. 14, 353–359. doi:10.1109/TCBB.2015.2440261
Knox, C., Law, V., Jewison, T., Liu, P., Ly, S., Frolkis, A., et al. (2010). DrugBank 3.0: A comprehensive resource for ‘omics’ research on drugs. Nucleic Acids Res. 39, D1035–D1041. doi:10.1093/nar/gkq1126
Kozomara, A., Birgaoanu, M., and Griffiths-Jones, S. (2018). miRBase: from microRNA sequences to function. Nucleic Acids Res. 47, D155–D162. doi:10.1093/nar/gky1141
Krzyzosiak, A., Sigurdardottir, A., Luh, L., Carrara, M., Das, I., Schneider, K., et al. (2018). Target-based discovery of an inhibitor of the regulatory phosphatase PPP1R15B. Cell 174, 1216–1228. doi:10.1016/j.cell.2018.06.030
Lanford, R. E., Hildebrandt-Eriksen, E. S., Petri, A., Persson, R., Lindow, M., Munk, M. E., et al. (2010). Therapeutic silencing of microRNA-122 in primates with chronic hepatitis C virus infection. Science 327, 198–201. doi:10.1126/science.1178178
Lee, D. D., and Seung, H. S. (1999). Learning the parts of objects by non-negative matrix factorization. Nature 401, 788–791. doi:10.1038/44565
Li, J., Lei, K., Wu, Z., Li, W., Liu, G., Liu, J., et al. (2016). Network-based identification of microRNAs as potential pharmacogenomic biomarkers for anticancer drugs. Oncotarget 7, 45584–45596. doi:10.18632/oncotarget.10052
Li, L.-Q., Li, X.-L., Wang, L., Du, W.-J., Guo, R., Liang, H.-H., et al. (2012). Matrine inhibits breast cancer growth via miR-21/PTEN/Akt pathway in MCF-7 cells. Cell. Physiology Biochem. 30, 631–641. doi:10.1159/000341444
Li, J., Cui, G., and Dong, Y. (2016). Graph regularized non-negative low-rank matrix factorization for image clustering. IEEE Trans. Cybern. 47, 3840–3853. doi:10.1109/TCYB.2016.2585355
Li, Y., Vanden, T. G., Kong, D., Wang, Z., Ali, S., Philip, P. A., et al. (2009). Up-regulation of miR-200 and let-7 by natural agents leads to the reversal of epithelial-to-mesenchymal transition in gemcitabine-resistant pancreatic cancer cells. Cancer Res. 69, 6704–6712. doi:10.1158/0008-5472.CAN-09-1298
Liu, X., Wang, S., Meng, F., Wang, J., Zhang, Y., Dai, E., et al. (2012). SM2miR: A database of the experimentally validated small molecules’ effects on microRNA expression. Bioinformatics 29, 409–411. doi:10.1093/bioinformatics/bts698
Liu, X., Zhai, D., Zhao, D., Zhai, G., and Gao, W. (2014). Progressive image denoising through hybrid graph laplacian regularization: A unified framework. IEEE Trans. Image Process. 23, 1491–1503. doi:10.1109/TIP.2014.2303638
Lu, M., Zhang, Q., Deng, M., Miao, J., Guo, Y., Gao, W., et al. (2008). An analysis of human microRNA and disease associations. PloS One 3, e3420. doi:10.1371/journal.pone.0003420
Lv, S., Li, Y., Wang, Q., Ning, S., Huang, T., Wang, P., et al. (2011). A novel method to quantify gene set functional association based on gene ontology. J. R. Soc. Interface 9, 1063–1072. doi:10.1098/rsif.2011.0551
Lv, Y., Wang, S., Meng, F., Yang, L., Wang, Z., Wang, J., et al. (2015). Identifying novel associations between small molecules and miRNAs based on integrated molecular networks. Bioinformatics 31, 3638–3644. doi:10.1093/bioinformatics/btv417
Peng, L., Wang, F., Wang, Z., Tan, J., Huang, L., Tian, X., et al. (2022). Cell–cell communication inference and analysis in the tumour microenvironments from single-cell transcriptomics: Data resources and computational strategies. Briefings Bioinforma. 23, bbac234. doi:10.1093/bib/bbac234
Qu, J., Chen, X., Sun, Y.-Z., Li, J.-Q., and Ming, Z. (2018). Inferring potential small molecule–miRNA association based on triple layer heterogeneous network. J. Cheminformatics 10, 30. doi:10.1186/s13321-018-0284-9
Ruepp, A., Kowarsch, A., Schmidl, D., Buggenthin, F., Brauner, B., Dunger, I., et al. (2010). PhenomiR: A knowledgebase for microRNA expression in diseases and biological processes. Genome Biol. 11, R6. doi:10.1186/gb-2010-11-1-r6
Rupaimoole, R., and Slack, F. J. (2017). MicroRNA therapeutics: Towards a new era for the management of cancer and other diseases. Nat. Rev. Drug Discov. 16, 203–222. doi:10.1038/nrd.2016.246
Santos, R., Ursu, O., Gaulton, A., Bento, A. P., Donadi, R. S., Bologa, C. G., et al. (2017). A comprehensive map of molecular drug targets. Nat. Rev. Drug Discov. 16, 19–34. doi:10.1038/nrd.2016.230
Shen, L., Liu, F., Huang, L., Liu, G., Zhou, L., Peng, L., et al. (2022). VDA-RWLRLS: An anti-SARS-CoV-2 drug prioritizing framework combining an unbalanced bi-random walk and Laplacian regularized least squares. Comput. Biol. Med. 140, 105119. doi:10.1016/j.compbiomed.2021.105119
Sui, W., Lin, H., Peng, W., Huang, Y., Chen, J., Zhang, Y., et al. (2013). Molecular dysfunctions in acute rejection after renal transplantation revealed by integrated analysis of transcription factor, microRNA and long noncoding RNA. Genomics 102, 310–322. doi:10.1016/j.ygeno.2013.05.002
Wang, L., Chen, X., Qu, J., Sun, Y.-Z., and Li, J.-Q. (2019). Rfsmma: A newcomputational model to identify and prioritize potential small molecule–MiRNA associations. J. Chem. Inf. Model. 59, 1668–1679. doi:10.1021/acs.jcim.9b00129
Wang, L., You, Z.-H., Chen, X., Li, Y.-M., Dong, Y.-N., Li, L.-P., et al. (2019). Lmtrda: Using logistic model tree to predict MiRNA-disease associations by fusing multi-source information of sequences and similarities. PLoS Comput. Biol. 15, e1006865. doi:10.1371/journal.pcbi.1006865
Wang, L., You, Z.-H., Chen, X., Yan, X., Liu, G., and Zhang, W. (2018). Rfdt: A rotation forest-based predictor for predicting drug-target interactions using drug structure and protein sequence information. Curr. Protein Peptide Sci. 19, 445–454. doi:10.2174/1389203718666161114111656
Wang, L., You, Z.-H., Zhou, X., Yan, X., Li, H.-Y., and Huang, Y.-A. (2021). Nmfcda: Combining randomization-based neural network with non-negative matrix factorization for predicting CircRNA-disease association. Appl. Soft Comput. 110, 107629. doi:10.1016/j.asoc.2021.107629
Wang, M., Xie, X.-J., You, Z.-H., Wong, L., Li, L.-P., and Chen, Z.-H. (2022). Combining K nearest neighbor with nonnegative matrix factorization for predicting circrna-disease associations. IEEE/ACM Trans. Comput. Biol. Bioinforma. 2022, 1–10. doi:10.1109/TCBB.2022.3180903
Wang, L., You, Z.-H., Wang, L., Li, L.-P., and Zheng, K. (2021). Ldgrnmf: LncRNA-disease associations prediction based on graph regularized non-negative matrix factorization. Neurocomputing 424, 236–245. doi:10.1016/j.neucom.2020.02.062
Wang, M., Lei, L.-L., He, W., and Ding, D. (2022). Spcmlmi: A structural perturbation-based matrix completion method to predict LncRNA-MiRNA interactions. Front. Genet. 13, 1032428. doi:10.3389/fgene.2022.1032428
Wang, Y., Xiao, J., Suzek, T. O., Zhang, J., Wang, J., and Bryant, S. H. (2009). PubChem: A public information system for analyzing bioactivities of small molecules. Nucleic Acids Res. 37, W623–W633. doi:10.1093/nar/gkp456
Wheeler, H. E., Maitland, M. L., Dolan, M. E., Cox, N. J., and Ratain, M. J. (2013). Cancer pharmacogenomics: Strategies and challenges. Nat. Rev. Genet. 14, 23–34. doi:10.1038/nrg3352
Wightman, B., Ha, I., and Ruvkun, G. (1993). Posttranscriptional regulation of the heterochronic gene lin-14 by lin-4 mediates temporal pattern formation in C. Elegans. Cell 75, 855–862. doi:10.1016/0092-8674(93)90530-4
Yao, J., Li, Z., Wang, X., Xu, P., Zhao, L., and Qian, J. (2016). MiR-125a regulates chemo-sensitivity to gemcitabine in human pancreatic cancer cells through targeting A20. Acta Biochimica Biophysica Sinica 48, 202–208. doi:10.1093/abbs/gmv129
Yin, J., Chen, X., Wang, C.-C., Zhao, Y., and Sun, Y.-Z. (2019). Prediction of small molecule-microRNA associations by sparse learning and heterogeneous graph inference. Mol. Pharm. 16, 3157–3166. doi:10.1021/acs.molpharmaceut.9b00384
You, Z.-H., Huang, Z.-A., Zhu, Z., Yan, G.-Y., Li, Z.-W., Wen, Z., et al. (2017). Pbmda: A novel and effective path-based computational model for miRNA-disease association prediction. PLoS Comput. Biol. 13, e1005455. doi:10.1371/journal.pcbi.1005455
Keywords: non-negative matrix factorization, graph Laplacian regularization, drug-miRNA associations, weighted k nearest neighbor, sparse similarity matrix
Citation: Wang M-N, Li Y, Lei L-L, Ding D-W and Xie X-J (2023) Combining non-negative matrix factorization with graph Laplacian regularization for predicting drug-miRNA associations based on multi-source information fusion. Front. Pharmacol. 14:1132012. doi: 10.3389/fphar.2023.1132012
Received: 26 December 2022; Accepted: 16 January 2023;
Published: 02 February 2023.
Edited by:
Zhu-Hong You, Northwestern Polytechnical University, ChinaReviewed by:
Junfeng Xia, Anhui University, ChinaBin Liu, Beijing Institute of Technology, China
Shulin Wang, Hunan University, China
Copyright © 2023 Wang, Li, Lei, Ding and Xie. This is an open-access article distributed under the terms of the Creative Commons Attribution License (CC BY). The use, distribution or reproduction in other forums is permitted, provided the original author(s) and the copyright owner(s) are credited and that the original publication in this journal is cited, in accordance with accepted academic practice. No use, distribution or reproduction is permitted which does not comply with these terms.
*Correspondence: Yu Li, Zm1saXl1QGZveG1haWwuY29t