Abstract
A fast, simple, and sensitive ultra performance liquid chromatography tandem mass spectrometry (UPLC-MS/MS) method was established for the quantification of safinamide in rat plasma. Plasma samples were treated with acetonitrile for protein precipitation, and diazepam was used as an internal standard (IS). The analytes were separated on an Acquity UPLC C18 (2.1 mm × 50 mm, 1.7 μm) chromatographic column with gradient elution using a mobile phase (0.1% formic acid-acetonitrile). Then, the eluates were detected by electrospray ionization (ESI) in positive ion mode. The analytes were quantified by multiple reaction monitoring (MRM) using the transition m/z 303.3→215.0 of safinamide and m/z 285.0→154.0 of IS. Safinamide had good linearity in the concentration range of 1.0–2000 ng/mL, and the lower limit of quantitation (LLOQ) was 1.0 ng/mL. The intra- and inter-day precision and accuracy of safinamide were less than 7.63%, while the average recovery rate was 92.98%–100.29%. The method was validated to be stable and had low noise, short chromatographic run time, wide linear range, small sample volumes, low sample injection volumes, and high sensitivity. Therefore, it can be used in pharmacokinetics and preclinical and clinical studies.
1 Introduction
Safinamide ((2S)-2-[[4-[(3-fluorophenyl) methoxy] phenyl] methylamino] propanamide), used to clinically treat Parkinson’s disease (PD), is a novel, reversible, and highly selective monoamine oxidase B (MAO-B) inhibitor (Fariello et al., 1998; Maj et al., 1998; Maj et al., 1999; Muller, 2017; Hattori et al., 2020; Müller, 2020; Rinaldi et al., 2021; Stocchi et al., 2021). The relative contributing mechanism of safinamide may be relevant to two properties: dopaminergic properties (highly selective, reversible MAO-B) and non-dopaminergic properties (selective sodium channel blockade, selective calcium channel modulation, and consequent excessive glutamate release inhibition) (Salvati et al., 1999; Fariello et al., 2000; Fariello, 2007; Deeks, 2015; Desouza and Schapira, 2017).
Safinamide is a water-soluble drug for once-daily administration. It is absorbed very quickly, and the peak plasma concentration is in the range of 2–4 h. It displays complete and reliable absorption and showed a terminal half-life period of approximately 26 h, with a total bioavailability of 95% (Krosser et al., 2012; Leuratti et al., 2013). Food might prolong the rate of safinamide but does not affect the extent of absorption. After repeated dosing once daily, safinamide homeostasis was achieved on day 5 of treatment, with a cumulative factor of 1.5–1.7.
As an alternative to levodopa, safinamide had been approved for the treatment of PD in Europe and the United States (Di Stefano and Rusca, 2011; Teixeira et al., 2018). It is considered to be a new hope for PD, but still needs trials or studies to prove its potential as an anti-PD drug. However, few methodologies have been established to study this medicine in biological fluids. One study reported that safinamide in humans and various animals was detected by HPLC-MS/MS or HPLC-FD using three methods (Dal Bo et al., 2006). These methods are not widely available to others due to elaborate sample preparation (liquid-liquid extraction), large sample volume (up to 0.5 mL), and low sensitivity (20 ng/mL). Recently, a chiral HPLC method with low sensitivity and long analytical run time (15 min) was developed to detect the (R)-enantiomer in safinamide mesilate (Zhang et al., 2011). To solve the above deficiencies, we have developed a simple and efficient ultra performance liquid chromatography tandem mass spectrometry (UPLC-MS/MS) method with an LLOQ of 1.0 ng/mL for safinamide.
2 Materials and methods
2.1 Chemicals and reagents
Safinamide mesylate (CAS NO: 133,865-89-1) (Figure 1A) and diazepam (CAS NO: 65854-76-4) as an internal standard (IS) (Figure 1B) were obtained from Beijing sunflower and technology Development CO., LTD and Sigma-Aldrich Company (St. Louis, MO, United States), respectively. Formic acid (CAS NO: 64-18-6), LC grade acetonitrile, and methanol were purchased from Anaqua Chemicals Supply (ACS, American) and Merck KGaA (Darmstadt, Germany), respectively. Other reagents were of analytical grade. The experimental water was prepared using a Millipore (Bedford, MA) Milli-Q A10 purification system. The materials used in the experiment met the requirements of LC/MS or UPLC/MS.
FIGURE 1

Chemical structures of safinamide (A) and diazepam (B).
2.2 UPLC-MS/MS conditions
A Waters Acquity UPLC I-Class and a Waters XEVO TQ-S tandem quadrupole mass spectrometer (Waters, Milford, United States) constituted the UPLC-MS/MS equipment. An Acquity UPLC BEH C18 (2.1 mm × 50 mm, 1.7 μm; Waters, Milford, United States) column (temperature 40°C) was used to separate the analytes after 2 μL of extracted sample was injected. The mobile phase consisted of solution A (0.1% formic acid) and solution B (acetonitrile), with the following conditions: 0–0.5 min 10% B; 0.5–1.0 min 10%–90% B; 1.0–2.0 min 90% B; 2.0–2.1 min 90%–10% B; 2.1–3.0 min 10% B. Safinamide and IS were eluted at 1.21 min and 1.41 min, respectively. Under a flow rate of 0.4 mL/min, the chromatographic run time was 3.0 min.
Identification was performed in the positive electrospray ionization (ESI+) mode. The ion source was set as follows: capillary voltage 3.0 kV, source temperature 150 °C, desolvation temperature 800 °C, cone gas 150 L/h, and desolvation gas 650 L/h. Multiple reaction monitoring (MRM) mode was used for quantification according to the target fragment ions of m/z 303.3→215.0 for safinamide and m/z 285.0→154.0 for IS. MassLynx V4.1 software (Waters, Milford, United States) was used for system operation, data acquisition, and data processing.
2.3 Calibration standards
Individual stock solutions of safinamide and IS in LC grade methanol were prepared at a concentration of 1.0 mg/mL. The stock solutions were diluted into calibration and control solutions, respectively. The IS working standard solution was prepared by diluting the reserve solution in methanol at a concentration of 500 ng/mL. Blank rat plasma was spiked with the appropriate working solution amounts to prepare the safinamide calibration standard. The calibration plot of safinamide in rat plasma was linear in the range 1.0–2000 ng/mL (1.0, 5.0, 10, 50, 100, 500, 1,000, and 2000 ng/mL). As calibration standards (2.0, 800, and 1,600 ng/mL), the quality control (QC) samples were prepared independently in the same way. All solutions were stored in a refrigerator at 4°C and were brought to room temperature before use.
2.4 Sample preparation
The frozen plasma sample was thawed at room temperature before analysis. The 100 μL plasma sample containing 20 μL IS (500 ng/mL) was added to 300 μL acetonitrile in a 1.5 mL centrifuge tube. The tube was vortexed for 2.0 min before centrifugation at 13,000 rpm for 15 min. Then, the supernatant (2 μL) was injected into the UPLC-MS/MS system for further analysis.
2.5 Method validation
The selectivity, precision, accuracy, recovery, and stability were approved for the analytical method according to FDA guidelines (Xu et al., 2019; Tang et al., 2020). Selectivity was usually assessed by the degree of interference from the peaks of safinamide and IS at their retention times.
Three different concentrations (2.0, 800, and 1,600 ng/mL) of QC samples were used to assess the precision and accuracy. Examination of QC samples (n = 6) at different times in 1 day was performed to evaluate the intra-day accuracy and precision. QC sample assays were repeated for three consecutive days to evaluate the inter-day accuracy and precision. Relative error (RE) was used to estimate the accuracy, while relative standard deviation (RSD) was used to evaluate the precision. The recovery rate was calculated by comparing the peak area of extracted plasma samples with the peak area obtained by directly injecting the corresponding concentration of standard solution in the extracted blank plasma at three different concentrations (2.0, 800, and 1,600 ng/mL). After protein precipitation, 2.0, 800, and 1,600 ng/mL of analytes were added to blank rat plasma to evaluate matrix effects. Exposed to different conditions, five replicates of plasma samples (2.0, 800, and 1,600 ng/mL) were analyzed to evaluate the stability of safinamide in rat plasma. After exposure to two different conditions (room temperature and 4°C) for 12 h, the spiked samples were examined to evaluate the short-term stability. After three consecutive complete freeze/thaw cycles (−20°C–25°C), the spiked samples were studied to assess the freeze/thaw stability. The spiked samples stored at −80°C for 28 days were measured to evaluate the long-term stability.
2.6 Pharmacokinetic study
Eight male Sprague-Dawley rats (180–220 g) purchased from the Laboratory Animal Center of The First Affiliated Hospital of Wenzhou Medical University (Zhejiang, China) were used to study the pharmacokinetics of safinamide. All experimental procedures and protocols were operated under the National Institutes of Health Guide for the Care and Use of Laboratory Animals and were approved by the Animal Care and Use Committee of The First Affiliated Hospital of Wenzhou Medical University before the study began.
Water was freely available throughout the experiment but the rats were fasted for 12 h before the experiment. Safinamide dissolved in 0.5% sodium carboxymethyl cellulose (2 mg/mL) was orally given to eight young adult Sprague-Dawley rats (180–220 g, 10 mg/kg). Heparinized 1.5 mL polythene tubes were used to collect 0.3 mL blood samples from the tail vein at different time points (0.33, 0.67, 1, 1.5, 2, 3, 4, 6, 9, 12, and 24 h) after oral safinamide. After centrifuging at 4,000 g for 8 min, 100 µL of the supernatant plasma was separated and stored at −80°C until analysis. The safinamide data of plasma concentration versus time were processed and analyzed using DAS (drug and statistics) software (Version 2.0, Shanghai University of Traditional Chinese Medicine, China).
3 Results
3.1 Method development and optimization
Sample preparation, chromatographic separation, and appropriate ionization play critical roles in the development of the method. For sample preparation before UPLC-MS/MS analysis, it was important to employ an effective biological sample removal process to remove proteins and potential interferences. The method in this report used a fast, simple, and effective protein precipitation method as the extraction technique, replacing the existing complex liquid-liquid extraction technology reported in other studies. Using acetonitrile as the protein precipitation solvent was more effective than methanol, trichloroacetic acid (10%), or perchloric acid (6%). Meanwhile, acetonitrile also had an acceptable recovery.
Different combinations (acetonitrile, methanol, water, and formic acid in water) and their proportions were examined in this study to determine the optimal mobile phase. When acetonitrile was used as the mobile phase, the peak shape of the analyte was sharper and symmetrical. Therefore, acetonitrile was selected as the organic solvent. To improve the sensitivity of this method, 0.1% formic acid was added to the mobile phase. Gradient elution was adopted because of its better peak symmetry, proper retention time, and minimal matrix effects. Different flow rates were tested and 0.4 mL/min was selected based on the peak shape of the standard and sample. The total run time of the safinamide detection method established in this study was 3.0 min.
The best MRM quantitative mode was m/z 303.3→215.0 for safinamide and m/z 285.0→154.0 for IS. In addition, bupivacaine, midazolam, metoprolol, and diazepam were tested to obtain a suitable IS. Finally, diazepam stood out from the crowd for its stable ionization and suitable retention time in MRM mode. In addition to these factors, other important variables (including source temperature, carrier gas flow rate, collision gas flow rate, column temperature, injection volume, etc.) were also studied to obtain satisfactory corresponding qualitative data.
3.2 Selectivity and matrix effect
The selectivity of the detection method was evaluated using the chromatograms of the blank plasma, the blank plasma spiked with safinamide and IS, and the real plasma sample after oral administration of safinamide. Figure 2 shows the relevant chromatograms.
FIGURE 2
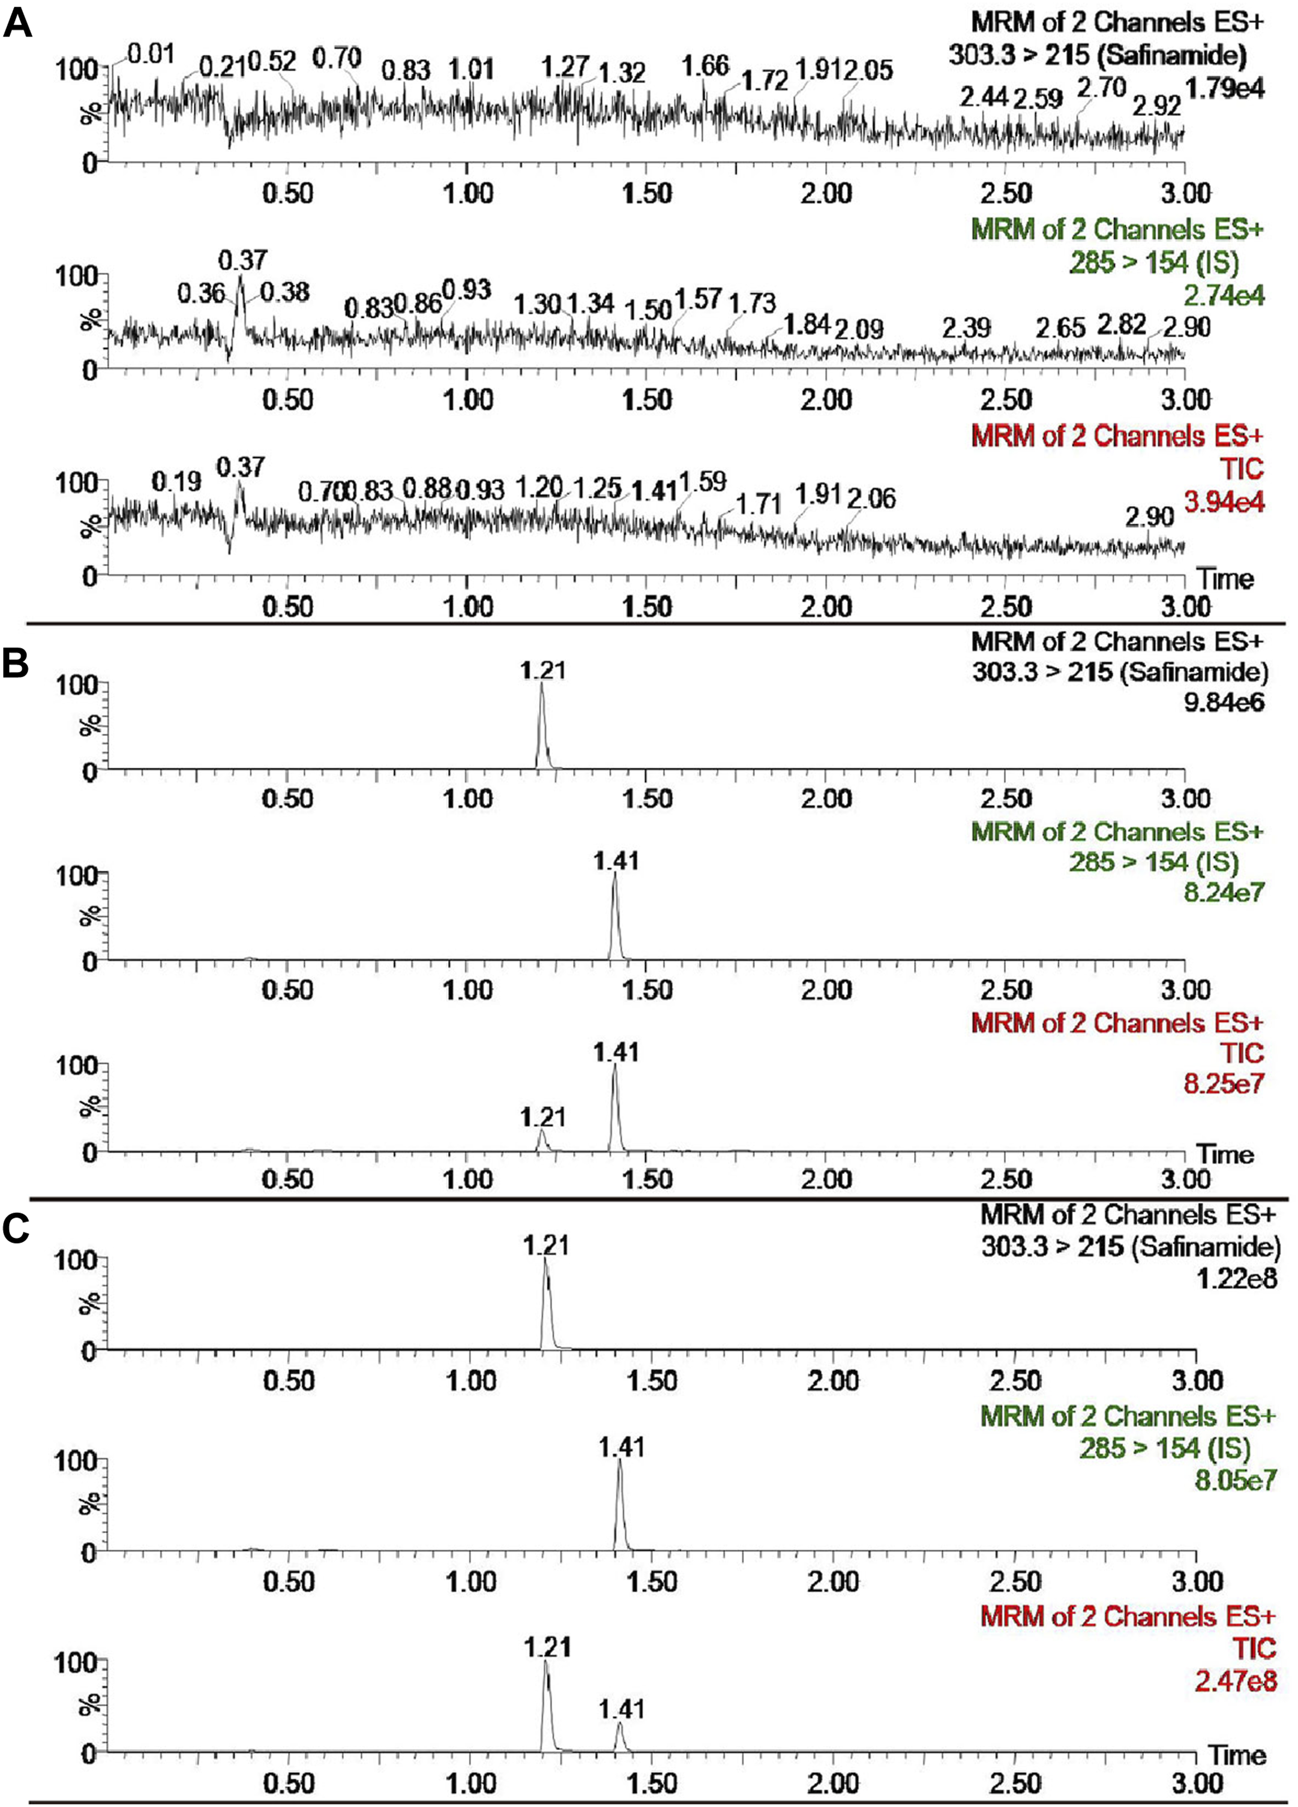
UPLC-MS/MS chromatograms of safinamide and diazepam (IS). (A) blank plasma sample; (B) blank plasma sample spiked with safinamide and IS. (C) real plasma sample from a rat after oral administration of safinamide.
The retention period time of the analyte and IS did not show interfering endogenous substances. At concentrations of 2.0, 800, and 1,600 ng/mL, the matrix effects for safinamide were 99.95 ± 14.02, 108.19 ± 10.19, 98.93% ± 3.21% (n = 6), respectively. No matrix effects exists when the matrix effect = 100, possible matrix enhancement exists when the matrix effect >100, and possible matrix suppression exists when the matrix effect <100. Therefore, the matrix effect of this method had a negligible influence on the current research.
3.3 Calibration curve and sensitivity
The calibration curve of safinamide in rat plasma ranged from 1.0 to 2000 ng/mL. Table 1 summarizes the linearity parameters obtained for safinamide by analyzing the rat plasma calibration curves. The LLOQ of the current UPLC-MS/MS method was 1.0 ng/mL for safinamide. This LLOQ is relatively more sensitive than those obtained in previous methods (20 ng/mL) (Dal Bo et al., 2006; Zhang et al., 2011).
TABLE 1
| Sample Matrix | Calibration range (ng/mL) | Slope | Intercept | r 2 |
|---|---|---|---|---|
| Mean ± SD | Mean ± SD | Mean ± SD | ||
| Rat plasma | 1.0 - 2000 | 0.0536 ± 0.0022 | 0.4884 ± 0.0954 | 0.9958 ± 0.001 |
Calibration curve parameters for safinamide in rat plasma (n = 3).
3.4 Precision, accuracy, and recovery
Blank plasma spiked with safinamide at 2.0, 800, and 1,600 ng/mL was used to assess the precision and accuracy of the entire analytical procedure on the same day or for three consecutive days. At QC levels of 2.0, 800, and 1,600 ng/mL, the intra-day precision was not more than 5.86%, and the inter-day precision was not more than 6.42%. The accuracy of this method ranged from −7.63% to 4.02%. The recoveries of safinamide from rat plasma were better than 92.98%. These results are shown in Table 2. The method was accurate and precise because the values above are within the acceptable ranges.
TABLE 2
| Compound | Concentration (ng/mL) | Intra-day (ng/mL) | Inter-day (ng/mL) | Extraction efficiency (%) |
|---|---|---|---|---|
| Mean ± SD | Mean ± SD | Mean ± SD | ||
| Safinamide | 2.0 | 1.94 ± 0.07 | 1.86 ± 0.12 | 92.98 ± 7.94 |
| 800 | 832.19 ± 48.79 | 801.08 ± 46.93 | 100.29 ± 6.21 | |
| 1,600 | 1,477.96 ± 38.17 | 1,521.92 ± 52.30 | 98.24 ± 2.27 |
The precision, accuracy and extraction efficiency of safinamide in rat plasma (n = 6).
3.5 Stability
Under various storage conditions (room temperature, 4°C, three complete freeze-thaw cycles (−20°C–25°C), and −80°C), the stability results of safinamide were stable in rat plasma. The data showed the following: |RE| ≤ 7.43 after 12 h at room temperature, |RE| ≤ 9.18 after 12 h at 4°C, |RE| ≤ 5.66 after three freeze–thaw-cycles in rat plasma, and |RE| ≤ 12.74 after 28 days storage at −80°C. The established method could be used for further pharmacokinetics studies due to its precision (RSD <15%). These results are summarized in Table 3.
TABLE 3
| Storage conditions | Concentration (ng/mL) | Mean (ng/mL) | RSD (%) | RE (%) |
|---|---|---|---|---|
| Room temperature/12 h | 2.0 | 2.10 | 5.26 | 5.17 |
| 800 | 859.42 | 6.23 | 7.43 | |
| 1,600 | 1,626.98 | 2.57 | 1.69 | |
| 4°C/12 h | 2.0 | 2.01 | 4.49 | 0.59 |
| 800 | 873.46 | 5.56 | 9.18 | |
| 1,600 | 1713.90 | 1.97 | 7.12 | |
| Three complete freeze-thaw cycles (−20°C–25°C) | 2.0 | 2.11 | 14.81 | 5.66 |
| 800 | 841.53 | 9.93 | 5.19 | |
| 1,600 | 1,672.28 | 11.25 | 4.52 | |
| −80°C/28 days | 2.0 | 2.03 | 7.26 | 1.56 |
| 800 | 901.91 | 8.32 | 12.74 | |
| 1,600 | 1772.13 | 9.98 | 10.76 |
Stability of safinamide in rat plasma under various storage conditions (n = 5).
3.6 Application of the method in a pharmacokinetics study
This method could be effectively used to determine the content of safinamide in the plasma of rats after oral administration (10 mg/kg). The mean plasma concentration–time curve and the main pharmacokinetic parameters (non-compartment model analysis) are shown in Figure 3; Table 4, respectively.
FIGURE 3
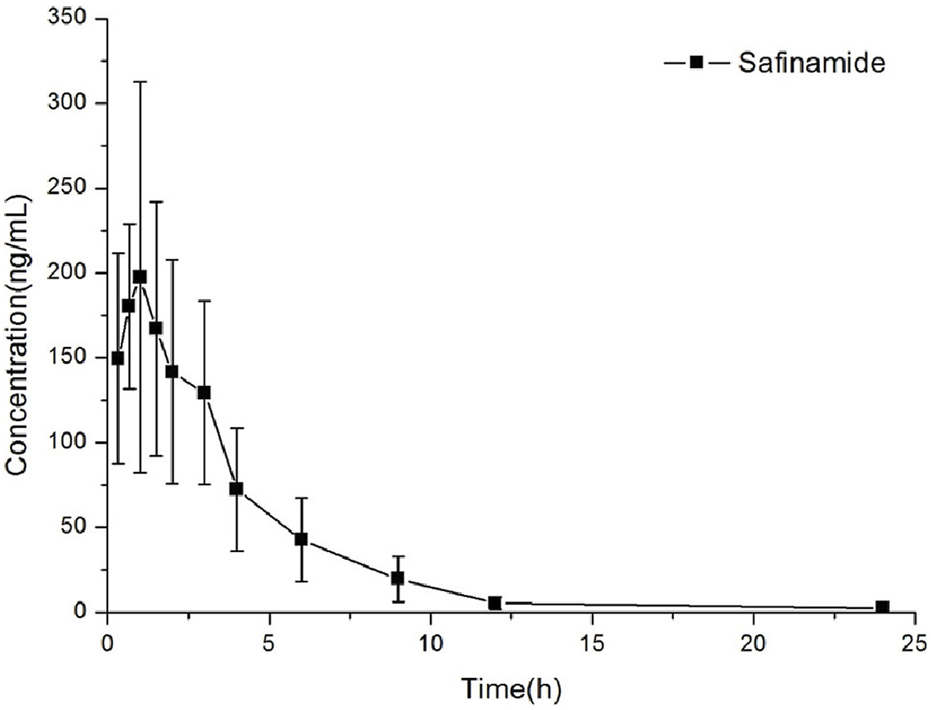
Concentration versus time curves of safinamide in rats after a single oral administration at 10 mg/kg.
TABLE 4
| Parameters | Mean ± SD |
|---|---|
| t1/2 (h) | 1.82 ± 0.38 |
| Cmax (ng/mL) | 256.03 ± 68.99 |
| Tmax (h) | 1.19 ± 0.60 |
| CLz/F (L/h/kg) | 13.37 ± 3.89 |
| AUC0→t (ng/mL•h) | 793.84 ± 227.51 |
| AUC0→∞ (ng/mL•h) | 806.795 ± 234.31 |
The pharmacokinetic parameters of safinamide in rat plasma after oral administration 10 mg/kg.
4 Conclusion
A fast, simple, and novel UPLC-MS/MS method with good linearity in the concentration range of 1.0–2000 ng/mL was developed and successfully used to detect safinamide in rat plasma. Compared to other methods, the current method could meet the requirements of bioavailability studies on safinamide because of its high sensitivity, small sample volume, low injection volume, and short analysis time.
Statements
Data availability statement
The original contributions presented in the study are included in the article/Supplementary material, further inquiries can be directed to the corresponding author.
Ethics statement
The animal studies were approved by The Animal Care and Use Committee of The First Affiliated Hospital of Wenzhou Medical University. The studies were conducted in accordance with the local legislation and institutional requirements. Written informed consent was obtained from the owners for the participation of their animals in this study.
Author contributions
YW: Writing an original draft; Conceptualization; Data curation; Formal analysis; revise; G-AZ: Investigation; Methodology; Resources; Supervision; revise; XL: Visualization; Writing original draft; EZ: Conceptualization; Data curation; Formal analysis; revise; WT: Conceptualization; Data curation; revise; J-QC: Project administration; Resources; Software; Supervision; Writing review and editing; Validation; revise. All authors contributed to the article and approved the submitted version.
Funding
This study was supported by grants from the Public Welfare Technology Research Project of Zhejiang Province (Grant No. LGC22H100002).
Acknowledgments
The authors thank Ren-ai Xu for his advice and assistance.
Conflict of interest
The authors declare that the research was conducted in the absence of any commercial or financial relationships that could be construed as a potential conflict of interest.
Publisher’s note
All claims expressed in this article are solely those of the authors and do not necessarily represent those of their affiliated organizations, or those of the publisher, the editors and the reviewers. Any product that may be evaluated in this article, or claim that may be made by its manufacturer, is not guaranteed or endorsed by the publisher.
References
1
Dal Bo L. Mazzucchelli P. Fibbioli M. Marzo A. (2006). Bioassay of safinamide in biological fluids of humans and various animal species. Arzneimittelforschung56, 814–819. 10.1055/s-0031-1296792
2
Deeks E. D. (2015). Safinamide: first global approval. Drugs75, 705–711. 10.1007/s40265-015-0389-7
3
Desouza R. M. Schapira A. (2017). Safinamide for the treatment of Parkinson's disease. Expert Opin. Pharmacother.18, 937–943. 10.1080/14656566.2017.1329819
4
Di Stefano A. F. Rusca A. (2011). Pressor response to oral tyramine during co-administration with safinamide in healthy volunteers. Naunyn Schmiedeb. Arch. Pharmacol.384, 505–515. 10.1007/s00210-011-0674-2
5
Fariello R. G. Maj R. Marrari P. Beard D. Algate C. Salvati P. (2000). Acute behavioral and EEG effects of NW-1015 on electrically-induced afterdischarge in conscious monkeys. Epilepsy Res.39, 37–46. 10.1016/s0920-1211(99)00103-5
6
Fariello R. G. Mcarthur R. A. Bonsignori A. Cervini M. A. Maj R. Marrari P. et al (1998). Preclinical evaluation of PNU-151774E as a novel anticonvulsant. J. Pharmacol. Exp. Ther.285, 397–403. 10.1021/js970370u
7
Fariello R. G. (2007). Safinamide. Neurotherapeutics4, 110–116. 10.1016/j.nurt.2006.11.011
8
Hattori N. Tsuboi Y. Yamamoto A. Sasagawa Y. Nomoto M. ME2125-3 Study Group (2020). Efficacy and safety of safinamide as an add-on therapy to L-DOPA for patients with Parkinson's disease: a randomized, double-blind, placebo-controlled, phase II/III study. Park. Relat. Disord.75, 17–23. 10.1016/j.parkreldis.2020.04.012
9
Krosser S. Marquet A. Gallemann D. Wolna P. Fauchoux N. Hermann R. et al (2012). Effects of ketoconazole treatment on the pharmacokinetics of safinamide and its plasma metabolites in healthy adult subjects. Biopharm. Drug Dispos.33, 550–559. 10.1002/bdd.1822
10
Leuratti C. Sardina M. Ventura P. Assandri A. Muller M. Brunner M. (2013). Disposition and metabolism of safinamide, a novel drug for Parkinson's disease, in healthy male volunteers. Pharmacology92, 207–216. 10.1159/000354805
11
Maj R. Fariello R. G. Pevarello P. Varasi M. Mcarthur R. A. Salvati P. (1999). Anticonvulsant activity of PNU-151774E in the amygdala kindled model of complex partial seizures. Epilepsia40, 1523–1528. 10.1111/j.1528-1157.1999.tb02035.x
12
Maj R. Fariello R. G. Ukmar G. Varasi M. Pevarello P. Mcarthur R. A. et al (1998). PNU-151774E protects against kainate-induced status epilepticus and hippocampal lesions in the rat. Eur. J. Pharmacol.359, 27–32. 10.1016/s0014-2999(98)00554-8
13
Muller T. (2017). Pharmacokinetic drug evaluation of safinamide mesylate for the treatment of mid-to-late stage Parkinson's disease. Expert Opin. Drug Metab. Toxicol.13, 693–699. 10.1080/17425255.2017.1329418
14
Müller T. (2020). Safinamide in the treatment of Parkinson's disease. Neurodegener. Dis. Manag.10, 195–204. 10.2217/nmt-2020-0017
15
Rinaldi D. Sforza M. Assogna F. Savini C. Salvetti M. Caltagirone C. et al (2021). Safinamide improves executive functions in fluctuating Parkinson's disease patients: an exploratory study. J. Neural Transm. (Vienna)128, 273–277. 10.1007/s00702-020-02259-y
16
Salvati P. Maj R. Caccia C. Cervini M. A. Fornaretto M. G. Lamberti E. et al (1999). Biochemical and electrophysiological studies on the mechanism of action of PNU-151774E, a novel antiepileptic compound. J. Pharmacol. Exp. Ther.288, 1151–1159.
17
Stocchi F. Vacca L. Grassini P. Tomino C. Caminiti G. Casali M. et al (2021). Overnight switch from rasagiline to safinamide in Parkinson's disease patients with motor fluctuations: a tolerability and safety study. Eur. J. Neurol.28, 349–354. 10.1111/ene.14552
18
Tang C. Niu X. Shi L. Zhu H. Lin G. Xu R. (2020). In vivo pharmacokinetic drug-drug interaction studies between fedratinib and antifungal agents based on a newly developed and validated UPLC/MS-MS method. Front. Pharmacol.11, 626897. 10.3389/fphar.2020.626897
19
Teixeira F. G. Gago M. F. Marques P. Moreira P. S. Magalhaes R. Sousa N. et al (2018). Safinamide: a new hope for Parkinson's disease?Drug Discov. Today2018, 736–744. 10.1016/j.drudis.2018.01.033
20
Xu R. Lin Q. Qiu X. Chen J. Shao Y. Hu G. et al (2019). UPLC-MS/MS method for the simultaneous determination of imatinib, voriconazole and their metabolites concentrations in rat plasma. J. Pharm. Biomed. analysis166, 6–12. 10.1016/j.jpba.2018.12.036
21
Zhang K. Xue N. Shi X. Liu W. Meng J. Du Y. (2011). A validated chiral liquid chromatographic method for the enantiomeric separation of safinamide mesilate, a new anti-Parkinson drug. J. Pharm. Biomed. Anal.55, 220–224. 10.1016/j.jpba.2010.12.030
Summary
Keywords
UPLC-MS/MS, rat, safinamide, plasma, pharmacokinetics
Citation
Wang Y, Zhao G-A, Li X, Zhang E, Tan W and Chen J-q (2023) Establishment of a sensitive UPLC-MS/MS method to quantify safinamide in rat plasma. Front. Pharmacol. 14:1211383. doi: 10.3389/fphar.2023.1211383
Received
24 April 2023
Accepted
03 August 2023
Published
28 August 2023
Volume
14 - 2023
Edited by
Massimo Valoti, University of Siena, Italy
Reviewed by
Xiangjun Qiu, Henan University of Science and Technology, China
Yiyan Wang, The Second Affiliated Hospital and Yuying Children’s Hospital of Wenzhou Medical University, China
Updates
Copyright
© 2023 Wang, Zhao, Li, Zhang, Tan and Chen.
This is an open-access article distributed under the terms of the Creative Commons Attribution License (CC BY). The use, distribution or reproduction in other forums is permitted, provided the original author(s) and the copyright owner(s) are credited and that the original publication in this journal is cited, in accordance with accepted academic practice. No use, distribution or reproduction is permitted which does not comply with these terms.
*Correspondence: Jia-qi Chen, chenjiaqi1202@163.com; Wei Tan, 651082@hospital.cqmu.edu.cn
†These authors have contributed equally to this work
Disclaimer
All claims expressed in this article are solely those of the authors and do not necessarily represent those of their affiliated organizations, or those of the publisher, the editors and the reviewers. Any product that may be evaluated in this article or claim that may be made by its manufacturer is not guaranteed or endorsed by the publisher.