- 1School of Chemical, Materials, and Biomedical Engineering, University of Georgia, Athens, GA, United States
- 2Department of Epidemiology and Biostatistics, University of Georgia, Athens, GA, United States
- 3Early Clinical Development, Research and Early Development, Cardiovascular, Renal and Metabolism (CVRM), Biopharmaceuticals, R&D, AstraZeneca, Gothenburg, Sweden
- 4Department of Clinical Pharmacy and Pharmacology, University of Groningen, Groningen, Netherlands
- 5The George Institute for Global Health, Sydney, Australia
- 6Clinical Pharmacology and Quantitative Pharmacology, Clinical Pharmacology and Safety Sciences, R&D, AstraZeneca, Gaithersburg, MD, United States
Introduction: Endothelin-1 (ET-1) regulates renal and vascular function, but the clinical utility of selective ETA receptor antagonists has been limited due to associated fluid retention. The mechanisms underlying fluid retention remain poorly understood but could be a consequence of changes in ET-1 binding to the unantagonized ETB receptor, either through increased ET-1 or non-selective ETB.
Methods: A mathematical model of ET-1 kinetics was developed to quantify effects of ETA antagonist exposure and selectivity on concentrations of ET-1 and its complexes with ETA and ETB receptors. The model describes ET-1 production, tissue and plasma distribution, ETA and ETB receptor binding, and receptor-mediated clearance, and was calibrated and validated with human ET-1 infusion studies.
Results: The model confirmed the significant role of ETB in ET-1 clearance. By varying both drug ETA selectivity (Kib/Kia) and concentration over a wide range, simulations predicted that while selective ETA antagonist (selectivity >1) always decreased [ET1-ETA], the change in [ET1-ETB] was more complex. It increased up to 45% as drug concentrations approached and exceeded Kia, but the increase was diminished as drug concentration increased further and fell below baseline at high concentrations. The drug concentration required to cause a decrease in [ET1-ETB] was lower as ETA selectivity decreased.
Discussion: This is the first mechanistic mathematical model of ET-1 kinetics that describes receptor-mediated clearance, and the consequence of ETB blockade on ET-1 concentrations. It provides a useful tool that can coupled with experimental studies to quantitively understand and investigate this complex and dynamic system.
1 Introduction
Endothelin-1 (ET-1) is an autocrine/paracrine regulator of renal and vascular function, and antagonism of ET-1 effects has been pursued as a therapeutic target for cardiovascular diseases. ET-1 antagonists have proven beneficial in treating pulmonary arterial hypertension (PAH) (Correale et al., 2018), and been shown to reduce proteinuria and potentially improve outcomes in patients with diabetic kidney disease (DKD) (de Zeeuw et al., 2014; Heerspink et al., 2019). However, their utility in treating cardiovascular diseases has been limited by adverse events related to fluid retention (Packer et al., 2017; Waijer et al., 2021).The mechanisms underlying this effect have proven difficult to fully understand, in part because of the complex physiology of the endothelin system.
ET-1 is produced primarily in the kidney and lungs by conversion of its precursor Big-ET through endothelin converting enzyme (ECE) in endothelial cells. It elicits its physiological effects by binding to two receptors: ETA and ETB. It is also cleared by receptor binding, primarily by ETB. Binding to ETA mediates vasoconstriction, while ETB is thought to mediate vasodilation and natriuresis. See Davenport et al. (2016) for a thorough review of endothelin physiology.
Endothelin receptor antagonists vary in their selectivity for ETA and ETB receptors. Inhibiting one receptor can cause ET-1 to increase (since clearance is reduced), and thus may increase binding through the other receptor. Because ETB is largely responsible for ET-1 clearance, ETB inhibition in particular may result in a rise in ET-1 binding to ETA (Kelland et al., 2010).
Fluid retention effects of selective ETA antagonists have been proposed to be related to non-selective inhibition of ETB at high doses (Vercauteren et al., 2017; Battistini et al., 2006) or to incompletely understand the pleiotropic effects of ETA. A better understanding of ET-1 kinetics and dynamics may aid in the identification of optimal dosing of endothelin antagonists that could provide efficacy while minimizing potential risk of adverse effects.
Understanding the physiological response to endothelin antagonists depends on understanding the degree of inhibition and/or activation of each receptor type. In this study, we developed a mechanistic mathematical model of ET-1 kinetics and blockade by selective or non-selective receptor antagonists. We then utilized this model to quantify the effect of endothelin antagonist selectivity on concentrations of ET-1 to the ETA and ETB receptors in the plasma and tissue compartments. This is a first step in developing a more quantitative understanding of the mechanisms underlying clinically observed responses to endothelin antagonism.
2 Methods
2.1 Model description
Figure 1 shows a schematic of the ET-1 kinetics model. Big ET-1, the precursor to ET-1, is assumed to be produced endogenously at a constant rate (ProdBigET), and is converted to ET-1 through the action of endothelin converting enzyme (ECE).
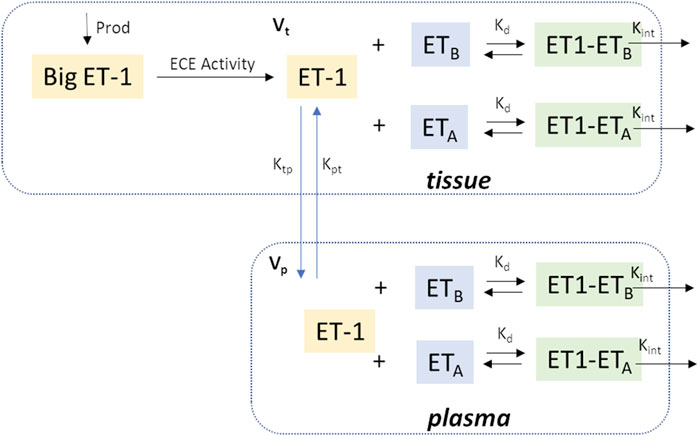
Figure 1. Model Schematic. In brief, Big ET-1 is assumed to be produced at a constant rate; ECE converts Big ET-1 to ET-1 in the tissue compartment; ET-1 is distributed between the tissue and plasma compartments; in each compartment, ET-1 binds to ETA and ETB receptors to form receptor-ligand complexes which are then cleared by internalization. Vp: Central compartment volume; Vt: Tissue compartment volume.
Kcat/Km is the catalytic efficiency of ECE (Schweizer et al., 1997).
ET-1 exhibits saturable, high-affinity binding to ETA and ETB receptors, with similar dissociation constant Kd for both receptor types (Bacon et al., 1996). ET-1 is cleared by binding to and internalization of these receptors, with most of the clearance occurring through ETB. Total ET-1 concentration ([ET1]tot) is the sum of concentrations of unbound ET-1 ([ET1]) and ET-1 bound to the ETA and ETB receptors ([ET1-ETA] and [ET1-ETB],respectively). Because the dissociation constant is similar for both receptors, we lump ETA and ETB receptors together as one receptor concentration [ET1-R] for now. Later, we will revisit this and distinguish between binding to the two receptor types.
Similarly, the total receptor concentration ([R]tot) is the sum of free ETA and ETB receptors concentration ([ETA] and [ETB]), and the ligand-receptor complexes ([ET1-ETA] and [ET1-ETB]):
Receptor binding is assumed to occur several orders of magnitude faster than production, distribution, or internalization, so that equilibrium between binding and dissociation is achieved almost instantaneously, and the ligand, receptor, and ligand-receptor complex are assumed to be in quasi-equilibrium (Mager and Krzyzanski, 2005), so that:
Combining Equations 2–4 gives:
Unbound ET-1 can then be solved from Equation 5 in terms of total ET-1 concentration, total receptor concentrations, and Kd, as expressed in Equation 6.
Combining Equations 2, 4 and rearranging, the receptor-ligand complex concentration [ET1-R] is given by:
Most ET-1 production occurs in the lung and kidney, where the highest concentrations of ECE are found (Hunter et al., 2017). Studies of radiolabeled ET-1 have also shown that ET-1 is rapidly cleared from the circulation and taken up in the lungs, kidneys, and liver (Fukuroda et al., 1994; Parker et al., 1999). Thus, ET-1 kinetics are modeled with 2 compartments–a plasma and a tissue compartment. ET-1 production is assumed to be much larger in the tissue than plasma compartment, so that plasma ET-1 production is negligible. For each compartment, the rate of change of total ET-1 is the net sum of ET1 production (tissue compartment only), distribution, and internalization by receptor binding. Total ET-1 in each compartment (p denotes plasma and t denotes tissue), is given by:
At steady state, [ET1]p is the normal plasma ET-1 concentration ([ET1]p0). There are 7 unknown parameters: the intercompartmental distribution rates Ktp and Kpt, the receptor-ligand internalization rate constant Kint, the receptor concentrations in each compartment [R]tot,t and [R]tot,p, BigET-1 production rate ProdBigET, and the concentration of endothelin converting enzyme [ECE].
Endogenous big-ET production is assumed to be constant, and
The steady-state tissue concentration of ET-1 can be determined from Equation 9 at steady-state:
Then, the total tissue receptor concentration (Equation 12), which is assumed constant, can be determined from Equation 8 at steady-state and Equation 11.
This leaves 5 parameters to be estimated by fitting experimental data.
2.2 Parameter estimation
Unknown model parameters were estimated by simultaneously fitting three different experimental studies. Each study provided important pieces of information for parameter estimation.
Radiolabeled ET-1 clearance study: In Parker et al. (1999), 5 healthy human participants were administered a bolus venous infusion of radiolabeled ET-1 over 5 minutes, and radiolabeled plasma ET-1 was measured at 0, 1, 2, 3, 4, 5, 6, 8, 10, 12, 14, 16, 18, 20, 25, 30, 35, 40, 45, 50, 60, 70, 80, 100, 120, 150, 180, 210 and 240 min after the start of the infusion. This study provided information for constraining intercompartmental distribution and receptor internalization rates. However, the ET-1 dose was unknown and assumed tiny relative to plasma ET-1, so only relative concentrations could be fit.
Infusion of increasing doses of ET-1: In Kaasjager et al. (1997), 6 healthy participants were administered an infusion of ET-1 at increasing infusion rates. Participants received 0.5 ng/kg/min ET-1 for 60 min, followed by 1 ng/kg/min for 60 min, followed by a final 2.0 ng/kg/min for 60 min. Plasma ET-1 was measured before infusion and at 75, 125, and 225 min after the start of the infusion. This study provided further information for constraining intercompartmental distribution and receptor internalization rates, and also provided information for constraining receptor concentration and compartment volumes.
Infusion of Big ET-1: In Hunter et al. (2017), 10 healthy human participants were administered an infusion of Big-ET at increasing infusion rates. Participants received 0.75 pmol/min for 30 min, followed by 15 pmol/min for 30 min, followed by 300 pmol/min for another 30 min. Plasma ET-1 was measured at baseline and at 30-min intervals through 150 min. This study provided information for quantifying ECE concentration, and further information for constraining intercompartmental distribution rates, volumes, and receptor concentration.
Fitting these three studies simultaneously provided sufficient information to estimate all model parameters. The study protocol for each study was simulated. Parameters were estimated by minimizing the least square error between the observed and model-predicted plasma ET-1 concentrations.
2.3 Distinguishing ETA and ETB binding and internalization
After estimating model parameters with lumped ETA and ETB, we then separated out the contributions of ET1A and ET1B.
Let fB be the fraction of total receptors that are ETB receptors. Then the fraction of total receptors that are ETA receptors, fA, is 1 – fB.
Then, the concentration of each receptor (in the absence of an inhibitor) can be determined, as given in Equations 13, 14:
And concentration of the bound complex can then be expressed as Equations 15, 16:
The relative expression of ETA and ETB receptors differ across tissues. The density of ETA is much higher than ETB in resistance vessels. In the lung, which is the tissue with the highest overall receptor concentration, the fraction of ETB is around 40%, while in the kidney it is around 70%–80% (Davenport et al., 2016; Kuc et al., 1995). Thus, we allow fB to be estimated separately for tissue and plasma compartments.
Equations 8, 9 can be rewritten to Equations 17, 18 as:
2.4 Modeling competitive ETA and ETB inhibition
Endothelin antagonists are competitive inhibitors with varying degrees of selectivity for ETA or ETB receptors. Let [I] be the concentration of a competitive endothelin antagonist, with an affinity Kia for ETA receptors and Kib for ETB receptors. The concentration of the ligand-receptor complex in the presence of an antagonist can be expressed as Equations 19, 20 (see Supplementary Material for derivation):
It can further be shown that the concentrations of free ETA and ETB receptors are:
Substituting Equations 21, 22 into Equation 2 gives ET1tot, as expressed in Equation 23.
With some additional algebra, the concentration of free [ET1] can be obtained by solving the resulting third order polynomial for [ET1] (see Supplementary Material for full derivation).
2.5 Validation
To validate the model, a separate experimental study, not used in model calibration, was simulated and compared with study results.
Validation Dataset: ETA or ETB inhibition followed by ET-1 infusion: In Bohm et al. (2003), 6 healthy, male participants were studied on 3 different days separated by at least 1 week. Participants were infused with either 0.9% saline (for 15 min), the ETA inhibitor BQ123 (2.5–5 nmol/kg/min for 50 min), or the ETB inhibitor BQ788 (4 nmol/kg/min for 15 min). After 30 min, participants were also infused with ET-1 (4 pmol/kg/min) for 20 min. Plasma ET-1 was measured at 0, 15, 30, 40, and 50 min.
To model this study, binding affinities and selectivity of the selective ETA antagonist BQ123 and selective ETB antagonist BQ788 were set to previously reported values in human tissue (BQ123: Kia = 0.78 nM, Kib = 24.3 μM (Peter and Davenport, 1996); BQ788: Kia = 1 μM, Kib = 9.8 nM (Russell and Davenport, 1996)).
2.6 Sensitivity analysis
To evaluate which parameters contribute most to the uncertainty in the model output, we computed the Sobol indices using the sensobol package in R (Puy et al., 2022), a form of global sensitivity analysis (IM SJMMCE, 1993). Assuming mutual independence among the input parameters, the variance of the output is decomposed into fractions which can be attributed either to a single input parameter (first order Sobol indices) or to a set of parameters (higher order Sobol indices). The total-order index Ti measures the first-order effect of a parameter jointly with its interactions with all the parameters (Homma and Saltelli, 1996).
2.7 Model implementation
The model was implemented in R v4.1.2 using the RxODE package (Wang et al., 2016). Optimization was performed using the L-BFGS-B method in the optim package. Model code is available at https://bitbucket.org/cardiorenalmodel/endothelin-kinetics.
3 Results and discussion
3.1 Model calibration
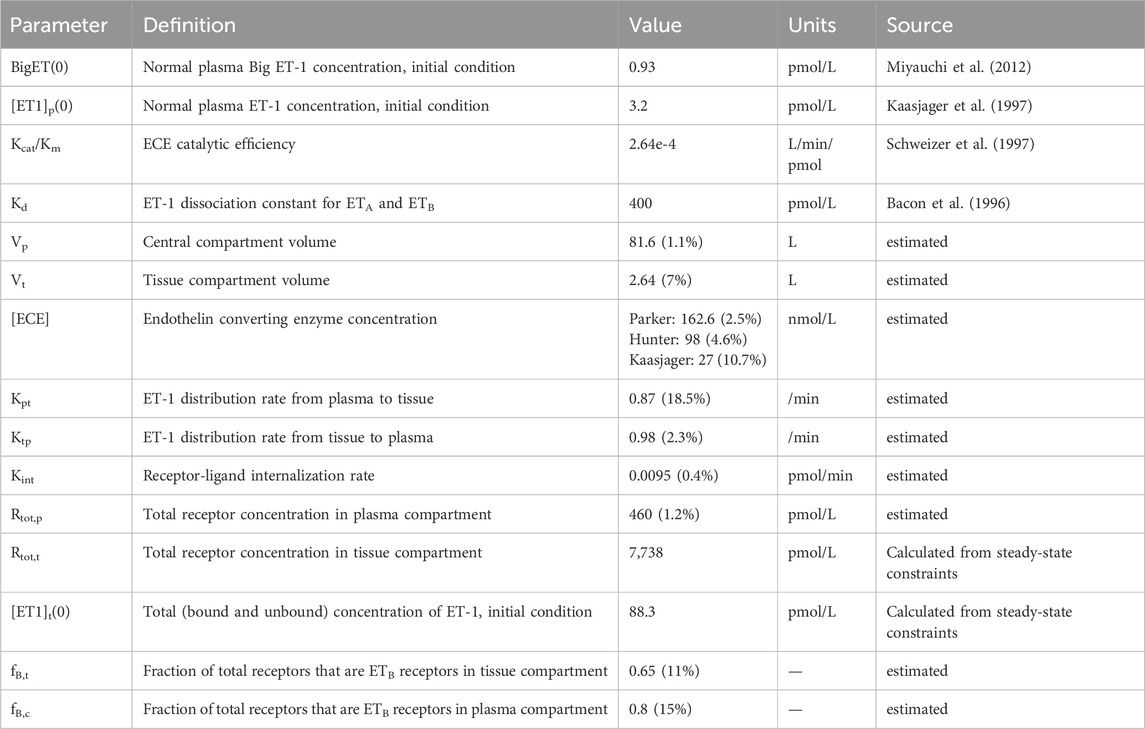
As shown in Figure 2, the calibrated model reasonably reproduced the observed magnitude and time-course of changes in ET-1 following an ET-1 bolus (Figure 2A), increasing rates of Big ET-1 infusion (Figure 2B), or increasing rates of ET-1 infusion (Figure 2C). Estimated parameter values are given in Table 1. In order to simultaneously fit all three studies, it was necessary to allow [ECE] to vary for each study. For all other estimated parameters, the same estimated values allowed the model to reasonably fit all studies simultaneously. Simultaneously fitting all studies did require some trade-off in fit: each study could be fit more precisely if parameters were estimated separately for each study. However, the simultaneously fit parameters are more useful than study-specific parameters in providing a general model of ET-1 kinetics, and thus these parameters were used for the rest of this analysis.
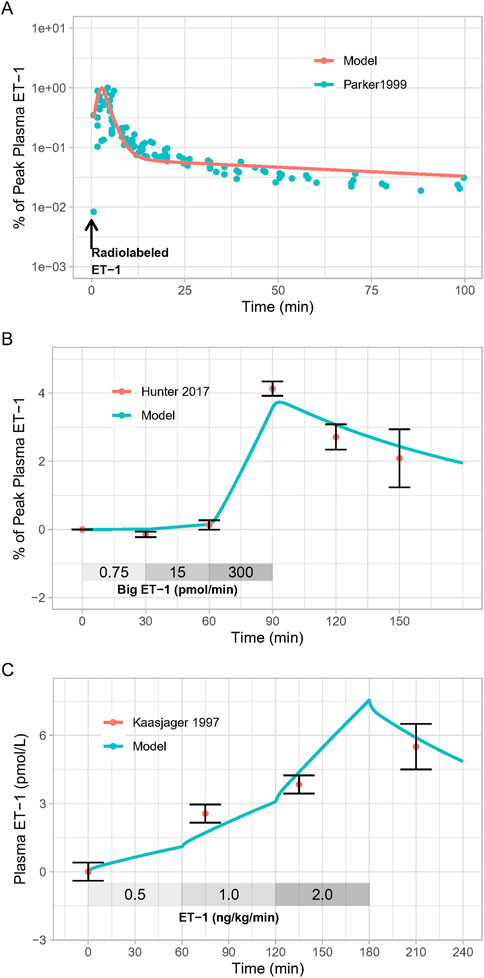
Figure 2. Model Calibration: Model parameters were estimated by fitting: (A), the response to radiolabeled ET-1 bolus (Parker et al., 1999); (B), increasing doses of Big ET-1 infusion (Hunter et al., 2017); (C), increasing doses of ET-1 infusion (Kaasjager et al., 1997).
3.2 Model Validation
The calibrated model was able to reproduce the changes in plasma ET-1 observed by Bohm et al. (2003) (Figure 3A). First, the model reproduced the change in plasma ET-1 during ET-1 infusion in the placebo arm, demonstrating that the ET-1 model can predict ET-1 kinetics in a new experiment. Secondly, the model reproduced the augmented rises in ET-1 with selective ETA or ETB antagonist, resulting from reduced clearance when the receptors are inhibited. Consistent with the experimental data, the rise in ET-1 with ETB antagonism was much greater than with ETA antagonism, indicating that the model recapitulates the dominant role of ETB in ET-1 clearance.
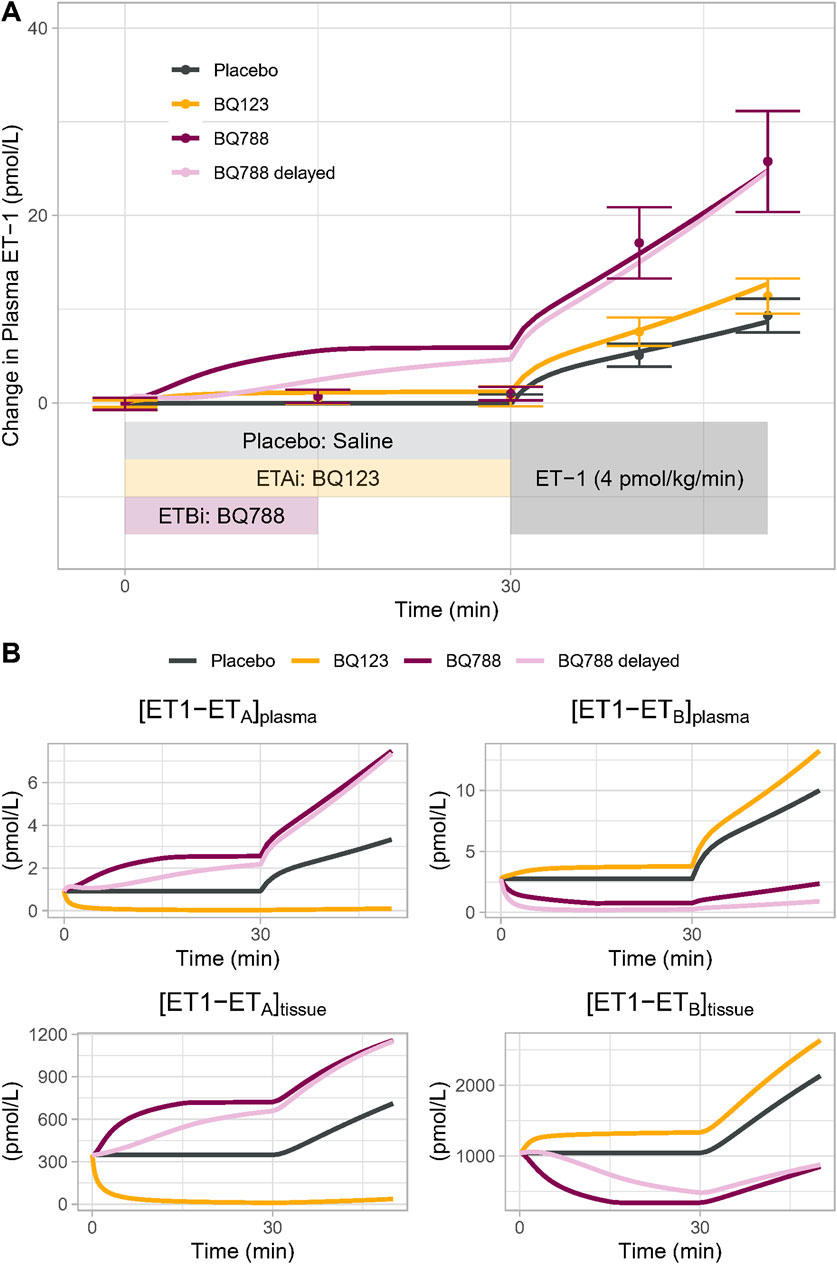
Figure 3. (A) Model Validation: The calibrated model reproduced experimentally observed changes in plasma ET-1 observed by Bohm et al. (2003) in response to placebo, BQ123 (ETA antagonist 4 nmol/kg/min for 50 min), or BQ788 (ETB antagonist 4 nmol/kg/min for 15 min) followed by ET-1 infusion. Speed of rise in plasma ET-1 with BQ788 is overpredicted; assuming a delay between plasma drug concentration and tissue inhibitory effect on ETB (light purple) more closely reproduces the data (B) Model-predicted changes in the physiologically active bound complexes of ET1 to ETA or ETB in the plasma and tissue compartments.
For ETB antagonism, the model did overpredict the increase in ET-1 during the period of ETB antagonism alone, prior to the start of ET-1 infusion. While Bohm et al. reported no change in ET-1 during this period, other studies have found that ET-1 does increase with similar doses of BQ788 (Okada and Nishikibe, 2002; Strachan et al., 1999), but this increase is delayed. This could be due to a delay in BQ788 reaching ETB in peripheral tissues. When a pharmacodynamic delay was introduced, the model came closer to reproducing the observed ET-1 changes. Because other studies have noted a rise in ET-1 with BQ788, we did not want to overfit the model to this single datapoint in this single study, and thus no further changes were made to force fit this point.
3.3 Simulations
3.3.1 Effect of selective ET receptor antagonism on non-antagonized receptor complex
Changes in ETB activation with selective ETA antagonists have been proposed as a mechanism for fluid retention with ETA receptor antagonists. On one hand, inhibition of ETB at high doses of selective ETA receptor antagonists has been proposed to cause fluid retention by blocking natriuretic/diuretic effects of ETB (Battistini et al., 2006; Baltatu et al., 2012). On the other hand, activation of ETB receptors as a consequence of elevated ET-1 with ETA antagonism has been proposed to increase vascular permeability and redistribute plasma volume, resulting in edema (Vercauteren et al., 2017). A first step in understanding these possible mechanisms is to quantify how the concentration of a selective antagonist affects plasma ET-1 and the formation of bound complex with the non-antagonized receptor.
We first simulated a perfectly selective ETA antagonist by setting Kia to 1 and Kib to 1020 (to approximate zero ETB antagonism). The drug concentration was then varied from 0.001 to 1,000X Kia, and steady-state changes in the bound complexes [ET1-ETA] and [ET1-ETB] were determined in the plasma and tissue compartments. This was repeated for a perfectly selective ETB antagonist, with Kia set to 1020 (to approximate zero ETA antagonism)and Kib set to 1, and drug concentration varied from 0.001 to 100,000X Kib.
As shown in Figure 4A, as the concentration of a selective ETA antagonist was increased relative to Kia, the formation of bound complex [ET1-ETB] increased up to 33% and 45% in the tissue and plasma compartments, respectively, as bound complex [ET1-ETA] suppression approached 100%. For selective ETB antagonism (Figure 4B), as the concentration was increased relative to Kib, the rise in ET1-ETA complex was quite large, increasing to more than 200% and 500% in the tissue and plasma compartments, respectively, as bound complex [ET1-ETB] suppression approached 100%.
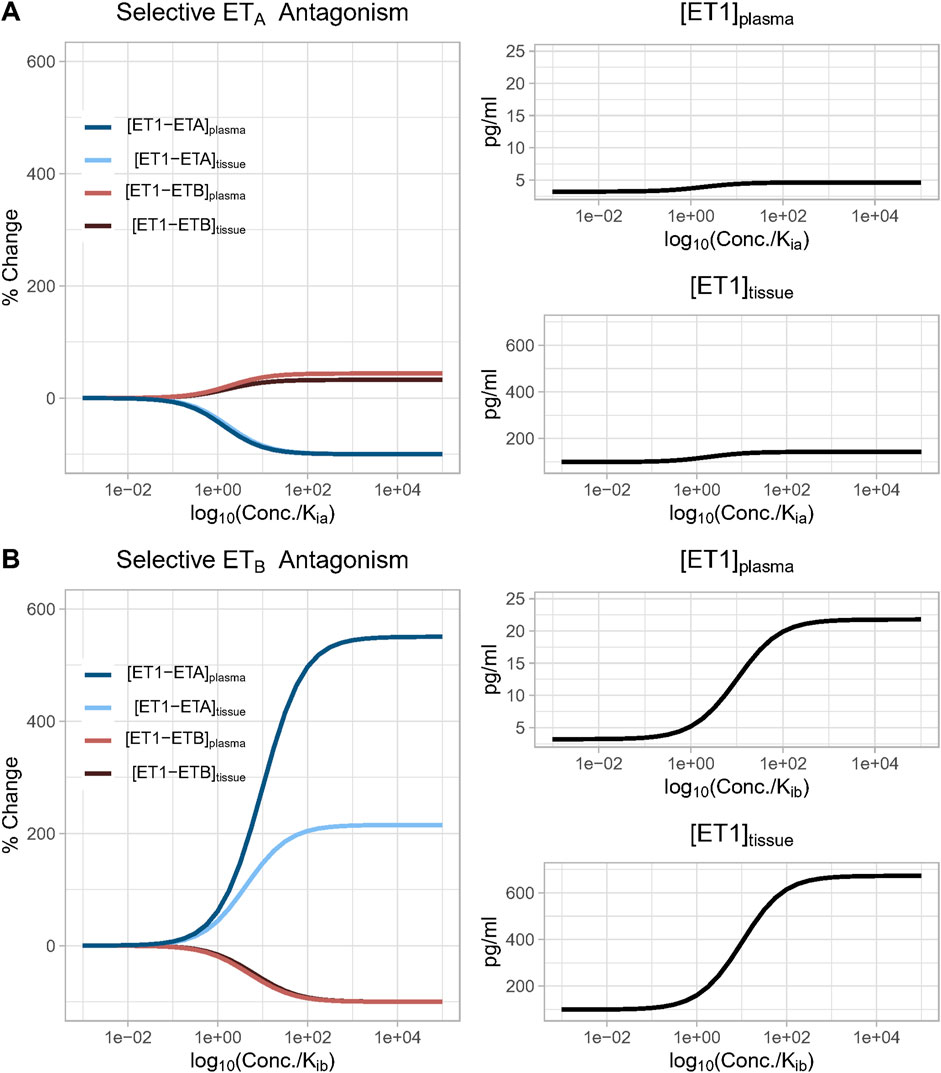
Figure 4. (A) Effect of increasing concentration of a perfectly selective ETA antagonist. Simulation predicts that as the concentration of a selective ETA antagonist increases, the formation of bound complex [ET1-ETB] increases up to 33% and 45% in the tissue and plasma compartments, respectively, as bound complex [ET1-ETA] suppression approaches 100%; (B) Effect of increasing concentration of a perfectly selective ETB antagonist. Simulation predicts that as the concentration of a selective ETB antagonist increases, the formation of bound complex [ET1-ETA] increases more than 200% and 500% in the tissue and plasma compartments, respectively, as bound complex [ET1-ETB] suppression approaches 100%.
In both cases, the rise in the complex of ET-1 with the non-inhibited receptor occurred due to a compensatory rise in ET-1 concentration, since inhibiting either receptor reduced ET-1 clearance. Since ETB is responsible for a larger portion of ET-1 clearance than ETA, the rise in ET-1 with ETB antagonism was much larger than with ETA antagonism. Consequently, the rise in [ET1-ETA] with ETB antagonism was also much larger than the rise in ET1-ETB with ETA antagonism.
If there were no change in ET-1 concentration, it would be expected that when the drug concentration equals Ki (when log10(conc/Ki) = 1), the complex of ET-1 with the antagonized receptor would be reduced 50%. However, in both cases, the concentration required to produce a 50% reduction was shifted higher as a result of the rise in ET-1 concentration (See Equations 19, 20). This shift was much larger with ETB antagonism, due to the larger rise in ET-1.
Sobol sensitivity analysis indicated that the uncertainty in predicted changes in ET1-ETA or ET1-ETB was nearly completely due to the choice of fB–fraction of total receptors that are ETB receptors. To explore the effect of fB on the model predictions, we repeated the simulations above when fB is set to 0.5 (a scenario of equal concentrations of ETA and ETB receptors, and thus equal clearance through each receptor–inconsistent with (Bohm et al., 2003) and other studies (Fukuroda et al., 1994; Dupuis et al., 1996)), or to 0.999 (a scenario in which ET receptors are 99.9% ETB and 0.1% ETA). In the first case, the rise in the non-antagonized receptor complex was equal for selective ETA and ETB antagonists (i.e., ET1-ETB rise with ETA antagonism was the same as ET1-ETA rise with ETB antagonism). The ET-1 concentration also rose equally. At the other extreme, when fB is set to 0.999, there was no change in ET1-ETB with ETA antagonism, but ET1-ETA increased more than 2000-fold with ETB antagonism. However, in all cases, the shape of the curves, and thus the dependency on Ki and concentration, remained the same. Only the magnitudes changed (Supplementary Figures S1, S2).
3.3.2 Effect of antagonist selectivity on non-antagonized receptor complex
We then investigated the effect of antagonist receptor selectivity by varying both drug ETA selectivity (Kib/Kia) and drug concentration over a wide range. In Figure 5, all concentrations are plotted relative to Kia for consistency. [ET-1] increased with increasing concentrations for all selectivity values, but the higher the selectivity for ETA, the higher the drug concentration (relative to Kia) required to increase ET-1 (Figures 5A, B). Trends were the same but concentrations were much higher in the tissue compared to plasma.
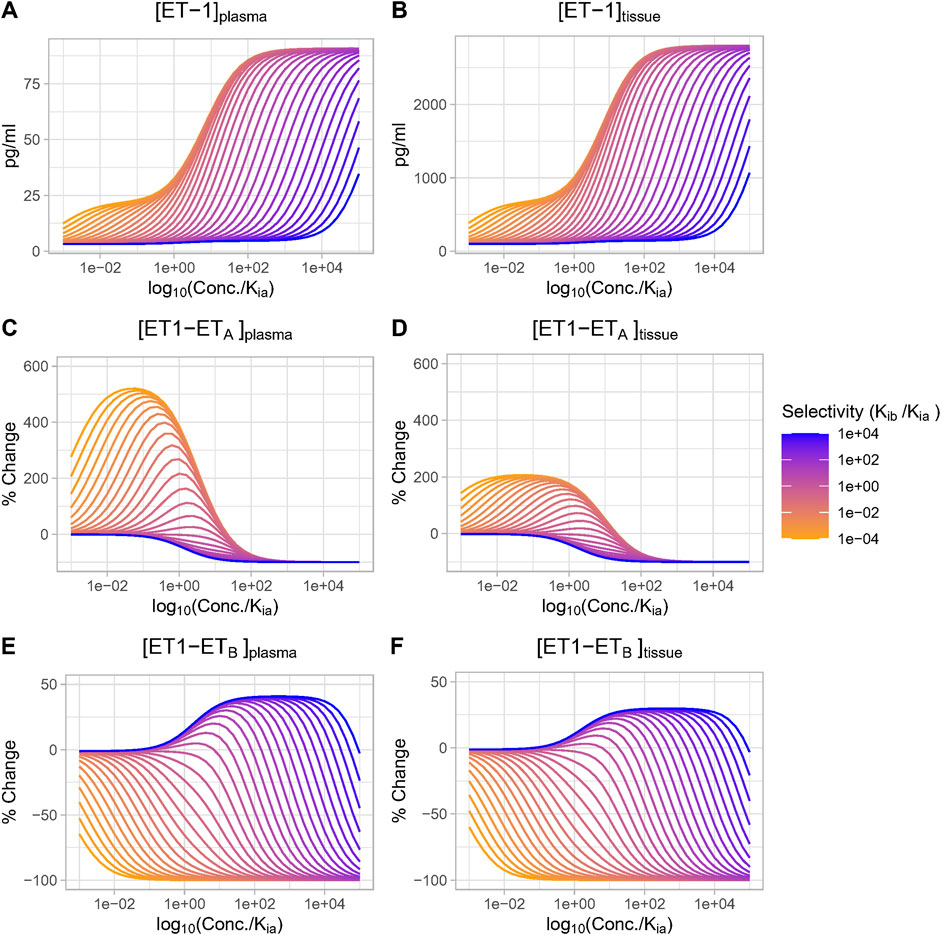
Figure 5. Effect of antagonist selectivity on plasma and tissue changes in ET-1 (A, B), ETA activation by ET-1 (C, D), ETB activation by ET-1 (E, F). ETA antagonism: selectivity >1, ETB antagonism: selectivity <1.
The complex [ET1-ETA] always decreased with increasing concentration of selective ETA antagonist (selectivity >1). For ETB selective antagonism (selectivity <1), [ET1-ETA] was non-monotonic–for concentrations well below Kia, it increased, and increased faster with increasing. However, as concentrations approached and exceeded Kia (and thus also far exceeded Kib), the rise in [ET1-ETA] began to become smaller, and [ET1-ETA] eventually began to decrease at concentrations well above Kia (Figures 5C, D).
The complex [ET1-ETB] always decreased with increasing concentrations of ETB-selective antagonists (selectivity <1). Interestingly, though, for ETA-selective antagonists, the rise in [ET1-ETB] was minimal at concentrations less than 0.1X Kia, then became larger as concentrations approached and exceeded Kia. After reaching a maximum increase of around 45% (plasma) or 33% (tissue), further increases in concentration did not further increase [ET1-ETB]. Instead, as concentrations rose further, [ET1-ETB] began to fall and quickly became negative. The concentration required to cause a decrease in [ET1-ETB] was higher as selectivity increased (Figures 5E, F).
Thus, depending on the concentration, ETA antagonists can increase (at low concentrations) or decrease (at high concentrations) the activation of ETB. The higher the selectivity for ETA, the higher the concentration required to cause ETB to decrease.
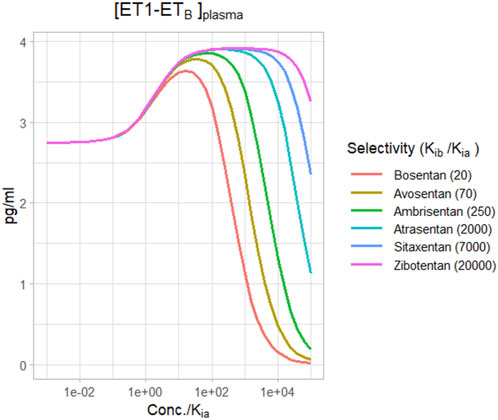
Figure 6 shows the change in plasma [ET1-ETB] for different selective ETA antagonists, based on their reported selectivities (Davenport et al., 2016). For a relatively non-selective antagonist like bosentan, [ET1-ETB] rise did not quite reach the maximum before falling, and became negative at concentrations around 100X Kia. However, for more selective ETA antagonists, the rise in [ET1-ETB] tended to max out as concentrations rose. There was no difference in the maximum rise between ambrisentan, atrasentan, sitaxentan, and zibotentan. However, while ambrisentan causes [ET1-ETB] to become negative at concentrations around 1,000x Kia, [ET1-ETB] remained positive with zibotentan for concentrations up to 100,000xKia.
Several limitations should be noted. Receptor concentrations of ETA and ETB vary across tissues and across species. This analysis assumed a constant relative concentration of receptors, but this could vary by tissue. Receptor concentration may also change due to compensatory upregulation or downregulation due to antagonism, and this was not considered. Nearly all of the experimental data used to develop the model was collected in males, and there are likely sex differences that could impact the model’s predictiveness in females. Endogenous ET-1 production was assumed constant, but in reality its secretion changes in response to physiological signals.
4 Conclusion
This is the first mechanistic mathematical model of ET-1 kinetics that describes receptor-mediated clearance, and the consequence of ETB blockade on ET-1 concentrations. It provides a useful tool that can coupled with experimental studies to quantitively understand and investigate this complex and dynamic system. This analysis quantifies effect of ETA antagonists on ETB activation, but does not describe the physiological consequences of changes in ETA and ETB binding. This is addressed in our sister paper.
Data availability statement
Publicly available datasets were analyzed in this study. This data can be found here: https://bitbucket.org/cardiorenalmodel/endothelin-kinetics.
Author contributions
KH: Conceptualization, Formal Analysis, Methodology, Project administration, Software, Supervision, Validation, Writing–original draft. PG: Conceptualization, Investigation, Supervision, Writing–review and editing. HH: Conceptualization, Supervision, Writing–review and editing. HY: Conceptualization, Formal Analysis, Methodology, Software, Validation, Visualization, Writing–original draft.
Funding
The author(s) declare financial support was received for the research, authorship, and/or publication of this article.
Conflict of interest
KH has received research funding from AstraZeneca and Eli Lilly in the last 3 years. HY and PG are employees of AstraZeneca and own AstraZeneca stock or stock options. HH is a consultant for and received honoraria from AbbVie, Astellas, Astra Zeneca, Boehringer Ingelheim, Fresenius, Janssen and Merck; he has a policy that all honoraria are paid to his employer.
This study received funding from AstraZeneca Pharmaceuticals. The funder had the following involvement in the study: interpretation of results and writing of the manuscript.
Publisher’s note
All claims expressed in this article are solely those of the authors and do not necessarily represent those of their affiliated organizations, or those of the publisher, the editors and the reviewers. Any product that may be evaluated in this article, or claim that may be made by its manufacturer, is not guaranteed or endorsed by the publisher.
Supplementary material
The Supplementary Material for this article can be found online at: https://www.frontiersin.org/articles/10.3389/fphar.2024.1332388/full#supplementary-material
References
Bacon, C. R., Cary, N. R. B., and Davenport, A. P. (1996). Endothelin peptide and receptors in human atherosclerotic coronary artery and aorta. Circulation Res. 79 (4), 794–801. doi:10.1161/01.res.79.4.794
Baltatu, O. C., Iliescu, R., Zaugg, C. E., Reckelhoff, J. F., Louie, P., Schumacher, C., et al. (2012). Antidiuretic effects of the endothelin receptor antagonist avosentan. Front. physiology 3, 103. doi:10.3389/fphys.2012.00103
Battistini, B., Berthiaume, N., Kelland, N. F., Webb, D. J., and Kohan, D. E. (2006). Profile of past and current clinical trials involving endothelin receptor antagonists: the novel “-sentan” class of drug. Exp. Biol. Med. (Maywood, NJ) 231 (6), 653–695. doi:10.3181/00379727-231-2310653
Bohm, F., Pernow, J., Lindstrom, J., and Ahlborg, G. (2003). ETA receptors mediate vasoconstriction, whereas ETB receptors clear endothelin-1 in the splanchnic and renal circulation of healthy men. Clin. Sci. (Lond). 104 (2), 143–151. doi:10.1042/CS20020192
Correale, M., Ferraretti, A., Monaco, I., Grazioli, D., Di Biase, M., and Brunetti, N. D. (2018). Endothelin-receptor antagonists in the management of pulmonary arterial hypertension: where do we stand? Vasc. Health Risk Manag. 14, 253–264. doi:10.2147/VHRM.S133921
Davenport, A. P., Hyndman, K. A., Dhaun, N., Southan, C., Kohan, D. E., Pollock, J. S., et al. (2016). Endothelin. Pharmacol. Rev. 68 (2), 357–418. doi:10.1124/pr.115.011833
de Zeeuw, D., Coll, B., Andress, D., Brennan, J. J., Tang, H., Houser, M., et al. (2014). The endothelin antagonist atrasentan lowers residual albuminuria in patients with type 2 diabetic nephropathy. J. Am. Soc. Nephrol. 25 (5), 1083–1093. doi:10.1681/ASN.2013080830
Dupuis, J., Goresky, C. A., and Fournier, A. (1996). Pulmonary clearance of circulating endothelin-1 in dogs in vivo: exclusive role of ETB receptors. J. Appl. physiology (Bethesda, Md 1985) 81 (4), 1510–1515. doi:10.1152/jappl.1996.81.4.1510
Fukuroda, T., Fujikawa, T., Ozaki, S., Ishikawa, K., Yano, M., and Nishikibe, M. (1994). Clearance of circulating endothelin-1 by ETB receptors in rats. Biochem. Biophys. Res. Commun. 199 (3), 1461–1465. doi:10.1006/bbrc.1994.1395
Heerspink, H. J. L., Parving, H. H., Andress, D. L., Bakris, G., Correa-Rotter, R., Hou, F. F., et al. (2019). Atrasentan and renal events in patients with type 2 diabetes and chronic kidney disease (SONAR): a double-blind, randomised, placebo-controlled trial. Lancet London, Engl. 393 (10184), 1937–1947. doi:10.1016/S0140-6736(19)30772-X
Homma, T., and Saltelli, A. (1996). Importance measures in global sensitivity analysis of nonlinear models. Reliab. Eng. and Syst. Saf. 52 (1), 1–17. doi:10.1016/0951-8320(96)00002-6
Hunter, R. W., Moorhouse, R., Farrah, T. E., MacIntyre, I. M., Asai, T., Gallacher, P. J., et al. (2017). First-in-Man demonstration of direct endothelin-mediated natriuresis and diuresis. Hypertens. (Dallas, Tex 1979) 70 (1), 192–200. doi:10.1161/HYPERTENSIONAHA.116.08832
Kaasjager, K. A., Shaw, S., Koomans, H. A., and Rabelink, T. J. (1997). Role of endothelin receptor subtypes in the systemic and renal responses to endothelin-1 in humans. J. Am. Soc. Nephrol. 8 (1), 32–39. doi:10.1681/ASN.V8132
Kelland, N. F., Kuc, R. E., McLean, D. L., Azfer, A., Bagnall, A. J., Gray, G. A., et al. (2010). Endothelial cell-specific ETB receptor knockout: autoradiographic and histological characterisation and crucial role in the clearance of endothelin-1. Can. J. physiology Pharmacol. 88 (6), 644–651. doi:10.1139/Y10-041
Kuc, R. E., Karet, F. E., and Davenport, A. P. (1995). Characterization of peptide and nonpeptide antagonists in human kidney. J. Cardiovasc Pharmacol. 26 (Suppl. 3), S373–S375. doi:10.1097/00005344-199506263-00111
Mager, D. E., and Krzyzanski, W. (2005). Quasi-equilibrium pharmacokinetic model for drugs exhibiting target-mediated drug disposition. Pharm. Res. 22 (10), 1589–1596. doi:10.1007/s11095-005-6650-0
Miyauchi, Y., Sakai, S., Maeda, S., Shimojo, N., Watanabe, S., Honma, S., et al. (2012). Increased plasma levels of big-endothelin-2 and big-endothelin-3 in patients with end-stage renal disease. Life Sci. 91 (13), 729–732. doi:10.1016/j.lfs.2012.08.008
Okada, M., and Nishikibe, M. (2002). BQ-788, A selective endothelin ETB receptor antagonist. Cardiovasc. Drug Rev. 20 (1), 53–66. doi:10.1111/j.1527-3466.2002.tb00082.x
Packer, M., McMurray, J. J. V., Krum, H., Kiowski, W., Massie, B. M., Caspi, A., et al. (2017). Long-term effect of endothelin receptor antagonism with bosentan on the morbidity and mortality of patients with severe chronic heart failure: primary results of the ENABLE trials. JACC Heart Fail. 5 (5), 317–326. doi:10.1016/j.jchf.2017.02.021
Parker, J. D., Thiessen, J. J., Reilly, R., Tong, J. H., Stewart, D. J., and Pandey, A. S. (1999). Human endothelin-1 clearance kinetics revealed by a radiotracer technique. J. Pharmacol. Exp. Ther. 289 (1), 261–265.
Peter, M. G., and Davenport, A. P. (1996). Characterization of the endothelin receptor selective agonist, BQ3020 and antagonists BQ123, FR139317, BQ788, 50235, Ro462005 and bosentan in the heart. Br. J. Pharmacol. 117 (3), 455–462. doi:10.1111/j.1476-5381.1996.tb15212.x
Puy, A., Lo, P. S., Saltelli, A., and Levin, S. A. (2022). Sensobol: an R package to compute variance-based sensitivity indices. J. Stat. Softw. 102 (5), 1–37. doi:10.18637/jss.v102.i05
Russell, F. D., and Davenport, A. P. (1996). Characterization of the binding of endothelin ETB selective ligands in human and rat heart. Br. J. Pharmacol. 119 (4), 631–636. doi:10.1111/j.1476-5381.1996.tb15720.x
Schweizer, A., Valdenaire, O., Nelböck, P., Deuschle, U., Dumas Milne Edwards, J. B., Stumpf, J. G., et al. (1997). Human endothelin-converting enzyme (ECE-1): three isoforms with distinct subcellular localizations. Biochem. J. 328 (Pt 3), 871–877. doi:10.1042/bj3280871
Strachan, F. E., Spratt, J. C., Wilkinson, I. B., Johnston, N. R., Gray, G. A., and Webb, D. J. (1999). Systemic blockade of the endothelin-B receptor increases peripheral vascular resistance in healthy men. 33(1):581–585. doi:10.1161/01.hyp.33.1.581
Vercauteren, M., Trensz, F., Pasquali, A., Cattaneo, C., Strasser, D. S., Hess, P., et al. (2017). Endothelin ETA receptor blockade, by activating ETB receptors. Increases Vasc. Permeability Induces Exaggerated Fluid Retent. 361 (2), 322–333. doi:10.1124/jpet.116.234930
Waijer, S. W., Gansevoort, R. T., Bakris, G. L., Correa-Rotter, R., Hou, F.-F., Kohan, D. E., et al. (2021). The effect of atrasentan on kidney and heart failure outcomes by baseline albuminuria and kidney function: A: post hoc: analysis of the SONAR randomized trial. Clin. J. Am. Soc. Nephrol. 16 (12), 1824–1832. doi:10.2215/CJN.07340521
Keywords: endothelin, endothelin receptor antagonist, mathematical modeling, kinetics, ETA, ETB
Citation: Hallow KM, Greasley PJ, Heerspink HJL and Yu H (2024) Kinetics of endothelin-1 and effect selective ETA antagonism on ETB activation: a mathematical modeling analysis. Front. Pharmacol. 15:1332388. doi: 10.3389/fphar.2024.1332388
Received: 02 November 2023; Accepted: 28 October 2024;
Published: 26 November 2024.
Edited by:
Eliot Ohlstein, Drexel University School of Medicine, United StatesReviewed by:
Duuamene Nyimanu, University of Kansas Medical Center, United StatesKaty Sanchez-Pozos, Hospital Juárez de México, Mexico
Copyright © 2024 Hallow, Greasley, Heerspink and Yu. This is an open-access article distributed under the terms of the Creative Commons Attribution License (CC BY). The use, distribution or reproduction in other forums is permitted, provided the original author(s) and the copyright owner(s) are credited and that the original publication in this journal is cited, in accordance with accepted academic practice. No use, distribution or reproduction is permitted which does not comply with these terms.
*Correspondence: K. Melissa Hallow, aGFsbG93a21AdWdhLmVkdQ==
 K. Melissa Hallow
 Peter J. Greasley3
 Hiddo J. L. Heerspink
 Hongtao Yu