 Jinping Zeng1†
 Min Zhang
 Jun Yang
 Yinyin Wu
- 1Department of Epidemiology and Health Statistics, School of Public Health, Hangzhou Normal University, Hangzhou, China
- 2Department of Occupational and Environmental Health, School of Public Health, Hangzhou Normal University, Hangzhou, China
- 3Research on Accurate Diagnosis and Treatment of Tumor, School of Pharmacy, Hangzhou Normal University, Hangzhou, China
- 4Department of Nutrition and Toxicology, School of Public Health, Hangzhou Normal University, Hangzhou, China
Background: Patients with acute tubular necrosis (ATN) not only have severe renal failure, but also have many comorbidities, which can be life-threatening and require timely treatment. Identifying the influencing factors of ATN and taking appropriate interventions can effectively shorten the duration of the disease to reduce mortality and improve patient prognosis.
Methods: Mortality prediction models were constructed by using the random survival forest (RSF) algorithm and the Cox regression. Next, the performance of both models was assessed by the out-of-bag (OOB) error rate, the integrated brier score, the prediction error curve, and area under the curve (AUC) at 30, 60 and 90 days. Finally, the optimal prediction model was selected and the decision curve analysis and nomogram were established.
Results: RSF model was constructed under the optimal combination of parameters (mtry = 10, nodesize = 88). Vasopressors, international normalized ratio (INR)_min, chloride_max, base excess_min, bicarbonate_max, anion gap_min, and metastatic solid tumor were identified as risk factors that had strong influence on mortality in ATN patients. Uni-variate and multivariate regression analyses were used to establish the Cox regression model. Nor-epinephrine, vasopressors, INR_min, severe liver disease, and metastatic solid tumor were identified as important risk factors. The discrimination and calibration ability of both predictive models were demonstrated by the OOB error rate and the integrated brier score. However, the prediction error curve of Cox regression model was consistently lower than that of RSF model, indicating that Cox regression model was more stable and reliable. Then, Cox regression model was also more accurate in predicting mortality of ATN patients based on the AUC at different time points (30, 60 and 90 days). The analysis of decision curve analysis shows that the net benefit range of Cox regression model at different time points is large, indicating that the model has good clinical effectiveness. Finally, a nomogram predicting the risk of death was created based on Cox model.
Conclusion: The Cox regression model is superior to the RSF algorithm model in predicting mortality of patients with ATN. Moreover, the model has certain clinical utility, which can provide clinicians with some reference basis in the treatment of ATN and contribute to improve patient prognosis.
1 Background
Acute tubular necrosis (ATN) is the most common type of acute renal failure (accounting for approximately 70%–80%) (Zhou et al., 2010). It is a clinical syndrome caused by ischemia of renal tissue or necrosis of tubular epithelial cells due to toxic damage, and resulting in a dramatic decrease in the glomerular filtration rate (An et al., 2022). It is often manifested as progressive azotemia, electrolyte disturbance, acid-base balance disorder, and a host of other symptoms. ATN patients not only have severe renal failure, but also have many comorbidities, such as myocardial infarction, congestive heart failure, peptic ulcer disease, etc., which can be life-threatening and require timely treatment. ATN is associated with high mortality, especially for those patients in the intensive care unit (ICU) (Rosen and Stillman, 2008). Understanding the influencing factors of ATN and taking appropriate interventions can effectively shorten the duration of the disease to reduce mortality and improve patient prognosis. Previous studies have shown that pH, base excess, creatinine, and blood urea nitrogen (BUN) are common influencing factors of ATN (Liaño et al., 1989). However, other potential risk factors that may affect the prognosis of patients with ATN have not yet been identified. In recent years, the continuous development of medical information technology and the popularization of electronic medical record systems have generated a large quantity of data for prognostic model evaluation and other clinical applications.
Cox regression model is the most common semi-parametric regression model, which can analyze the influence of multiple factors on outcome events and carry out statistical analysis on data with censoring (Moolgavkar et al., 2018). This method improves the efficiency and reliability of survival analysis by considering multiple predictor variables simultaneously (Koletsi and Pandis, 2017). It has been widely used in medical research, such as evaluating the survival rate of cancer patients, the risk of heart failure, and the prognosis prediction of patients (Hippisley-Cox and Coupland, 2015; Tang M. et al., 2021; Wang et al., 2022). On the other hand, machine learning (ML) is a data-based algorithmic technology that automatically analyzes and learns patterns and regularities in data to predict and optimize future outcomes, and is a fast-growing area. ML technology has also been applied in many aspects of medical research, which is important for improving medical care and promoting human health (Noorbakhsh-Sabet et al., 2019; Issa et al., 2021). Random survival forest (RSF) is a comprehensive method of random forest and survival analysis, which processes right censored data. Different from the general binary classification method, the target variable of survival analysis method is survival time. By training a large number of survival trees, the model votes out the final prediction results weighted from individual trees in the form of voting. RSF is a ML algorithm based on decision tree (Yosefian et al., 2015), which has good prediction accuracy without over-fitting, and it is suitable for survival analysis of many diseases (Farhadian et al., 2021; Roshanaei et al., 2022). The most important feature of the RSF algorithm is that it can rank the importance of variables in order to filter out those that have a greater impact on outcome indicators (Adham et al., 2017; Wang and Zhou, 2017). Moreover, RSF can effectively deal with the problem of data imbalance, when there is classification imbalance, RSF can balance the data error. Currently, it has been used in the construction of prognostic models for many different diseases, such as heart failure, arrhythmia, multiple myeloma, etc. (Hsich et al., 2011; Miao et al., 2015; Morvan et al., 2020). In addition, several studies have compared the performance of RSF with the classical Cox regression model, while some have found that RSF is more accurate than Cox regression (Sloan et al., 2016; Ma et al., 2020; Tapak et al., 2020), others have reached the opposite conclusion (Qiu et al., 2020). Hitherto, there were no comparative studies of two models in the ATN based on large sample data. Therefore, this study aimed to investigate the prediction of mortality in ATN patients in the ICU and the associated influencing factors by using RSF algorithm and Cox regression method.
2 Materials and methods
2.1 Data source and study population
Medical Information Mart for Intensive Care IV (MIMIC-IV) is a large-scale public database containing clinical information of patients at Beth Israel Deaconess Medical Center between 2008 and 2019, which was established by the Massachusetts Institute of Technology and Beth Israel Deaconess Medical Center. In the MIMIC-IV database, the patients’ true identifying information is hidden, therefore, there is no need to obtain informed consent from patients. However, researchers are required to complete relevant training courses and receive certificate before accessing the database. Datasets were obtained from the Physionet official website (http://mimic.physionet.org/).
A total of 4,031 patients were diagnosed with ATN in the database. For this study, the inclusion criteria were: over 18 years old and admission to the ICU longer than 24 h. Exclusion criteria were: patients who died within 24 h of the ICU admission and patients with incomplete data. For patients with multiple ICU admissions, and only data from their first admission were taken. Ultimately, a total of 3,220 patients were enrolled in this study.
2.2 Data extraction
Datasets were extracted by using structured query language. Basic information of ATN patients included: age at admission, gender, ethnicity, weight, length of stay in ICU, etc. Treatment measures included: antibiotic use, vasopressors use, nor-epinephrine use, the use of continuous renal replacement therapy, etc. Related comorbidities included the following: myocardial infarction, congestive heart failure, peripheral vascular disease, chronic pulmonary disease, cerebrovascular disease, rheumatic disease, mild liver disease, peptic ulcer disease, paraplegia, malignant cancer, severe liver disease, metastatic solid tumor, etc. The first laboratory test results after ICU admission included: hemoglobin, white blood cells, base excess, pH, anion gap (AG), bicarbonate, international normalized ratio (INR), prothrombin time, urine output, arterial partial pressure of oxygen, creatinine, BUN, chloride, glucose, etc. Vital signs after ICU admission included: heart rate, respiratory rate, systolic blood pressure (SBP), diastolic blood pressure (DBP), body temperature, etc. Because of the high sampling frequency, the maximum, the minimum and the average values were used to represent vital signs and laboratory test results.
2.3 Model construction
Patients with ATN were randomly divided into the training set and validation set in an 8:2 ratio. The training set was used to construct RSF or Cox model and the validation set was used to evaluate the performance of the two predictive models. RSF model was constructed on the basis of optimal parameter combination. The out-of-bag (OOB) error rate under different parameter combination, which is calculated by grid search method, and it was used to determine the optimal parameter combination of the model (Wang et al., 2019). RSF algorithm has the ability to assess the importance of each variable that contributed to the outcome indicators. In this study, the minimum depth method was used to measure and rank the importance of each variable (Peng et al., 2016). On the other hand, uni-variate and multivariate regression analysis were carried out for the Cox regression model. All variables were first analyzed in the uni-variate Cox regression model, and those with p-values less than 0.05 were selected and subjected to multivariate Cox regression analysis.
2.4 Model comparison
The OOB error rate is equivalent to the value of 1-C index, which is used to evaluate the prediction ability of the model. The smaller the out-of-bag error rate is, the stronger the differentiation ability of the model is. Brier score is an evaluation index to evaluate different survival models and can represent the prediction accuracy of prediction models. Brier score can be viewed as a “calibrated” measure of a set of probabilistic predictions. The OOB error rate and the integrated Brier score were first calculated to determine the discrimination and calibration ability of the two models. The smaller the OOB error rate, the better the discrimination ability of the predictive model (Banerjee et al., 2012). The model is well calibrated when the Brier score is less than 0.25 (Mogensen et al., 2012). And the smaller the Brier score, the better the calibration of the model. Then, the prediction error curves of two models were plotted for judging the prediction performance. To further assess the prognostic ability of two models, 30-day, 60-day and 90-day dependent receiver operating characteristic (ROC) curves were plotted. A larger area under the curve (AUC) value indicates a stronger predictive ability of the model when the AUC values are greater than 0.5 (Bansal and Heagerty, 2018). To analyze the decision curve analysis (DCA) of the Cox model, 30-day, 60-day, and 90-day DCA were plotted. When the net benefit of DCA is large, it indicates that the clinical application value of the model is high (Vickers and Holland, 2021). The superior performance model was utilized to construct a nomogram as individual prediction tool for ATN mortality risk.
2.5 Statistical analysis
For descriptive variables, the median and quartile were superior to the means and standard deviation values in several statistical guides (Kattan and Vickers, 2020). Therefore, continuous variables were represented by using the median and quartile and were compared by Mann-Whitney U test. Categorical variables were expressed in terms of frequency or percentage and compared using Chi-square tests or Fisher’s exact tests. In this study, indicators with the missing degree greater than 20% were removed, and then the remaining missing data were filled with multipe interpolation method (Zhang et al., 2022). Since the presence of outliers reduces the accuracy of RSF algorithm, the outliers were first identified by using box-plots, then the outlier indicators that exceed 10% were removed and median replacement was performed on the remaining outlier data (Dutta et al., 2022). The software packages used in the data analysis and processing included: randomForestSRC, survival, ggRandomForests, timeROC, and ggplot2.
3 Results
3.1 Baseline characteristics
A total of 3,220 patients with ATN were included in this study, of which 2,457 patients survived and 763 patients died during hospitalization. Comparisons between two groups showed that there were significant differences in the age, weight, length of stay in ICU, vasopressors, mild liver disease, severe liver disease, metastatic solid tumors, AG_min, AG_max, bicarbonate_min, bicarbonate_max, chloride_min, chloride_max, creatinine_min, creatinine_max, base excess_min, base excess_max, temperature_min, temperature_mean, urine output, DBP_min, etc. There were no statistically significant differences in the variables including gender, myocardial infarction, peripheral vascular disease, paraplegia, rheumatic disease, peptic ulcer disease, glucose_min, glucose_max, etc. Other baseline characteristics were shown in Tables 1–3.

Table 1. General information of the patients.
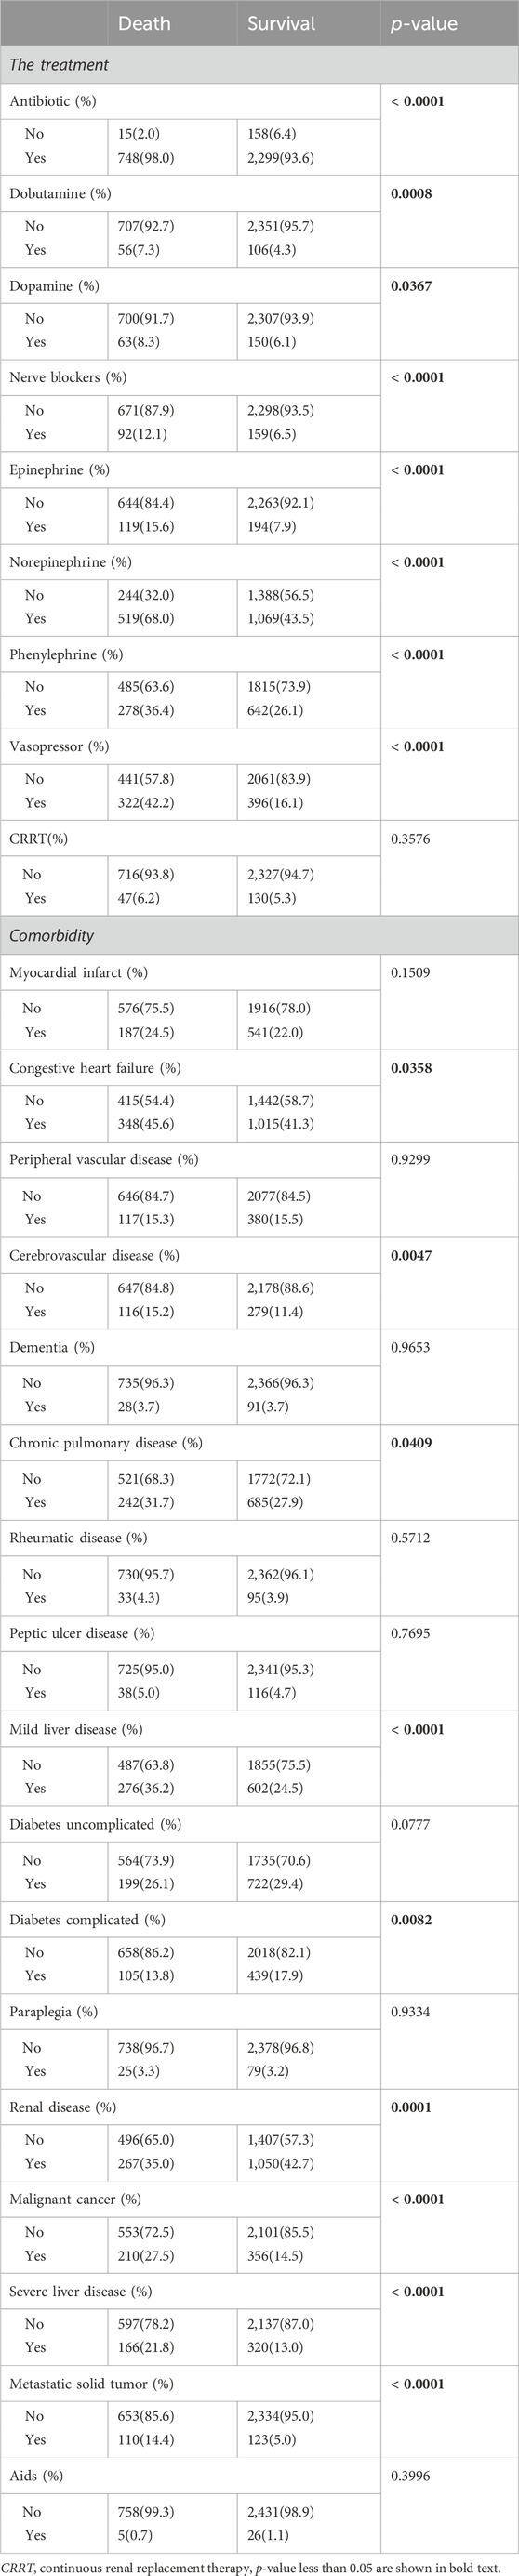
Table 2. The treatment and comorbidity of the patients.
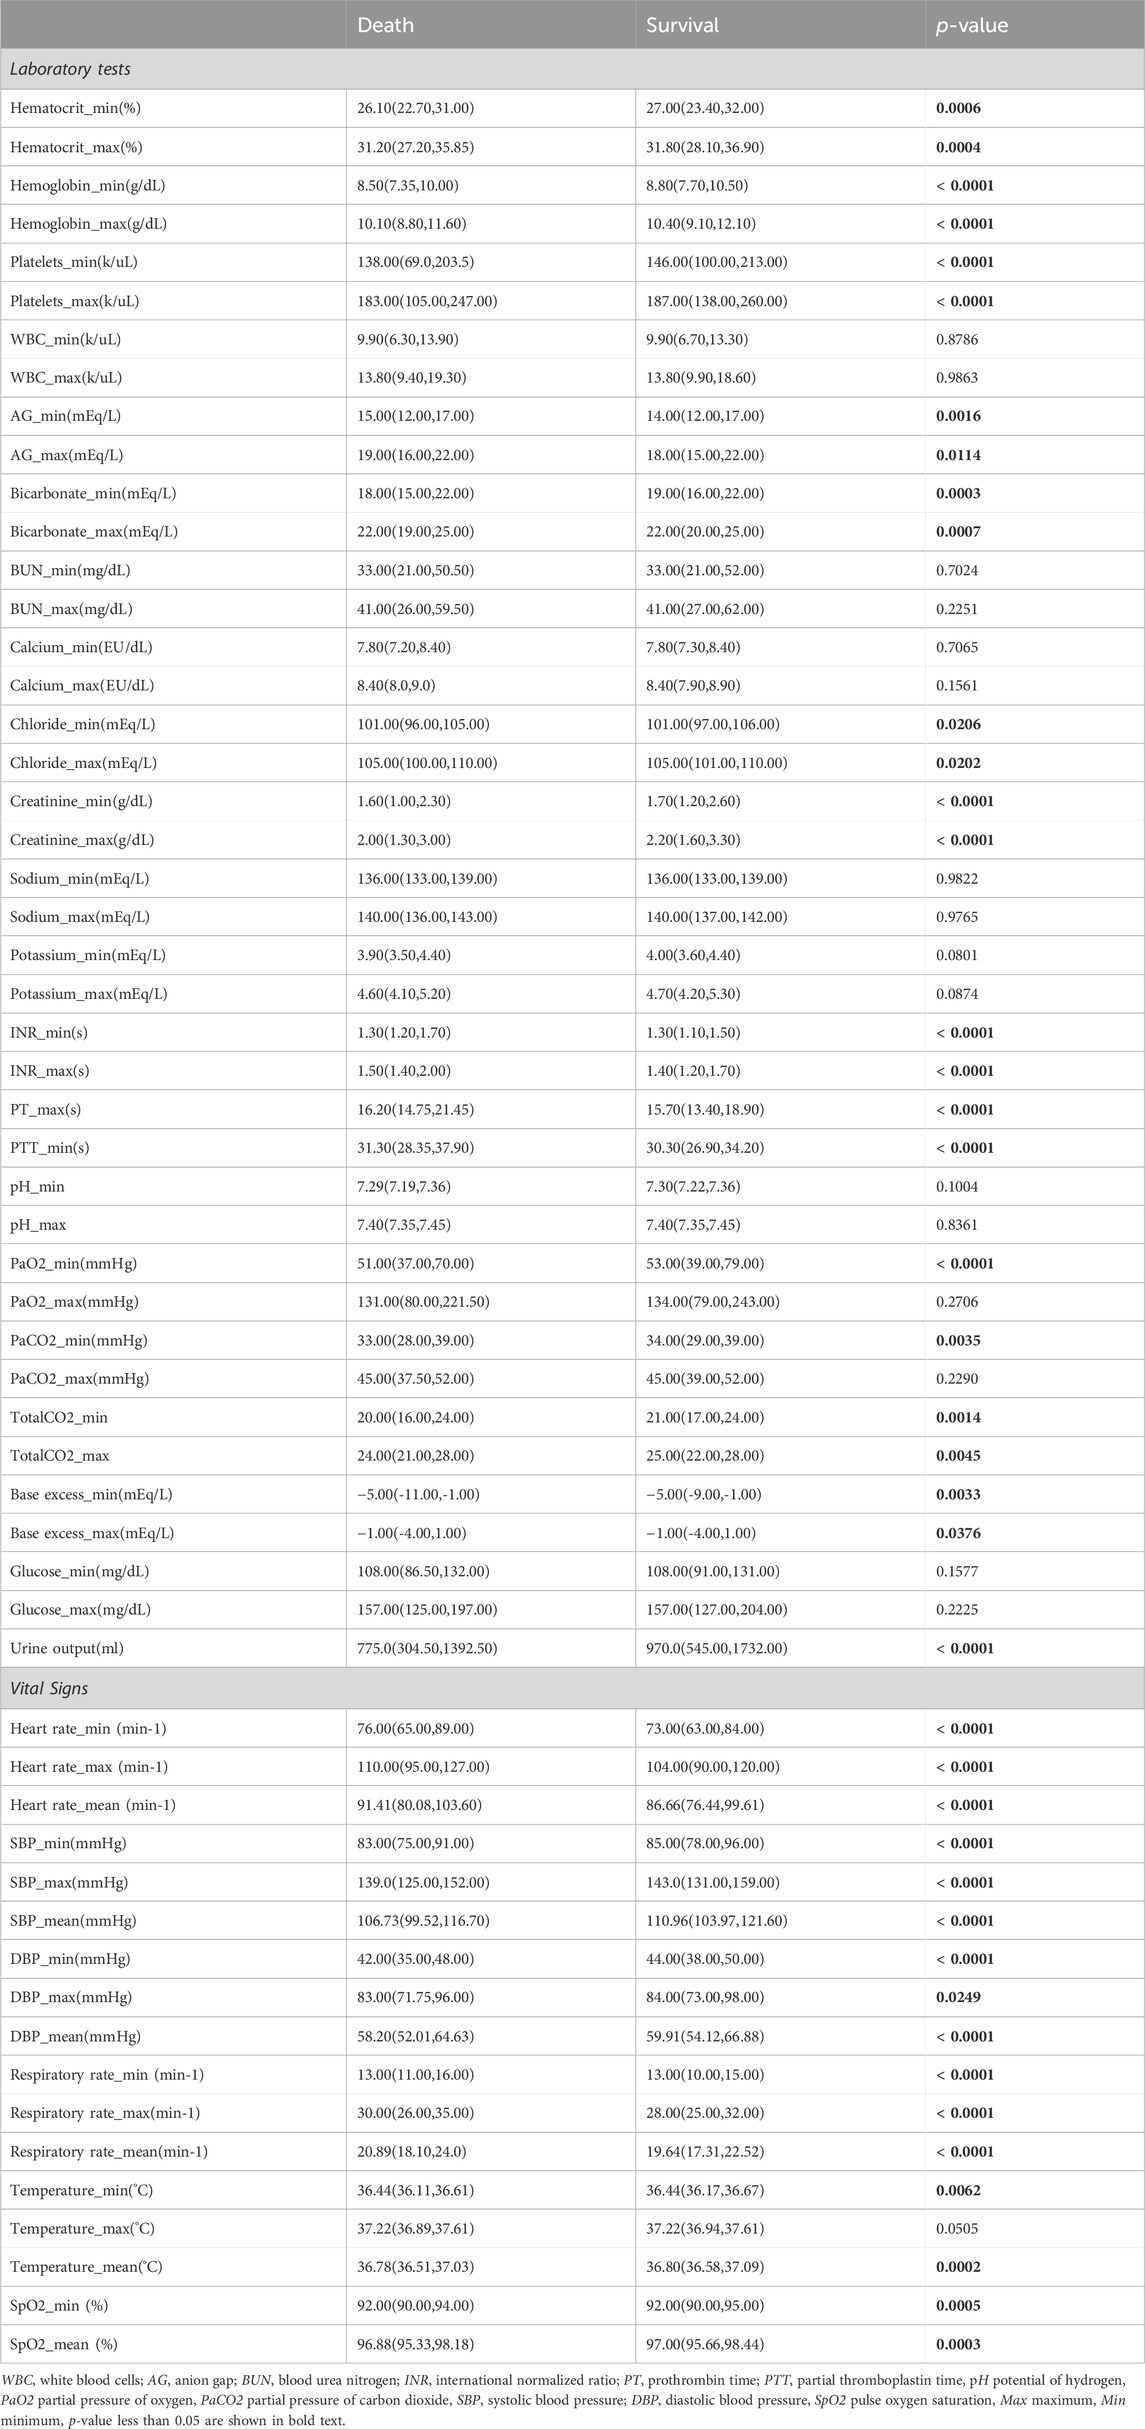
Table 3. Laboratory tests and vital signs of the patients.
3.2 Model construction
3.2.1 RSF model
The OOB error rates were calculated by grid search method under different combination of parameters. As shown in Figure 1, RSF model achieved the lowest OOB error rate (21.4%) under the parameter combination of mtry = 10 and nodesize = 88. Different shades of the same color indicate the level of OOB error rate, while a shift from yellow to purple indicates an increase in the OOB error rate. The lower the OOB error rate, the better the predictive ability of model (Lines et al., 2021). As shown in Figure 2, the OOB error rate of model stabilized when 500 survival trees were reached. As shown in Table 4, the variables were ranked in importance by using the minimum depth method. Vasopressors, age, length of stay in ICU, metastatic solid tumors, INR_min, respiratory rate_min, chloride_max, calcium_min, base excess_min, bicarbonate_max, AG_min, potassium_min, pH_max, bicarbonate_min, DBP_min were the top 15 variables, indicating that these variables have strong predictive ability and significant effect on the outcome.
Figure 1. Tuning parameter of the RSF model. The black sign in the figure is the parameter combination of mtry = 10 and nodesize = 88, and the corresponding OOB error rate is 21.4%.
Figure 2. Curve of the OOB error rate for RSF model. The OOB error rate drops from 0.258 to 0.214 and stabilizes at 500 survival trees.
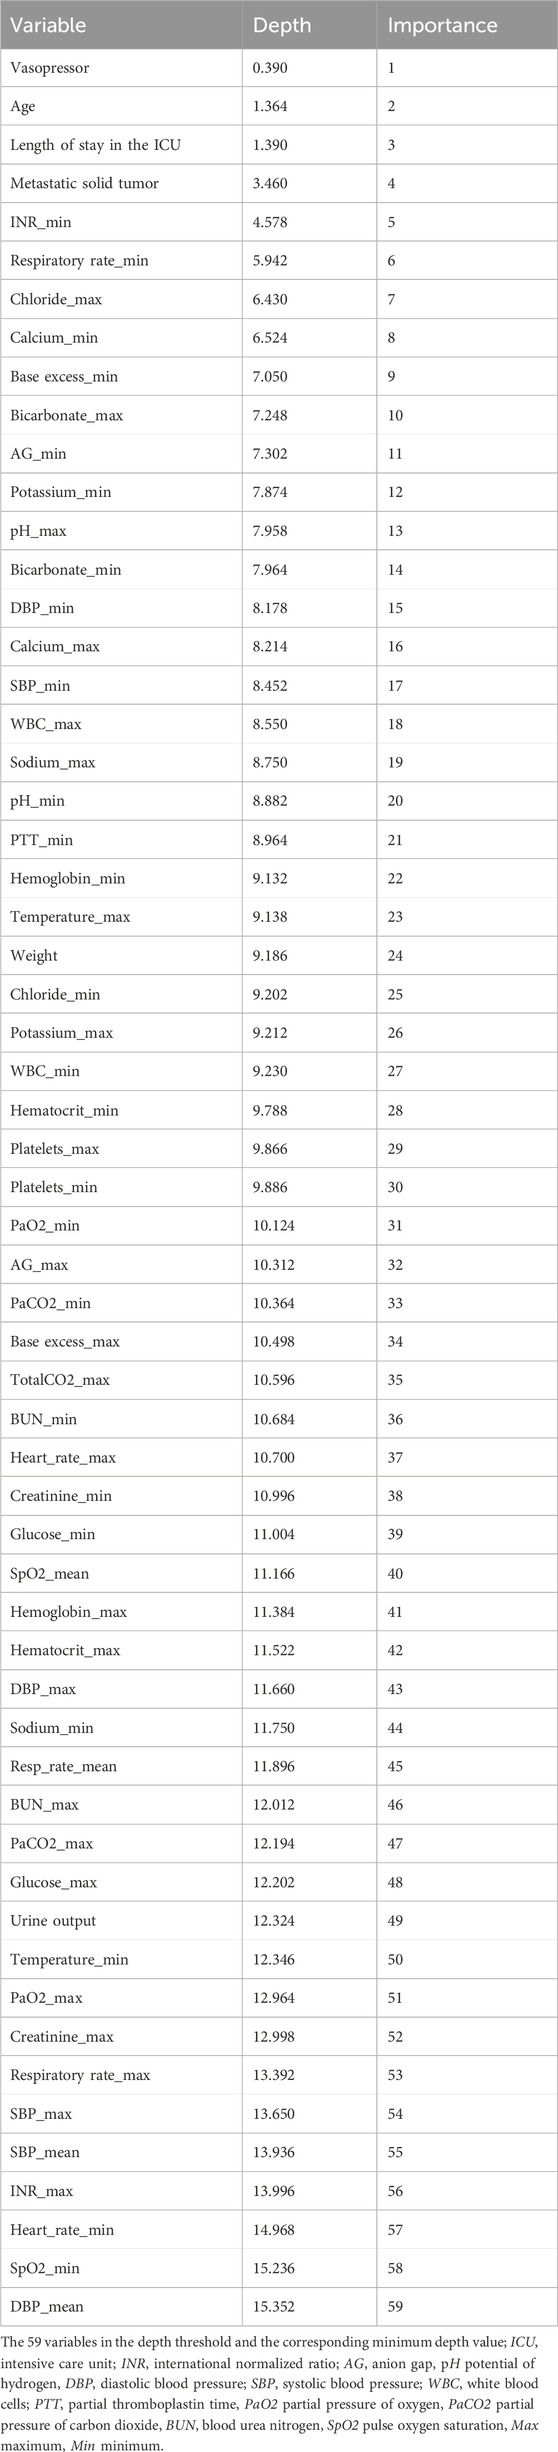
Table 4. Variable importance ranking for RSF.
3.2.2 Cox regression model
Uni-variate Cox regression analysis results revealed that variables included age, length of stay in ICU, dopamine, epinephrine, nor-epinephrine, vasopressors, AG_min, AG_max, bicarbonate_min, bicarbonate_max, INR_min, INR_max, pH_min, pH_max, base excess_min, base excess_max, urine output, SBP_min, SBP_max, SBP_mean, temperature_min, temperature_max, temperature_mean, cerebrovascular disease, chronic pulmonary disease, mild liver disease, severe liver disease, and metastatic solid tumors had p-value ≤0.05. These variables were included in the multivariate Cox regression model for analysis. Dopamine, epinephrine, nor-epinephrine, vasopressors, INR_min, cerebrovascular disease, chronic pulmonary disease, mild liver disease, severe liver disease, metastatic solid tumors were important risk factors that increased the risk of death in ATN patients. However, length of stay in ICU was protective factor. The shorter the stay, the lower the risk of death. Detailed information of Cox regression analysis was shown in Table 5.
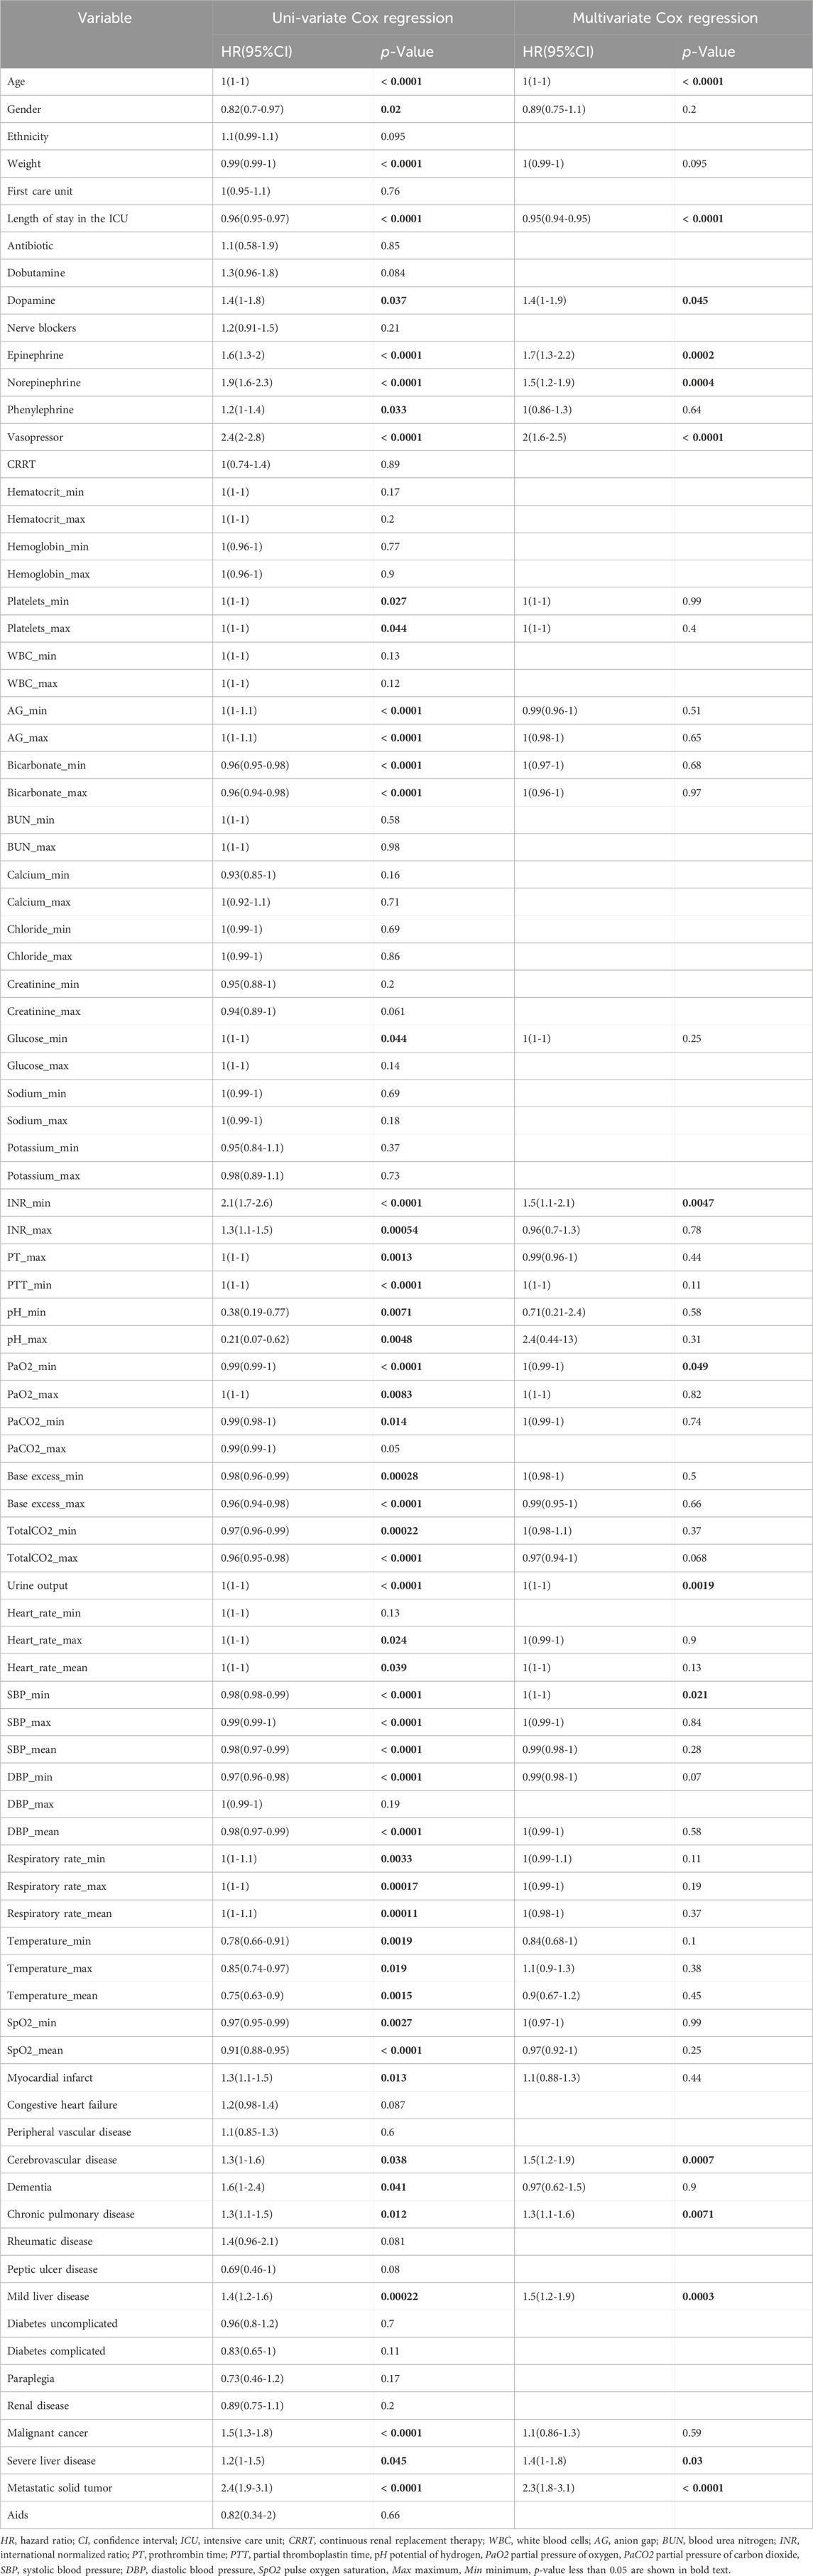
Table 5. Cox regression analysis results.
3.3 Model comparison
As shown in Table 6, the OOB error rates for RSF model and Cox regression model were 0.214 and 0.215. The OOB error rates for two models were small, indicating that both predictive models had good discrimination ability. The integrated Brier score of two models were 0.199 (RSF) and 0.154 (Cox), both of which were less than 0.25, suggesting that two models had good calibration ability. As shown in Figure 3, the prediction error curve of Cox regression model was lower than that of RSF model, indicating that Cox regression model was more stable and reliable. In the validation set, RSF model had AUC values of 0.788, 0.719, and 0.715 at 30, 60 and 90 days (Figure 4). Cox regression model had AUC values of 0.833, 0.736, and 0.732 at 30, 60 and 90 days (Figure 4). Thus, it appeared that Cox regression model was more accurate in predicting mortality of ATN patients. As shown in Figure 5, the net benefit of Cox model at different time points was large, indicating that the Cox model had high clinical practical value.
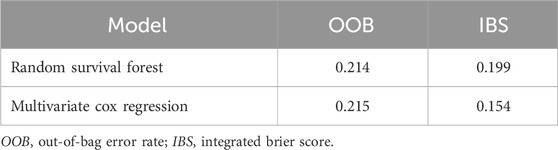
Table 6. Performance comparison of the two models.
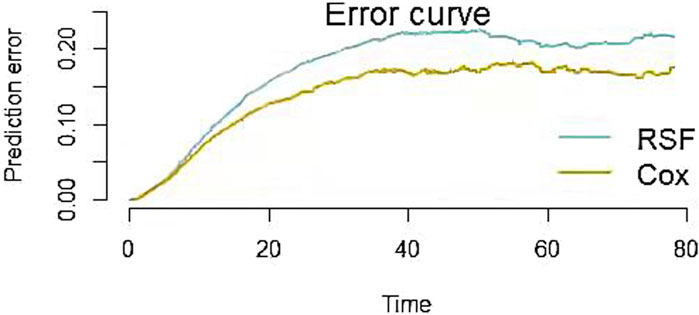
Figure 3. Prediction error curves for RSF and Cox models. The smaller the prediction error value, the more accurate the predictive power of the model.
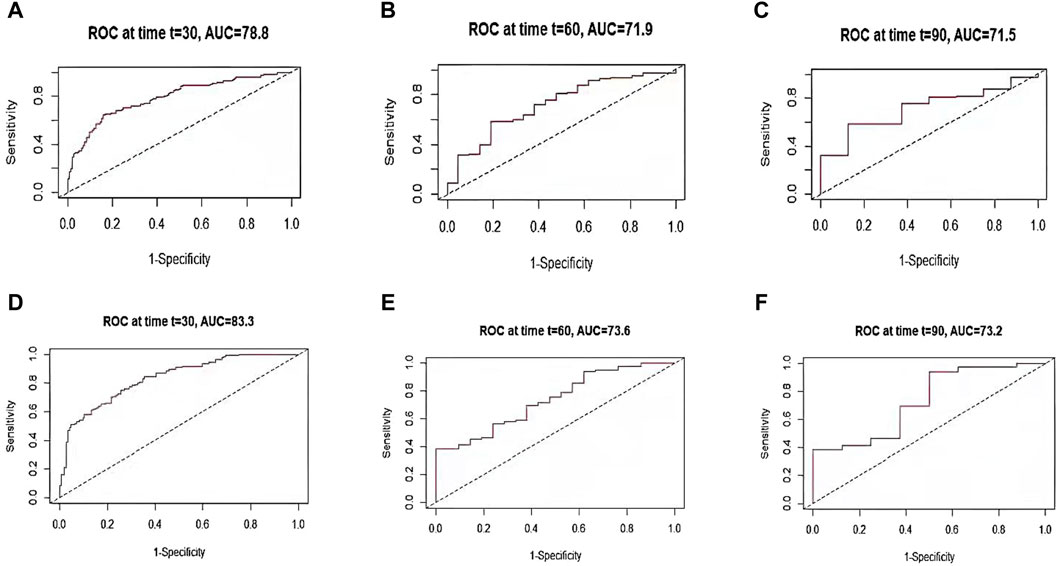
Figure 4. TdROC curve for RSF and Cox models. The AUC values for RSF model at 30-day (A), 60-day (B), and 90-day (C) are 0.788, 0.719, and 0.715, respectively; the AUC values for Cox regression model at 30-day (D), 60-day (E), and 90-day (F) are 0.833, 0.736, and 0.732, respectively.
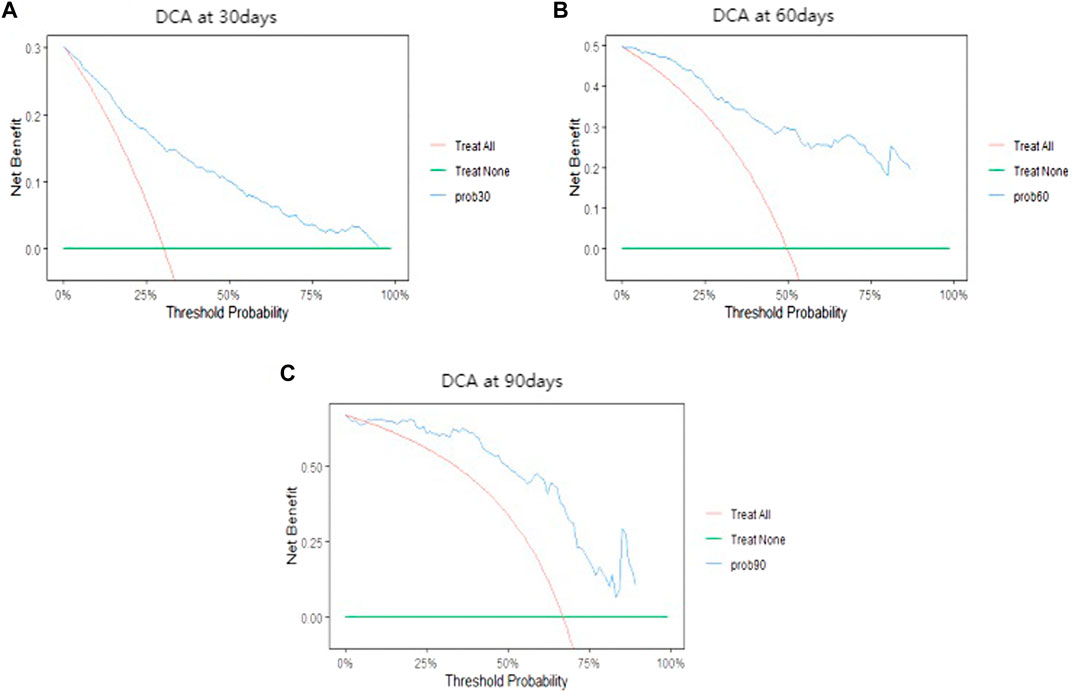
Figure 5. Decision curve analysis of the Cox model.
3.4 Nomogram for predicting risk of ATN mortality
Given that Cox model outperforms RSF model in the discrimination and calibration ability, a nomogram was constructed on the basis of Cox model to predict the probability of death at the individual level in ATN patients. The nomogram was constructed to predict 30-day, 60-day, and 90-day mortality risk based on 15 significant variables in the training set. In the nomogram, an individual score for each factor is obtained by projecting the value of each factor vertically onto the first row of “points”. For each participant, the total score was calculated by adding the scores for each factor. By projecting the total score vertically to the bottom, we can get a picture of the risk of death for ATN patients. Assuming a 68-year-old patient with ATN has a score of 82 for metastatic solid tumor, 83 for severe liver disease, and 87 for mild liver disease. Chronic pulmonary disease score was 84, cerebrovascular disease score was 82, SBP_min score was 83, urine output score was 83, and PaO2_min score was 82. INR_min score was 80, vasopressor score was 91, nor-epinephrine score was 86, epinephrine score was 88, dopamine score was 81, length of stay in the ICU score was 55, with an age score of 83 out of 1,230, the estimated risk of death at 30, 60, and 90 days was 15%, 37.6%, and 61.6% (Figure 6).
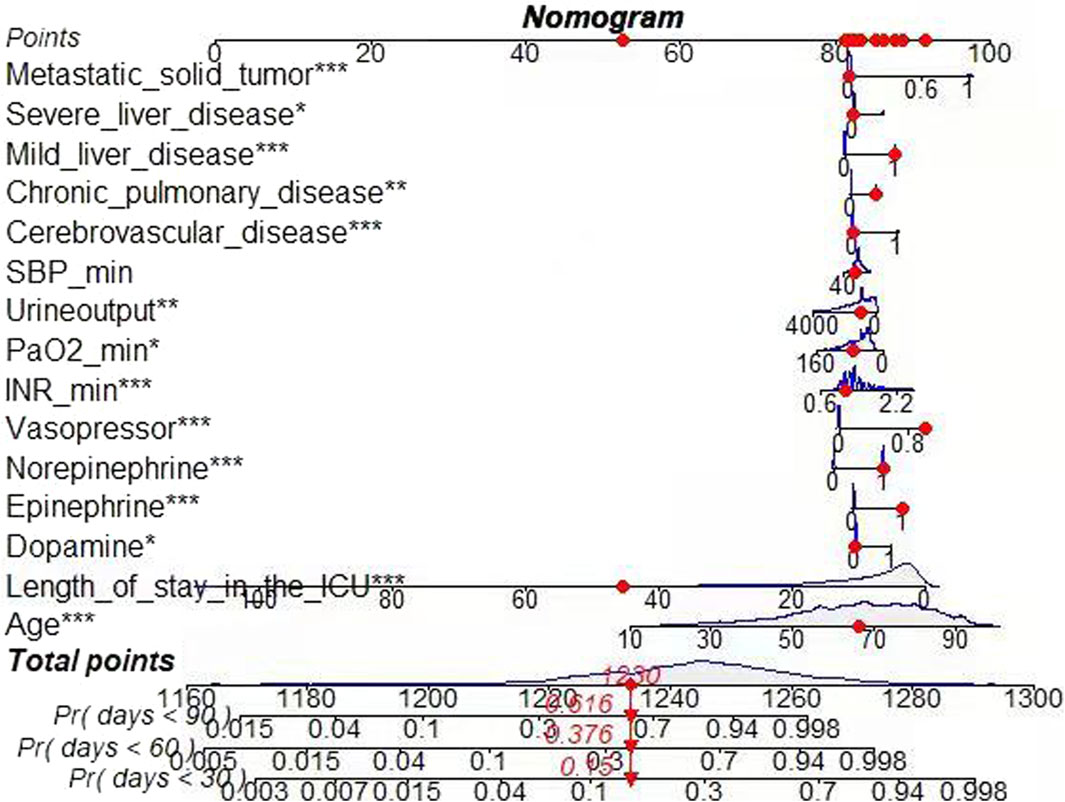
Figure 6. Nomogram for Cox regression model. Risk of death: 0.15 (30 days); 0.376 (60 days); 0.616 (90 days).
4 Discussion
ATN is one of the most common types of acute kidney injury, which seriously affects the quality of life and even threatens their lives, and it is characterized by high morbidity, high mortality and poor prognosis (Hoste et al., 2018). Therefore, it is important to identify the influencing factors for ATN, which can help screen those patients at high risk and receive proper treatment.
Although ML methods represented by RSF algorithm performed well in several fields, this does not mean that MLalgorithms have an absolute advantage over traditional methods. For example, Cuthbert et al. (Cuthbert et al., 2022) analyzed the prediction of 8-year revision risk following total knee and hip arthroplasty, and Tang X et al. (Tang X. et al., 2021) studied prognostic prediction in metastatic non-small cell lung cancer patients receiving EGFR-TKI osiertinib treatment, both studies have proved that traditional statistical methods have certain strengths. Nonetheless, RSF algorithm also has its own unique advantages. RSF algorithm can directly and quantitatively calculate the minimum depth of each variable to reflect the magnitude of importance, which facilitates the comparison among variables (Taylor, 2011). This is a feature which has not been found in the traditional Cox regression method. Therefore, it is better to construct predictive models by using several methods and compare them to identify the best ones.
Since Cox model outperforms RSF model, we constructed a nomogram based on the Cox model. The nomogram is a visualization tool used to generate the probability of clinical outcome (Park, 2018). Studies have demonstrated that nomogram enable accurate compared to traditional scoring systems (Wang et al., 2021). It is now widely used for risk prediction of many diseases (Li et al., 2021; Tan et al., 2022; Wang et al., 2023). Therefore, the creation of mortality risk nomogram based on the information about ATN patients can inform existing critical care assessment programs. Clinical staff can use the total score to predict the probability of death in ATN patients, thus assisting them in developing a more rational treatment plan.
In this study, two different models were constructed to explore the influencing factors of ATN. Cox regression analysis concluded that vasopressors, nor-epinephrine, INR_max, severe liver disease, and metastatic solid tumors were the important risk factors. RSF model concluded that vasopressors, INR_max, and metastatic solid tumors were the important influencing factors based on the importance rank of the variables. The influencing factors identified by two methods of analysis are basically similar, indicating that they are probably true factors associated with ATN.
Among the variables associated with predicting ATN patients, the most important ones are the AG, pH, base excess, BUN and bicarbonate, which can be used to determine whether patients have symptoms of acid-base imbalance, azotemia and electrolyte disturbances (Bellomo, 2011). Urine output is the most common factor affecting ATN. This is due to decreased urine output can cause hypovolemia, which increases the risk of death from the disease (Xu et al., 2020). Timely rehydration therapy can restore the circulating blood volume and improve the impaired renal perfusion function.
ATN is often associated with many comorbidities, and the presence of these comorbidities also increases the risk of death from ATN. Severe liver disease is a relatively common comorbidity in patients with ATN. Due to the presence of large amounts of peritoneal fluid in patients with severe hepatitis, it can lead to insufficient circulating blood volume and uneven distribution of intrarenal blood flow, which ultimately increases the probability of death in ATN (Chancharoenthana and Leelahavanichkul, 2019). In addition, metastatic solid tumors are the common comorbidity that increases the risk of death from this disease (Wu et al., 2020), and the main reason is that neutrophils in solid tumors can enhance cytotoxicity and lead to necrosis of renal tubular epithelial cells, thus reducing patient survival (Liao and Liaw, 2020).
Relevant studies have shown that certain drugs also increase the risk of death in ATN. For example, vasopressor drugs can increase glomerular perfusion pressure and urine output, thus affecting renal function (Shi and Wang, 2017). Nor-epinephrine can increase patients’ blood pressure and reduce renal blood flow, resulting in renal function impairment (Kim et al., 2021). INR is a preferred monitoring indicator for oral anticoagulants. Since overdose of anticoagulants increases the probability of death from ATN, the level of this indicator also reflects the risk of death occurring from ATN (Lim and Campbell, 2013).
However, the association between these drugs and disease needs further study. Because machine learning is one of the main methods of drug knowledge discovery. In the follow-up study, we plan to use machine learning, text mining and other technical methods to mine the process of drug tacit knowledge contained in the data, so as to explore whether there is a potential association between drugs and some biomedical entities, such as drug-disease association, and the association between drugs and side effects, etc.
The main advantage of this study is that it was the first to use the RSF algorithm and the Cox regression method to predict hospital mortality of patients with ATN from the MIMIC-IV database. Cox regression model has improved accuracy and precision compared to RSF model. This study also has some limitations: firstly, it is a single-center study and lacks external validation. Secondly, this was a retrospective observational study in which the majority of patients were white, and there may have been unobserved confounding factors that could have influenced the outcome. Finally, although the predictive ability of Cox regression model in this study is superior toRSF model, ML algorithms are evolving rapidly and new algorithms are constantly proposed, and further comparative studies are needed in practical applications.
5 Conclusion
Cox regression model is superior to RSF algorithm model in predicting mortality of patients with ATN. Vasopressors, nor-epinephrine, INR_min, and metastatic solid tumors were imporant factors that also significantly influence prognosis. Therefore, the mortality risk nomogram based on information about ATN patients can inform existing critical care assessment programs. Moreover, the model has certain clinical utility, which can provide clinicians with some reference basis in the treatment of ATN and contribute to improve patient prognosis.
Data availability statement
The datasets presented in this study can be found in online repositories. The names of the repository/repositories and accession number(s) can be found below: https://physionet.org/content/mimiciv/1.0/.
Ethics statement
The studies involving humans were approved by this study was conducted in accordance with the Declaration of Helsinki. The studies were conducted in accordance with the local legislation and institutional requirements. The ethics committee/institutional review board waived the requirement of written informed consent for participation from the participants or the participants’ legal guardians/next of kin because this study was conducted in accordance with the Declaration of Helsinki. Institutional review board approval and informed consent were not required in current study because MIMIC-IV research data is publicly available and all patient data are de-identified. Informed consent of all subjects and/or their legal guardians was obtained when MIMIC-IV was established.
Author contributions
JZ: Conceptualization, Data curation, Formal Analysis, Methodology, Software, Writing–original draft. MZ: Data curation, Formal Analysis, Investigation, Validation, Writing–review and editing. JD: Investigation, Validation, Writing–review and editing. JH: Investigation, Writing–review and editing. QS: Project administration, Writing–review and editing. TD: Visualization, Writing–review and editing. JY: Supervision, Writing–review and editing. YW: Supervision, Writing–review and editing.
Funding
The author(s) declare financial support was received for the research, authorship, and/or publication of this article. This study was supported in part by grants from the National Natural Science Foundation of China (No. 32270186) and the Huadong Medicine Joint Funds of the Zhejiang Provincail Natural Science Foundation (No. LHDMZ24H040001).
Conflict of interest
The authors declare that the research was conducted in the absence of any commercial or financial relationships that could be construed as a potential conflict of interest.
Publisher’s note
All claims expressed in this article are solely those of the authors and do not necessarily represent those of their affiliated organizations, or those of the publisher, the editors and the reviewers. Any product that may be evaluated in this article, or claim that may be made by its manufacturer, is not guaranteed or endorsed by the publisher.
References
Adham, D., Abbasgholizadeh, N., and Abazari, M. (2017). Prognostic factors for survival in patients with gastric cancer using a random survival forest. Asian Pac J. Cancer Prev. 18 (1), 129–134. doi:10.22034/APJCP.2017.18.1.129
An, Y., Liang, J., and Liu, Z. H. (2022). The value of glomerular filtration rate slope change as a renal replacement endpoint in clinical trials. J. Nephrol. Dialysis Ren. Transplant. 31 (6), 556–560. doi:10.3969/j.issn.1006-298X.2022.06.012
Banerjee, M., Ding, Y., and Noone, A. M. (2012). Identifying representative trees from ensembles. Stat. Med. 31 (15), 1601–1616. doi:10.1002/sim.4492
Bansal, A., and Heagerty, P. J. (2018). A tutorial on evaluating the time-varying discrimination accuracy of survival models used in dynamic decision making. Med. Decis. Mak. 38 (8), 904–916. doi:10.1177/0272989X18801312
Bellomo, R. (2011). Acute renal failure. Semin. Respir. Crit. Care Med. 32 (5), 639–650. doi:10.1055/s-0031-1287872
Chancharoenthana, W., and Leelahavanichkul, A. (2019). Acute kidney injury spectrum in patients with chronic liver disease: where do we stand? World J. Gastroenterol. 25 (28), 3684–3703. doi:10.3748/wjg.v25.i28.3684
Cuthbert, A. R., Giles, L. C., Glonek, G., Kalisch Ellett, L. M., and Pratt, N. L. (2022). A comparison of survival models for prediction of eight-year revision risk following total knee and hip arthroplasty. BMC Med. Res. Methodol. 22 (1), 164. doi:10.1186/s12874-022-01644-3
Dutta, A., Hasan, M. K., Ahmad, M., Awal, M. A., Islam, M. A., Masud, M., et al. (2022). Early prediction of diabetes using an ensemble of machine learning models. Int. J. Environ. Res. Public Health 19 (19), 12378. doi:10.3390/ijerph191912378
Farhadian, M., Dehdar Karsidani, S., Mozayanimonfared, A., and Mahjub, H. (2021). Risk factors associated with major adverse cardiac and cerebrovascular events following percutaneous coronary intervention: a 10-year follow-up comparing random survival forest and Cox proportional-hazards model. BMC Cardiovasc Disord. 21 (1), 38. doi:10.1186/s12872-020-01834-1
Hippisley-Cox, J., and Coupland, C. (2015). Development and validation of risk prediction equations to estimate future risk of heart failure in patients with diabetes: a prospective cohort study. BMJ Open 5 (9), e008503. doi:10.1136/bmjopen-2015-008503
Hoste, E. A. J., Kellum, J. A., Selby, N. M., Zarbock, A., Palevsky, P. M., Bagshaw, S. M., et al. (2018). Global epidemiology and outcomes of acute kidney injury. Nat. Rev. Nephrol. 14 (10), 607–625. doi:10.1038/s41581-018-0052-0
Hsich, E., Gorodeski, E. Z., Blackstone, E. H., Ishwaran, H., and Lauer, M. S. (2011). Identifying important risk factors for survival in patient with systolic heart failure using random survival forests. Circulation Cardiovasc. Qual. Outcomes 4 (1), 39–45. doi:10.1161/CIRCOUTCOMES.110.939371
Issa, N. T., Stathias, V., Schürer, S., and Dakshanamurthy, S. (2021). Machine and deep learning approaches for cancer drug repurposing. Semin. Cancer Biol. 68, 132–142. doi:10.1016/j.semcancer.2019.12.011
Kattan, M. W., and Vickers, A. J. (2020). Statistical analysis and reporting guidelines for CHEST. Chest 158 (1), S3–S11. doi:10.1016/j.chest.2019.10.064
Kim, N. Y., Chae, D. W., Betal, K., Park, K., and Kim, S. Y. (2021). Development of a risk scoring system for predicting acute kidney injury after minimally invasive partial and radical nephrectomy: a retrospective study. Surg. Endosc. 35 (4), 1626–1635. doi:10.1007/s00464-020-07545-0
Koletsi, D., and Pandis, N. (2017). Survival analysis, part 3: Cox regression. Am. J. Orthod. Dentofac. Orthop. 152 (5), 722–723. doi:10.1016/j.ajodo.2017.07.009
Li, S., Zhao, Z., Yang, H., Wang, D., Sun, W., Li, S., et al. (2021). Construction and validation of a nomogram for the preoperative prediction of lymph node metastasis in gastric cancer. Cancer Control. 28, 10732748211027160. doi:10.1177/10732748211027160
Liaño, F., García-Martín, F., Gallego, A., Orte, L., Teruel, J. L., Marcén, R., et al. (1989). Easy and early prognosis in acute tubular necrosis: a forward analysis of 228 cases. Nephron 51 (3), 307–313. doi:10.1159/000185314
Liao, T. Y., and Liaw, C. C. (2020). Retrospective analysis of mortality cases in advanced and metastatic solid tumors with concurrent prerenal azotemia. Vivo 34 (3), 1515–1519. doi:10.21873/invivo.11939
Lim, A. K., and Campbell, D. A. (2013). Haematuria and acute kidney injury in elderly patients admitted to hospital with supratherapeutic warfarin anticoagulation. Int. Urol. Nephrol. 45 (2), 561–570. doi:10.1007/s11255-012-0364-0
Lines, L. M., Cohen, J., Kirschner, J., Halpern, M. T., Kent, E. E., Mollica, M. A., et al. (2021). Random survival forests using linked data to measure illness burden among individuals before or after a cancer diagnosis: development and internal validation of the SEER-CAHPS illness burden index. Int. J. Med. Inf. 145, 104305. doi:10.1016/j.ijmedinf.2020.104305
Ma, B., Geng, Y., Meng, F., Yan, G., and Song, F. (2020). Identification of a sixteen-gene prognostic biomarker for lung adenocarcinoma using a machine learning method. J. Cancer 11 (5), 1288–1298. doi:10.7150/jca.34585
Miao, F., Cai, Y. P., Zhang, Y. X., Li, Y., and Zhang, Y. T. (2015). Risk prediction of one-year mortality in patients with cardiac arrhythmias using random survival forest. Comput. Math. Methods Med. 2015, 303250. doi:10.1155/2015/303250
Mogensen, U. B., Ishwaran, H., and Gerds, T. A. (2012). Evaluating random forests for survival analysis using prediction error curves. J. Stat. Softw. 50 (11), 1–23. doi:10.18637/jss.v050.i11
Moolgavkar, S. H., Chang, E. T., Watson, H. N., and Lau, E. C. (2018). An assessment of the Cox proportional hazards regression model for epidemiologic studies. Risk Anal. 38 (4), 777–794. doi:10.1111/risa.12865
Morvan, L., Carlier, T., Jamet, B., Bailly, C., Bodet-Milin, C., Moreau, P., et al. (2020). Leveraging RSF and PET images for prognosis of multiple myeloma at diagnosis. Int. J. Comput. Assist. Radiol. Surg. 15 (1), 129–139. doi:10.1007/s11548-019-02015-y
Noorbakhsh-Sabet, N., Zand, R., Zhang, Y., and Abedi, V. (2019). Artificial intelligence transforms the future of health care. Am. J. Med. 132 (7), 795–801. doi:10.1016/j.amjmed.2019.01.017
Park, S. Y. (2018). Nomogram: an analogue tool to deliver digital knowledge. J. Thorac. Cardiovasc Surg. 155 (4), 1793. doi:10.1016/j.jtcvs.2017.12.107
Peng, H. X., Lin, K., He, B. S., Pan, Y. Q., Ying, H. Q., Hu, X. X., et al. (2016). Platelet-to-lymphocyte ratio could be a promising prognostic biomarker for survival of colorectal cancer: a systematic review and meta-analysis. FEBS Open Bio 6 (7), 742–750. doi:10.1002/2211-5463.12083
Qiu, X., Gao, J., Yang, J., Hu, J., Hu, W., Kong, L., et al. (2020). A comparison study of machine learning (random survival forest) and classic statistic (Cox proportional hazards) for predicting progression in high-grade glioma after proton and carbon ion radiotherapy. Front. Oncol. 10, 551420. doi:10.3389/fonc.2020.551420
Rosen, S., and Stillman, I. E. (2008). Acute tubular necrosis is a syndrome of physiologic and pathologic dissociation. J. Am. Soc. Nephrol. 19 (5), 871–875. doi:10.1681/ASN.2007080913
Roshanaei, G., Safari, M., Faradmal, J., Abbasi, M., and Khazaei, S. (2022). Factors affecting the survival of patients with colorectal cancer using random survival forest. J. Gastrointest. Cancer 53 (1), 64–71. doi:10.1007/s12029-020-00544-3
Shi, Q., and Wang, G. Q. (2017). Risk factors of acute renal function injury in severe patients with complex abdominal infection. Mod. Med. Hyg. 33 (24), 3714–3716. doi:10.3969/j.issn.1009-5519.2017.24.007
Sloan, R. A., Haaland, B. A., Sawada, S. S., Lee, I. M., Sui, X., Lee, D. C., et al. (2016). A fit-fat index for predicting incident diabetes in apparently healthy men: a prospective cohort study. PLoS One 11 (6), e0157703. doi:10.1371/journal.pone.0157703
Tan, P. Y., Huo, M., Zhou, X. H., and Zhao, B. L. (2022). Development and validation of a nomogram for predicting the risk of nursing home-acquired pneumonia. Eur. Rev. Med. Pharmacol. Sci. 26 (22), 8276–8288. doi:10.26355/eurrev_202211_30360
Tang, M., Wang, H., Cao, Y., Zeng, Z., Shan, X., and Wang, L. (2021a). Nomogram for predicting occurrence and prognosis of liver metastasis in colorectal cancer: a population-based study. Int. J. Colorectal Dis. 36 (2), 271–282. doi:10.1007/s00384-020-03722-8
Tang, X., Li, Y., Yan, W. F., Qian, W. L., Pang, T., Gong, Y. L., et al. (2021b). Machine learning-based CT radiomics analysis for prognostic prediction in metastatic non-small cell lung cancer patients with EGFR-t790m mutation receiving third-generation EGFR-TKI osimertinib treatment. Front. Oncol. 11, 719919. doi:10.3389/fonc.2021.719919
Tapak, L., Sheikh, V., Jenabi, E., and Khazaei, S. (2020). Predictors of mortality among hemodialysis patients in Hamadan province using random survival forests. J. Prev. Med. Hyg. 61 (3), E482-E488–E488. doi:10.15167/2421-4248/jpmh2020.61.3.1421
Taylor, J. M. (2011). Random survival forests. J. Thorac. Oncol. 6 (12), 1974–1975. doi:10.1097/JTO.0b013e318233d835
Vickers, A. J., and Holland, F. (2021). Decision curve analysis to evaluate the clinical benefit of prediction models. Spine J. 21 (10), 1643–1648. doi:10.1016/j.spinee.2021.02.024
Wang, H., Ou, Y., Fan, T., Zhao, J., Kang, M., Dong, R., et al. (2021). Development and internal validation of a nomogram to predict mortality during the ICU stay of thoracic fracture patients without neurological compromise: an analysis of the MIMIC-III clinical database. Front. Public Health 9, 818439. doi:10.3389/fpubh.2021.818439
Wang, H., and Zhou, L. (2017). Random survival forest with space extensions for censored data. Artif. Intell. Med. 79, 52–61. doi:10.1016/j.artmed.2017.06.005
Wang, J., Tang, J., Chen, T., Yue, S., Fu, W., Xie, Z., et al. (2022). A web-based prediction model for overall survival of elderly patients with early renal cell carcinoma: a population-based study. J. Transl. Med. 20 (1), 90. doi:10.1186/s12967-022-03287-w
Wang, X., Gong, G., Li, N., and Qiu, S. (2019). Detection analysis of epileptic EEG using a novel random forest model combined with grid search optimization. Front. Hum. Neurosci. 13, 52. doi:10.3389/fnhum.2019.00052
Wang, Y., Zhang, Y., Ni, B., Jiang, Y., and Ouyang, Y. (2023). Development and validation of a depression risk prediction nomogram for US Adults with hypertension, based on NHANES 2007-2018. PLoS One 18 (4), e0284113. doi:10.1371/journal.pone.0284113
Wu, Y., Hao, W., Chen, Y., Chen, Y., Chen, S., Liu, W., et al. (2020). Clinical features, risk factors and clinical burden of acute kidney injury in older adults. Ren. Fail 42 (1), 1127–1134. doi:10.1080/0886022X.2020.1843491
Xu, L. B., Zhu, L. G., Liu, G. P., and Yu, L. (2020). A retrospective study of acute kidney injury in elderly patients in Inner Mongolia. Chin. J. Integr. Traditional West. Nephrop. 21 (10), 871–874. doi:10.3969/j.issn.1009-587X.2020.10.007
Yosefian, I., Farkhani, E. M., and Baneshi, M. R. (2015). Application of random forest survival models to increase generalizability of decision trees: a case study in acute myocardial infarction. Comput. Math. Methods Med. 2015, 576413. doi:10.1155/2015/576413
Zhang, L., Huang, T., Xu, F., Li, S., Zheng, S., Lyu, J., et al. (2022). Prediction of prognosis in elderly patients with sepsis based on machine learning (random survival forest). BMC Emerg. Med. 22 (1), 26. doi:10.1186/s12873-022-00582-z
Zhou, Q., Sheng, Y. H., Zhang, T., and Zhang, Z. A. (2010). The role of chemical mediators in acute tubular necrosis. Med. Rev. 16 (5), 653–655. doi:10.3969/j.issn.1006-2084.2010.05.005
Glossary
Keywords: acute tubular necrosis, random survival forest, cox regression, nomogram, risk factors
Citation: Zeng J, Zhang M, Du J, Han J, Song Q, Duan T, Yang J and Wu Y (2024) Mortality prediction and influencing factors for intensive care unit patients with acute tubular necrosis: random survival forest and cox regression analysis. Front. Pharmacol. 15:1361923. doi: 10.3389/fphar.2024.1361923
Received: 27 December 2023; Accepted: 22 April 2024;
Published: 23 May 2024.
Edited by:
Norberto Perico, Mario Negri Institute for Pharmacological Research (IRCCS), ItalyReviewed by:
Karim Abbasi, Sharif University of Technology, IranHaoran Zhang, Peking Union Medical College Hospital (CAMS), China
Copyright © 2024 Zeng, Zhang, Du, Han, Song, Duan, Yang and Wu. This is an open-access article distributed under the terms of the Creative Commons Attribution License (CC BY). The use, distribution or reproduction in other forums is permitted, provided the original author(s) and the copyright owner(s) are credited and that the original publication in this journal is cited, in accordance with accepted academic practice. No use, distribution or reproduction is permitted which does not comply with these terms.
*Correspondence: Jun Yang, Z2FzdGF0ZUB6anUuZWR1LmNu; Yinyin Wu, MjAxMTAxMDZAaHpudS5lZHUuY24=
†These authors have contributed equally to this work and share first authorship
‡These authors have contributed equally to this work and share last authorship